- 1Department of Biomedical Engineering, Lund University, Lund, Sweden
- 2Department of Systems and Data Analysis, Fraunhofer-Chalmers Centre, Gothenburg, Sweden
- 3Department of Cardiology, Clinical Sciences, Lund University, Lund, Sweden
- 4Department of Internal Medicine and Department of Clinical Physiology, Central Hospital Kristianstad, Kristianstad, Sweden
The response to atrial fibrillation (AF) treatment is differing widely among patients, and a better understanding of the factors that contribute to these differences is needed. One important factor may be differences in the autonomic nervous system (ANS) activity. The atrioventricular (AV) node plays an important role during AF in modulating heart rate. To study the effect of the ANS-induced activity on the AV nodal function in AF, mathematical modelling is a valuable tool. In this study, we present an extended AV node model that incorporates changes in autonomic tone. The extension was guided by a distribution-based sensitivity analysis and incorporates the ANS-induced changes in the refractoriness and conduction delay. Simulated RR series from the extended model driven by atrial impulse series obtained from clinical tilt test data were qualitatively evaluated against clinical RR series in terms of heart rate, RR series variability and RR series irregularity. The changes to the RR series characteristics during head-down tilt were replicated by a 10% decrease in conduction delay, while the changes during head-up tilt were replicated by a 5% decrease in the refractory period and a 10% decrease in the conduction delay. We demonstrate that the model extension is needed to replicate ANS-induced changes during tilt, indicating that the changes in RR series characteristics could not be explained by changes in atrial activity alone.
1 Introduction
Atrial fibrillation (AF) is the most common supraventricular tachyarrhythmia (Hindricks et al., 2020). Characteristic for AF is an increased and irregular atrial activity that results in a rapid and irregular ventricular activation. Atrial fibrillation is linked to substantial morbidity and mortality, and is a significant burden to patients, physicians, and healthcare systems globally. Two main strategies of AF treatments are rate control and rhythm control. Rate control is one of the corner stones of AF management, however the effect of individual rate-control drugs are difficult to predict in advance. This is why the choice of a rate-control drug today remains empiric and driven largely by their safety profile and contraindications rather than predicted efficacy. Therefore, the complex mechanisms of AF have to be better understood to personalize the treatment and reduce the burden of AF on the healthcare system.
It has been shown that the autonomic nervous system (ANS) is contributing to the initiation and maintenance of AF (Shen and Zipes, 2014). Either a predominance in sympathetic or in parasympathetic modulation has been observed to initiate an episode of paroxysmal atrial fibrillation (PAF); and in some patients, both the sympatho-vagal and vagal predominances have been observed to initiate PAF episodes (Lombardi et al., 2004). Hence, differences in the ANS activity among patients may be an important factor behind the inter-patient differences in response to treatment. To investigate the ANS-induced changes to the pathophysiology of AF, the effect of the ANS has to be quantified. One common method to quantify the autonomic tone during normal sinus rhythm (NSR) is by heart rate variability (HRV) (Sassi et al., 2015). In sinus rhythm, HRV can be used to obtain information about the function of the sinoatrial (SA) node. This information is valuable for the quantification of the autonomic tone, because the SA node is densely innervated by the ANS (Shen and Zipes, 2014; George et al., 2017). In AF, however, HRV cannot be used to quantify the autonomic tone, because the heart beats are not initiated in the SA node.
Instead, the ventricular rhythm during AF is determined by the atrial electrical activity and the subsequent AV nodal modulation. Since the AV node is densely innervated by the ANS, characterizing the AV nodal behavior during AF may give valuable information about the autonomic tone. Results from previous studies suggest that the heart rate, as well as the heart rate variability, quantified by RR rmssd, and heart rate irregularity, quantified by RR sample entropy, are affected by β-blocker induced changes in sympathetic response (Corino et al., 2015). We hypothesize that such changes in the heart rate and its variability and irregularity reflect ANS-induced changes in the AV node. The ANS-induced changes on the cardiac electrophysiology can be studied using head-up and head-down tilt test, which in a previous study was shown to affect electrophysiological properties of atrial myocardium during AF (Östenson et al., 2017). It is unclear if the changes in the heart rate and its variability and irregularity are explained by the changes in the atrial electrophysiology alone or also by changes in the AV nodal properties. Investigating how the ANS is modulating the heart rate during AF is a complex task and requires a model based analysis.
Previously, several AV node models have been proposed that incorporate important characteristics of the AV nodal structure and electrophysiology in their design. Characteristic for the AV node is its dual-pathway physiology enabling a parallel excitation propagation of impulses with different electrophysiological properties (George et al., 2017). For example, the slow pathway (SP) has a longer conduction delay and shorter refractory period compared to the fast pathway (FP) (George et al., 2017). Furthermore, the refractory period and conduction delay are dynamic and depend on the recent history of the conducted and blocked impulses in the AV nodal tissue (George et al., 2017; Billette and Tadros, 2019). Early models of the AV node did not account for the dual-pathway physiology (Cohen et al., 1983; Jørgensen et al., 2002; Rashidi and Khodarahmi, 2005; Mangin et al., 2005; Lian et al., 2006). Later models have incorporated this feature, represented by separate refractory periods (Corino et al., 2011; Henriksson et al., 2016; Inada et al., 2017; Wallman and Sandberg, 2018) and separate conduction delays (Climent et al., 2011b; Inada et al., 2017; Wallman and Sandberg, 2018). However, no models have explicitly incorporated ANS-induced changes in their model description.
Therefore, the aim of the present study is to incorporate ANS-induced changes into the AV node network model previously proposed by Wallman and Sandberg, (2018). The extension of the AV node model was guided by a distribution-based sensitivity analysis (Pianosi and Wagener 2018) and incorporates ANS-induced changes in the computation of the refractoriness and conduction delay. The extended model is evaluated with respect to its ability to replicate changes in heart rate and RR series variability and irregularity observed during head-up and head-down tilt test.
2 Materials and methods
First, the clinical tilt test data is described in Section 2.1. The RR series characteristics are defined in Section 2.2, followed by the description of a network model of the AV node (Section 2.3). A sensitivity analysis on the AV node model is described in Section 2.4, that identifies the influence of changes in model parameters on the RR series characteristics. Based on the sensitivity analysis, the AV node model is modified to account for ANS-induced changes in AV node characteristics (Section 2.5). The ability of the modified AV node model to replicate ANS induced changes in RR series characteristics observed during tilt-test is assessed in Section 2.6. Finally, the statistical analysis is described in Section 2.7, that is used to determine significant differences in AFR and RR series characteristics between tilt positions.
2.1 Tilt test study
The autonomic influence on the RR series characteristics was analysed using ECG data recorded during a tilt test study performed by Östenson et al. (2017). Recordings from 24 patients with persistent AF were considered of sufficient quality for analysis and were included in the present study; their age was 66 ± 9 (mean ± std), and 63% were men. None of the patients had abnormal levels of thyroid hormones, severe renal failure requiring dialysis, or heart valve disease. None of the patients were ablated for AF or on any of the Class I or Class III antiarrhythmic drugs. The tilt test was performed between 1 and 3 p.m. in a quiet study room. Standard 12-lead ECG was recorded during supine position, followed by head-down tilt (HDT, -30°) and then head-up tilt (HUT, +60°). The tilt table was manually operated and had hand grip and ankle support for HDT and foot board support for HUT; the patients remained in each position approximately 5 min. ECG preprocessing and R-peak detection was performed using the CardioLund ECG parser (www.cardiolund.com).
2.2 RR series characteristics
The RR series consists of the intervals between consecutive heartbeats, where the time of a heartbeat is determined by the corresponding R peak in the ECG signal. In this work, three statistical measures of the RR series characteristics were used, quantifying heart rate, heart rate variability and heart rate irregularity, respectively, defined according to Eqs. 1–3. The mean of the RR intervals
where RRi denotes the i:th RR interval in the RR series. The root mean square of successive RR interval differences (RRV, variability) is computed as
The sample entropy of the RR series (RRI, irregularity) is computed as
where the binary variable
2.3 Network model of the human atrioventricular node
The AV node is modelled by a network of 21 nodes (cf. Figure 1) (Wallman and Sandberg, 2018; Karlsson et al., 2021). The AV nodal dual-pathway physiology with a slow pathway (SP) and a fast pathway (FP) is represented with two chains of 10 nodes each. The last nodes of the two pathways are connected to each other and to an additional coupling node (CN). Impulses enter the AV node model simultaneously at the first node of each pathway and leave the model over the CN. Retrograde conduction is possible due to the bidirectional conduction within the pathways and between the last nodes of SP and FP.
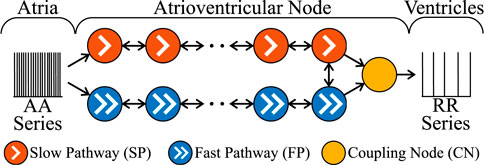
FIGURE 1. A schematic representation of the AV node model. Note that retrograde conduction is possible within the AV node model. For simplicity, only a subset of the ten nodes in each pathway is shown.
Each node represents a section of the AV node and is described with an individual refractory period RP(Δtk) and conduction delay DP(Δtk) defined as
where P ∈ {SP, FP, CN} denotes the association to a pathway. The electrical excitation propagation through the AV node is modelled as a series of impulses that can either be passed on or blocked by a node. This decision is based on the interval Δtk between the k:th impulse arrival time tk and the end of the (k–1):th refractory period computed as
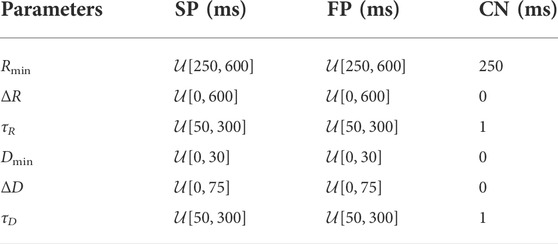
If Δtk is positive, the impulse is conducted to all adjacent nodes, otherwise the impulse is blocked due to the ongoing refractory period RP(Δtk−1). The conduction delay DP(Δtk) describes the time delay between the arrival of an impulse at a node and its transmission to all adjacent nodes. If an impulse is conducted, RP(Δtk) and DP(Δtk) of the current node are updated according to Eqs. 4–6. For the computation of RP(Δtk) and DP(Δtk), the nodes in each pathway are characterized by six parameters, defining minimum refractory period,
The AV node model processes the impulse propagation chronologically and node by node, using a priority queue of nodes, sorted by impulse arrival time; details can be found in Wallman and Sandberg (2018). The input to the AV node model is a series of atrial impulses that is used to initialize the priority queue. As the impulses are conducted to adjacent nodes, new entries are added to the priority queue. The output of the AV node model is a series of impulses activating the ventricles.
In this study, the series of atrial impulses during AF is modelled as a point-process with independent inter-arrival times according to a Pearson Type IV distribution (Climent et al., 2011a). Hence, the atrial activation (AA) series is completely characterized by four parameters, namely the mean μ, standard deviation σ, skewness γ and kurtosis κ.
2.4 Distribution-based sensitivity analysis
The sensitivity of the three RR series characteristics
The RR series characteristics were computed using a series of 4000 RR intervals corresponding to the first impulses that left the AV node model through the CN. Two selection criteria were used to remove non-physiological parameter sets. First, a model parameter set was only included if the slow pathway had a lower refractory period RSP(Δtk) < RFP(Δtk) and higher conduction delay DSP(Δtk) > DFP(Δtk) than the fast pathway for all Δtk. Second, the resulting
A sensitivity coefficient
where
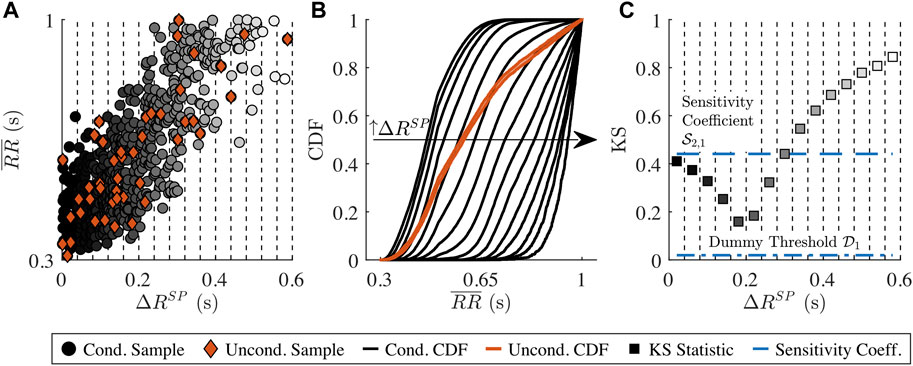
FIGURE 2. Illustration of the distribution-based sensitivity analysis. (A)
As the
A model parameter xn is determined to have influence on ym if and only if
2.5 Extended atrioventricular node model accounting for autonomic nervous system induced changes
The results from the sensitivity analysis (Section 3.1) indicate that changes in both the AV node model parameters and the AA series parameters have an influence on the RR series characteristics. Based on this, the AV node model described in Section 2.3 is extended to account for ANS-induced changes in the AA series by allowing μ(t) and σ(t) of the Pearson Type IV distribution to vary over time. Moreover, the AV node model was extended by two scaling factors AR and AD, accounting for the effect of changes in autonomic tone on refractory period (AR) and on conduction delay (AD).
The factors AR and AD model the combined effect of changes in sympathetic and parasympathetic activity and do not differ between the SP, FP and CN.
2.6 Tilt-induced changes in extended atrioventricular node model
In this section, the extended AV node model proposed in Section 2.5 is investigated with respect to its ability to mimic tilt-induced changes in RR series characteristics.
The clinical ECG signals (cf. Section 2.1) are used to generate AA series for the AV node model input and to compare the characteristics of the simulated RR series to the clinical RR series (cf. Figure 3). For this purpose, a continuous 15-min ECG signal with 5 minutes per supine, HDT and HUT position was desired for each patient. In the clinical data, however, the length of the three tilt positions varied between patients with the supine position being between 5 and 13 min, HDT being between 5 and 7 min and HUT being between 5 and 9 min. For two patients, there was an additional minute in supine position between the HDT and HUT. The ECG signals were aligned to the middle of the HDT section and a 15-min long segment centered around the same midpoint was chosen for each patient (cf. Figure 4).
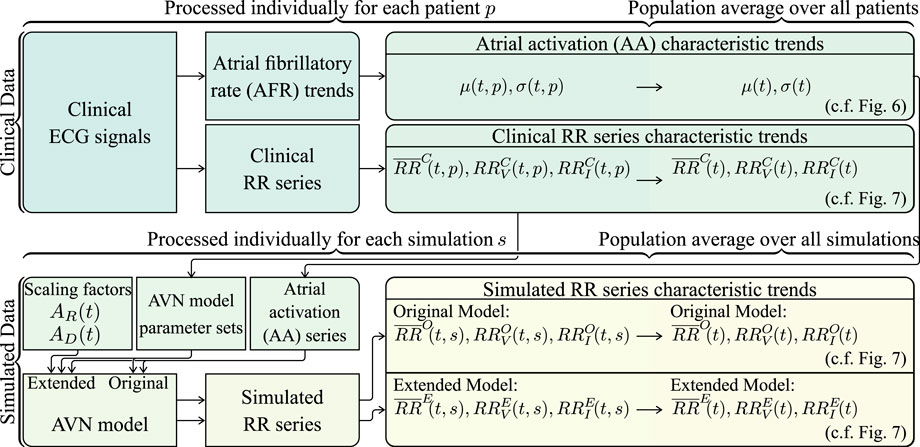
FIGURE 3. Schematic illustrating how the clinical and simulated RR series characteristic trends are computed.
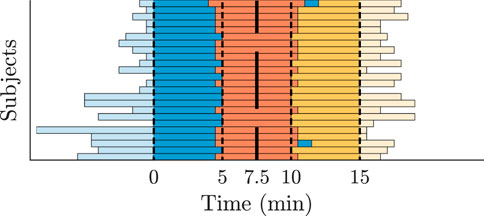
FIGURE 4. Tilt recordings of 24 patients divided into supine (blue), HDT (red) and HUT (yellow). The bars represent the length of the recorded ECG data. All recordings are centered along the middle of the HDT section.
The clinical RR series characteristic trends
For the generation of the AA series, first, an atrial fibrillatory rate (AFR) trend is estimated from each 15-min ECG segment (cf. Figure 3). The AFR is estimated by fitting a complex sinusoidal model to the f-waves of the ECG, following spatiotemporal QRST cancellation, as described in Henriksson et al. (2018). From each of the resulting AFR trends, the AA series parameters μ(t, p) and σ(t, p) are estimated by the mean and standard deviation of 1/AFR using 1-min sliding windows; the resolution of the AFR trend is 0.02 s (cf. Figure 3). Then, μ(t, p) and σ(t, p) are averaged over all 24 patients, resulting in the population-averaged trends μ(t) and σ(t) (cf. Figure 3). Finally, the AA series is iteratively generated (cf. Figure 3). The first AA interval is drawn from the Pearson Type IV distribution with μ(0) and σ(0), and each consecutive AA interval is drawn from the distribution with μ(ti) and σ(ti) where ti corresponds to the accumulated time of the previous AA intervals. The γ and κ of the Pearson Type IV distribution were kept fixed to 1 and 6, respectively.
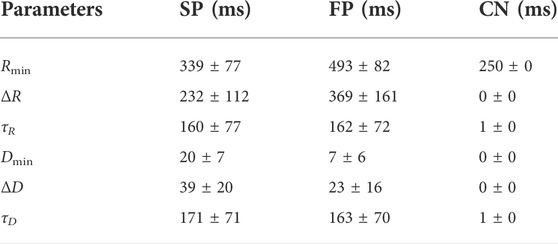
For the simulations using the original and extended model, a set of 240 AV node model parameter vectors
For the computation of simulated RR series characteristic trends using the original and the extended model, respectively, simulations were performed with each of the 240 parameter sets using 10 different realizations of the AA series generated from μ(t) and σ(t). In the original model, the scaling factors AR and AD are not included, which is equivalent to the extended model using AR = 1 and AD = 1 (cf. Figure 3). In the extended model, AR and AD were allowed to change between supine and HDT and between HDT and HUT, respectively, but were assumed to remain constant within each position. Hence, for the extended model, AR and AD were set to 1 in the supine position, and different combinations of AR ∈ {0.95, 1, 1.05} and AD ∈ {0.8, 1, 1.2} were used for the simulations during HDT and HUT. For each simulation s, the mean RR interval trends
2.7 Statistical analysis
A Wilcoxon signed rank test was applied to determine if AFR,
3 Results
3.1 Sensitivity analysis
Results from the distribution-based sensitivity analysis (described in Section 2.4) with respect to the influence of the AV node model parameters on RR series characteristics are shown in Figure 5. Heart rate, quantified by

FIGURE 5. Distribution-based sensitivity indices describing the influence of changes in the 14 model parameters to changes in the three RR series characteristics. A model parameter is assumed to have influence on the RR series characteristics if the sensitivity coefficient is above the threshold of the dummy parameter (horizontal black line), otherwise it is not influential and illustrated with a white bar. The black vertical line illustrates the 95% confidence interval of the t bootstrapping iterations of the sensitivity coefficient. The ranking of the four most influential model parameters for each RR series characteristic is shown with the numbers above the bars.
For RRV quantifying RR series variability, nearly all model parameters of the refractory period, conduction delay and AA series had sensitivity coefficients above the dummy threshold. The four largest contributors to changes in the RRV were the ΔR parameters of both pathways, as well as the minimum refractory period and minimum conduction delay of the fast pathway,
The RRI quantifying RR series irregularity was also influenced by most model parameters of the refractory period, conduction delay and AA series. The four largest contributors were the minimum refractory period of the slow pathway
3.2 Clinical data
The AFR decreased significantly from the supine position to HDT and increased significantly from HDT to HUT, where the AFR during HUT was significantly higher than during supine (Table 3). The heart rate increased during HDT and increased further during HUT (Table 3). The results align with the observations of Östenson et al. (2017). The variability and irregularity of the RR series decreased during HDT and decreased further during HUT (Table 3). For the variability and irregularity of the RR series, only the differences between supine and HUT were statistically significant.
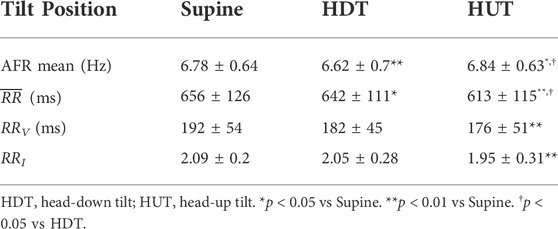
TABLE 3. Mean ± std of AFR and RR series characteristics of the 24 patients in the study population for each tilt position.
3.3 Tilt-induced changes in atrioventricular node model
The average of μ(t) and σ(t) over all 24 patients is illustrated in Figure 6. The μ(t) shows a clear variation during HDT and HUT, but not in supine position, where μ(t) was approximately constant around 150 ms. Compared to μ(t) during supine position, μ(t) increased during HDT and decreased during HUT (cf. Figure 6).
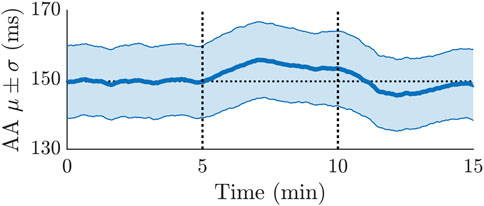
FIGURE 6. Averaged mean and standard deviation of the AA series estimated from ECG recordings of 24 patients. The first 5 min were during supine position, followed by 5 min of HDT and 5 min of HUT. The horizontal dotted line illustrates the average of the μ trend during the first 5 min.
In Figure 7, the characteristics
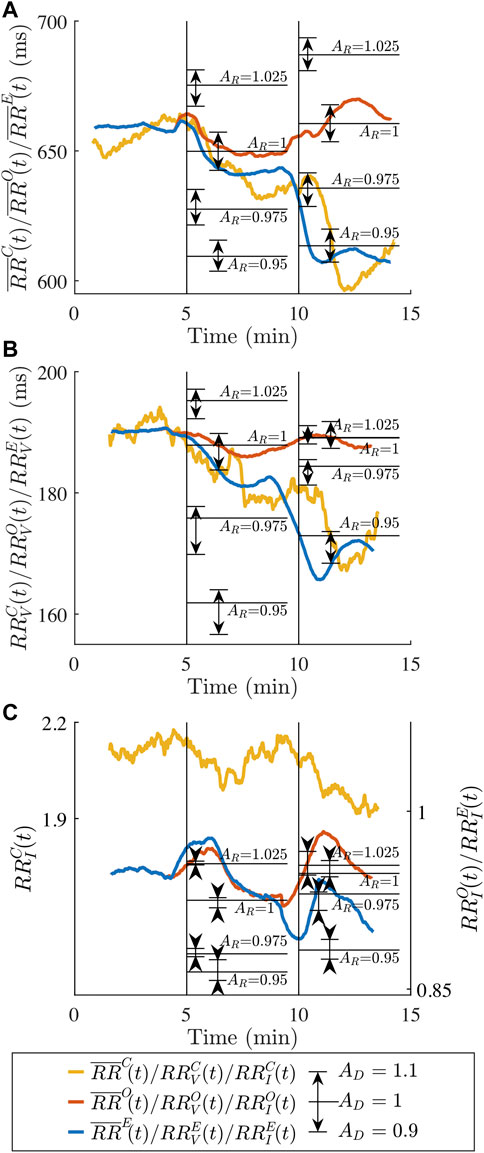
FIGURE 7. Average clinical RR series characteristics (A)
4 Discussion
The aim of this study was to extend the AV node model (Wallman and Sandberg, 2018) to incorporate ANS-induced changes. The extension of the AV node model was guided by a distribution-based sensitivity analysis. The sensitivity analysis indicated that the refractory period and conduction delay parameters as well as the atrial impulse series had a significant influence on the heart rate as well as the variability and the irregularity of the RR series, while the most influential parameters were predominantly those describing the refractory period. Rather than modelling the effect of the sympathetic and parasympathetic activity separately, we describe the joint effects, i.e., the autonomic tone. We proposed an extension to the AV node model that accounts for the ANS-induced changes by introducing scaling factors for the refractory period and conduction delay. The capability of the extended AV node model to replicate ANS-induced changes was investigated by comparison to ECG data acquired during tilt test.
Our results (Figure 7) indicate that the extended model, but not the original, could replicate the observed changes in the clinical RR series characteristics during HUT and HDT, since the changes in RR series characteristics could not be explained by changes in atrial activity alone. The
Many electrophysiological (EP) studies have demonstrated that an increase in sympathetic activity is causing a decrease in the human AV nodal conduction delay (Lister et al., 1965; Dhingra et al., 1973; Morady et al., 1988; Cossú et al., 1997) and a decrease in the refractory period (Morady et al., 1988; Cossú et al., 1997). Moreover, a decrease in sympathetic activity in the human AV node is causing an increase in conduction delay and refractory period (Morady et al., 1988). Head-up tilt is associated with increased sympathetic tone, and it has been demonstrated that the AV nodal conduction delay and refractory period decrease when changing the posture from supine to standing (Hashimoto et al., 1991). The results in Figure 7 confirm that a reduction in the conduction delay using AD = 0.9 and a reduction in the refractory period using AR = 0.95 better replicate the observed changes in the clinical RR series characteristics than the original model during HUT. Decreases in refractory period and conduction delay of up to 30% in response to isoproterenol-induced increases in sympathetic activity have been reported (Lister et al., 1965; Dhingra et al., 1973; Cossú et al., 1997). However, when considering that the reported changes in heart rate due to the isoproterenol administration is larger than the observed changes in
Increased parasympathetic activity has been associated with an increased conduction delay (Martin, 1977); studies in dogs reported an increased conduction delay with acetylcholine administration (Priola et al., 1983; Bertrix et al., 1984) and vagal stimulation (Spear and Moore, 1973; Martin, 1975; Pirola and Potter, 1990). Moreover, there are indications that an increased parasympathetic activity is associated with an increased refractory period (Martin, 1977); experimental studies using rabbit hearts reported an increased AV-nodal refractory period (West and Toda, 1967) and occurrences of 2:1 AV nodal block (Cranefield et al., 1959) with acetylcholine administration, and studies in dogs reported occurrences of AV block with acetylcholine administration (Hageman et al., 1985) and vagal stimulation (Spear and Moore, 1973; Hageman et al., 1985).
It is unclear how the HDT affects the sympathetic and parasympathetic activity. The results in Figure 7 show that a reduction in the conduction delay using AD = 0.9 and no modification of the refractory period using AR = 1 better replicate the observed changes in the clinical RR series characteristics than the original model during HDT. These results are consistent with possible slight increase in sympathetic tone provoked by HDT. However, other interpretations are possible. Nagaya et al. (1995) postulated a diminished sympathetic activity in HDT. Under that hypothesis, the results in Figure 7 suggest a decrease in parasympathetic tone to revert the direction of change caused by a decreased sympathetic tone. It should be noted that the model presented here does not distinguish between these two possibilities, since AD and AR are modelling the joint effect of changes in parasympathetic and sympathetic activity. Hence, the scale factor AD = 0.9 during HDT could be reflecting either a slight increase in sympathetic activity, a slight decrease in parasympathetic activity, a larger increase in sympathetic activity combined with an increase in parasympathetic activity, or a large decrease in parasympathetic activity combined with a decrease in sympathetic activity.
The set of scaling factors AR and AD used to create
To reduce the complexity of the model, the refractoriness and conduction delay of the SP, FP and CN are modified with the same AR and AD. However, due to the structural and molecular heterogeneity of the different pathways, it is likely that the ANS-induced changes affect each pathway differently (George et al., 2017). In rabbit hearts, it was reported that acetylcholine strongly affects fibers of the atrionodal junction but does not show any effect in the lower part of the node or the bundle of His (Trautwein, 1963). In the description of the AV node model, the CN is merging the impulses from the SP and FP and its refractory period and conduction delay is independent of Δtk. In contrast to Karlsson et al. (2021),
In the present study, the ability of the extended model to mimic tilt-induced changes was investigated using data from a previous study (Östenson et al., 2017), with tilt angles fixed to -30° in HDT and 60° in HUT, respectively. Different tilt angles of the tilt, i.e., different magnitude of the orthostatic stimulus, may affect the ANS response and hence the resulting RR series characteristics. Previous results from patients in normal sinus rhythm show that the sample entropy of the RR series was decreasing during HUT from 0° to 60° but remained roughly constant from 60° to 90° (Porta et al., 2007). Based on these results, we assume that the tilt angle of 60° is sufficiently large to induce changes in autonomic tone. Access to data from patients with AF during other tilt-inclinations could potentially be used to refine the model to take the degree on inclination into account. The tilt-induced changes in RR series irregularity observed in the present study are in line with the results in Patel et al. (2018), where a decrease in RR sample entropy in response to HUT in patients with AF was reported. The tilt-induced changes in RR series irregularity observed in the present study are also in line with the changes reported for patients in normal sinus rhythm during HUT (Porta et al., 2007). Results from previous studies suggest that the RR series irregularity during normal sinus rhythm increase in response to HDT (Porta et al., 2015), whereas a slight but not significant decrease was observed in the present study with patients in AF. However, it should be noted that origin of RR series variability and irregularity during AF differs from that during normal sinus rhythm and hence, the interpretation of the results with respect to autonomic tone may be different.
The effect of the ANS-induced activity was investigated with respect to its ability to mimic the population-averaged changes observed during tilt test. The RMSSD and sample entropy were used to quantify RR series variability and irregularity, respectively, since these statistical measures have been used in previous studies to assess changes in RR series characteristics during AF in response to drugs (Corino et al., 2015) and tilt-test (Patel et al., 2018). Population-averaged trends were chosen over the trends of individual patients to reduce the uncertainty in the estimation of the clinical RRV and RRI trends. The parameter sets used for the simulations in Section 2.6 were selected to be representative of the patients in the present study based on their ability to replicate RR series characteristics observed during supine position. However, it should be noted that fitting of the model to individual patients is outside the scope of the present study. Due to the short measurement duration of the clinical data, a robust estimation of individual model parameters is not to be expected with the present methodology (Karlsson et al., 2021). Longer measurements from more patients will allow model development and evaluation on a patient-specific basis, forming an attractive next step.
A distribution-based sensitivity analysis was chosen over a variance-based method, because the distributions of the simulated RR series characteristics are highly-skewed and multi-modal. Hence, variance alone cannot adequately represent the uncertainty (Pianosi and Wagener, 2018). Instead, a distribution-based method characterizes the uncertainty and sensitivity by investigating the entire distribution of the model outputs (Pianosi and Wagener, 2018). The results of the sensitivity analysis in Figure 5 indicate that
In the present study, the estimates in
While ANS modulation has been extensively studied during normal sinus rhythm (Porta et al., 2007; Porta et al., 2015; Sassi et al., 2015; Patel et al., 2018), no attempts have been made towards the estimation of ANS modulation during persistent AF. The present study is a first step towards developing a model of the AV node that will ultimately be used to quantify ANS modulation on a patient specific basis by fitting to RR interval series and information on atrial electrical activity obtained from clinical ECG recordings. The results (Figure 7) show that the proposed extended model of the AV node accounting for changes in autonomic tone can better replicate changes in RR series characteristics observed during tilt-test than the original model, implying that this is a viable approach to take. Further developments are needed to incorporate ANS modulation in the model and methodology for robust estimation of such modulation from clinical data.
5 Conclusion
We present an extended AV node model that incorporates ANS-induced changes. The extension was guided by a distribution-based sensitivity analysis showing that changes in refractoriness and conduction delay of the AV node as well as changes in atrial activity significantly influence the RR series characteristics. We demonstrate that the model extension is needed to replicate the changes in heart rate and RR series variability and irregularity observed during head-up and head-down tilt.
Data availability statement
The data analyzed in this study is subject to the following licenses/restrictions: The data is owned by the Department of Cardiology, Clinical Sciences, Lund University, Sweden. Requests to access these datasets should be directed to pyotr.platonov@ med.lu.se. The code for the extended model together with a user example can be found in the Supplementary Material.
Ethics statement
The studies involving human participants were reviewed and approved by Regionala Etikprövningsnämnden i Lund. The patients/participants provided their written informed consent to participate in this study.
Author contributions
FP, MW, PP, and FS contributed to conception and design of the study. SÖ was responsible for the tilt test experiment. MA and FS were responsible for ECG processing. FP performed the distribution-based sensitivity analysis, designed and evaluated the extended AV node model, wrote the original draft of the manuscript and produced the figures, with supervision from MW and FS. MW, PP and FS contributed to the funding acquisition. PP and SÖ contributed to the clinical interpretation of the results. All authors contributed to manuscript revision, read, and approved the submitted version.
Funding
The research was supported by the Swedish Research Council (grant VR 2019–04272) and the Crafoord Foundation (grant 20200605).
Conflict of interest
The authors declare that the research was conducted in the absence of any commercial or financial relationships that could be construed as a potential conflict of interest.
Publisher’s note
All claims expressed in this article are solely those of the authors and do not necessarily represent those of their affiliated organizations, or those of the publisher, the editors and the reviewers. Any product that may be evaluated in this article, or claim that may be made by its manufacturer, is not guaranteed or endorsed by the publisher.
Supplementary material
The Supplementary Material for this article can be found online at: https://www.frontiersin.org/articles/10.3389/fphys.2022.976468/full#supplementary-material
References
Bertrix L., Bouzouita K., Lang J., Lakhal M., Chah Q. T., Faucon G. (1984). Potentiation by hypokalemia of the effects of acetylcholine on the canine heart in situ. Naunyn. Schmiedeb. Arch. Pharmacol. 326, 169–174. doi:10.1007/BF00517315
Billette J., Tadros R. (2019). An integrated overview of av node physiology. Pacing Clin. Electrophysiol. 42, 805–820. doi:10.1111/pace.13734
Climent A. M., Atienza F., Millet J., Guillem M. S. (2011a). Generation of realistic atrial to atrial interval series during atrial fibrillation. Med. Biol. Eng. Comput. 49, 1261–1268. doi:10.1007/s11517-011-0823-2
Climent A. M., Guillem M. S., Zhang Y., Millet J., Mazgalev T. N. (2011b). Functional mathematical model of dual pathway av nodal conduction. Am. J. Physiol. Heart Circ. Physiol. 300, 1393–1401. doi:10.1152/ajpheart.01175.2010
Cohen R. J., Berger R. D., Dushane T. E. (1983). A quantitative model for the ventricular response during atrial fibrillation. IEEE Trans. Biomed. Eng. 30, 769–781. doi:10.1109/TBME.1983.325077
Corino V. D., Sandberg F., Mainardi L. T., Sörnmo L. (2011). An atrioventricular node model for analysis of the ventricular response during atrial fibrillation. IEEE Trans. Biomed. Eng. 58, 3386–3395. doi:10.1109/TBME.2011.2166262
Corino V. D., Ulimoen S. R., Enger S., Mainardi L. T., Tveit A., Platonov P. G. (2015). Rate-control drugs affect variability and irregularity measures of RR intervals in patients with permanent atrial fibrillation. J. Cardiovasc. Electrophysiol. 26, 137–141. doi:10.1111/jce.12580
Cossú S. F., Rothman S. A., Chmielewski I. L., Hsia H. H., Vogel R. L., Miller J. M., et al. (1997). The effects of isoproterenol on the cardiac conduction system: Site-specific dose dependence. J. Cardiovasc. Electrophysiol. 8, 847–853. doi:10.1111/j.1540-8167.1997.tb00845.x
Cranefield P. F., Hoffman B. F., Paes de Carvalho A. (1959). Effects of acetylcholine on single fibers of the atrioventricular node. Circ. Res. 7, 19–23. doi:10.1161/01.RES.7.1.19
Denes P., Wu D., Dhingra R., Pietras R. J., Rosen K. M. (1974). The effects of cycle length on cardiac refractory periods in man. Circulation 49, 32–41. doi:10.1161/01.CIR.49.1.32
Dhingra R. C., Winslow E., Pouget J. M., Rahimtoola S. H., Rosen K. M. (1973). The effect of isoproterenol on atrioventricular and intraventricular conduction. Am. J. Cardiol. 32, 629–636. doi:10.1016/S0002-9149(73)80055-4
George S. A., Faye N. R., Murillo-Berlioz A., Lee K. B., Trachiotis G. D., Efimov I. R. (2017). At the atrioventricular crossroads: Dual pathway electrophysiology in the atrioventricular node and its underlying heterogeneities. Arrhythm. Electrophysiol. Rev. 6, 179–185. doi:10.15420/aer.2017.30.1
Hageman G. R., Neely B. H., Urthaler F., James T. N. (1985). Negative chronotropic and parasympatholytic effects of alinidine on canine sinus node and AV junction. Am. J. Physiol. 248, 324–330. doi:10.1152/ajpheart.1985.248.3.H324
Hashimoto T., Fukatani M., Mori M., Hashiba K. (1991). Effects of standing on the induction of paroxysmal supraventricular tachycardia. J. Am. Coll. Cardiol. 17, 690–695. doi:10.1016/S0735-1097(10)80185-8
Henriksson M., Corino V. D., Sörnmo L., Sandberg F. (2016). A statistical atrioventricular node model accounting for pathway switching during atrial fibrillation. IEEE Trans. Biomed. Eng. 63, 1842–1849. doi:10.1109/TBME.2015.2503562
Henriksson M., Marozas V., Sandberg F., Sörnmo L. (2018). PetrnasModel-based assessment of f-wave signal quality in patients with atrial fibrillation. IEEE Trans. Biomed. Eng. 65, 2600–2611. doi:10.1109/TBME.2018.2810508
Hindricks G., Potpara T., Dagres N., Arbelo E., Bax J. J., Blomström-Lundqvist C., et al. (2020). 2020 ESC Guidelines for the diagnosis and management of atrial fibrillation developed in collaboration with the European Association for Cardio-Thoracic Surgery (EACTS): The Task Force for the diagnosis and management of atrial fibrillation of the European Society of Cardiology (ESC) Developed with the special contribution of the European Heart Rhythm Association (EHRA) of the ESC. Eur. Heart J. 42, 373–498. doi:10.1093/eurheartj/ehaa612
Inada S., Shibata N., Iwata M., Haraguchi R., Ashihara T., Ikeda T., et al. (2017). Simulation of ventricular rate control during atrial fibrillation using ionic channel blockers. J. Arrhythm. 33, 302–309. doi:10.1016/j.joa.2016.12.002
Jørgensen P., Schäfer C., Guerra P. G., Talajic M., Nattel S., Glass L. (2002). A mathematical model of human atrioventricular nodal function incorporating concealed conduction. Bull. Math. Biol. 64, 1083–1099. doi:10.1006/bulm.2002.0313
Karlsson M., Sandberg F., Ulimoen S. R., Wallman M. (2021). Non-invasive characterization of human AV-nodal conduction delay and refractory period during atrial fibrillation. Front. Physiol. 12, 728955. doi:10.3389/fphys.2021.728955
Lian J., Müssig D., Lang V. (2006). Computer modeling of ventricular rhythm during atrial fibrillation and ventricular pacing. IEEE Trans. Biomed. Eng. 53, 1512–1520. doi:10.1109/TBME.2006.876627
Lister J. W., Stein E., Kosowsky B. D., Lau S. H., Damato A. N. (1965). Atrioventricular conduction in man: Effect of rate, exercise, isoproterenol and atropine on the p-r interval. Am. J. Cardiol. 16, 516–523. doi:10.1016/0002-9149(65)90028-7
Lombardi F., Tarricone D., Tundo F., Colombo F., Belletti S., Fiorentini C. (2004). Autonomic nervous system and paroxysmal atrial fibrillation: A study based on the analysis of RR interval changes before, during and after paroxysmal atrial fibrillation. Eur. Heart J. 25, 1242–1248. doi:10.1016/j.ehj.2004.05.016
Mangin L., Vinet A., Pagé P., Glass L. (2005). Effects of antiarrhythmic drug therapy on atrioventricular nodal function during atrial fibrillation in humans. Europace 7, S71–S82. doi:10.1016/j.eupc.2005.03.016
Martin P. (1975). Dynamic vagal control of atrial-ventricular condition: Theoretical and experimental studies. Ann. Biomed. Eng. 3, 275–295. doi:10.1007/BF02390973
Martin P. (1977). The influence of the parasympathetic nervous system on atrioventricular conduction. Circ. Res. 41, 593–599. doi:10.1161/01.RES.41.5.593
Morady F., Nelson S. D., Kou W. H., Pratley R., Schmaltz S., De Buitleir M., et al. (1988). Electrophysiologic effects of epinephrine in humans. J. Am. Coll. Cardiol. 11, 1235–1244. doi:10.1016/0735-1097(88)90287-2
Nagaya K., Wada F., Nakamitsu S., Sagawa S., Shiraki K. (1995). Responses of the circulatory system and muscle sympathetic nerve activity to head-down tilt in humans. Am. J. Physiol. 268, R1289–R1294. doi:10.1152/ajpregu.1995.268.5.R1289
Östenson S., Corino V. D., Carlsson J., Platonov P. G. (2017). Autonomic influence on atrial fibrillatory process: Head-up and head-down tilting. Ann. Noninvasive Electrocardiol. 22, e12405. doi:10.1111/anec.12405
Patel H. C., Hayward C., Wardle A. J., Middleton L., Lyon A. R., Di Mario C., et al. (2018). The effect of head-up tilt upon markers of heart rate variability in patients with atrial fibrillation. Ann. Noninvasive Electrocardiol. 23, e12511. doi:10.1111/anec.12511
Pianosi F., Wagener T. (2018). Distribution-based sensitivity analysis from a generic input-output sample. Environ. Model. Softw. 108, 197–207. doi:10.1016/j.envsoft.2018.07.019
Pirola F. T., Potter E. K. (1990). Vagal action on atrioventricular conduction and its inhibition by sympathetic stimulation and neuropeptide y in anaesthetised dogs. J. Auton. Nerv. Syst. 31, 1–12. doi:10.1016/0165-1838(90)90166-g
Porta A., Gnecchi-Ruscone T., Tobaldini E., Guzzetti S., Furlan R., Montano N. (2007). Progressive decrease of heart period variability entropy-based complexity during graded head-up tilt. J. Appl. Physiol. 103, 1143–1149. doi:10.1152/japplphysiol.00293.2007
Porta A., Faes L., Marchi A., Bari V., De Maria B., Guzzetti S., et al. (2015). Disentangling cardiovascular control mechanisms during head-down tilt via joint transfer entropy and self-entropy decompositions. Front. Physiol. 6, 301. doi:10.3389/fphys.2015.00301
Priola D. V., Curtis M. B., Anagnostelis C., Martinez E. (1983). Altered nicotinic sensitivity of AV node in surgically denervated canine hearts. Am. J. Physiol. 245, 27–32. doi:10.1152/ajpheart.1983.245.1.H27
Rashidi A., Khodarahmi I. (2005). Nonlinear modeling of the atrioventricular node physiology in atrial fibrillation. J. Theor. Biol. 232, 545–549. doi:10.1016/j.jtbi.2004.08.033
Richman J. S., Moorman J. R. (2000). Physiological time-series analysis using approximate entropy and sample entropy. Am. J. Physiol. Heart Circ. Physiol. 278, 2039–2049. doi:10.1152/ajpheart.2000.278.6.H2039
Sassi R., Cerutti S., Lombardi F., Malik M., Huikuri H. V., Peng C.-K., et al. (2015). Advances in heart rate variability signal analysis: Joint position statement by the e-cardiology ESC working group and the European heart rhythm association co-endorsed by the asia pacific heart rhythm society. Europace 17, 1341–1353. doi:10.1093/europace/euv015
Shen M. J., Zipes D. P. (2014). Role of the autonomic nervous system in modulating cardiac arrhythmias. Circ. Res. 114, 1004–1021. doi:10.1161/CIRCRESAHA.113.302549
Spear J. F., Moore E. N. (1973). Influence of brief vagal and stellate nerve stimulation on pacemaker activity and conduction within the atrioventricular conduction system of the dog. Circ. Res. 32, 27–41. doi:10.1161/01.RES.32.1.27
Trautwein W. (1963). Generation and conduction of impulses in the heart as affected by drugs. Pharmacol. Rev. 15, 277–332.
Wallman M., Sandberg F. (2018). Characterisation of human AV-nodal properties using a network model. Med. Biol. Eng. Comput. 56, 247–259. doi:10.1007/s11517-017-1684-0
West T. C., Toda N. (1967). Response of the A-V node of the rabbit to stimulation of intracardiac cholinergic nerves. Circ. Res. 20, 18–31. doi:10.1161/01.res.20.1.18
Keywords: atrial fibrillation, atrioventricular node, autonomic tone, tilt test, mathematical modeling, ECG, RR series characteristics, sample entropy
Citation: Plappert F, Wallman M, Abdollahpur M, Platonov PG, Östenson S and Sandberg F (2022) An atrioventricular node model incorporating autonomic tone. Front. Physiol. 13:976468. doi: 10.3389/fphys.2022.976468
Received: 23 June 2022; Accepted: 10 August 2022;
Published: 15 September 2022.
Edited by:
Axel Loewe, Karlsruhe Institute of Technology, GermanyReviewed by:
Jordi Heijman, Maastricht University, NetherlandsAlberto Porta, University of Milan, Italy
Copyright © 2022 Plappert, Wallman, Abdollahpur, Platonov, Östenson and Sandberg. This is an open-access article distributed under the terms of the Creative Commons Attribution License (CC BY). The use, distribution or reproduction in other forums is permitted, provided the original author(s) and the copyright owner(s) are credited and that the original publication in this journal is cited, in accordance with accepted academic practice. No use, distribution or reproduction is permitted which does not comply with these terms.
*Correspondence: Felix Plappert, ZmVsaXgucGxhcHBlcnRAYm1lLmx0aC5zZQ==
 Felix Plappert
 Mikael Wallman
 Mostafa Abdollahpur
 Pyotr G. Platonov
 Sten Östenson4
 Frida Sandberg