 Motahareh Moghtadaei
 Tristan W. Dorey
 Robert A. Rose
94% of researchers rate our articles as excellent or good
Learn more about the work of our research integrity team to safeguard the quality of each article we publish.
Find out more
ORIGINAL RESEARCH article
Front. Physiol., 27 September 2022
Sec. Cardiac Electrophysiology
Volume 13 - 2022 | https://doi.org/10.3389/fphys.2022.970393
Nonlinear analyses of heart rate variability (HRV) can be used to quantify the unpredictability, fractal properties and complexity of heart rate. Fractality and its analysis provides valuable information about cardiovascular health. Multi-Scale Multi-Fractal Detrended Fluctuation Analysis (MSMFDFA) is a complexity-based algorithm that can be used to quantify the multi-fractal dynamics of the HRV time series through investigating characteristic exponents at different time scales. This method is applicable to short time series and it is robust to noise and nonstationarity. We have used MSMFDFA, which enables assessment of HRV in the frequency ranges encompassing the very-low frequency and ultra-low frequency bands, to jointly assess multi-scale and multi-fractal dynamics of HRV signals obtained from telemetric ECG recordings in wildtype mice at baseline and after autonomic nervous system (ANS) blockade, from electrograms recorded from isolated atrial preparations and from spontaneous action potential recordings in isolated sinoatrial node myocytes. Data demonstrate that the fractal profile of the intrinsic heart rate is significantly different from the baseline heart rate in vivo, and it is also altered after ANS blockade at specific scales and fractal order domains. For beating rate in isolated atrial preparations and intrinsic heart rate in vivo, the average fractal structure of the HRV increased and multi-fractality strength decreased. These data demonstrate that fractal properties of the HRV depend on both ANS activity and intrinsic sinoatrial node function and that assessing multi-fractality at different time scales is an effective approach for HRV assessment.
Heart rate (HR), a critical measure of cardiac performance, is determined by the intrinsic properties of the sinoatrial node (SAN) and modulated by the autonomic nervous system (ANS) (Mangoni and Nargeot, 2008; Lakatta et al., 2010; Macdonald et al., 2020). Specifically, intrinsic HR is determined by the rate of spontaneous action potential (AP) firing in SAN myocytes while the sympathetic (SNS) and parasympathetic (PNS) nervous systems increase and decrease SAN AP firing, respectively. Heart rate variability (HRV), which describes the beat-to-beat variation in HR (i.e. variation in the R-R interval on the electrocardiogram), is understood to be robust in a healthy cardiovascular system (Billman, 2011; Yaniv et al., 2014; Yaniv et al., 2016). Consistent with this concept, reductions in HRV are associated with worse prognosis in a number of conditions and disease states (Hillebrand et al., 2013). HRV is recognized to arise from changes in the activity of the ANS (i.e. changes in sympatho-vagal balance) as well as alterations in the intrinsic properties of the SAN (i.e. changes in intrinsic HR) (Papaioannou et al., 2013; Yaniv et al., 2014; Behar et al., 2018; Dorey et al., 2020; Rosenberg et al., 2020). HRV is conventionally assessed through spectral and/or time domain analyses, which are well-established approaches that provide important insight into the roles of the autonomic nervous system (ANS) and intrinsic sinoatrial node (SAN) function in HRV (Billman, 2011; Shaffer and Ginsberg, 2017; Moen et al., 2019). HRV can also be assessed using a number of nonlinear approaches such as sample entropy (Richman and Moorman, 2000), Poincaré plots with analysis of standard deviations (Guzik et al., 2007), long range RR interval turbulence (Lombardi and Stein, 2011) and heart rate fragmentation (Costa et al., 2017).
While each of the above traditional and nonlinear approaches can provide important information on HRV in different conditions, it is important to recognize that the dynamic cardiovascular system is embedded in a highly complex fractal structure of interacting sub-systems such as fractal vascular and neural networks, humoral pathways and the SAN itself. This dissipative system is therefore best described as one that exists in a dynamic self-organized state, with nonlinear and fractal characteristics, that can preserve homeostasis (Dini et al., 2012; Castiglioni et al., 2018). HR and HRV represent complex signals within the cardiovascular system that provide important information on this process. The natural variability in HR is not characterized by any particular time scale meaning that HR, like other physiological signals, is fractal with numerous nonlinear features that are not quantifiable by traditional spectral analysis (Ivanov et al., 1999). As a result, kinetic fractals of the RR interval can be indicative of their self-similarity or their long-range correlation within RR interval time series. Accordingly, analysis of the fractal nature of HRV requires the use of distinct algorithms that facilitate the study of nonlinear parameters that describe this complex regulation of heart rate as not all information contained in the HRV signal is captured by more traditional methods (Sassi et al., 2015). Reliable identification and validation of the fractal components of HRV can reveal alterations in cardiovascular regulatory mechanisms that could provide accurate insight into the physiology of HR regulation and help determine the risk of poor clinical cardiovascular outcomes.
Detrended Fluctuation Analysis (DFA) is an established algorithm that can be used to quantify the nonlinear fractal dynamics of the HRV time series by quantifying characteristic exponents that describe the scaling of the signal’s fluctuations (Makowiec et al., 2006; Gao et al., 2013; Constantinescu et al., 2018; Mizobuchi et al., 2021). Adaptive Fractal Analysis (AFA) is another nonlinear method that quantifies fractal geometry. Although AFA and DFA techniques are similar, AFA requires creation of a globally smooth trend signal by patching together local polynomial fits to the time series. DFA on the other hand, relies on discontinuous, piece-wise linear fits, which provides the rationale to progress from DFA to Multi-Fractal DFA (MFDFA) for multi-fractal analysis of the HR time series rather than its mono-fractal analysis (Maity et al., 2015). When compared to other nonlinear fractal analysis methods, a primary advantage of DFA is that it permits the detection of intrinsic self-similarity embedded in the seemingly nonstationary HR time series and, because it eliminates the local trends in the signal, it avoids false detection of artificial self-similarity in extrinsic trends. Other advantages of DFA are that it is applicable to short time series, it requires fewer data points compared to time and frequency domain analysis methods, and it is robust to noise and nonstationarity (Gieraltowski et al., 2012). A limitation of the basic DFA algorithm is that it only provides a mono-fractal description (Ivanov et al., 1999; Sassi et al., 2009); whereas HR is recognized to be a multi-fractal time series that shows self-similarity at different scales and different amplitudes with fractal properties that vary from point to point along the time series (Gieraltowski et al., 2012; Xia et al., 2013). As a result, a spectrum of scale exponents is more appropriate for assessing the multi-scale structure of HR changes and for investigating the effects of ANS activity and intrinsic SAN function on complex HR dynamics.
Thus, to more accurately assess non-linear HRV properties, we have used Multi-Scale Multi-Fractal Detrended Fluctuation Analysis (MSMFDFA) (Gieraltowski et al., 2012; Xia et al., 2013; Castiglioni et al., 2018) as a complexity-based method to jointly assess multi-scale and multi-fractal dynamics of HR in healthy wildtype mice in the ultra-low and very-low frequency bands (0.0024–0.33 Hz). The ultra-low frequency is thought to be driven by circadian rhythms and there is disagreement about the contributions of the SNS and PNS to ultra-low frequency oscillations in HR (Shaffer et al., 2014; Shaffer and Ginsberg, 2017). The very-low frequency band is driven by sympatho-vagal balance and the PNS may contribute to this band more than the SNS (Shaffer and Ginsberg, 2017). The very-low frequency band is strongly associated with all-cause mortality as well as arrhythmic death and is therefore thought to be fundamental to overall health (Shaffer and Ginsberg, 2017). The lower range of the ultra-low frequency band, in particular, is not typically captured in traditional frequency domain analysis; therefore, the MSMFDFA approach can provide novel information not possible with other approaches.
While some studies have used multi-scale DFA analysis in humans (Castiglioni et al., 2017; Castiglioni and Faini, 2019) and in isolated cardiac myocytes (chick embryonic myocytes) (Ahammer et al., 2013), a rigorous application of MSMFDFA across several levels of organization (i.e. from in vivo to isolated SAN myocytes) has not been reported. It is essential to do this because it is recognized that HRV can arise from changes in ANS activity as well as changes in intrinsic SAN function (Yaniv et al., 2013; Yaniv et al., 2016; Dorey et al., 2020; Dorey et al., 2021). Accordingly, we have applied MSMFDFA analysis to measurements of heart rate/beating rate conducted at multiple levels of organization including in unrestrained mice in vivo (baseline and in the presence of ANS antagonists), in isolated atrial preparations (containing the intact SAN, but devoid of neural inputs) and in isolated SAN myocytes. These studies enable us to accurately assess the impacts of the ANS and intrinsic SAN function on complex HR dynamics across multiple scales in the ultra-low and very-low frequency ranges using non-linear MSMFDFA analysis.
This study used adult male wildtype C57Bl/6 mice between the ages of 10 and 15 weeks. All experimental procedures used in this study followed the Canadian Council on Animal Care guidelines and were approved by the University of Calgary Animal Care and Use Committee. Mice were housed in groups of 3-5 per cage using Tecniplast Green Line GM500 cages with 500 cm2 of floor space and provided with enrichment items (nesting material, houses) in the cages. Mice were provided with standard rodent chow (LabDiet 5062) and water ad libitum. Mice were kept on a 12:12 h light:dark cycle. Temperature in the room was maintained at 21–22°C and humidity was 32–38%. These environmental and housing conditions were monitored daily and maintained throughout the study.
To investigate HRV in vivo, we used telemetric ECG recordings as we have described (Moghtadaei et al., 2017; Dorey et al., 2020; Dorey et al., 2022). ECGs and activity were monitored in awake, freely moving mice using subcutaneously implanted telemetric transmitters (HD-X11, Data Sciences International). After 7 days of recovery following transmitter insertion, telemetric ECG recordings and activity levels were acquired continuously for 48 h. After the baseline recording period was completed, the effects of ANS blockade were investigated by intraperitoneal injection of the β-adrenergic receptor (β-AR) antagonist propranolol hydrochloride (10 mg/kg) and the muscarinic (M2) receptor antagonist atropine sulfate (10 mg/kg), alone or in combination, at approximately the same time each day (9:00–11:00 a.m.). A minimum of 24 h was given between injections. After drug injection, the ECG was recorded continuously for 1 h. ECG data acquisition, ECG filtering and R-wave detection was done using Ponemah software (Data Sciences International).
Intact atrial preparations containing the SAN, but devoid of autonomic innervation, were prepared as we have described previously (Dorey et al., 2020; Dorey et al., 2021). Beating atrial preparations were superfused continuously with Krebs solution (37°C) containing (in mM): 118 NaCl, 4.7 KCl, 1.2 KH2PO4, 12.2 MgSO4, 1 CaCl2, 25 NaHCO3, 11 glucose. This Krebs solution was bubbled with 95% O2/5% CO2 in order to maintain a pH of 7.4. After the atrial preparation was equilibrated for at least 30 min, electrograms were measured continuously using needle electrodes (Grass Technologies) placed in each atrial appendage. Electrograms were acquired using a Powerlab 26T (AD Instruments).
SAN myocytes were isolated using procedures we have described previously (Rose et al., 2004; Mackasey et al., 2018). Spontaneous action potentials (APs) were recorded using the perforated patch-clamp technique on single SAN myocytes. For recording APs the recording chamber was superfused with a normal Tyrode’s solution containing (in mM): 140 NaCl, 5 KCl, 1 MgCl2, 1 CaCl2, 10 HEPES, and 5 glucose, with pH adjusted to 7.4 with NaOH. The pipette filling solution contained (in mM) 135 KCl, 0.1 CaCl2, 1 MgCl2, 5 NaCl, 10 EGTA, 4 Mg-ATP, 6.6 Na-phosphocreatine, 0.3 Na-GTP and 10 HEPES, with pH adjusted to 7.2 with KOH. Amphotericin B (200 μg/ml) was added to this pipette solution to record APs with the perforated patch clamp technique. APs were recorded at room temperature (22–23°C).
The ECG signal was first divided into low and high activity phases based on activity measurements from telemeters. The ECG signals at high and low activity were each divided into 2 h segments and each 2 h segment was divided into 2000 beat segments for the fractal analysis. For each activity level, five separate 2 h segments were analyzed and averaged. For the signals recorded from isolated atrial preparations and isolated SAN myocytes, peak detection was performed on the electrogram recordings in atrial preparation or spontaneous APs in SAN myocytes, respectively. Segments with 2000 and 1,000 beats from atrial preparations and SAN myocytes were selected for the fractal analysis respectively. The MSMFDFA algorithm is robust to noise and non-stationarity; therefore, it was not necessary to identify and remove sinus pauses and ectopic activity in the tachogram.
Time and frequency domain metrics were analyzed using customized software written in MATLAB (MathWorks, Natick, Massachusetts) as we have described previously (Moghtadaei et al., 2017; Dorey et al., 2021). HRV was assessed using time and frequency domain analysis from ECG recordings in vivo. Stationary NN interval time series of at least 5 min in duration were used for time domain analysis. Each episode was examined to ensure a stationary and stable sinus rhythm with no trend or periodic fluctuations. Next, R wave detection was performed, and RR interval time series were obtained. In isolated atrial preparations, NN intervals were defined as the interval between peaks on the electrogram recordings in atrial preparations. The time domain parameters we are reporting include the standard deviation of all normal RR intervals (SDNN, in ms) and the root mean square differences between successive RR intervals (RMSSD, in ms).
To correct for the influence of HR on SDNN, we plotted SDNN as a function of HR for all baseline data and fitted these data with an exponential function, which was then used to generate the following equation to correct for HR and produce corrected SDNN (cSDNN).
For frequency domain analysis, each of the low and high activity phases were divided into 2 min episodes. These time frames were chosen in order to ensure that each episode contained at least 1,024 data points (R waves). Similar to the time domain analysis, each episode was manually examined to ensure a stationary and stable sinus rhythm, which is required for performing fast Fourier transforms (see below). Next, R wave detection was performed, and the RR interval time series were generated. Linear trends and drift were removed from the signal to reveal the HRV in the data. In the present study, we have used Welch’s method to characterize the frequency content of the signal (i.e. to estimate the power of the signal at different frequencies). In Welch’s method, the signal is broken into overlapping segments to reduce noise in the frequency spectrum. Then, the segments are windowed to reduce spectral leakage. The periodogram of each windowed segment is calculated using the Fourier transform. Finally, the periodograms are averaged to make a single frequency spectrum. In the present study, we have used 50% overlapping and the Hamming window for the spectral density estimation. The total power of each periodogram was measured as a total index of HRV, which determines the integral of total variability over the entire frequency range. Then, the high frequency (HF) and low frequency (LF) components were extracted. The HF component of HRV (1.5–5 Hz) is predominantly mediated by the phasic activity of the parasympathetic nervous system. The LF oscillations of HR (0.1–1.5 Hz) are regulated by both the sympathetic and parasympathetic nervous systems; however, the tonic sympathetic component is dominant.
The MSMFDFA algorithm used in this study is based on the conventional DFA algorithm. Given an R-R interval time series
The
The first order trend of each segment
The variance,
The slope of this surface
1- If the time series
2- If
In this study, both scale (s) and order (q) dependencies of the fractal structures in the HRV signal were quantified. The analysis was performed in the beat domain and then each scale coefficient was associated with its temporal scale, by mapping the beat domain into the time domain. This step is necessary for comparing different conditions with different average HR values.
The multi-fractality was also quantified as a function of scale using the multi fractal index
If instead of local slopes, for each value of q a single slope is calculated over the whole range of scales, then
Aq is independent of scale. In this case Aq is related to the classical multi-fractal scaling exponents or Renyi index
The multi-fractal spectrum
Here,
Spectra of MSMFDFA scale exponents, including the Hurst exponent, multi-fractal index, Renyi index, and multi-fractal spectrum were calculated for scales between 3 and 415 s, which can be considered as a qualitative measure of the power spectrum in the region of the ultra-low and very-low frequency bands, (i.e. at frequencies between 0.0024 and 0.33 Hz).
All data are presented as means ± SEM. Data were analyzed using Student’s t-test, two-way repeated measures ANOVA test or two-way ANOVA with a Holm-Sidak posthoc test as indicated in each figure legend. p < 0.05 was considered significant.
Initially, standard time and frequency domain HRV metrics were calculated from ECGs, electrograms or spontaneous AP recordings for each experimental condition (Table 1). Specifically, in vivo analysis was performed in baseline low activity and baseline high activity conditions (activity was assessed telemetrically), as well as after application of the ANS blockers atropine, propranolol or both in combination. Time and frequency domain analysis was also done in isolated atrial preparations and in isolated SAN myocytes (Table 1). For mice the low frequency band was 0.1–1.5 Hz and the high frequency band was 1.5–5 Hz for traditional frequency domain analysis (Moghtadaei et al., 2017; Behar et al., 2018). The data in Table 1 demonstrate that values for time domain metrics (SDNN, cSDNN, RMSSD) and frequency domain metrics (total power, HF power, LF power) were comparable in each condition to those reported previously for mice in vivo (baseline and ANS blockade), as well as for isolated mouse atrial preparations and isolated mouse SAN myocytes (Moghtadaei et al., 2017; Dorey et al., 2020; Dorey et al., 2021; Dorey et al., 2022). In particular, ANS blockers reduced time and frequency domain measures of HRV in vivo as expected. Furthermore, time domain analysis demonstrates that variability was higher in isolated atrial preparations and isolated SAN myocytes compared to baseline low activity conditions in vivo, as demonstrated previously (Dorey et al., 2020; Dorey et al., 2021).
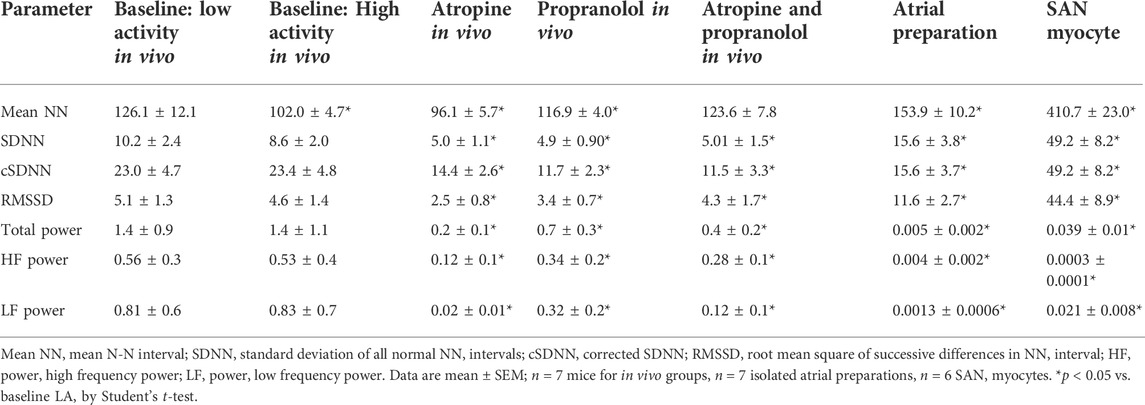
TABLE 1. Time and frequency domain analysis of HRV in vivo, in isolated atrial preparations and in isolated SAN myocytes.
Next, nonlinear HRV was assessed using MSMFDFA, which enables assessment of HRV in the frequency range of 0.0024–0.33 Hz, encompassing the very-low frequency (0.0056–0.1 Hz) and ultra-low frequency bands (0–0.0056 Hz) (Behar et al., 2018).
Nonlinear HRV was assessed from ECGs recorded in conscious, freely moving mice in vivo. In all groups and conditions, the generalized q dependent fluctuation function
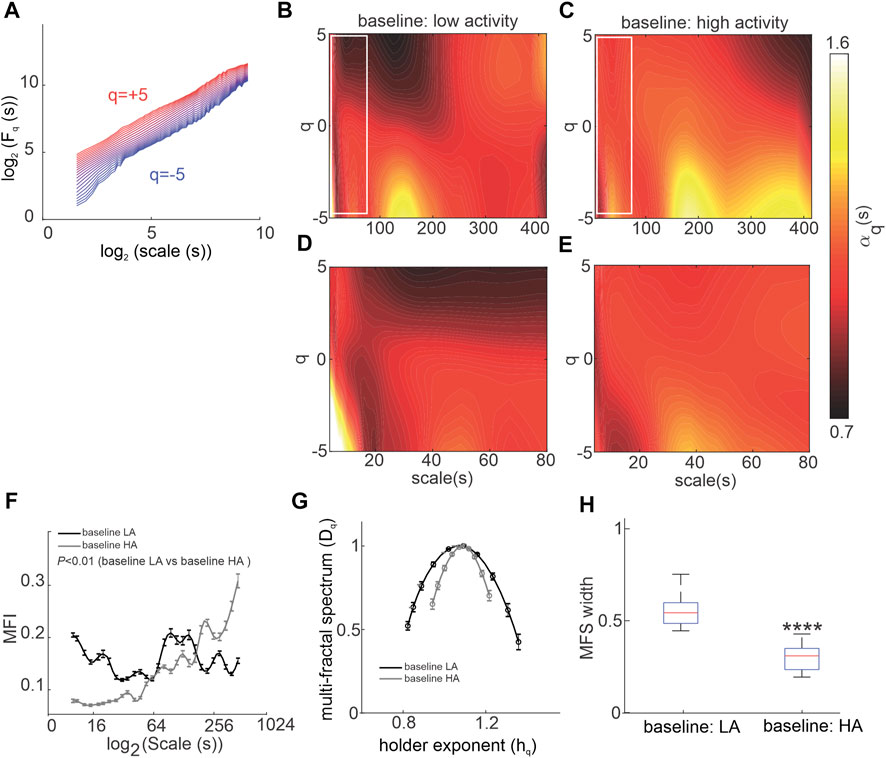
FIGURE 1. Multiscale multi-fractal detrended-fluctuation analysis of heart rate variability in wildtype mice in vivo. (A) Overall RMS
The low and high-activity phases were separated based on activity measured from telemeters. MSMFDFA parameters were then measured for ECG in phases of high and low activity. In baseline conditions for most scales,
During high activity episodes, when SNS activity is increased, the average fractal structure of the HRV signal was increased compared to low activity, which is evident from the shift in the central tendency of the multi-fractal spectrum of the HRV signal towards smaller singularities (i.e. larger hq values; Figure 1G). Furthermore, weaker multi-fractality during high activity episodes is evident from the smaller multi-fractal spectrum width (Figure 1H).
To directly investigate the effects of ANS activity on MSMFDFA of HRV, mice were given ANS blockers beginning with atropine to block the PNS (Figure 2). Atropine substantially altered the spectrum of HRV scale exponents compared to baseline low activity conditions as shown in scale exponent heat maps (Figures 2A–C). Atropine eliminated mid-range low amplitude fractals at 100 s < scales<200 s and q < 0 and decreased
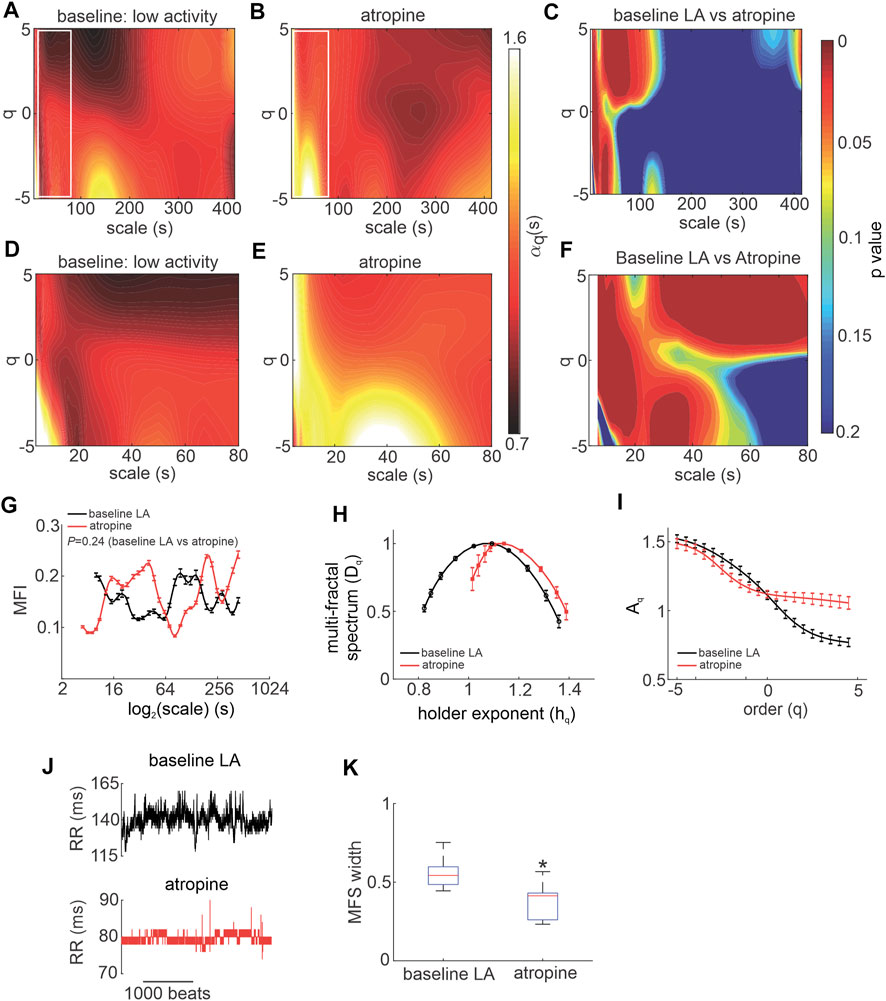
FIGURE 2. Effects of atropine on MSMFDFA of heart rate variability in wildtype mice in vivo. (A, B) Heat maps for MSMFDFA scale exponents
Consistent with these heat maps, analysis of the multi fractal index following atropine injection shows there is larger variability in scale exponents of the HRV signal during PNS blockade for the majority of scales from 3 to 415 s, except for scales<10 and 100 s < scales<200 s when compared to baseline low activity (Figure 2G).
The multi-fractal spectrum of HRV after atropine injection was asymmetric with left tail truncation (Figure 2H) that originated from a leveling of the q-order multi-fractal exponent for positive q values (Figure 2I) indicating that the q-order DFA is insensitive to local fluctuations with large magnitudes. Representative tachograms for baseline low activity and atropine injection confirm that the variability of RR intervals was smaller, and lacked large amplitude local fluctuations, after atropine injection (Figure 2J).
In addition, the fractal structure of the HRV signal was increased after injection of atropine as illustrated by a shift in the central tendency of the multi-fractal spectrum of the HRV signal towards smaller singularities (larger hq values; Figure 2H). This occurred in association with a reduction in multi-fractality strength as shown by a smaller multi-fractal spectrum width in the presence of atropine (Figure 2K).
Next, the effects of SNS blockade on MSMFDFA of HRV were investigated by injecting mice with propranolol (Figure 3). Except for few regions, the overall MSMFDFA spectrum remained similar to baseline low activity conditions after propranolol injection. Heat maps of scale exponents show that propranolol decreased
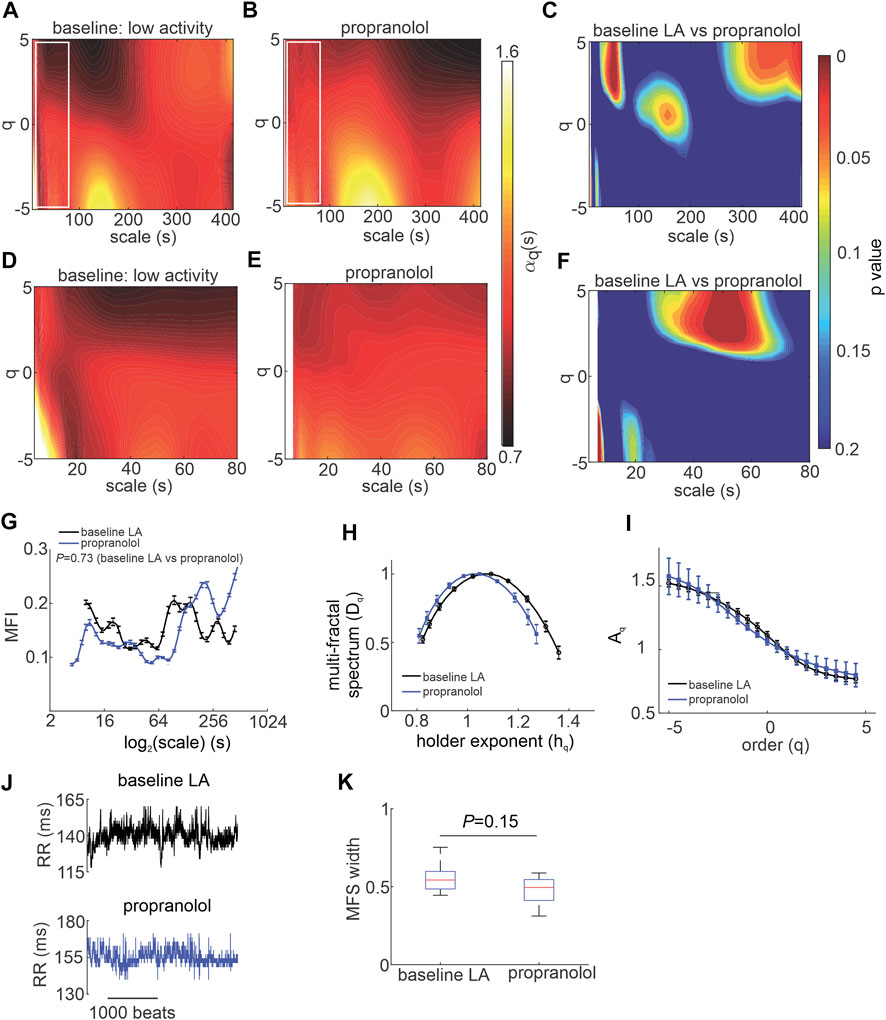
FIGURE 3. Effects of propranolol on MSMFDFA of heart rate variability in wildtype mice in vivo. (A, B) Heat maps for MSMFDFA scale exponents
Overall, the multi fractal index was not different when comparing propranolol to baseline low activity conditions despite values being lower on average for scales<127 s after application of propranolol (Figure 3G). The multi-fractal spectrum of the HRV signal after injection of propranolol remained symmetric and was similar to baseline low activity conditions with no differences in central tendency (Figure 3H). Consistent with this, the q-order multi-fractal exponent was similar between baseline LA and propranolol (Figure 3I) and representative tachograms show similar patterns of fluctuation between these conditions (Figure 3J). Finally, the multi-fractal spectrum width was not different between baseline LA and propranolol (Figure 3K). This indicates that propranolol did not change the fractal structure of the HRV signal or its multi-fractality strength.
HRV is determined in part by intrinsic SAN function. Accordingly, intrinsic MSMFDFA of HRV was investigated in the presence of ANS blockade in vivo. Combined injection of atropine and propranolol altered the MSMFDFA scale exponents throughout the measured parameter space of 3 s < scales<415 s and -5<q < 5 compared to baseline low activity such that
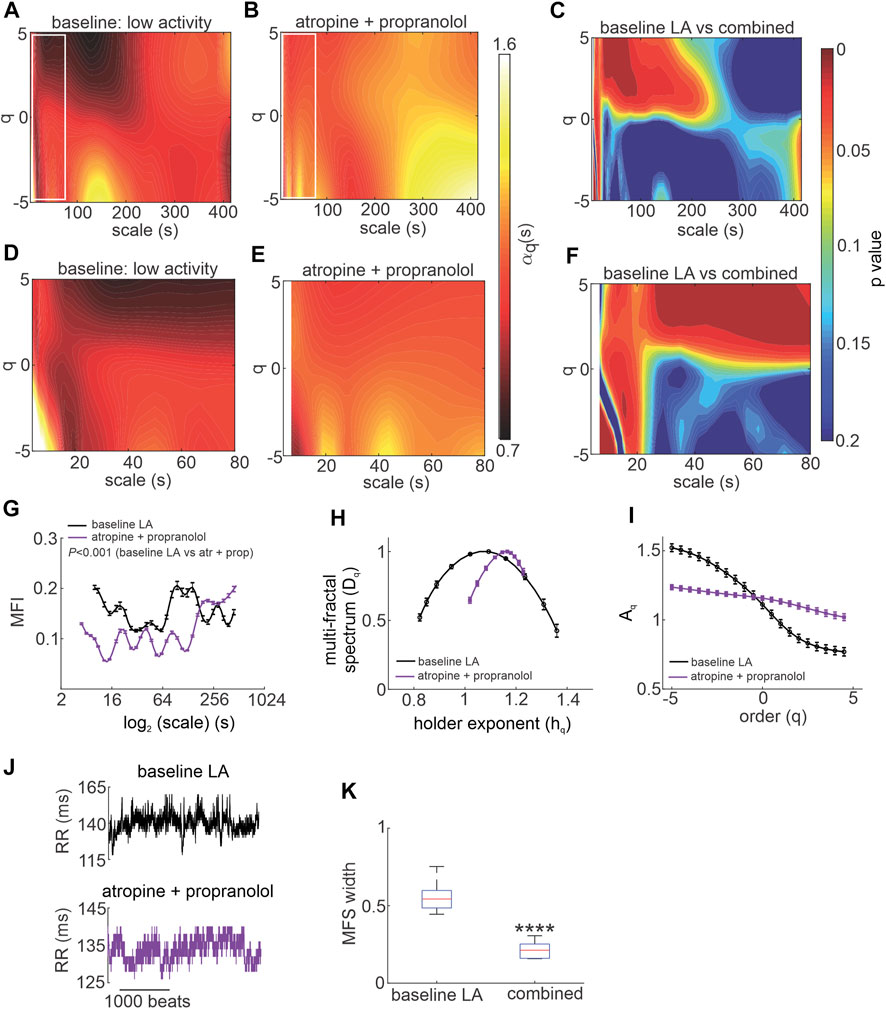
FIGURE 4. Effects of autonomic nervous system blockade on MSMFDFA of heart rate variability in wildtype mice in vivo. (A, B) Heat maps for MSMFDFA scale exponents
Analysis of the multi fractal index after ANS blockade shows that there is less variability in scale exponents of the HRV signal for 3 s < scales<180 s compared to baseline low activity conditions (Figure 4G). The multi-fractal spectrum after injection of atropine and propranolol was asymmetric with a right tail truncation (Figure 4H) in association with a leveling of the q-order multi-fractal exponent for negative q values (Figure 4I). This indicates that the q-order DFA is insensitive to the local fluctuations with small magnitudes after ANS blockade. In agreement with this, representative tachograms demonstrate less low amplitude local variability after injection of atropine and propranolol compared to baseline low activity conditions (Figure 4J).
The presence of
To directly investigate the role of the SAN in HRV fractality, MSMFDFA was performed on beating rate variability signals in isolated mouse atrial preparations (devoid of ANS inputs) and in isolated mouse SAN myocytes (Figures 5, 6). For scales>80 ms,
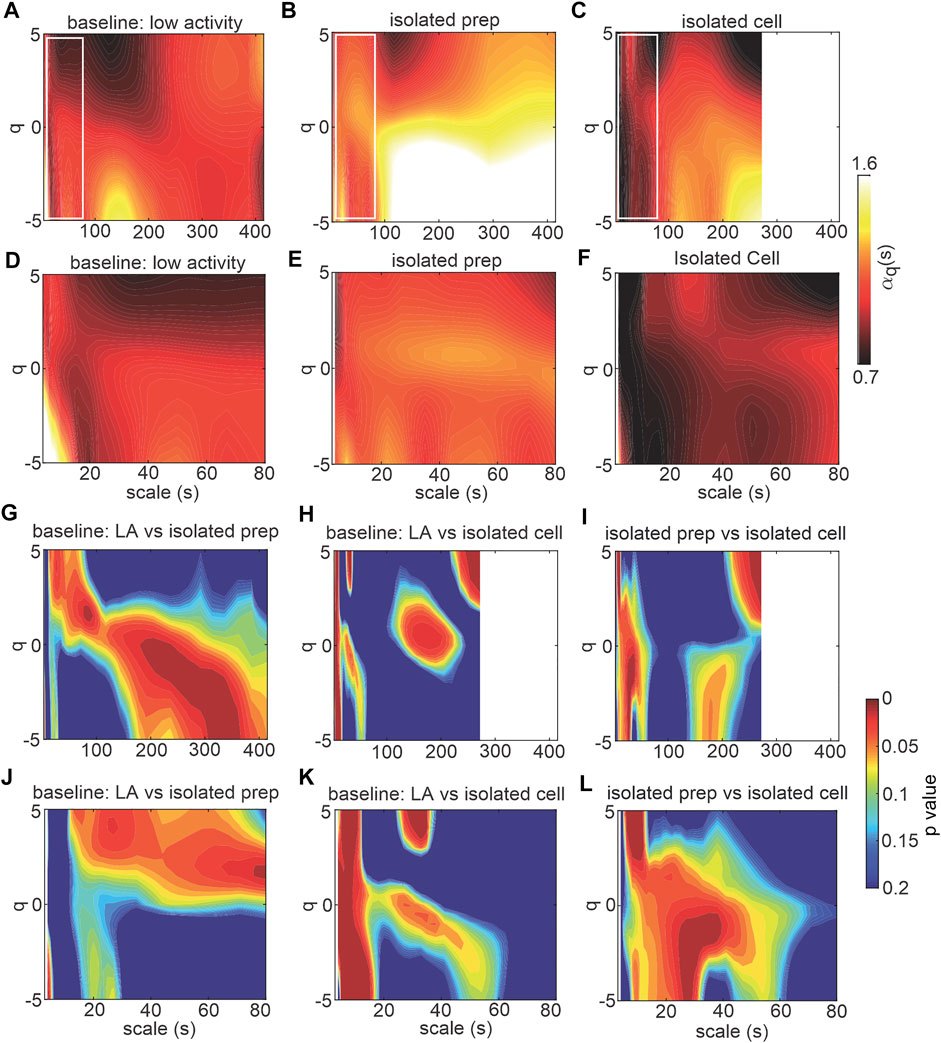
FIGURE 5. MSMFDFA of beating rate variability in isolated atrial preparations and isolated SAN myocytes. (A–C) heat maps for MSMFDFA scale exponents
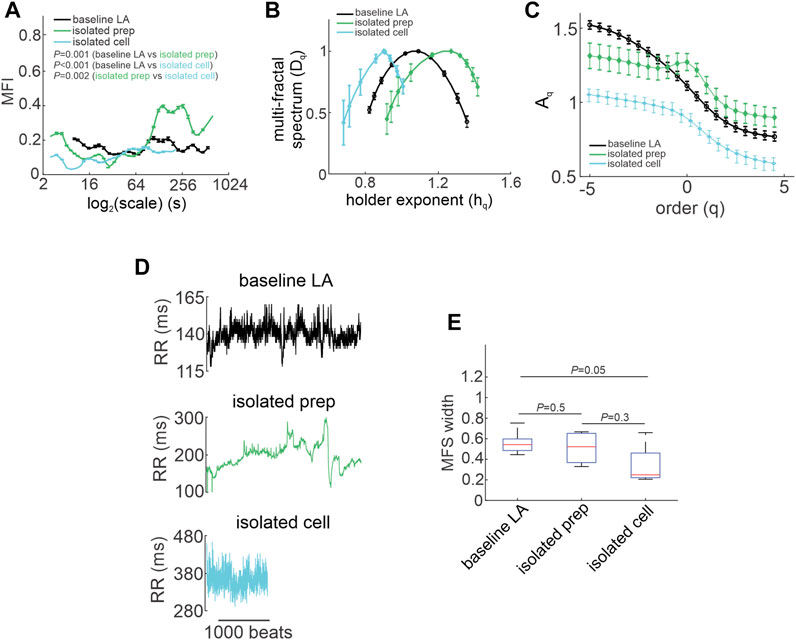
FIGURE 6. Quantification of multi-fractality in isolated atrial preparations and isolated SAN myocytes. (A) Multi-fractality index over
The multi fractal index was smaller in isolated atrial preparations (at scale<64 s) and in isolated SAN myocytes (at scale<250 s) compared to baseline low activity conditions in vivo (Figure 6A). This indicates less variability in scale exponents of the beating rate variability in isolated atrial preparations and SAN myocytes compared to those for HRV in vivo when ANS signaling is intact.
Consistent with the effects of combined injection of atropine and propranolol in vivo (Figure 4H) the multi-fractal spectrum of the beating rate variability signal in isolated atrial preparations and isolated SAN myocytes were each asymmetric with right tail truncations (Figure 6B). Isolated atrial preparations and SAN myocytes each displayed a leveling of the q-order multi-fractal exponent for negative q values (Figure 6C) indicating that in the absence of ANS signaling the q-order DFA is insensitive to the magnitude of local fluctuations with small magnitudes. Representative tachograms demonstrate larger variability in beat-to-beat intervals in isolated atrial preparations and isolated SAN myocytes compared to baseline low activity conditions in vivo (Figure 6D). Finally, the width of the multi-fractal spectrum was shorter in isolated SAN myocytes compared to baseline low activity in vivo and similar between isolated atrial preparations and baseline low activity conditions in vivo (Figure 6E).
The goal of the present study was to assess the nonlinear fractality of HRV in vivo and in isolated preparations (intact atrial preparations and SAN myocytes) in adult healthy mice. Furthermore, we sought to assess the contributions of changes in ANS activity as well as intrinsic SAN function to the fractal structure of the HRV. Initially, we used time and frequency domain analysis to demonstrate changes in HRV during ANS blockade in vivo as well as in isolated atrial preparations and isolated SAN myocytes, that are typical of those shown in previous studies (Moghtadaei et al., 2017; Dorey et al., 2020; Dorey et al., 2021; Dorey et al., 2022). However, nonlinear HRV analysis using MSMFDFA provided additional insight not possible with traditional approaches. This is because traditional time and frequency domain analyses give static values for HRV while MSMFDFA generates a wide spectrum of fractal structures that provide more comprehensive insights. Specifically, while traditional HRV measures can determine if HRV is reduced, MSMFDFA can determine the structure of the variability as well as fractal characteristics. MSMFDFA is also well suited to detecting more subtle differences between experimental conditions. For example, the differences between time and frequency domain HRV measures during high and low activity phases are relatively small; however, they clearly have different fractal spectra as shown in Figure 1.
Our results demonstrate that the fractal properties of the HRV signal vary from point to point along the ECG time series, leading to multi-fractality. We quantified the MSMFDFA scale exponents on a wide range of scale (3 − 415 s) and fractal order (-5<q < 5) and our results describe the dependance of the fractal properties with different orders on the time scale in which the multi-fractality is measured. This time scale is related to the ultra-low and very-low frequency band of the HRV signal, portions of which are not quantifiable using traditional frequency domain analysis.
Our study demonstrates that PNS blockade and complete ANS blockade in vivo each create relatively stable and less variable fractal structures in HRV resulting in weaker multi-fractality when compared to baseline (low activity) conditions in vivo. Similar observations were made in isolated atrial preparations and isolated SAN myocytes, confirming that these patterns are associated with the loss of ANS (particularly PNS) signaling to the heart. In healthy mice, in baseline low activity conditions, the multi-fractal spectrum of the HRV signal was symmetrical with relatively large variability in MSMFDFA scale exponents ranging from
Our study shows that when the ANS is blocked or absent, the short-range, low amplitude fractals that were present and strong in vivo in baseline low activity conditions are eliminated. This was evident in high activity conditions in vivo and after ANS blockade as well as in isolated atrial preparations and isolated SAN myocytes. This indicates that the presence of short range, low amplitude fractals is a marker of intact ANS signaling with normal sympatho-vagal balance.
We found that blocking PNS signaling with atropine induces high amplitude short range fractals (scales<15 s). This is consistent with previously reported studies in healthy humans showing increases in traditional DFA
Additionally, our data show that multi-fractal HRV is primarily associated with PNS modulation and less with SNS modulation. This suggests that, in addition to its well-known role in regulating HRV at high frequency time scales (Billman, 2011), the PNS also critically regulates the ultra-low and very-low frequency components of HRV. These findings are consistent with previous studies in healthy humans (Nunes Amaral et al., 2001; Struzik et al., 2004; Nakamura et al., 2016; Shaffer and Ginsberg, 2017). In agreement with this, we found that SNS blockade with propranolol did not significantly change the MSMFDFA spectrum, multi fractal index, and multi fractal spectrum of the HRV signal. The only substantial effect of propranolol was to eliminate low amplitude short-range fractals, which is consistent with previous studies in patients (Yamamoto and Hughson, 1994; Castiglioni et al., 2011).
Following combined injection of atropine and propranolol, we found that the HRV signal became fractal on all scales and orders investigated. The only exception was the short-range, low amplitude fractals that were eliminated after combined atropine and propranolol injection. As the MSMFDFA spectrum becomes more uniform with less variability, having fractals over the entire parameter space, multi-fractality strength was clearly reduced during ANS blockade. Consistent with this, previous studies demonstrate that fractal-like behavior remains in dogs with complete denervation (Li et al., 2008).
Consistent with the effects of ANS blockade in vivo, the present study demonstrates that MSMFDFA scale exponents were larger in isolated atrial preparations compared to baseline low activity conditions in vivo. In agreement with this, the statistical comparison of the isolated atrial preparation to baseline low activity in vivo illustrates differences in similar regions to those observed when comparing ANS blockade in vivo with baseline low activity in vivo. This is consistent with the observation of substantially steeper slopes in denervated hearts in previous studies (Bigger et al., 1996; Perkiomaki et al., 2000). In addition, the existence of self-similar scale-free correlation (i.e. fractals in action potential firing intervals in SAN myocytes regardless of ANS receptor stimulation) have been previously reported (Yang et al., 2021). Using MSMFDFA we also demonstrate fractals with a wide range of characteristics (i.e. strengths and amplitudes) in isolated SAN myocytes, isolated atrial preparations, and in intact hearts during ANS blockade. These data support the conclusion that fractal behavior is generated, at least in part, from the intrinsic properties of the SAN. However, in isolated SAN myocytes, the MSMFDFA scale exponents were smaller compared to both isolated atrial preparations and baseline low activity conditions in vivo. This is indicative of the importance of both ANS signaling and the intrinsic interactions between cells in the intact SAN in determining the power law slope. The smaller multi fractal index in the beating rates of isolated atrial preparations and isolated SAN myocytes (at scale<250 s) compared to heart rate at baseline in vivo indicates less variability in scale exponents in the absence of ANS activity. These findings are consistent with the effects of ANS blockade in vivo.
The asymmetric multi-fractal spectrum of the HRV signal with right truncation in isolated atrial preparations, isolated SAN myocytes and in vivo following ANS blockade demonstrates that the absence of ANS signaling causes a reduction in local HRV fluctuations with small magnitudes. On the other hand, the asymmetric multi-fractal spectrum of HRV after atropine injection with left truncation suggests blocking PNS signaling alone reduces high amplitude fluctuations in the HRV signal.
Based on our data, variability in the beating rate of SAN myocytes was random (i.e.
Some limitations of our study should be noted. Standard laboratory temperatures (∼22°C) could impose a cold stress on mice that may impact HR and HRV (Axsom et al., 2020). Future studies could investigate the impacts of temperature on MSMFDFA and HRV. In addition, SAN function can be affected by numerous neurotransmitters and peptides (Macdonald et al., 2020), some of which could impact HR and HR as assessed using MSMFDFA. Furthermore, the intracardiac nervous system and neurotransmitters produced within epicardial cardiac ganglia (Armour, 2007) could each have impacts on HR and HRV. These will be important areas for future study.
In summary, we have combined the use of multi-scale and multi-fractal detrended fluctuation analysis to assess the nonlinear dynamics of HRV in healthy mice. By conducting studies in vivo (with and without ANS blockade), in isolated atrial preparations, and in isolated SAN myocytes we were able to assess the contribution of the ANS and intrinsic SAN function to the complex, non-linear HRV dynamics in the ultra-low and very-low frequency bands. Our data demonstrate that the ANS and intrinsic SAN function each contribute to the multi-fractality of the HRV signal in healthy mice with increasing levels of structured variability as the level of organization increased from isolated cells to intact mice. Applying these approaches to mice in vivo and in isolated preparations enabled important insight into the regulation of complex, non-linear HR dynamics. Our data demonstrate the importance of variability in MSMFDFA scale exponents (in addition to HRV itself) for the maintenance of a healthy cardiovascular system. These analyses and approaches advance our understanding of the basis for HRV in the very-low and ultra-low frequency ranges in healthy mice and establishes an effective approach for assessing these properties across multiple scales, which is essential for a complex signal such as HR. As HR regulation shows trans-species self-similarity (Tagirova Sirenko et al., 2021) the findings and approaches identified in the present study could be applied and compared with future studies in humans. Future studies will also be able to apply MSMFDFA analysis to mouse models of disease or aging in order to better understand the roles of the ANS and intrinsic SAN function in nonlinear HRV dynamics in the ultra-low and very-low frequency bands in these conditions.
The original contributions presented in the study are included in the article/supplementary material, further inquiries can be directed to the corresponding author.
The animal study was reviewed and approved by University of Calgary Animal Care and Use Committee.
MM and RR contributed to conception and experimental design. MM and TD performed and analyzed all experiments. MM, TD, and RR prepared the figures, wrote the manuscript and edited the final version of the manuscript. All authors approved the final manuscript.
This work as supported by the Canadian Institutes of Health Research (PJT166105, PJT180474) and the Heart and Stroke Foundation of Canada (G-18-0022148) to RAR. TWD holds a Canadian Institutes of Health Research Doctoral Research Award.
The authors declare that the research was conducted in the absence of any commercial or financial relationships that could be construed as a potential conflict of interest.
All claims expressed in this article are solely those of the authors and do not necessarily represent those of their affiliated organizations, or those of the publisher, the editors and the reviewers. Any product that may be evaluated in this article, or claim that may be made by its manufacturer, is not guaranteed or endorsed by the publisher.
Ahammer H., Scherubel S., Arnold R., Zorn-Pauly K., Pelzmann B. (2013). Beat to beat variability of embryonic chick heart cells under septic conditions: Application and evaluation of entropy as well as fractal measures. Annu. Int. Conf. IEEE Eng. Med. Biol. Soc. 2013, 5566–5569. doi:10.1109/EMBC.2013.66108112013.6610811
Armour J. A. (2007). The little brain on the heart. Cleve. Clin. J. Med. 1 (74), S48–S51. doi:10.3949/ccjm.74.suppl_1.s48
Axsom J. E., Nanavati A. P., Rutishauser C. A., Bonin J. E., Moen J. M., Lakatta E. G. (2020). Acclimation to a thermoneutral environment abolishes age-associated alterations in heart rate and heart rate variability in conscious, unrestrained mice. Geroscience 42, 217–232. doi:10.1007/s11357-019-00126-7
Behar J. A., Rosenberg A. A., Weiser-Bitoun I., Shemla O., Alexandrovich A., Konyukhov E., et al. (2018). PhysioZoo: A novel open access platform for heart rate variability analysis of mammalian electrocardiographic data. Front. Physiol. 9, 1390. doi:10.3389/fphys.2018.01390
Bigger J. T., Steinman R. C., Rolnitzky L. M., Fleiss J. L., Albrecht P., Cohen R. J. (1996). Power law behavior of RR-interval variability in healthy middle-aged persons, patients with recent acute myocardial infarction, and patients with heart transplants. Circulation 93, 2142–2151. doi:10.1161/01.cir.93.12.2142
Billman G. E. (2011). Heart rate variability - a historical perspective. Front. Physiol. 2, 86. doi:10.3389/fphys.2011.00086
Bychkov R., Juhaszova M., Tsutsui K., Coletta C., Stern M. D., Maltsev V. A., et al. (2020). Synchronized cardiac impulses emerge from heterogeneous local calcium signals within and among cells of pacemaker tissue. JACC. Clin. Electrophysiol. 6, 907–931. doi:10.1016/j.jacep.2020.06.022
Castiglioni P., Faini A. (2019). A fast DFA algorithm for multifractal multiscale Analysis of physiological time series. Front. Physiol. 10, 115. doi:10.3389/fphys.2019.00115
Castiglioni P., Lazzeroni D., Brambilla V., Coruzzi P., Faini A. (2017). Multifractal multiscale dfa of cardiovascular time series: Differences in complex dynamics of systolic blood pressure, diastolic blood pressure and heart rate. Annu. Int. Conf. IEEE Eng. Med. Biol. Soc. 2017, 3477–3480. doi:10.1109/EMBC.2017.80376052017.8037605
Castiglioni P., Lazzeroni D., Coruzzi P., Faini A. (2018). Multifractal-multiscale analysis of cardiovascular signals: A DFA-based characterization of blood pressure and heart rate complexity by gender. Complexity 2018, 1–14. doi:10.1155/2018/4801924
Castiglioni P., Parati G., Di Rienzo M., Carabalona R., Cividjian A., Quintin L. (2011). Scale exponents of blood pressure and heart rate during autonomic blockade as assessed by detrended fluctuation analysis. J. Physiol. 589, 355–369. doi:10.1113/jphysiol.2010.196428
Constantinescu V., Matei D., Costache V., Cuciureanu D., Arsenescu-Georgescu C. (2018). Linear and nonlinear parameters of heart rate variability in ischemic stroke patients. Neurol. Neurochir. Pol. 52, 194–206. doi:10.1016/j.pjnns.2017.10.002
Costa M. D., Davis R. B., Goldberger A. L. (2017). Heart rate fragmentation: A symbolic dynamical approach. Front. Physiol. 8, 827. doi:10.3389/fphys.2017.00827
Dini F. L., Guarini G., Morrone D., Marzilli M. (2012). The second law of thermodynamics and the heart. Future Cardiol. 8, 697–706. doi:10.2217/fca.12.45
Dorey T. W., Jansen H. J., Moghtadaei M., Jamieson K. L., Rose R. A. (2021). Impacts of frailty on heart rate variability in aging mice: Roles of the autonomic nervous system and sinoatrial node. Heart rhythm. 18, 1999–2008. doi:10.1016/j.hrthm.2021.07.069
Dorey T. W., Mackasey M., Jansen H. J., Mcrae M. D., Bohne L. J., Liu Y., et al. (2022). Natriuretic peptide receptor B maintains heart rate and sinoatrial node function via cyclic GMP-mediated signalling. Cardiovasc. Res. 118, 1917–1931. doi:10.1093/cvr/cvab245
Dorey T. W., Moghtadaei M., Rose R. A. (2020). Altered heart rate variability in angiotensin II-mediated hypertension is associated with impaired autonomic nervous system signaling and intrinsic sinoatrial node dysfunction. Heart rhythm. 17, 1360–1370. doi:10.1016/j.hrthm.2020.03.014
Gao J., Gurbaxani B. M., Hu J., Heilman K. J., Emanuele Ii V. A., Lewis G. F., et al. (2013). Multiscale analysis of heart rate variability in non-stationary environments. Front. Physiol. 4, 119. doi:10.3389/fphys.2013.00119
Gieraltowski J., Zebrowski J. J., Baranowski R. (2012). Multiscale multifractal analysis of heart rate variability recordings with a large number of occurrences of arrhythmia. Phys. Rev. E Stat. Nonlin. Soft Matter Phys. 85 (2), 021915. doi:10.1103/PhysRevE.85.021915
Guzik P., Piskorski J., Krauze T., Schneider R., Wesseling K. H., Wykretowicz A., et al. (2007). Correlations between the Poincare plot and conventional heart rate variability parameters assessed during paced breathing. J. Physiol. Sci. 57, 63–71. doi:10.2170/physiolsci.RP005506
Hillebrand S., Gast K. B., De Mutsert R., Swenne C. A., Jukema J. W., Middeldorp S., et al. (2013). Heart rate variability and first cardiovascular event in populations without known cardiovascular disease: meta-analysis and dose-response meta-regression. Europace 15, 742–749. doi:10.1093/europace/eus341
Ihlen E. A. (2012). Introduction to multifractal detrended fluctuation analysis in matlab. Front. Physiol. 3, 141. doi:10.3389/fphys.2012.00141
Ivanov P. C., Amaral L. A., Goldberger A. L., Havlin S., Rosenblum M. G., Struzik Z. R., et al. (1999). Multifractality in human heartbeat dynamics. Nature 399, 461–465. doi:10.1038/20924
Kantelhardt J. W., Zschiegner S. A., Koscielny-Bunde E., Havlin S., Bunde A., Stanley H. E. (2002). Multifractal detrended fluctuation analysis of nonstationary time series. Phys. A Stat. Mech. its Appl. 316, 87–114. doi:10.1016/s0378-4371(02)01383-3
Lakatta E. G., Maltsev V. A., Vinogradova T. M. (2010). A coupled SYSTEM of intracellular Ca2+ clocks and surface membrane voltage clocks controls the timekeeping mechanism of the heart's pacemaker. Circ. Res. 106, 659–673. doi:10.1161/CIRCRESAHA.109.206078
Li D., Chiang A. Y., Clawson C. A., Main B. W., Leishman D. J. (2008). Heartbeat dynamics in adrenergic blocker treated conscious beagle dogs. J. Pharmacol. Toxicol. Methods 58, 118–128. doi:10.1016/j.vascn.2008.05.005
Lombardi F., Stein P. K. (2011). Origin of heart rate variability and turbulence: An appraisal of autonomic modulation of cardiovascular function. Front. Physiol. 2, 95. doi:10.3389/fphys.2011.00095
Macdonald E. A., Rose R. A., Quinn T. A. (2020). Neurohumoral control of sinoatrial node activity and heart rate: Insight from experimental models and findings from humans. Front. Physiol. 11, 170. doi:10.3389/fphys.2020.00170
Mackasey M., Egom E. E., Jansen H. J., Hua R., Moghtadaei M., Liu Y., et al. (2018). Natriuretic peptide receptor-C protects against angiotensin II-mediated sinoatrial node disease in mice. JACC. Basic Transl. Sci. 3, 824–843. doi:10.1016/j.jacbts.2018.08.004
Maity A. K., Pratihar R., Mitra A., Dey S., Agrawal V., Sanyal S., et al. (2015). Multifractal Detrended Fluctuation Analysis of alpha and theta EEG rhythms with musical stimuli. Chaos, Solit. Fractals 81, 52–67. doi:10.1016/j.chaos.2015.08.016
Makowiec D., Gala Ska R., Dudkowska A., Rynkiewicz A., Zwierz M. (2006). Long-range dependencies in heart rate signals - revisited. Phys. A Stat. Mech. its Appl. 369, 632–644. doi:10.1016/j.physa.2006.02.038
Mangoni M. E., Nargeot J. (2008). Genesis and regulation of the heart automaticity. Physiol. Rev. 88, 919–982. doi:10.1152/physrev.00018.2007
Mizobuchi A., Osawa K., Tanaka M., Yumoto A., Saito H., Fuke S. (2021). Detrended fluctuation analysis can detect the impairment of heart rate regulation in patients with heart failure with preserved ejection fraction. J. Cardiol. 77, 72–78. doi:10.1016/j.jjcc.2020.07.027
Moen J. M., Matt M. G., Ramirez C., Tarasov K. V., Chakir K., Tarasova Y. S., et al. (2019). Overexpression of a neuronal type Adenylyl cyclase (type 8) in sinoatrial node markedly impacts heart rate and rhythm. Front. Neurosci. 13, 615. doi:10.3389/fnins.2019.00615
Moghtadaei M., Langille E., Rafferty S. A., Bogachev O., Rose R. A. (2017). Altered heart rate regulation by the autonomic nervous system in mice lacking natriuretic peptide receptor C (NPR-C). Sci. Rep. 7, 17564. doi:10.1038/s41598-017-17690-7
Nakamura T., Kiyono K., Wendt H., Abry P., Yamamoto Y. (2016). Multiscale analysis of intensive longitudinal biomedical signals and its clinical applications. Proc. IEEE 104, 242–261. doi:10.1109/jproc.2015.2491979
Nunes Amaral L. A., Ivanov P. C., Aoyagi N., Hidaka I., Tomono S., Goldberger A. L., et al. (2001). Behavioral-independent features of complex heartbeat dynamics. Phys. Rev. Lett. 86, 6026–6029. doi:10.1103/PhysRevLett.86.6026
Papaioannou V. E., Verkerk A. O., Amin A. S., De Bakker J. M. (2013). Intracardiac origin of heart rate variability, pacemaker funny current and their possible association with critical illness. Curr. Cardiol. Rev. 9, 82–96. doi:10.2174/157340313805076359
Perkiomaki J. S., Makikallio T. H., Huikuri H. V. (2005). Fractal and complexity measures of heart rate variability. Clin. Exp. Hypertens. 27, 149–158. doi:10.1081/ceh-200048742
Perkiomaki J. S., Makikallio T. H., Huikuri H. V. (2000). Nonlinear analysis of heart rate variability: Fractal and complexity measures of heart rate behavior. Ann. Noninvasive Electrocardiol. 5, 179–187. doi:10.1111/j.1542-474x.2000.tb00384.x
Perkiomaki J. S., Zareba W., Badilini F., Moss A. J. (2002). Influence of atropine on fractal and complexity measures of heart rate variability. Ann. Noninvasive Electrocardiol. 7, 326–331. doi:10.1111/j.1542-474x.2002.tb00181.x
Richman J. S., Moorman J. R. (2000). Physiological time-series analysis using approximate entropy and sample entropy. Am. J. Physiol. Heart Circ. Physiol. 278, H2039–H2049. doi:10.1152/ajpheart.2000.278.6.H2039
Rose R. A., Lomax A. E., Kondo C. S., Anand-Srivastava M. B., Giles W. R. (2004). Effects of C-type natriuretic peptide on ionic currents in mouse sinoatrial node: A role for the NPR-C receptor. Am. J. Physiol. Heart Circ. Physiol. 286, H1970–H1977. doi:10.1152/ajpheart.00893.2003
Rosenberg A. A., Weiser-Bitoun I., Billman G. E., Yaniv Y. (2020). Signatures of the autonomic nervous system and the heart's pacemaker cells in canine electrocardiograms and their applications to humans. Sci. Rep. 10, 9971. doi:10.1038/s41598-020-66709-z
Sassi R., Cerutti S., Lombardi F., Malik M., Huikuri H. V., Peng C. K., et al. (2015). Advances in heart rate variability signal analysis: Joint position statement by the e-cardiology ESC working group and the European heart rhythm association co-endorsed by the asia pacific heart rhythm society. Europace 17, 1341–1353. doi:10.1093/europace/euv015
Sassi R., Signorini M. G., Cerutti S. (2009). Multifractality and heart rate variability. Chaos 19 (2), 028507. doi:10.1063/1.3152223
Shaffer F., Ginsberg J. P. (2017). An overview of heart rate variability metrics and norms. Front. Public Health 5, 258. doi:10.3389/fpubh.2017.00258
Shaffer F., Mccraty R., Zerr C. L. (2014). A healthy heart is not a metronome: An integrative review of the heart's anatomy and heart rate variability. Front. Psychol. 5, 1040. doi:10.3389/fpsyg.2014.01040
Struzik Z. R., Hayano J., Sakata S., Kwak S., Yamamoto Y. (2004). 1/f scaling in heart rate requires antagonistic autonomic control. Phys. Rev. E Stat. Nonlin. Soft Matter Phys. 70 (5), 050901. doi:10.1103/PhysRevE.70.050901
Tagirova Sirenko S., Tsutsui K., Tarasov K. V., Yang D., Wirth A. N., Maltsev V. A., et al. (2021). Self-similar synchronization of calcium and membrane potential transitions during action potential cycles predict heart rate across species. JACC. Clin. Electrophysiol. 7, 1331–1344. doi:10.1016/j.jacep.2021.02.016
Tulppo M. P., Makikallio T. H., Seppanen T., Shoemaker K., Tutungi E., Hughson R. L., et al. (2001). Effects of pharmacological adrenergic and vagal modulation on fractal heart rate dynamics. Clin. Physiol. 21, 515–523. doi:10.1046/j.1365-2281.2001.00344.x
Xia J., Shang P., Wang J. (2013). Estimation of local scale exponents for heartbeat time series based on DFA. Nonlinear Dyn. 74, 1183–1190. doi:10.1007/s11071-013-1033-2
Yamamoto Y., Hughson R. L. (1994). On the fractal nature of heart rate variability in humans: Effects of data length and beta-adrenergic blockade. Am. J. Physiol. 266, R40–R49. doi:10.1152/ajpregu.1994.266.1.R40
Yang D., Morrell C. H., Lyashkov A. E., Tagirova Sirenko S., Zahanich I., Yaniv Y., et al. (2021). Ca(2+) and membrane potential transitions during action potentials are self-similar to each other and to variability of AP firing intervals across the broad physiologic range of AP intervals during autonomic receptor stimulation. Front. Physiol. 12, 612770. doi:10.3389/fphys.2021.612770
Yaniv Y., Ahmet I., Tsutsui K., Behar J., Moen J. M., Okamoto Y., et al. (2016). Deterioration of autonomic neuronal receptor signaling and mechanisms intrinsic to heart pacemaker cells contribute to age-associated alterations in heart rate variability in vivo. Aging Cell 15, 716–724. doi:10.1111/acel.12483
Yaniv Y., Lyashkov A. E., Lakatta E. G. (2014). Impaired signaling intrinsic to sinoatrial node pacemaker cells affects heart rate variability during cardiac disease. J. Clin. Trials 4, 152. doi:10.4172/2167-0870.1000152
Yaniv Y., Lyashkov A. E., Lakatta E. G. (2013). The fractal-like complexity of heart rate variability beyond neurotransmitters and autonomic receptors: Signaling intrinsic to sinoatrial node pacemaker cells. Cardiovasc. Pharm. Open Access 2, 111. doi:10.4172/2329-6607.1000111
Keywords: heart rate, autonomic nervous system, heart rate variability, sinoatrial node, fractality, detrended fluctuation analysis
Citation: Moghtadaei M, Dorey TW and Rose RA (2022) Evaluation of non-linear heart rate variability using multi-scale multi-fractal detrended fluctuation analysis in mice: Roles of the autonomic nervous system and sinoatrial node. Front. Physiol. 13:970393. doi: 10.3389/fphys.2022.970393
Received: 15 June 2022; Accepted: 18 August 2022;
Published: 27 September 2022.
Edited by:
Victor A. Maltsev, National Institute on Aging (NIH), United StatesReviewed by:
Edward Lakatta, National Institute on Aging (NIH), United StatesCopyright © 2022 Moghtadaei, Dorey and Rose. This is an open-access article distributed under the terms of the Creative Commons Attribution License (CC BY). The use, distribution or reproduction in other forums is permitted, provided the original author(s) and the copyright owner(s) are credited and that the original publication in this journal is cited, in accordance with accepted academic practice. No use, distribution or reproduction is permitted which does not comply with these terms.
*Correspondence: Robert A. Rose, cm9iZXJ0LnJvc2VAdWNhbGdhcnkuY2E=
Disclaimer: All claims expressed in this article are solely those of the authors and do not necessarily represent those of their affiliated organizations, or those of the publisher, the editors and the reviewers. Any product that may be evaluated in this article or claim that may be made by its manufacturer is not guaranteed or endorsed by the publisher.
Research integrity at Frontiers
Learn more about the work of our research integrity team to safeguard the quality of each article we publish.