
94% of researchers rate our articles as excellent or good
Learn more about the work of our research integrity team to safeguard the quality of each article we publish.
Find out more
ORIGINAL RESEARCH article
Front. Physiol., 19 August 2022
Sec. Medical Physics and Imaging
Volume 13 - 2022 | https://doi.org/10.3389/fphys.2022.940140
 Vidhya Vijayakrishnan Nair1
 Brianna R. Kish1
 Ben Inglis2
 Ho-Ching (Shawn) Yang3
 Adam M. Wright1
 Yu-Chien Wu4
 Xiaopeng Zhou5
 Amy J. Schwichtenberg6
 Yunjie Tong1*
Cerebrospinal fluid (CSF) movement through the pathways within the central nervous system is of high significance for maintaining normal brain health and function. Low frequency hemodynamics and respiration have been shown to drive CSF in humans independently. Here, we hypothesize that CSF movement may be driven simultaneously (and in synchrony) by both mechanisms and study their independent and coupled effects on CSF movement using novel neck fMRI scans. Caudad CSF movement at the fourth ventricle and hemodynamics of the major neck blood vessels (internal carotid arteries and internal jugular veins) was measured from 11 young, healthy volunteers using novel neck fMRI scans with simultaneous measurement of respiration. Two distinct models of CSF movement (1. Low-frequency hemodynamics and 2. Respiration) and possible coupling between them were investigated. We show that the dynamics of brain fluids can be assessed from the neck by studying the interrelationships between major neck blood vessels and the CSF movement in the fourth ventricle. We also demonstrate that there exists a cross-frequency coupling between these two separable mechanisms. The human CSF system can respond to multiple coupled physiological forces at the same time. This information may help inform the pathological mechanisms behind CSF movement-related disorders.
Cerebrospinal Fluid (CSF), an ultrafiltrate of blood plasma, flows through the ventricles of the human brain and the subarachnoid spaces of the cranium and spine. Predominantly secreted by the choroid plexuses, CSF is known to perform several critical functions essential for brain health and function (Sakka, Coll and Chazal, 2011). In addition to offering mechanical protection and support to the brain and spinal cord, it also maintains the brain homeostasis by transporting nutrients, hormones and other immunologic factors through the central nervous system (CNS) (Spector and Johanson, 2007; Schwartz and Baruch, 2012; Spector, Robert Snodgrass and Johanson, 2015).
The flow of CSF in the CNS garnered increased interest after the relatively recent proposal of the glymphatic system. According to this model, the flow of CSF through the brain’s perivascular pathways and further exchange with the interstitial fluid (ISF) is instrumental in removing the metabolic waste products of the brain (Iliff et al., 2013a; Jessen et al., 2015). Furthermore, emerging evidence has also linked dysfunction of CSF pathways to increased amyloid-beta concentrations in the context of neurodegenerative disorders such as Alzheimer’s disease (Ueno et al., 2014; Han et al., 2021) and elevated tau concentrations with chronic traumatic encephalopathy (Puvenna et al., 2016).
Despite the crucial physiological roles and clinical significance of CSF dynamics, the exact driving forces behind CSF flow in humans are still poorly understood. Cardiac pulsations were the first physiological mechanism to be considered as a potential motive force behind CSF flow. Based on this model, the intracranial arterial expansion due to the arrival of cardiac pulsations leads to brain expansion which in turn compresses the brain ventricles resulting in caudally directed CSF flow from the brain into the spinal canal through the brain ventricles (Greitz et al., 1992). Observations of bidirectional pulsatile CSF flow (caudad and cephalad) dependent on the cardiac cycle, at the cervical level, have also been reported using conventional cardiac gated phase contrast Magnetic Resonance Imaging (MRI) based measurements (Enzmann and Pelc, 1993; Bhadelia, Bogdan and Wolpert, 1995). Several animal model studies have also explained a brain-wide perivascular pathway that aids the exchange between CSF and ISF for interstitial waste clearance, primarily driven by cerebral arterial pulsations (Iliff et al., 2013a; Iliff et al., 2013b; Xie et al., 2013). A similar pulsation driven absorption of CSF by the brain capillaries have also been reported in humans (Greitz and Hannerz, 1996; Greitz, 2004). However, recent studies based on mathematical modelling argue that these cardiac pulsations alone are too weak to drive this clearance (Asgari, De Zélicourt and Kurtcuoglu, 2016; Diem et al., 2017). A recent study on awake mice has reported spontaneous contractions and relaxations of the vascular smooth muscle cells in the low frequency range (<0.1 Hz), referred to as vasomotion, to be the principal driver for this perivascular clearance pathway (van Veluw et al., 2020).
Other mechanisms are also currently debated in the literature as the motive force propelling CSF flow in humans. Studies using different forms of phase contrast MRI have identified respiration as a major regulator of CSF flow (Yamada et al., 2013; Chen et al., 2015; Dreha-Kulaczewski et al., 2015, 2017). Specifically, Dreha-Kulaczewski et al., quantified a net upward flow of CSF into the cranium from the spinal canal and its relation to the venous outflow, during a deep breathing regimen. More recently, a functional MRI (fMRI) study by Fultz et al. (2019) reported coupling between cranially directed CSF flow in the fourth ventricle and cerebral hemodynamic signals in the low frequency range (<0.1 Hz) during non-rapid eye movement (NREM) sleep. Expanding on this line of work, we recently proposed a biomechanical model of CSF dynamics, suggesting low frequency brain hemodynamic signals (0.01–0.1 Hz) as the fundamental driving force for CSF movement in both directions (i.e., cranial and caudal), in the awake state (Yang et al., 2021).
In this study, we use fMRI to explore the different mechanisms driving the CSF movement. We hypothesize that more than one mechanism simultaneously (and in synchrony) drives the CSF movement: 1) A hemodynamic mechanism that drives CSF movement in the low-frequency range (0.01–0.1 Hz), and 2) respiration, which explains CSF movement in the respiratory frequency range (0.2–0.4 Hz). For this study, we conducted neck fMRI scans (instead of typical brain scans) for the following reasons: 1) All the brain fluids (blood, CSF) are transported into/out of the brain through the neck so that the flow dynamics in the neck offers a simple, direct way to assess the input/output fluid dynamics of the brain, as well as their relationships; 2) Respiration has been shown to directly and mechanically affect the large draining veins in the neck [i.e., inspiration leading to collapse of the internal jugular veins (IJV)], in turn leading to internal pressure changes in the brain. Therefore, measuring these signals in the neck and their relationships to respiration are crucial. Furthermore, we explore the cross-frequency coupling between respiration and low-frequency oscillations (LFOs), particularly in the context of the observed CSF dynamics.
This study included a total of 11 healthy participants (7 females and 4 males) aged 20–25 (21.4 ± 1.4) years. The study was approved by Purdue University’s Human Research Protection Plan (IRB-2020-1329) and was conducted in accordance with application of Belmont Report principles (Respect for Persons, Beneficence, and Justice) and federal regulations 45 CFR 46, 21 CFR 50, 56. Written informed consent was obtained from all participants.
The unique feature of the neck fMRI scan (Yang et al., 2021) is used in this study to explore different mechanisms that contribute to CSF dynamics. Here we investigate two distinct models based on the classic Monro-Kellie doctrine which stipulates that the total volume of brain parenchyma, CSF, and intracranial blood remains constant: 1) a hemodynamic model in the low frequency range: 0.01–0.1 Hz and 2) a respiration model in the respiratory frequency range: 0.2–0.4 Hz. The Monroe-Kellie doctrine implies that a change in volume of any one brain component would lead to a compensatory change in volume of at least one of the other components (Mokri, 2001).
For the hemodynamic model, we hypothesize that the net intravascular blood volume changes in the low-frequency range in both the arteries (main contribution) and veins are the dominant forces moving the CSF. As found previously, an intravascular blood volume change initially detected in Internal Carotid Arteries (ICAs) can be detected later in the IJVs (Tong et al., 2018). Since ICAs are the main blood supply to the brain, the arterial volume changes in ICAs precede the cerebral blood volume (CBV) changes in the brain tissue, before eventually producing a net Blood oxygen level dependent (BOLD) signal change in the IJVs. (Note that the ICAs produce a BOLD signal change, but for normal oxygen saturation >98% the arterial blood is more diamagnetic than water and this produces an inverted BOLD signal compared to the later positive BOLD signal in the IJVs.) The cumulative effects of CBV changes within the brain parenchyma (i.e., net CBV) exert forces on the lateral ventricle walls. As a result, the CSF will be forced in/out via the fourth ventricle (Yang et al., 2021). In parallel, the CBV change in arteries and arterioles leads to passive blood volume and flow changes in the draining veins (Supplementary Note S1). The latter evokes detectable BOLD signal in the IJVs a few seconds later.
Based on the model (Figure 1), we expect the following: 1) dilation of the ICAs leads to 2) a CBV increase in the brain which causes 3) a caudally directed CSF movement at the fourth ventricle and leads to 4) a BOLD signal change in IJVs. Since the low frequency blood volume changes progress at the speed of the blood flow (Yao et al., 2019), the delays between ICA signal and CSF movement in the LFO range (0.01–0.1 Hz) should be around 5–6 s in a healthy subject.
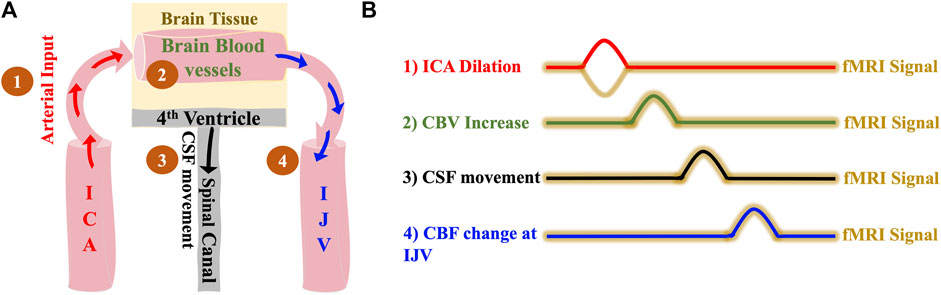
FIGURE 1. The hemodynamic model of CSF dynamics. (A) Model illustrating changes in vessel volume dynamics in the LFO range sequentially starting with 1) Dilation of ICA which leads to 2) Expansion of cerebral blood vessels which finally leads to 3) Caudally directed CSF movement out of the brain and 4) with the same LFOs in the brain travelling to the IJVs with the blood flow (B) Illustrative time series representation of changes in vessel volume dynamics that leads to caudally directed CSF movement and corresponding fMRI signals. The crests in the representation indicates positive change/increase. ICA, internal carotid artery; IJV, internal jugular vein; CSF, cerebrospinal fluid; fMRI, functional Magnetic Resonance Imaging.
Respiration has recently been identified as a major driver of CSF flow, in the context of Monro-Kellie hypothesis. Dreha-Kulaczewski et al. (2017) reported CSF flows upward from the spinal canal in the cranial direction almost instantaneously to compensate for the deep inspiration-induced venous outflow of blood from the brain through the draining veins in the neck (Supplementary Figure S1).
It is well known that the expiration phase causes the intrathoracic volume to decrease and the intrathoracic pressure to increase, leading to reduced venous return to the heart (Schrauben et al., 2015). In this model, we attempt to validate this mechanism using fMRI data acquired using novel neck scans. During inspiration, decreasing intrathoracic pressure causes increased venous return. As illustrated in Figure 2, the increase in intrathoracic pressure leads to the following: the venous drainage from the cerebral blood vessels into the IJVs decreases, causing cerebral blood vessels to expand (Schrauben et al., 2015) and thereby leading to an increase in the CBV. In addition, the undisturbed arterial input from ICAs might also contribute to this increase in CBV. This then, as per the Monro-Kellie doctrine, immediately leads to a compensatory movement of CSF from the brain into the spinal canal through the fourth ventricle. It is to be noted here that the CSF flow, according to this model, happens only with a change in intrathoracic volume/pressure.
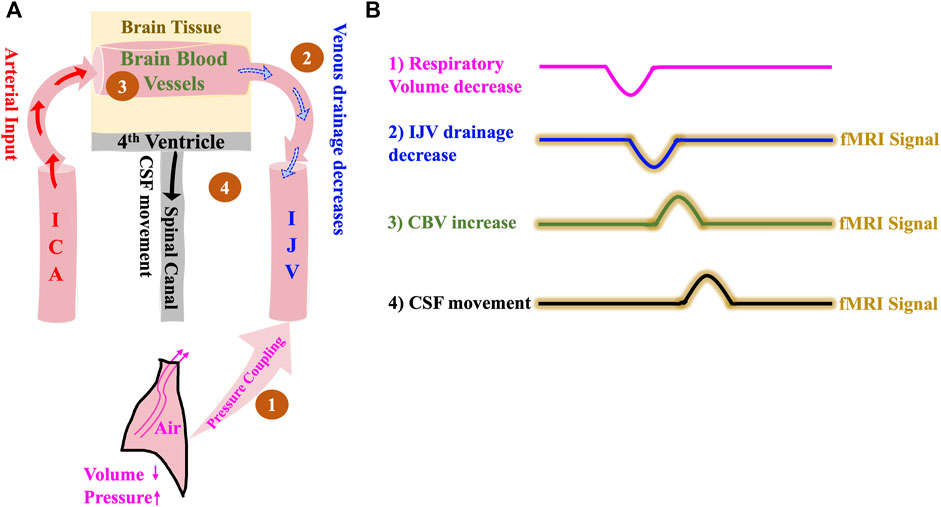
FIGURE 2. The Respiration model of CSF dynamics. (A) Model illustrating how a negative change in intrathoracic volume/positive change in intrathoracic pressure affect CSF dynamics sequentially starting with 1) Pressure coupling to IJV which leads to 2) Reduction in venous drainage in the IJV which in turn leads to 3) Increase in the volume of intracranial blood and finally results in 4) Caudally directed CSF movement out of the brain. (B) Illustrative time series representation of intrathoracic pressure-change derived mechanism of CSF flow and corresponding fMRI signals. The crests and troughs in the representation indicates positive change/increase and negative change/decrease respectively. ICA, internal carotid artery; IJV, internal jugular vein; CSF, cerebrospinal fluid; fMRI, functional Magnetic Resonance Imaging.
Based on the model (Figure 2), we expect the following: 1) Intrathoracic pressure increase (volume decrease) during expiration causes 2) an IJV drainage decrease which leads to 3) a CBV increase and consequent parenchyma pressure increase that invokes 4) a caudally directed CSF movement at fourth ventricle. We expect that the delays between the detectable signals in the respiratory frequency range (0.2–0.4 Hz) will be no more than 1–2 s, since the venous drainage slows down almost immediately with expiration-related pressure change (Schrauben et al., 2015).
A pictorial description of the experimental design and data analysis stream is given in Figure 3.
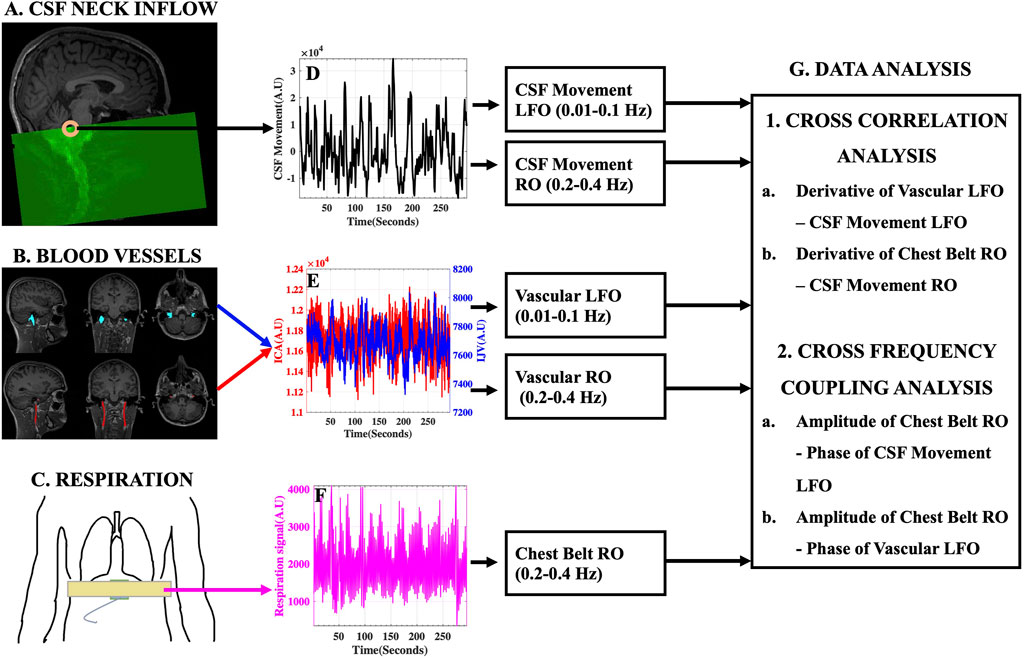
FIGURE 3. Experimental Design and Data Analysis Stream. (A) Typical fMRI scan design illustrating the capture of CSF movement into the neck scan volume utilizing inflow effect and the (D) corresponding raw CSF movement signal. (B) Large blood vessels of the neck [Left and Right ICA (red) and IJV (blue)] identified and overlaid on structural T1-weighted image and the (E) corresponding ICA (red) and IJV (blue) fMRI signals. (C) Placement of MRI chest belt and the corresponding (F) Raw chest-belt respiratory signal. LFOs and ROs were extracted from CSF and blood vessels and used in the (G) data analysis techniques to study the effects on CSF dynamics. AU, Arbitrary Units; ICA, internal carotid artery; IJV, internal jugular vein; CSF, cerebrospinal fluid; LFO, low frequency oscillations (0.01–0.1 Hz); RO, respiratory oscillations (0.2–0.4 Hz).
All participants were scanned using a 3T SIEMENS MRI scanner (Magnetom Prisma, Siemens Medical Solutions, Erlangen, Germany) with a 64-channel head coil. Structural T1-weighted MPRAGE (Magnetization Prepared Rapid Acquisition Gradient Echo) images were acquired with the following parameters: TR/TE: 2300/2.26 ms, 192 slices per slab, flip angle: 8°, resolution: 1.0 mm × 1.0 mm × 1.0 mm. Structural 3D SPACE (Sampling Perfection with Application optimized Contrasts using different flip angle Evolution) T2-weighted images were acquired with the following parameters: TR/TE: 2800/409 ms, 208 slices per slab, resolution: 0.8 mm × 0.8 mm × 0.7 mm. Resting state functional MRI (fMRI) scans of the neck were acquired using: FOV = 230 mm, acquisition matrix = 92 × 92, 48 slices, voxel size = 2.5 mm × 2.5 mm × 2.5 mm, TR/TE = 960/30.6 ms, echo-spacing = 0.51 ms, flip angle = 35°, multiband acceleration factor = 8, multi-slice mode: interleaved. TR was changed to 440 ms in three participants and to 480 ms in two of them. All participants wore a chest belt (Figure 3C) to measure chest motion.
The fMRI scans of the neck region were designed to capture the caudally directed CSF movement utilizing the inflow effect (Fultz et al., 2019). As illustrated in Figure 3A, by placing the top edge of the scan volume appropriately at the fourth ventricle, an intense CSF flow signal directed into the scan volume can be obtained. Consequently, the slice of interest at the fourth ventricle, was always acquired first in the scan. We demonstrate that this intense single-voxel CSF signal from the edge slice is predominantly of inflow effect origin by comparing it with similar single-voxel signals from the subsequent lower slices in the neck scan volume (Refer to Supplementary Figure S2). We chose to evaluate the CSF movement at the level of the fourth ventricle, since it is the channel through which the CSF exits the brain into the spinal canal. Moreover, the narrow-tapered structure of the fourth ventricle limits the flow of CSF in other directions, thereby strengthening the inflow effect. It is worth noting that the flow-weighted signal in the opposite direction (i.e., CSF flowing towards the brain) is very weak in the top slice of the scan (Figure 3D) and we do not attempt to interpret these small negative signal changes.
MR data were processed using FSL [FMRIB Expert Analysis Tool, v6.01; Oxford University, United Kingdom (Jenkinson et al., 2012)] and MATLAB (MATLAB 2020b; The MathWorks Inc., Natick, MA, 2000). Firstly, the CSF signal was extracted from a voxel in the fourth ventricle identified by overlaying the fMRI data over the structural T1-weighted image registered to the fMRI data (Figures 3A,D). Care was taken to identify the signal from the center of the fourth ventricle, in such a way that the CSF signal comes from a voxel with negligible partial-volume effects from surrounding tissues. The fMRI data were only corrected for slice-timing (FSL SLICETIMER) before extracting the single voxel CSF signal. No motion-correction was applied, since it distorts the slice position information required for inflow analysis. Moreover, it would be inaccurate on edge slices where the tissue moves in and out of the imaging volume (Fultz et al., 2019; Yang et al., 2021). However, to confirm that the CSF signals were not corrupted by motion, we assessed and document no significant correlations between motion parameters (FSL MCFLIRT) and the CSF signals (Supplementary Table S1). Having obtained a CSF-only signal from the fourth ventricle without motion correction, motion correction (FSL MCFLIRT) and slice-timing correction (FSL SLICETIMER) were applied to fMRI data used in subsequent analyses.
The left and right ICAs and IJVs were identified using T1-weighted and T2-weighted structural images and these vessel masks (Figure 3B), registered on to the functional space, were used to extract the corresponding fMRI time series (Figure 3E). These methods have been used and validated in previous studies (Tong et al., 2018; Yao et al., 2019; Amemiya, Takao and Abe, 2020).
The ICA, IJV, and CSF signals were linearly detrended and demeaned. For analysis of the hemodynamic model based on LFOs, the signals were bandpass filtered to the range of 0.01–0.1 Hz, using a zero delay fourth-order Butterworth filter to extract the corresponding LFOs. The LFOs of left and right ICAs and IJVs exhibited high correlations (Right-Left ICAs: 0.57 ± 0.10 and Right-Left IJVs: 0.64 ± 0.13). Hence, the vessel signals of the same kind were averaged for each participant to increase the signal-to-noise ratio (SNR).
As we demonstrated in our previous work (Yang et al., 2021), the changes of CBV rather than CBV itself, are the driving force of CSF movement. Without the CBV changes, no force will be exerted on the ventricles. Therefore, instead of the fMRI signal itself, we used the derivative of the fMRI signal to reflect the preceding intravascular blood volume changes in the ICAs and the corresponding downstream intravascular blood flow changes in the IJVs (Please note that based on previous studies (Tong et al., 2018; Yao et al., 2019), the volume change in the ICAs has been found to be highly correlated with the global CBV change in the brain, and preceding the global CBV by ∼3 s. Similarly, the corresponding downstream flow changes in the IJVs are also highly correlated with the upstream global CBV changes and are delayed by ∼4 s. Since we only scan the neck here, the volume change in the ICAs and corresponding downstream flow changes in the IJVs are used as surrogates of the global CBV. Further, maximum cross-correlation coefficients (MCCCs) and corresponding time delays for each participant were calculated (MATLAB xcorr, maximum lag range: ±15 s) between (1)
For analysis of the respiratory model of CSF dynamics, the fMRI signals and the chest belt respiratory signals were bandpass filtered to the range of 0.2–0.4 Hz, using a zero delay fourth order Butterworth filter to extract the corresponding respiratory oscillations (RO). The frequency range of respiration affecting the CSF signals for each participant was identified from the results of cross-spectral analysis between them (Supplementary Figure S3). As in the hemodynamic model verification analysis, the ROs (high correlations between right-left ICAs: 0.37 ± 0.12 and right-left IJVs: 0.48 ± 0.12) from the same kind of vessels were averaged for each participant to increase the SNR.
The difference in pressure between the right atrium of the heart and the brain is the key modulator of venous return from the brain (Schrauben et al., 2015). The intrathoracic pressure changes during respiration are coupled to the right atrial pressure and thereby modulate the venous drainage from the brain (a detailed explanation of how the intrathoracic pressure changes modulate the venous return from the brain is provided in Supplementary Figure S4). To estimate the instantaneous changes in this pressure differential, we use the derivative of chest respiratory oscillations (
Since the signals in the respiratory range can be highly periodic, there is a risk of spurious cross correlation errors. To reduce false positives on our cross-correlation results in the respiration model, we first limited the cross-correlation window to reflect the fact that
Cross–frequency coupling (CFC) quantifies the coupling between signals across different frequency bands. In this study, CFC was employed to assess if there is any coupling between RO and LFO bands. Phase-Amplitude Coupling (PAC), a type of CFC, was used to quantify the intensity of CFC between amplitude of ROChest and phase of LFOCSF, LFOIJV, and LFOICA, using Mean Vector Length based Modulation Index (Canolty et al., 2006). Statistically significant values of modulation indices between amplitude of ROChest and phase of LFOCSF, LFOIJV, and LFOICA were calculated at 5 percent level of significance as outlined previously (Onslow, Bogacz and Jones, 2011).
The results of the cross-correlation analysis for the hemodynamic model of CSF dynamics in LFOs are illustrated in Figure 4. MCCCs and corresponding delay between
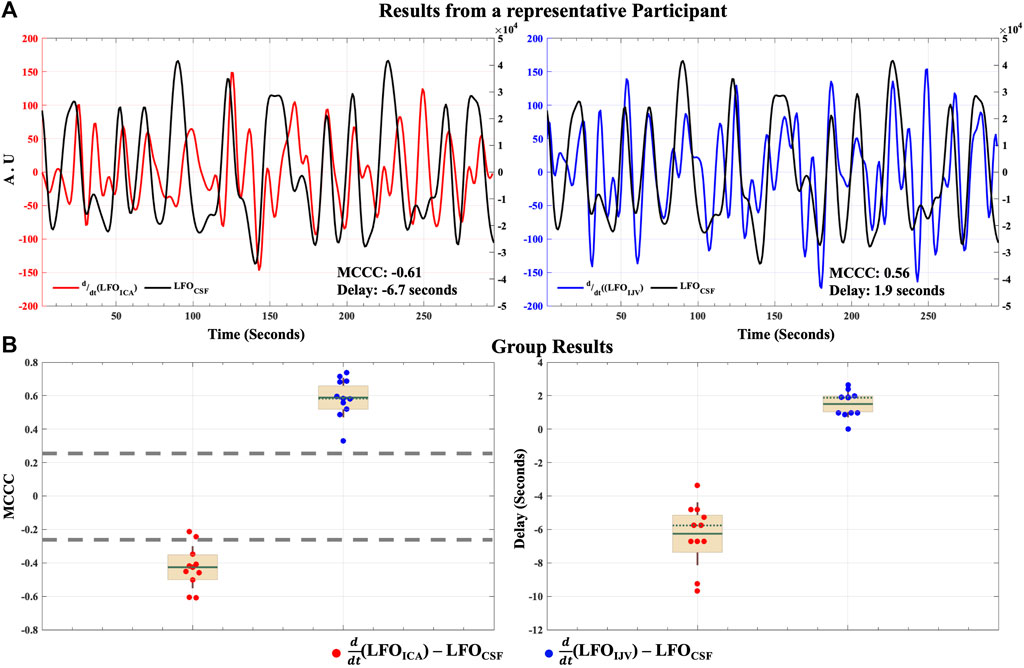
FIGURE 4. Caudally directed CSF movement in the LFO range. Results of MCCCs and corresponding delays between
The MCCCs and corresponding delay times between
The distribution of all the spurious MCCCs (and corresponding delays) calculated from mismatched RO range time series, i.e., between mismatched
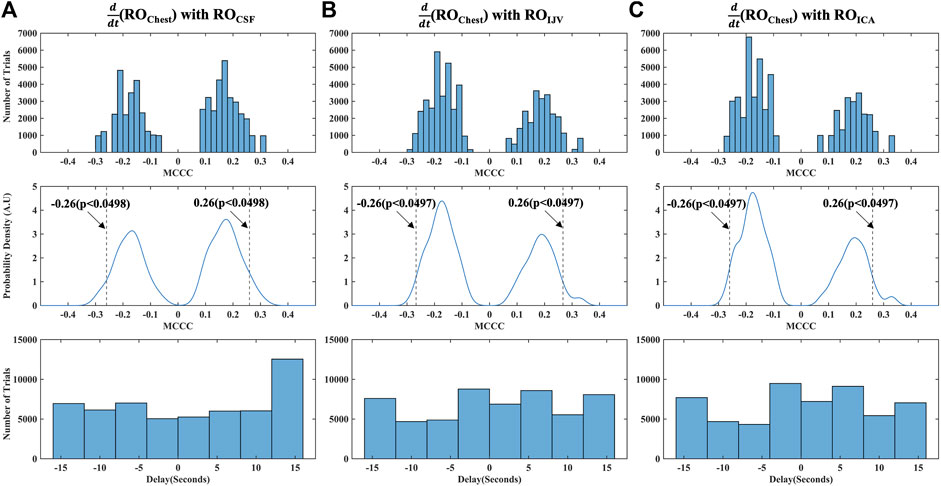
FIGURE 5. Distribution of MCCCs and corresponding delays calculated from randomly mismatched (A)
As a final step to ensure that our cross-correlation results in the RO range were not spurious errors arising from the periodicity of the signals, we also calculated the MCCCs and delays between mismatched halves of RO range time series data for each participant, i.e., between the first half of
Figure 6A shows the MCCCs and the corresponding time delays between
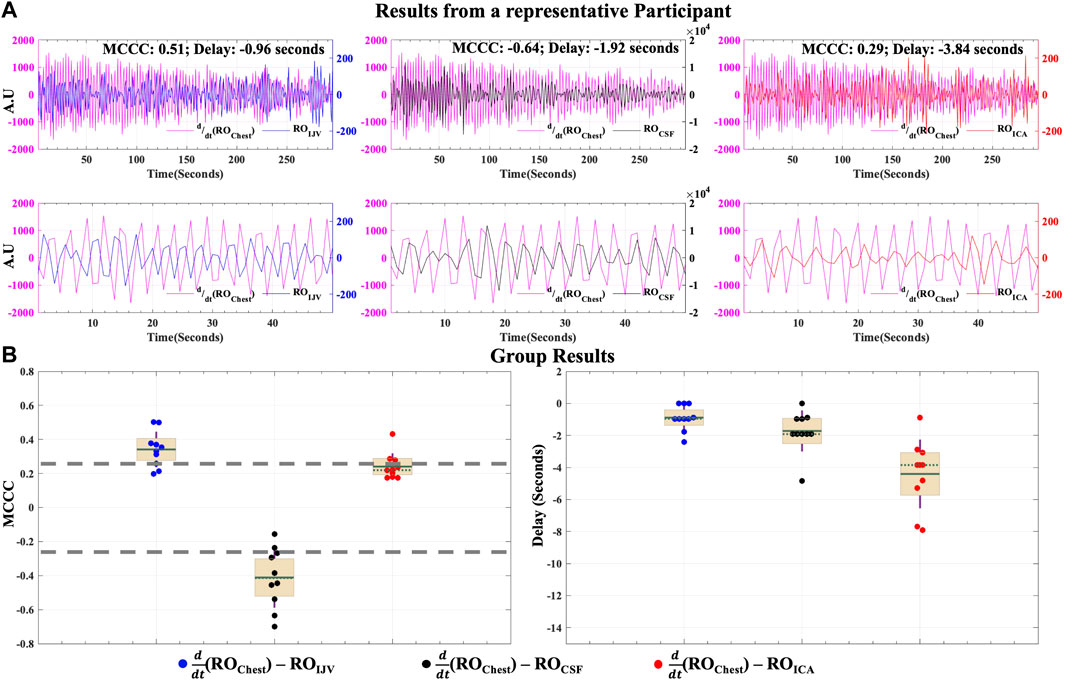
FIGURE 6. Caudally directed CSF movement in the RO range. Results of MCCCs and corresponding delays between
To determine if respiration might also affect the arterial supply within a time frame short enough to induce an effect measurable under the proposed venous return model, we also calculated the correlations between
The results of cross-frequency coupling between amplitude of ROChest signal and the phase of LFOCSF, LFOIJV and LFOICA signals for a representative participant are delineated in Figures 7A–C, respectively. The plots only show the values of CFC at 5% level of significance (Onslow, Bogacz and Jones, 2011).
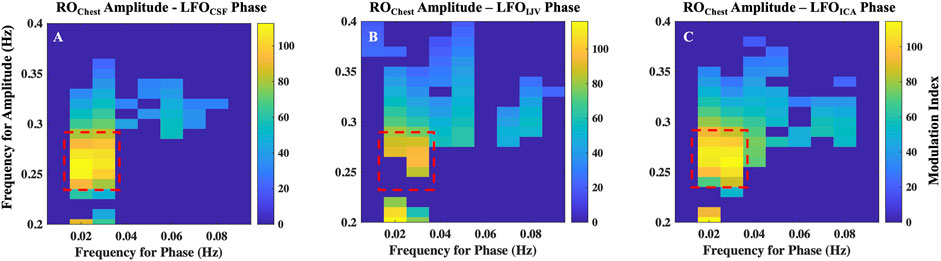
FIGURE 7. Cross-frequency coupling between respiration and LFOs. Results of coupling quantified by modulation index, between amplitude of ROChest signal and the phase of (A) LFOCSF, (B) LFOIJV and (C) LFOICA signals for a representative. Highlighted regions represent frequencies with maximal coupling. ICA, internal carotid artery; IJV, internal jugular vein; CSF, cerebrospinal fluid; LFO, low frequency oscillations (0.01–0.1 Hz); RO, respiratory oscillations (0.2–0.4 Hz)
The highest coupling is between amplitude of ROChest signal in the frequency range 0.25–0.3 Hz with the phases of LFO signals in the frequency of range 0.016–0.035 Hz. It is to be noted that the range 0.25–0.3 Hz is the peak frequency range of respiration for the given participant. All participants exhibited a similar pattern, having the maximum coupling with LFO signals at the peak frequency range of the respiration for the individual. However, the LFO range of maximal coupling varies across subjects (Supplementary Figure S6). This implies that respiration mostly affects a narrow range of frequencies in the LFO range.
In this study, we have demonstrated several significant findings. First, we show that the dynamics of brain fluids can be assessed from the neck, by studying the interrelationships between major neck blood vessels and the CSF movement at the fourth ventricle. Second, we validate via fMRI neck scan that both low frequency hemodynamics (0.01–0.1 Hz) and respiration (0.2–0.4 Hz) influence CSF movement in the respective frequency ranges, albeit through different mechanisms. Finally, we show that there exists a cross-frequency coupling between the amplitude of respiration and phase of LFOs found in CSF, IJV, and ICA. Below, we provide a physiological interpretation of these findings and their implications for CSF dynamics. In addition, we discuss the potential clinical impact of our results.
In this study, we investigated the vascular LFOs (0.01–0.1 Hz), which originated outside the brain, as a possible driving force responsible for CSF movement in humans. Our results demonstrate that the derivative of these low frequency hemodynamic oscillations extracted from ICA and IJV in the neck, correlate with LFOCSF directed toward the spinal canal within a physiologically relevant time frame. This is the first study to establish the fMRI temporal relationship between ICA and caudally directed CSF movement in the LFO range.
Evidence from our prior resting state fMRI study in awake humans illustrate that LFOs within the brain (i.e., global mean fMRI signal) represent the global cerebral blood volume fluctuations, whose collective force on the lateral ventricles results in CSF movement (Yang et al., 2021). Results from the current hemodynamic model support and extend this phenomenon by tracing these LFOs at the ICA. We show that these LFOs enter the brain through the ICAs and take an average of 6 s to have the accumulative CBV effects (in the brain), finally culminating in caudally directed CSF movement observed at the fourth ventricle (Figure 4). Lastly, these LFOs appear at the IJV seconds later.
Various physiological mechanisms have been suggested as the possible origin of vascular LFOs. Variations in blood CO2 (a potent vasodilator) is a possible major global source of vascular LFOs, as it is also known to dilate vessels as it travels along with blood (Wise et al., 2004; Golestani et al., 2015). Vasomotion is another potential source of LFOs (He et al., 2018; Noordmans et al., 2018). Results from two recent studies using mathematical modeling (Aldea et al., 2019) and in vivo two photon microscopy in rodents (van Veluw et al., 2020) support the idea that local vasomotion generated from vascular smooth muscle cells might be driving CSF dynamics. Other potential candidates such as mayer waves (Julien, 2006), volume changes in veins caused by dilation of upstream arteries (windkessel effect) (Buxton, Wong and Frank, 1998), autoregulatory mechanisms (Müller and Österreich, 2014) may also be contributing to these low-frequency blood volume changes. Although our study establishes the influence of low frequency hemodynamics in driving CSF, the exact origin of these LFOs is not clear.
Lastly, it is worth noting that there are various fMRI endogenous contrasts used in this study, which include the inflow effect at the fourth ventricle, the BOLD effect at the draining veins, and an obscure BOLD effect at ICAs. The ICAs in healthy subjects carry blood with ∼100% oxygenation. However, a weak positive BOLD effect might arise through variations in arterial saturation (Aso et al., 2019). Alternatively, a weak negative BOLD effect might arise via changes in arterial diameter since fully saturated arterial blood has a lower magnetic susceptibility than tissues. Given the negative correlations between the derivative of LFOICA (i.e., representing dilation) and LFOCSF, the most likely contrast in ICA is a partial volume effect arising from changes in arterial diameter, producing an fMRI signal inversely correlated with arterial blood volume (Tong et al., 2018; Yao et al., 2019; Amemiya, Takao and Abe, 2020).
Respiration is another important mechanism that has been suggested as a potential engine for CSF movement (Klose et al., 2000; Friese et al., 2004; Yamada et al., 2013; Chen et al., 2015; Dreha-Kulaczewski et al., 2017). Our results point to the possibility of a highly interdependent and tightly communicating CSF-venous system (i.e., in the respiratory frequency range). In detail, our results document a negative change in intrathoracic volume (i.e., a positive change in intrathoracic pressure) leads to a reduction in venous drainage from the brain observed within a second at the jugulars, further leading to an increase in blood volume in the brain (due to reduced drainage) and finally resulting in a compensatory outward movement of CSF from the brain within an average time of 2 s from the start of the cycle. The observed time delays, although small, show that respiration indeed influences CSF dynamics through the venous system in a sequential and continual fashion.
We further explored the possibility that the intrathoracic volume/pressure changes also affect the arterial system. The results showed that these signals correlate weakly at time delays much longer (∼4.4 s) than that taken by respiration to affect the venous system (<1 s). This is likely to be due to different mechanisms by which respiration couples with venous and arterial systems and to the relatively lower SNR of fMRI signal in the arteries. Our respiratory model (Figure 2) did not include a specific route by which changes of intrathoracic volume/pressure might couple with ICA but there are a few candidate mechanisms, including variations in minute ventilation (the volume of gas inhaled/exhaled per minute) leading to changes in arterial oxygen saturation and arterial CO2 concentration. The weak positive correlation of chest motion and ROICA, with chest motion leading by around 4.4 s, would fit a standard BOLD signal model in which increased minute ventilation (larger breaths) leads to greater arterial oxygen saturation and dilution of the small concentration of arterial deoxyhemoglobin. Variation of arterial deoxyhemoglobin has been proposed by Aso et al. (2019) as one possible source of LFOs. Future work might expand the respiratory model to include minute ventilation as an independent measure. Together with measurements of expired CO2 it might then be possible to determine a precise mechanism for the weak coupling between chest motion and ROICA.
The results from our study have shown that both low frequency hemodynamics and respiration generate fluctuations of CSF flow in the fourth ventricle in humans. We found that the amplitude of respiration measured from the chest is tightly coupled with the phases of LFOs found in CSF movement. We also found a similar coupling between respiration amplitude and the phases of vascular LFOs extracted from ICAs and IJVs. These results point to the possibility that the depth of respiration (i.e., minute ventilation) contributes to the changes in blood vessel volume dynamics that occurs in LFO range. This concept is physically plausible, since depth of respiration is capable of inducing changes in blood vessel volume dynamics through intrathoracic pressure changes as well as CO2 concentration changes (Chang and Glover, 2009). As suggested by the results from cross-frequency coupling, it is possible that respiration exerts its effects on CSF dynamics not only through the pressure-related venous return changes in the RO range, but also through the blood gas related vessel volume changes, within a narrow range of low frequency oscillations (0.0175–0.028 Hz) in CSF signals (Supplementary Figure S7). On average, respiration explained 73.46% ± 15.83% of variability in the LFO range of 0.0175–0.028 Hz. Natural variations in blood CO2 during respiration could be thought of as primarily contibuting to this narrow range of LFOs, consistent with a previous report that the end-tidal CO2 fluctuations during rate-controlled resting state breathing were significantly correlated to BOLD fMRI signal fluctuations at ∼0.03 Hz (Birn et al., 2006).
Finally, it is imperative to figure out the relative contributions of each of these mechanisms in regulating CSF dynamics. A power spectrum analysis of the caudally directed CSF signals observed at the fourth ventricle showed that LFOs represent the major component of the signal in all of the participants in this study. In fact, the percent of power in the LFO range is significantly higher than the percent of power in the normal respiration range (Supplementary Figure S8). On average, about 67 percent of power in CSF signal comes from the low frequency oscillations, whereas only about 15 percent of power is present in the respiration range. However, this does not entirely mean that respiration has a negligible effect on CSF movement. CSF flow has also been suggested to be pulsatile in nature, driven by cardiac cycle (Mestre et al., 2018). Central venous pressure changes related to cardiac cycle (Zamboni et al., 2020; Beggs et al., 2021), might also be a contributing factor. However, this mechanism has been identifed through mathematical modelling to be too weak to become the principal force driving CSF (Asgari, De Zélicourt and Kurtcuoglu, 2016; Diem et al., 2017). In our study, cardiac pulsations (>0.6 Hz) were sampled in only 5 participants explained only an average of 11 percent of the power in the caudally directed CSF signals observed at the fourth ventricle (See Supplementary Note S2 and Supplementary Figure S9).
This study demonstrated that close coupling exists between fluid dynamics in the brain and that this valuable information can be extracted from a neck scan. This opens the possibility of developing a simple neck scan sequence or applying other imaging modalities (e.g., Doppler ultrasound or Near Infrared Spectroscopy) to get indirect, or inferred, CSF measures from the blood vessels in the neck. Such a simple fMRI sequence would also be superior to other conventional methods like Phase contrast MRI (PCMRI) for the following reasons: First, signal acquired from PCMRI is gated to the cardiac cycle—i.e., CSF flow values quantified were averaged over multiple cardiac cycles. For this reason, effects of the physiological frequencies (i.e., LFOs and ROs) other than the cardiac frequency on CSF movement cannot be assessed. Second, simultaneous assessment of signals from all three locations studied here (i.e., ICAs, IJVs, and CSF) cannot be performed accurately, since the appropriate velocity encoding “VENC” parameter for the fluid flow assessment in these three locations are different. Any deviations in this parameter from the optimal value for each location leads to low signal or aliasing artifacts, rendering the recording unreliable (Korbecki et al., 2019). We caution, however, that the first step towards such a clinical tool would be to repeat the current study in patient groups, in case abnormal vascular or CSF dynamics, as found in stroke and hydrocephalus patients, respectively, reduces or eliminates the relationships we observe in healthy subjects. In addition, the study also validated the mechanism of respiration in the CSF movement and its relationship with that of LFOs. These findings can inform the development of clinically relevant breathing tasks that might further couple with LFOs and enhance CSF flow in patients where low natural flow may be a concern, e.g., due to insomnia.
A limitation of this study is the lack of a simultaneous end-tidal CO2 measurement. This would have helped to separate the contributions of respiration to CSF dynamics from both pressure changes and CO2 changes. The method used in our study was also unable to simultaneously detect the CSF movement into the brain. Another minor limitation is the lower fMRI temporal resolution that made it impossible to sample the cardiac pulsations in 6 participants. Finally, it would have been interesting to study the CSF movement under lowered/elevated vascular (heart rate, blood pressure) and respiratory (resting state vs. hyper/hypoventilation) rate conditions. Future studies will incorporate simultaneous measurement of end-tidal CO2 values and effects of the aforementioned conditions on CSF movement.
In conclusion, the results of our study illustrate that valuable brain fluid dynamic information can be obtained from a neck scan, from which it was found that multiple physiological forces contribute to driving CSF movement in humans. Two simple yet distinct mechanisms simultaneously regulating caudally directed CSF movement in humans, based on 1) low frequency hemodynamics from the neck blood vessels (ICA and IJV) and 2) respiration were validated. Cross-frequency coupling between these motive forces were also identified. The capability of the CSF system to respond to multiple physiological forces at the same time may help unveil the pathological mechanisms behind CSF flow related disorders.
The raw data supporting the conclusion of this article will be made available by the authors, without undue reservation.
The studies involving human participants were reviewed and approved by Purdue University’s Human Research Protection Plan (IRB-2020-1329). The patients/participants provided their written informed consent to participate in this study.
YT, VVN, and BI conceived of the presented idea. VVN, BK, and H-CY performed data collection. VVN performed data analysis. YT, VVN, and BI interpreted the results and bdeveloped the theory. VVN took the lead in writing the manuscript. AS, Y-CW, XZ, AW, and others provided critical feedback and helped shape the research, analysis and manuscript.
This work was supported by the seed grant from Purdue Institute for Integrative Neuroscience (PI: AS) and by the National Institutes of Health, Grants S10 (S10 OD012336—3T MRI Scanner dedicated to Life Sciences Research PI: Ulrike Dydak) and R21 (R21AG068962, PI: YT).
We would like to thank Pearlynne Li Hui Chong for her help with participant recruitment.
The authors declare that the research was conducted in the absence of any commercial or financial relationships that could be construed as a potential conflict of interest.
All claims expressed in this article are solely those of the authors and do not necessarily represent those of their affiliated organizations, or those of the publisher, the editors and the reviewers. Any product that may be evaluated in this article, or claim that may be made by its manufacturer, is not guaranteed or endorsed by the publisher.
The Supplementary Material for this article can be found online at: https://www.frontiersin.org/articles/10.3389/fphys.2022.940140/full#supplementary-material
Aldea R., Weller R. O., Wilcock D. M., Carare R. O., Richardson G. (2019). Cerebrovascular smooth muscle cells as the drivers of intramural periarterial drainage of the brain. Front. Aging Neurosci. 11 (1), 1–17. doi:10.3389/fnagi.2019.00001
Amemiya S., Takao H., Abe O. (2020). Origin of the time lag phenomenon and the global signal in resting-state fMRI. Front. Neurosci. 14 (10), 596084. doi:10.3389/fnins.2020.596084
Asgari M., De Zélicourt D., Kurtcuoglu V. (2016). Glymphatic solute transport does not require bulk flow. Sci. Rep. 6, 38635–38711. doi:10.1038/srep38635
Aso T., Urayama S., Fukuyama H., Murai T. (2019). Axial variation of deoxyhemoglobin density as a source of the low-frequency time lag structure in blood oxygenation level-dependent signals. PLoS ONE 14 (9), e0222787–25. doi:10.1371/journal.pone.0222787
Beggs C., Tavoni V., Menegatti E., Tessari M., Ragazzi R., Malagoni A. M., et al. (2021). Spectral characteristics of the internal jugular vein and central venous pressure pulses: A proof of concept study. Veins Lymphatics 10 (1), 1. doi:10.4081/vl.2021.9732
Bhadelia R. A., Bogdan A. R., Wolpert S. M. (1995). Analysis of cerebrospinal fluid flow waveforms with gated phase-contrast MR velocity measurements. AJNR. Am. J. Neuroradiol. 16 (2), 389–400.
Birn R. M., Diamond J. B., Smith M. A., Bandettini P. A. (2006). Separating respiratory-variation-related fluctuations from neuronal-activity-related fluctuations in fMRI. NeuroImage 31 (4), 1536–1548. doi:10.1016/j.neuroimage.2006.02.048
Buxton R. B., Wong E. C., Frank L. R. (1998). Dynamics of blood flow and oxygenation changes during brain activation: The balloon model. Magn. Reson. Med. 39 (6), 855–864. doi:10.1002/mrm.1910390602
Canolty R. T., Edwards E., Dalal S. S., SoltaniM. , Nagarajan S. S., Kirsch H. E., et al. (2006). High gamma power is phase-locked to theta oscillations in human neocortex. Sci. (New York, N.Y.) 313 (5793), 1626–1628. doi:10.1126/science.1128115
Chang C., Glover G. H. (2009). Relationship between respiration, end-tidal CO2, and BOLD signals in resting-state fMRI. NeuroImage 47 (4), 1381–1393. doi:10.1016/j.neuroimage.2009.04.048
Chen L., Beckett A., Verma A., Feinberg D. A. (2015). Dynamics of respiratory and cardiac CSF motion revealed with real-time simultaneous multi-slice EPI velocity phase contrast imaging. NeuroImage 122, 281–287. doi:10.1016/j.neuroimage.2015.07.073
Diem A. K., MacGregor Sharp M., Gatherer M., Bressloff N. W., Carare R. O., Richardson G. (2017). Arterial pulsations cannot drive intramural periarterial drainage: Significance for Aβ drainage. Front. Neurosci. 11 (AUG), 475–479. doi:10.3389/fnins.2017.00475
Dreha-Kulaczewski S., Joseph A. A., Merboldt K. D., Ludwig H. C., Gartner J., Frahm J. (2017). Identification of the upward movement of human CSF in vivo and its relation to the brain venous system. J. Neurosci. 37 (9), 2395–2402. doi:10.1523/JNEUROSCI.2754-16.2017
Dreha-Kulaczewski S., Joseph A. A., Merboldt K. D., Ludwig H. C., Gartner J., Frahm J. (2015). Inspiration is the major regulator of human CSF flow. J. Neurosci. 35 (6), 2485–2491. doi:10.1523/JNEUROSCI.3246-14.2015
Enzmann D. R., Pelc N. J. (1993). Cerebrospinal fluid flow measured by phase-contrast cine MR. AJNR. Am. J. Neuroradiol. 14 (6), 1301–1307.
Friese S., Hamhaber U., ErbM. , Kueker W., Klose U. (2004). The influence of pulse and respiration on spinal cerebrospinal fluid pulsation. Invest. Radiol. 39 (2), 120–130. doi:10.1097/01.rli.0000112089.66448.bd
Fultz N. E., Bonmassar G., Setsompop K., Stickgold R. A., Rosen B. R., Polimeni J. R., et al. (2019). Coupled electrophysiological, hemodynamic, and cerebrospinal fluid oscillations in human sleep. Science 366 (6465), 628–631. doi:10.1126/science.aax5440
Golestani A. M., Chang C., Kwinta J. B., Khatamian Y. B., Jean Chen J. (2015). Mapping the end-tidal CO2 response function in the resting-state BOLD fMRI signal: Spatial specificity, test-retest reliability and effect of fMRI sampling rate. NeuroImage 104, 266–277. doi:10.1016/j.neuroimage.2014.10.031
Greitz D., Hannerz J. (1996). A proposed model of cerebrospinal fluid circulation: Observations with radionuclide cisternography. AJNR. Am. J. Neuroradiol. 17 (3), 431–438.
Greitz D. (2004). Radiological assessment of hydrocephalus: New theories and implications for therapy. Neurosurg. Rev. 27 (3), 145–165. doi:10.1007/s10143-004-0326-9
Greitz D., WiRestam R., FrAnck A., Nordell B., Thomsen C., StahlbergF. (1992). Pulsatile brain movement and associated hydrodynamics studied by magnetic resonance phase imaging - the Monro-Kellie doctrine revisited. Neuroradiology 34 (5), 370–380. doi:10.1007/BF00596493
Han F., Chen J., Belkin-Rosen A., Gu Y., Luo L., Buxton O. M., et al. (2021). Reduced coupling between cerebrospinal fluid flow and global brain activity is linked to Alzheimer disease-related pathology. PLoS Biol. 19 (6), e3001233. doi:10.1371/journal.pbio.3001233
He Y., Wang M., Chen X., Pohmann R., Polimeni J. R., Scheffler K., et al. (2018). Ultra-Slow single-vessel BOLD and CBV-based fMRI spatiotemporal dynamics and their correlation with neuronal intracellular calcium signals. Neuron 97 (4), 925–939. e5. doi:10.1016/j.neuron.2018.01.025
Hocke L. M., Tong Y., Lindsey K. P., de B Frederick B. (2016). Comparison of peripheral near-infrared spectroscopy low-frequency oscillations to other denoising methods in resting state functional MRI with ultrahigh temporal resolution. Magn. Reson. Med. 76 (6), 1697–1707. doi:10.1002/mrm.26038
Iliff J. J., Lee H., Yu M., Feng T., Logan J., Nedergaard M., et al. (2013a). Brain-wide pathway for waste clearance captured by contrast-enhanced MRI. J. Clin. Invest. 123 (3), 1299–1309. doi:10.1172/JCI67677
Iliff J. J., Wang M., Zeppenfeld D. M., Venkataraman A., Plog B. A., Liao Y., et al. (2013b). Cerebral arterial pulsation drives paravascular CSF-Interstitial fluid exchange in the murine brain. J. Neurosci. 33 (46), 18190–18199. doi:10.1523/JNEUROSCI.1592-13.2013
Jenkinson M., Beckmann C. F., Behrens T. E. J., Woolrich M. W., Smith S. M. (2012). Fsl. NeuroImage 62 (2), 782–790. doi:10.1016/j.neuroimage.2011.09.015
Jessen N. A., Munk A. S. F., Lundgaard I., Nedergaard M. (2015). The glymphatic system: A beginner’s guide. Neurochem. Res. 40 (12), 2583–2599. doi:10.1007/s11064-015-1581-6
Julien C. (2006). The enigma of Mayer waves: Facts and models. Cardiovasc. Res. 70 (1), 12–21. doi:10.1016/j.cardiores.2005.11.008
Klose U., Strik C., Kiefer C., Grodd W. (2000). Detection of a relation between respiration and CSF pulsation with an echoplanar technique. J. Magnetic Reson. Imaging 11 (4), 438–444. doi:10.1002/(SICI)1522-2586(200004)11:4<438::AID-JMRI12>3.0.CO;2-O
Korbecki A., Zimny A., Podgorski P., Sasiadek M., Bladowska J. (2019). Imaging of cerebrospinal fluid flow: Fundamentals, techniques, and clinical applications of phase-contrast magnetic resonance imaging. Pol. J. Radiol. 84, 240–250. doi:10.5114/pjr.2019.86881
Mestre H., Tithof J., Du T., Song W., Peng W., Sweeney A. M., et al. (2018). Flow of cerebrospinal fluid is driven by arterial pulsations and is reduced in hypertension. Nat. Commun. 9 (1), 4878. doi:10.1038/s41467-018-07318-3
Mokri B. (2001). The Monro-Kellie hypothesis: Applications in CSF volume depletion. Neurology 56 (12), 1746–1748. doi:10.1212/WNL.56.12.1746
Müller M., Österreich M. (2014). A comparison of dynamic cerebral autoregulation across changes in cerebral blood flow velocity for 200 s. Front. Physiol. 5 (5), 327–7. doi:10.3389/fphys.2014.00327
Noordmans H. J., van Blooijs D., Siero J. C. W., Zwanenburg J. J. M., Klaessens J. H. G. M., Ramsey N. F. (2018). Detailed view on slow sinusoidal, hemodynamic oscillations on the human brain cortex by Fourier transforming oxy/deoxy hyperspectral images. Hum. Brain Mapp. 39 (9), 3558–3573. doi:10.1002/hbm.24194
Onslow A. C. E., Bogacz R., Jones M. W. (2011). Quantifying phase-amplitude coupling in neuronal network oscillations. Prog. Biophys. Mol. Biol. 105 (1–2), 49–57. doi:10.1016/j.pbiomolbio.2010.09.007
Puvenna V., Engeler M., Banjara M., Brennan C., Schreiber P., Dadas A., et al. (2016). Is phosphorylated tau unique to chronic traumatic encephalopathy? Phosphorylated tau in epileptic brain and chronic traumatic encephalopathy. Brain Res. 1630, 225–240. doi:10.1016/j.brainres.2015.11.007
Sakka L., Coll G., Chazal J. (2011). Anatomy and physiology of cerebrospinal fluid. Eur. Ann. Otorhinolaryngol. Head. Neck Dis. 128 (6), 309–316. doi:10.1016/j.anorl.2011.03.002
Schrauben E. M., Anderson A. G., Johnson K. M., Wieben O. (2015). Respiratory-induced venous blood flow effects using flexible retrospective double-gating. J. Magn. Reson. Imaging 42 (1), 211–216. doi:10.1002/jmri.24746
Schwartz M., Baruch K. (2012). Vaccine for the mind: Immunity against self at the choroid plexus for erasing biochemical consequences of stressful episodes. Hum. Vaccin. Immunother. 8 (10), 1465–1468. doi:10.4161/hv.21649
Spector R., Johanson C. E. (2007). Vitamin transport and homeostasis in mammalian brain: Focus on vitamins B and E. J. Neurochem. 103 (2), 425–438. doi:10.1111/j.1471-4159.2007.04773.x
Spector R., Robert Snodgrass S., Johanson C. E. (2015). A balanced view of the cerebrospinal fluid composition and functions: Focus on adult humans. Exp. Neurol. 273, 57–68. doi:10.1016/j.expneurol.2015.07.027
Tong Y., Yao J. F., Chen J. J., Frederick B. d. (2018). The resting-state fMRI arterial signal predicts differential blood transit time through the brain. J. Cereb. Blood Flow. Metab. 39 (6), 1148–1160. doi:10.1177/0271678X17753329
Ueno M., Chiba Y., Matsumoto K., Nakagawa T., Miyanaka H. (2014). Clearance of beta-amyloid in the brain. Curr. Med. Chem. 21 (35), 4085–4090. doi:10.2174/0929867321666141011194256
van Veluw S. J., Hou S. S., Calvo-Rodriguez M., Arbel-Ornath M., Snyder A. C., Frosch M. P., et al. (2020). Vasomotion as a driving force for paravascular clearance in the awake mouse brain. Neuron 105 (3), 549–561. e5. doi:10.1016/j.neuron.2019.10.033
Wise R. G., Ide K., Poulin M. J., Tracey I. (2004). Resting fluctuations in arterial carbon dioxide induce significant low frequency variations in BOLD signal. NeuroImage 21 (4), 1652–1664. doi:10.1016/j.neuroimage.2003.11.025
Xie L., Kang H., Xu Q., Chen M. J., Liao Y., Thiyagarajan M., et al. (2013). Sleep drives metabolite clearance from the adult brain. Sci. (New York, N.Y.) 342 (6156), 373–377. doi:10.1126/science.1241224
Yamada S., Miyazaki M., Yamashita Y., Ouyang C., Yui M., Nakahashi M., et al. (2013). Influence of respiration on cerebrospinal fluid movement using magnetic resonance spin labeling. Fluids Barriers CNS 10 (1), 36–37. doi:10.1186/2045-8118-10-36
Yang H.-C. (Shawn), Inglis B., Talavage T. M., Nair V. V., Yao J. F., Fitzgerald B., et al. (2021). Coupling between cerebrovascular oscillations and CSF flow fluctuations during wakefulness: An fMRI study. J. Cereb. Blood Flow Metab. 42 (6), 1091–1103. doi:10.1101/2021.03.29.437406
Yao J., Wang J. H., Yang H. C. S., Liang Z., Cohen-Gadol A. A., Rayz V. L., et al. (2019). Cerebral circulation time derived from fMRI signals in large blood vessels. J. Magn. Reson. Imaging 50 (5), 1504–1513. doi:10.1002/jmri.26765
Keywords: cerebrospinal fluid, low-frequency oscillations, respiration, neck fMRI scans, hemodynamics
Citation: Vijayakrishnan Nair V, Kish BR, Inglis B, Yang H-C(, Wright AM, Wu Y-C, Zhou X, Schwichtenberg AJ and Tong Y (2022) Human CSF movement influenced by vascular low frequency oscillations and respiration. Front. Physiol. 13:940140. doi: 10.3389/fphys.2022.940140
Received: 10 May 2022; Accepted: 11 July 2022;
Published: 19 August 2022.
Edited by:
Lipeng Ning, Brigham and Women’s Hospital and Harvard Medical School, United StatesReviewed by:
Mauro Gambaccini, University of Ferrara, ItalyCopyright © 2022 Vijayakrishnan Nair, Kish, Inglis, Yang, Wright, Wu, Zhou, Schwichtenberg and Tong. This is an open-access article distributed under the terms of the Creative Commons Attribution License (CC BY). The use, distribution or reproduction in other forums is permitted, provided the original author(s) and the copyright owner(s) are credited and that the original publication in this journal is cited, in accordance with accepted academic practice. No use, distribution or reproduction is permitted which does not comply with these terms.
*Correspondence: Yunjie Tong, dG9uZzYxQHB1cmR1ZS5lZHU=
Disclaimer: All claims expressed in this article are solely those of the authors and do not necessarily represent those of their affiliated organizations, or those of the publisher, the editors and the reviewers. Any product that may be evaluated in this article or claim that may be made by its manufacturer is not guaranteed or endorsed by the publisher.
Research integrity at Frontiers
Learn more about the work of our research integrity team to safeguard the quality of each article we publish.