
94% of researchers rate our articles as excellent or good
Learn more about the work of our research integrity team to safeguard the quality of each article we publish.
Find out more
ORIGINAL RESEARCH article
Front. Physiol. , 30 June 2022
Sec. Computational Physiology and Medicine
Volume 13 - 2022 | https://doi.org/10.3389/fphys.2022.905447
This article is part of the Research Topic Diagnosis, Monitoring, and Treatment of Heart Rhythm: New Insights and Novel Computational Methods View all 30 articles
 Feifei Liu1
 Shengxiang Xia1*
 Shoushui Wei2
 Lei Chen3
 Yonglian Ren1
 Xiaofei Ren4
 Zheng Xu1
 Sen Ai1
 Chengyu Liu5*
As the fast development of wearable devices and Internet of things technologies, real-time monitoring of ECG signals is quite critical for cardiovascular diseases. However, dynamic ECG signals recorded in free-living conditions suffered from extremely serious noise pollution. Presently, most algorithms for ECG signal evaluation were designed to divide signals into acceptable and unacceptable. Such classifications were not enough for real-time cardiovascular disease monitoring. In the study, a wearable ECG quality database with 50,085 recordings was built, including A/B/C (or high quality/medium quality/low quality) three quality grades (A: high quality signals can be used for CVD detection; B: slight contaminated signals can be used for heart rate extracting; C: heavily polluted signals need to be abandoned). A new SQA classification method based on a three-layer wavelet scattering network and transfer learning LSTM was proposed in this study, which can extract more systematic and comprehensive characteristics by analyzing the signals thoroughly and deeply. Experimental results (mACC = 98.56%, mF1 = 98.55%, SeA = 97.90%, SeB = 98.16%, SeC = 99.60%, +PA = 98.52%, +PB = 97.60%, +PC = 99.54%, F1A = 98.20%, F1B = 97.90%, F1C = 99.60%) and real data validations proved that this proposed method showed the high accuracy, robustness, and computationally efficiency. It has the ability to evaluate the long-term dynamic ECG signal quality. It is advantageous to promoting cardiovascular disease monitoring by removing contaminating signals and selecting high-quality signal segments for further analysis.
Cardiovascular diseases (CVDs) are the most common non-communicable diseases globally, responsible for an estimated 17.8 million deaths in 2017, accounting for 31% of all global deaths, of which more than three quarters were in low income and middle-income countries (Liu et al., 2018; Roth et al., 2018). Therefore, early continuous monitoring and prevention for CVDs are very urgent. The recent commercial availability of wearable devices and Internet of things (IoT) technologies with cardiovascular disease detection capabilities has revolutionized the diagnosis and management of these common medical issues, as it has placed the power of arrhythmia detection into the hands of the patient (Liu et al., 2019b). However, the dynamic long-term ECG signals suffer from extremely serious noise pollution due to the dynamic long-term unsupervised free-living monitoring environment (Huerta et al., 2019). A recent study of 100 patients undergoing cardioversion for atrial fibrillation showed that 34% of wearable devices’ ECG recordings were categorized as “unclassified” by the device algorithm due to unclear reasons or baseline artifacts and low amplitude recordings (Kaptoge et al., 2019). Poor electrocardiographic signal quality can result in misinterpretation and inappropriate results, hazard the correct diagnosis information (Andrea et al., 2018), increases the risk of false alerts (Liu et al., 2011), which may lead to unnecessary medical referrals and testing (Ip, 2019), and increase the workload of physicians (Zhao and Zhang, 2018). Consequently, it is quite urgent to evaluate the quality of wearable dynamic ECG signals, to eliminate signals with serious noise pollution, to distinguish between clean signals that can be used for disease diagnosis and mildly contaminated signals that can only be used for heart rate extraction, which can effectively reduce false alarm and avoid interference with CVD diagnosis (Xu et al., 2021).
The quality evaluation of wearable dynamic ECG signals has aroused the researchers’ extensive attention (Satija et al., 2018; Liu et al., 2019a; Huerta et al., 2019; Liu F. et al., 2020). As early as in 2011, the PhysioNet Cardiology Challenge addressed the issue of developing an efficient algorithm being able to run in real-time on a mobile phone, which can be able to indicate within a few seconds, while the patient is still present, if the ECG is of adequate quality for interpretation, or if another recording should be made (Silva et al., 2011). From then on, many wearable ECG signal-quality assessment (SQA) methods have been developed, and a variety of signal-quality indexes (SQI) have been explored based on the extraction of statistical, morphological, nonlinear, or time-frequency domain features etc. from the signals (Smital et al., 2020). For instance, Li et al. (2008) proposed a bSQI index based on the principle that different R-wave detectors should be nearly the same for clean ECG signals, while they should have different results for ECG signals polluted by noises, and got a good grade in the 2011 PhysioNet/CinC Challenge (Clifford and Moody, 2012). Based on this index, Liu et al. (2018) proposed the generalized bSQI index, generalized the two QRS detector–based bSQI to multiple QRS detector–based bSQI, and mainly studied the effects of type and number of R wave detectors on signal-quality assessment performances. Smital et al. (2020) proposed continuous signal-to-noise ratio curve using the time-frequency domain approach, including the Wavelet Wiener Filtering method and short-time Fourier transform frequency approach, to estimate real-time quality assessment of long-term ECG signals recorded by wearables in free-living conditions. He et al. (2020) proposed a fuzzy comprehensive evaluation algorithm based on characteristics of ECG waveform and each band, to comprehensively evaluate the quality of ECG signals.
However, existing SQA methods highly demand robust methods for accurate and reliable detection and measurement of morphological and RR-interval features from noise-free and noisy ECG signals. Although the ECG morphology feature–based methods have shown promising results in noise-free ECG recordings, accuracy and robustness of QRS complex detection and waveform delineation methods are significantly degraded in the presence of severe muscle artifacts and other external noise (Satija et al., 2017). Also, most SQA methods graded the dynamic ECG signal quality into two groups: acceptable versus unacceptable (or good versus bad). In fact, in some wearable ECG signals only R wave could be detected, other waves such as P or ST were drowned out by the noise (Xu et al., 2021). These signals cannot be used for some CVD detection, but they also cannot be abandoned as heart rate information can be obtained. Therefore, these signals could not be simply divided into acceptable or unacceptable. In this study, a wearable ECG quality database with 50,085 recordings was built, which included A/B/C (or high quality/medium quality/low quality) three quality grades (A: high-quality signals can be used for CVD detection; B: slightly contaminated signals can be used for heart rate extracting; C: heavily polluted signals need to be abandoned). The research has revealed that traditional indexes merely based on morphological, nonlinear, or time-frequency domain features did not perform well on this database, as class B signals were easily confused with class A signals. It is essential to extract more systematic and comprehensive characteristics by analyzing the signals thoroughly and deeply.
The wavelet scattering algorithm, proposed by Mallat (2012), Bruna and Mallat (2013), and Anden and Mallat (2014) using the deep convolutional network architecture, iterated over wavelet convolution, nonlinear modulus, and averaging operators to compute higher-order scattering coefficients, which can build the translation invariant, stable and informative signal representation. The wavelet transform method provided stability under the action of small diffeomorphism, while the nonlinear operation and the integration over time give translation invariance (Tang et al., 2015). Cascading wavelet transforms allowed the recovery of high frequencies lost when averaging the absolute values of coefficients of previous wavelet transforms (Destouet et al., 2021). These preprocessing methods provided an in-depth analysis of signals. First-order scattering coefficients characterize persistent phenomena such as tendency and envelope, while second-order scattering coefficients characterize transient phenomena such as shock signals and amplitude modulation (Anden and Mallat, 2014). The wavelet scattering method has been wildly used for acoustic scene classification (Li et al., 2019), speech recognition (Fousek et al., 2015; Joy et al., 2020), and heart sound classification (Mei et al., 2021), which yielded efficient representations for audio processing. However, wavelet scattering currently was seldom used in ECG analysis and application. Sepúlveda et al. (2021)extracted features of the signal at different time scales using the wavelet scattering algorithm for emotion recognition. Also, Liu Z. et al. (2020) employed wavelet scattering transform for ECG beat classification.
In this study, in order to address the classification issue of A/B/C three quality levels wearable ECG signals, a new SQA classification model was proposed based on a three-layer wavelet scattering network and transfer learning long short-term memory (LSTM) method. As the result shows, it performed very well on the quality assessment of wearable dynamic ECGs.
Figure 1 displays the flowchart of the proposed method. It first established a wearable ECG quality database with 50,085 recordings from two public databases. Then, a quality pre-assessment was established, to delete the lead-fall signals and pure noise, and to avoid the adverse impact of invalid samples on the training models. Also then, the scattering characteristic matrix was extracted by applying a three-layer wavelet scattering network. Finally, a bi-directional long short-term memory (Bi-LSTM) network was employed to train the classification model.
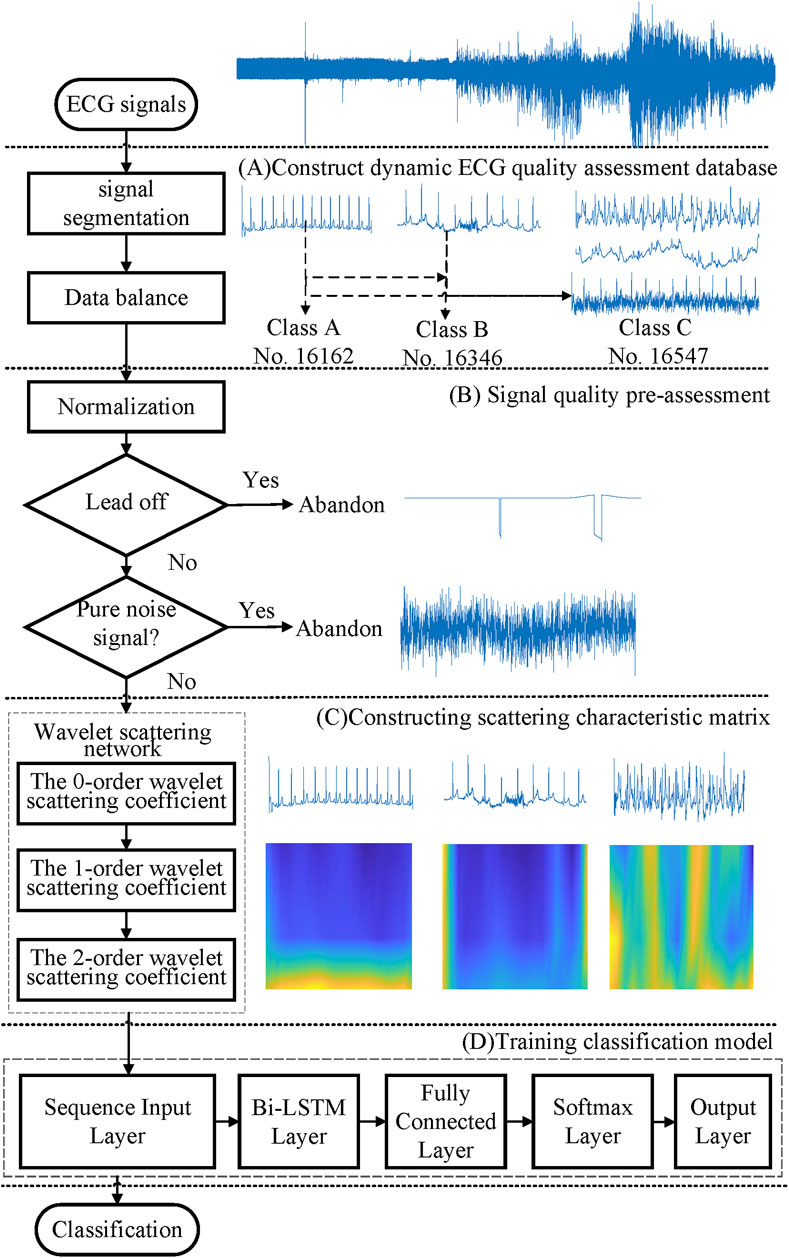
FIGURE 1. Flowchart of the proposed method.
A total of 50,085 recordings of wearable ECGs were used in this study, which were from the Brno University of Technology ECG Quality Database (BUTQDB) (Nemcova et al., 2020) and the 2011 PhysioNet/CinC Challenge (Goldberger et al., 2000; Silva et al., 2011). In the Brno University of Technology ECG Quality Database, the data comprise 18 long-term recordings of single-lead ECGs, collected from 15 subjects (9 females, six males) aged between 21 and 83 years. The signals are longer than 24 h which were detected using the Bittium Faros 180 device (mobile ECG recorder) under free-living conditions. All patients on the datasets did not have any diagnostics. The database contains signal-quality labels for partly data provided by three ECG experts, as well as the consensus of these experts, who grouped the signals into three quality classes.
Class A (high quality): all significant waveforms (P\QRS\ST\T waves) are clearly visible and the onsets and offsets of these waveforms can be detected reliably. The recording with no obvious noise can be used for the diagnosis of cardiovascular disease.
Class B (medium quality): the noise level is increased and significant points in the ECG are unclear (for example, PR interval and/or QRS duration cannot be measured reliably), but QRS complexes are clearly visible and the signal enables reliable QRS detection. Heart rate can be measured correctly.
Class C (low quality): QRS complexes cannot be detected reliably and the signal is unsuitable for any analysis. Heart rate cannot be measured correctly. These signals will interfere with the diagnosis of the cardiovascular disease and need to be removed.
In this study, the annotated recordings and segments have been divided into many fragments of unequal length based on the signal-quality labels provided by ECG experts. Each fragment has an independent label. Also, we segmented the annotated fragments into 10-s fragments with no overlap. Also, a sample of 10-s is the input data to the classification model. The number of class A is 11,708, class B is 7,860, and class C is only 657. It was obvious that data distribution was unbalanced. As we know, imbalanced classes will greatly reduce the generalization ability of the classification model (Clifford et al., 2012). Balancing the database classes can overcome this problem. In this study, we balanced the dataset by expanding the class C data using two ways: one is importing same class data from other databases, and the other is adding noise to clean data.
A total of 1,000 recordings of standard 12-lead ECGs were provided by the 2011 PhysioNet/CinC Challenge (Silva et al., 2011). In 1,000 12-lead ECGs, 773 were labeled as “acceptable,” 225 were “unacceptable,” and two were “intermediate.” Each signal had a length of 10 s. All patients on the datasets did not have any diagnostics. In Liu et al. (2018), every single channel of ECGs had been scored and re-labeled by five researchers, and a total of 9,941 acceptable and a total of 2,059 unacceptable 10-s ECG segments were obtained. In this study, based on the scores in the Liu et al. (2018) and Liu et al. (2019b), we annotated all the leads (10 s segments) individually. For every single channel of ECGs, five scores
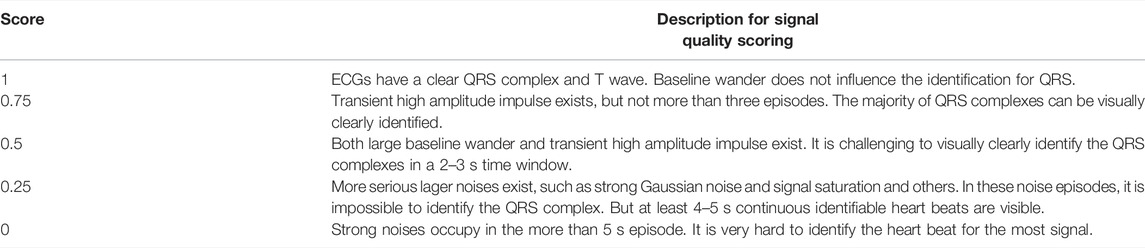
TABLE 1. Five signal quality scores for the 10-s ECG segments.
If all signals from these two databases were used together simply, the number of class A would be 16,163, class B would be 13,346, and class C would be only 2,716. It was obvious that data distribution was also extremely unbalanced. In this way, class B 7860 signals from the Brno University of Technology ECG Quality Database were employed to expand the class C data by adding noise from the PhysioNet noise stress test database (NSTDB) (Moody et al., 1984). Also, 10,000 recordings chosen randomly form class A were also used to expand the class B database (3,000) and class C database (7,000) by adding noise from NSTDB, for class B; the signal-to-noise ratio (SNR) was equal to 10db, for class C was -10bd. In the NSTDB database, three types of noise were exiting, record bw contains baseline wander noise, record em contains electrode motion artifact with a significant amount of baseline wander and muscle noise as well, and record ma contains mainly muscle noise (Clifford et al., 2012). Because the baseline wander (bw) has little effect on signal quality, Gaussian noises were added to this type of noise to generate new noisy records gbw. Table 2 shows the details of dynamic ECG quality assessment database composition.
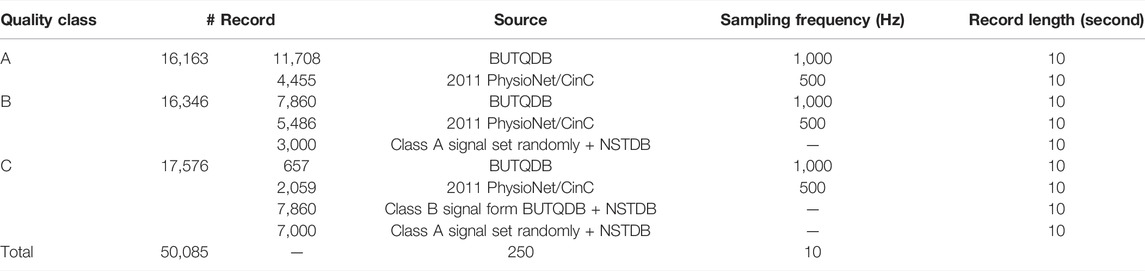
TABLE 2. Dynamic ECG quality assessment database composition.
Signals from different databases need to be preprocessed. First, each ECG signal was down-sampled to 250 Hz. Then, the min–max standardization method was used to map the original ECG signal data to [0–1]. Lead fall is very common in wearable dynamic ECG signals. Lead fall detection was an important way to decrease data storage costs and computing overhead for wearable devices. Figure 2 shows several typical cases of lead-fall signals. In this study, if one ECG signal was present with a constant voltage of more than 80% of the recording, it was defined as lead falling. Occasionally, detached electrodes were adhered to clothing and received Gaussian noise signals. If the signal was pure noise, it was needed to be eliminated. Based on the spectrum range of ECG signal, that is, 0–40 Hz, if the ratio of power spectrum energy of the signal in the range of 0–40 Hz to the total energy is less than 30%, it indicates that the main component of the signal is not the ECG signal but the noise signal, which can be directly discarded. By pre-assessment, 1,029 lead off and pure noise signals were eliminated, which belong to the class C. The calculation formula is as follows:
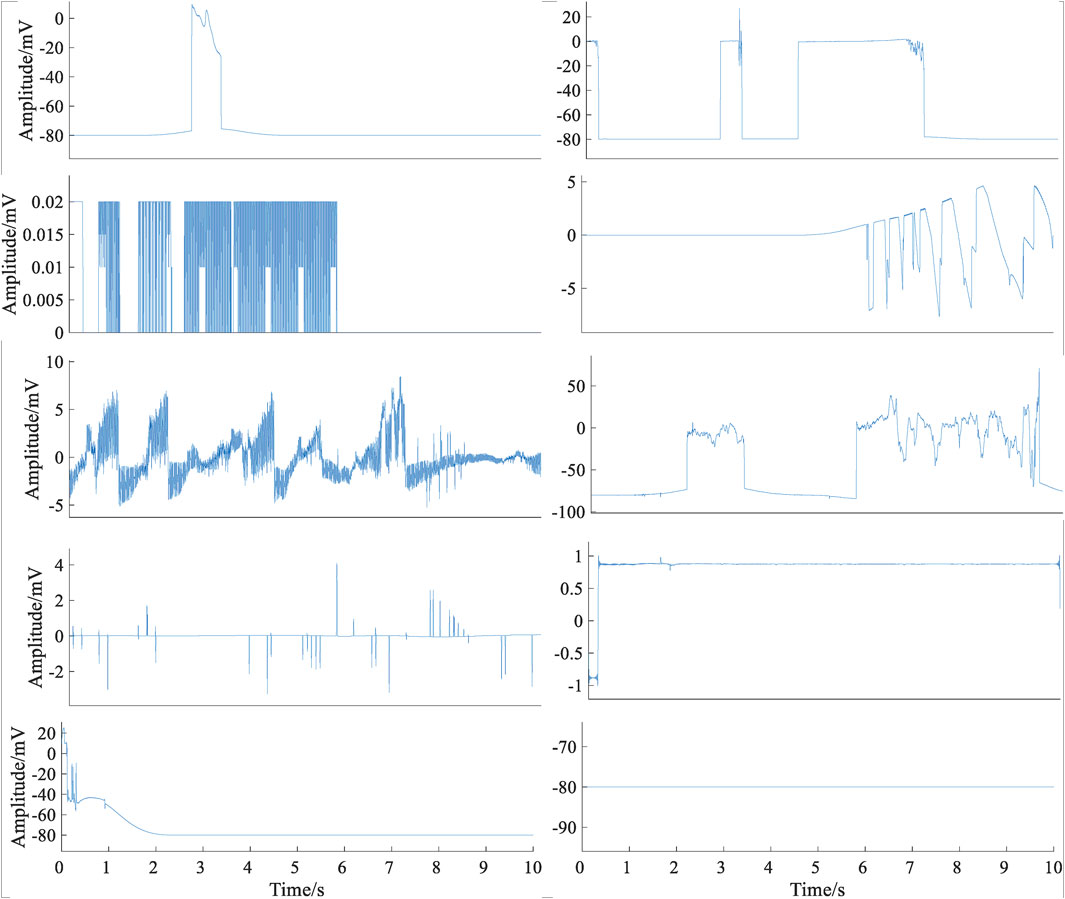
FIGURE 2. Typical cases of lead-fall signals.
The wavelet scattering network has the characteristics of translation invariance, deformation stability, and high frequency preservation (Bruna and Mallat, 2013), and it is very sensitive to the deformation of wearable dynamic ECG signals. In this study, the scale function
1) ECG signal X(t) was convoluted with the scale function
2) ECG signal X(t) were convoluted with the first-order wavelet functions,
3) The first-order wavelet scattering coefficients
4) The first-order scattering propagator
5) The second-order wavelet scattering coefficients
The scattering network can contain more than three layers, but in practice, energy is dissipated with each iteration. Therefore, in this study, three layers were employed. The zero-order wavelet scattering coefficient
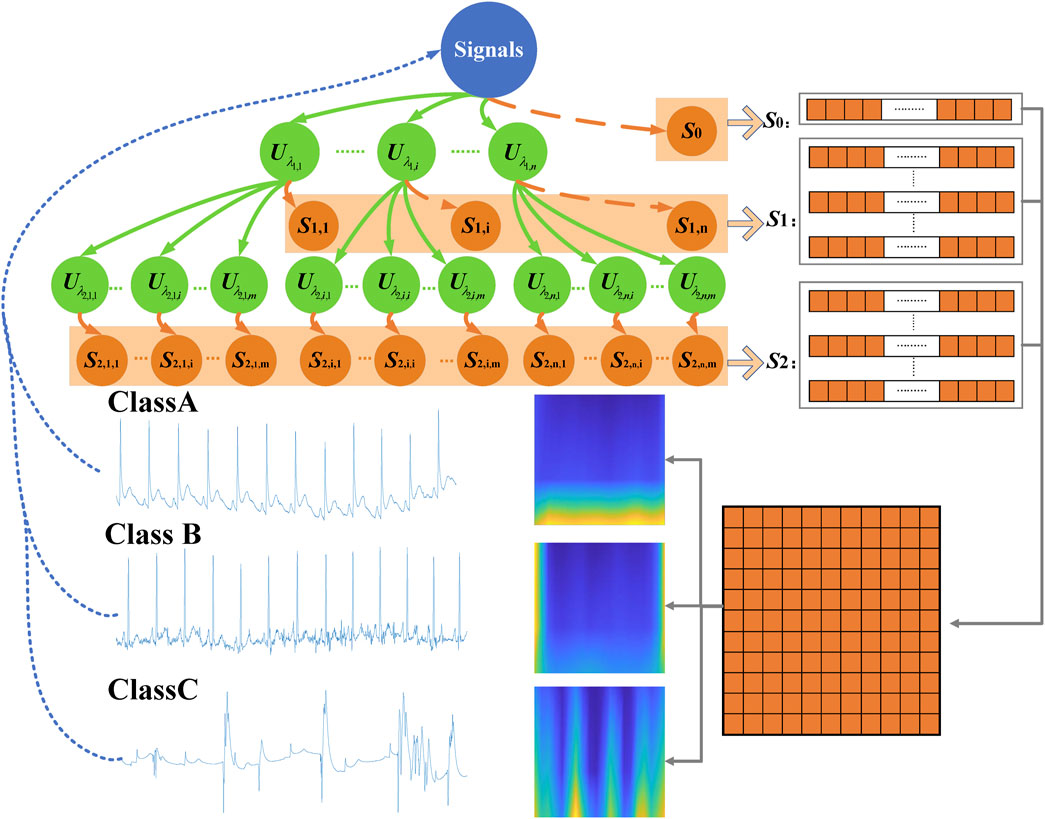
FIGURE 3. Three-layer wavelet scattering network.
Figure 4(A) shows that time-domain plots of the scale function
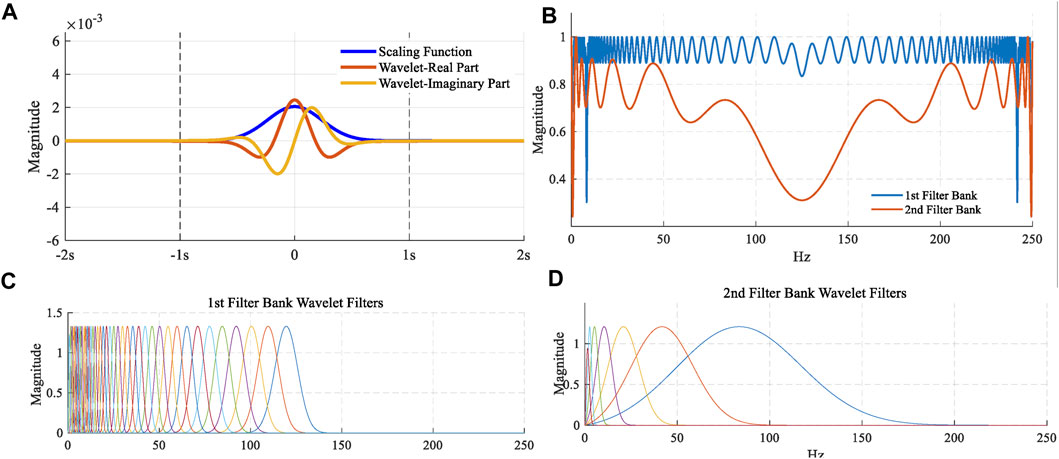
FIGURE 4. (A) Time-domain plots of the scale function and Morlet wavelet function; (B) Littlewood–Paley sums; (C) 41 first-order wavelet functions; (D) 7 second-order wavelet functions.
The evaluation indexes used in this study are sensitivity (Se), precision (+P), comprehensive index F1 measure for A\B\C three quality grades, and modified accuracy (mACC). Se is the proportion of a certain class that has correctly predicted the total number of all real classes in the test dataset, including
where TNA, TNB, and TNC are the number of signals accurately predicted as classes A, B, and C, respectively. NA, NB, and NC are the number of all real class A, B, and C signals in the test set, respectively. TA, TB, and TC are the number of all predicted to be class A, B, and C signals in the test set, respectively.
The total number of signals in the database was 50,085. By pre-assessment, 1,029 lead-off and pure noise signals were eliminated. Remaining 49,056 signals were used to study the classification performance of the wavelet scattering network. In this study, a bi-directional long short-term memory (Bi-LSTM) network with the adaptive moment estimation (ADAM) solver was employed to train the classification model. The maximum number of epochs was 1,000. To reduce the amount of padding in the mini-batches, choose a mini-batch size of 490. The 10-fold cross-validation was employed to evaluate the classification performance of the model. All the segments were randomly divided into 10 groups. Also, the number of signals for each fold was 4,905.
For real-time SQA performance analysis, the reliability of the whole wavelet scattering network method on real wearable dynamic ECG signals was tested. A Lenovo H3 dynamic ECG device was used for this experiment. Figure 5 shows the schematic diagram of device wearing. There were 60 subjects (24 females, 36 males) aged between 19 and 24 years in this experiment. For each subject, a 10-min duration of dynamic ECG signals was recorded under different physical activity conditions. The subjects wearing Lenovo H3 dynamic ECG devices were asked to perform different activities for 10-min duration, including sitting, walking, jogging, sitting, running, sitting, jumping, and sitting. In order to eliminate the interaction between two different physical activities, the subject was asked to sit and rest after strenuous exercise, such as running and jumping. The continuous wearable ECG signals collected by the Lenovo H3 device were transmitted to the phone via Bluetooth. The ECG signal was segmented with a frame length of 10 s and a hop-size of 1 s. The proposed wavelet scattering network SQA classifier evaluated the quality of the whole signal. The scattering characteristic matrix of the segment signals was generated by the proposed three-layer wavelet scattering network. A classification model was trained by all the signals (a total of 49,056) in the constructed database. By this classifier, the segmented signal was classified into different quality levels.
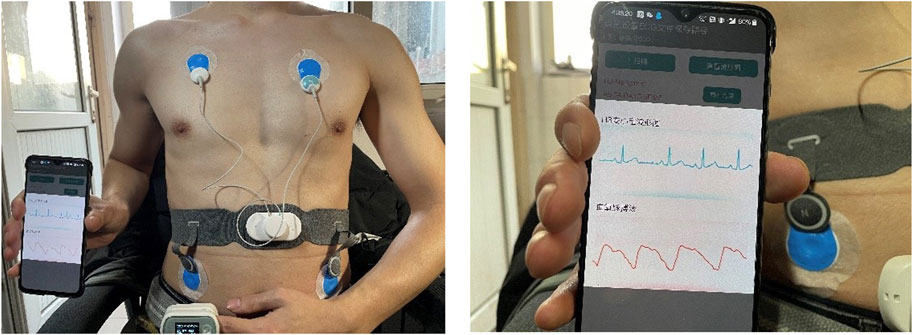
FIGURE 5. Schematic diagram of device wearing.
Tables 3 shows the confusion matrices of the classification results for an independent test set, and table 4 displays 11 evaluation indexes (
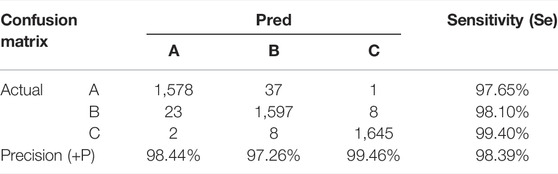
TABLE 3. Confusion matrices of the classification results for an independent test set.
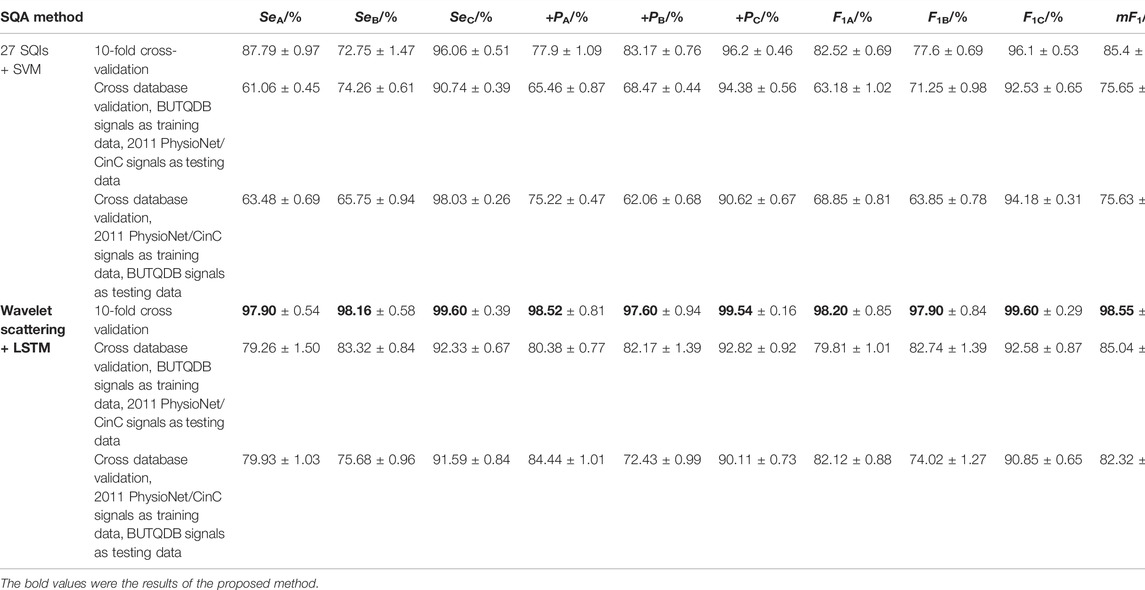
TABLE 4. Classified results of 27 SQI-based SVM classifiers and proposed method.
For classification performance comparisons, 27 typical SQA methods were selected (picaSQI (Li et al., 2014), tSQI (Liu F. et al., 2020), kSQI (Clifford et al., 2012), ELZ_compl_SQI (Zhang et al., 2014), sSQI (Clifford et al., 2012), bSQI_4 (Liu et al., 2018), DisEn_SQI (Li et al., 2015), pSQI (Li et al., 2008), bsSQI (Li et al., 2014), iSQI (Liu et al., 2019b), basSQI (Li et al., 2014), ApEn_SQI (Pincus et al., 1991), bSQI_2 (Li et al., 2008), HpSQI (Liu F. et al., 2020), FuzzyEn_SQI (Di Marco et al., 2012), SampEn_SQI (Chen et al., 2009), SDN_SQI (Everss-Villalba et al., 2017), eSQI (Li et al., 2014), MSQI (Tobon Vallejo et al., 2014), MpSQI, LpSQI (Liu F. et al., 2020), rsdSQI (Li et al., 2014), purSQI (Nemati et al., 2010), pcaSQI (Behar et al., 2013), PLI_SQI (Everss-Villalba et al., 2017), LZ_compl_SQI (Zhang et al., 2016), and hfSQI (Li et al., 2014)). These SQA methods were mainly based on the SQI indexes extracted from the time domain, frequency domain features, QRS waves, nonlinear characteristic, and others. The support vector machine (SVM) classifier was employed to train the classification model. As shown in Table 4, the classification accuracy of multi SQIs for 10-fold cross-validation was 85.33%.
Considering the overfitting influence of deep learning, cross-database validation was carried out to verify the generalization ability of this proposed method. All signals from BUTQDB were used as training data, while all signals from the 2011 PhysioNet/CinC were used as testing data, and vice versa, all signals from the 2011 PhysioNet/CinC were used as training data, while all signals from BUTQDB were used as testing data. Table 4 also displays the results of cross-database validation. For these two classifiers, classification accuracies were all greater than 80%. It was not as good as 10-fold cross-validation. The classification accuracy of multi SQIs for cross-database validation was about 75%.
In this study, we proposed a new SQA classification method based on a three-layer wavelet scattering network and built a wearable ECG quality database with 50,085 recordings for A/B/C three quality levels. The proposed SQA classifier had an excellent performance on this database (
In this study, the proposed three-layer wavelet scattering network was a deep learning framework which could extract complementary compact information automatically. The wavelet scattering network used the deep convolutional network architecture iterates over wavelet convolution, nonlinear modulus, and averaging (pooling) operators to compute higher-order scattering coefficients, which build translation invariant, stable, and informative signal representations. But the filters of the wavelet scattering network were predefined Morlet wavelets (Bruna and Mallat, 2013), which did not need to be learned from data. The Morlet wavelets were a localized waveform, having a better frequency resolution and stability to deformations, which could impose the separation of the different quality signals. The nonlinear modulus propagator recombines real and imaginary parts of complex wavelet coefficients, which could keep the low frequency averaging and obtain the translation invariant representation. Although the modulus operator removed the complex phase and lost information about the high frequencies, it kept the temporal variation of the multiscale envelopes. Also, the high frequencies information lost by the pooling can be recovered as wavelet coefficients in the next layers as the wavelet transform was a redundant representation. High order scattering coefficients could characterize transient phenomena of the different noises from free living. To recover this high-frequency information, a new wavelet transform was implemented to the signal in the next layers before the nonlinear modulus and pooling were performed.
The invariance scale was also termed as the interval of time-shift invariance, which was defined by the size of the time averaging window. The influence of this parameter was also considered in this study. Also, the scattering coefficients were computed at scales
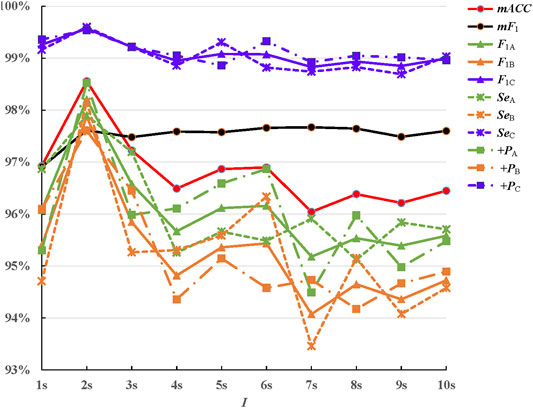
FIGURE 6. Classification results for invariance scale
At present, most studies about the signal-quality assessment divided the ECG signals into acceptable and unacceptable. There are fewer public databases with three quality levels. For performance comparisons, 27 typical SQA methods were selected to test the performance of this new database. These methods mostly had better performance on the database including two classes of ECG signals. Multiple SQI feature–based classifiers were lower than the proposed novel classification method. In order to analyze the performances of these SQIs better, Figure 7 displays the distribution of these SQIs on the A/B/C quality levels signals. Green, orange, and blue dots represent class A/B/C signals, respectively. The SQIs, which are only based on the QRS waves, such as bSQI-4 and bSQI-2, were defined by the comparison of four or two QRS wave detectors on a single-lead signal. They had good performance on the database with two classes of ECG signals (
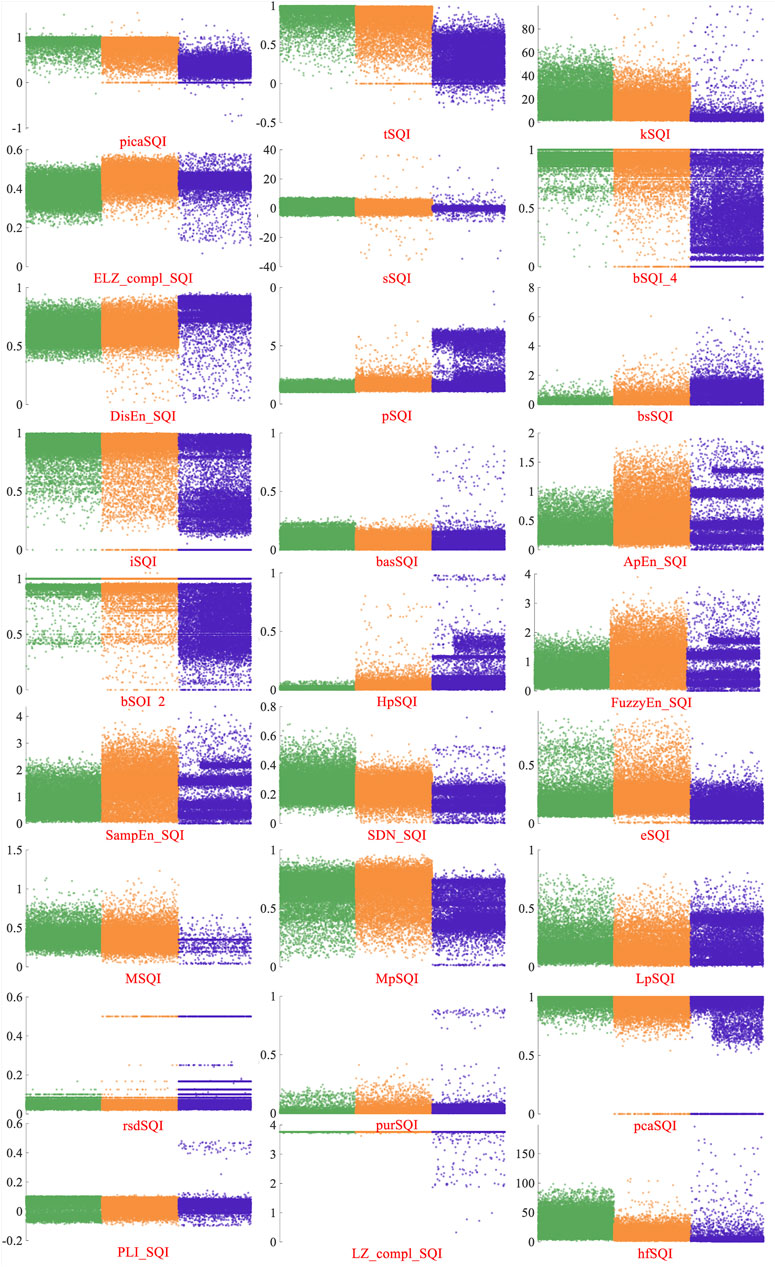
FIGURE 7. Distribution of 27 SQIs on the A/B/C quality levels signals. Green, orange, and blue dots represent class A/B/C signals, respectively.
It should be noted that all these 27 SQIs that we selected were unlikely to be the optimal indexes. We tried to pick as many quality metrics as possible, but it is impossible to pick all of them. Meanwhile, because some SQIs were published in a theoretical way without the executable program, and some literature works lacked detailed necessary preprocessing operations, some SQIs were coded by us. Thus, the classing results in this study could be different from those in the other studies, but the differences are unimportant.
In this study, all the programs were implemented using MATLAB 2020a. Table 5 illustrates the mean time costs and standard deviation values of the 12 SQIs and the proposed method by analyzing 49,056 10-s ECG segments in the database. As shown in Table 5, the proposed method was the most time-efficient compared with 12 SQIs. Also, 18.25 ms was not a long-time cost for 10-s ECG segments.

TABLE 5. Mean time costs and standard deviation values of 12 SQIs and proposed method.
For real-time SQA performance analysis, the reliability of the whole wavelet scattering networks method on real wearable ECG signals was tested. Figure 8 displays two segments of 10-min duration of dynamical ECG signals, physical activities, and evaluation results. As it turns out, under the sitting and walking conditions, the quality of the ECG signal was very good and all signals are assessed as class A, which can be used for the cardiovascular disease diagnosis. In the jogging condition, some signals were contaminated by weak artifacts and assessed as class B. But they could not affect the R wave identification, which can be used for the heart rate measure. In the running and jumping conditions, most of the signals were contaminated by seriously large noises caused by violent motion and assessed as class C. These signals will interfere with the diagnosis of the cardiovascular disease and need to be removed. Also, the proposed SQA method could identify the changing of the position. During the changing stage, there were some fluctuations in the signal. These signals were assessed as class B. The evaluation results show that the proposed wavelet scattering network SQA classifier framework has capability to assess wearable dynamic ECG signal quality.
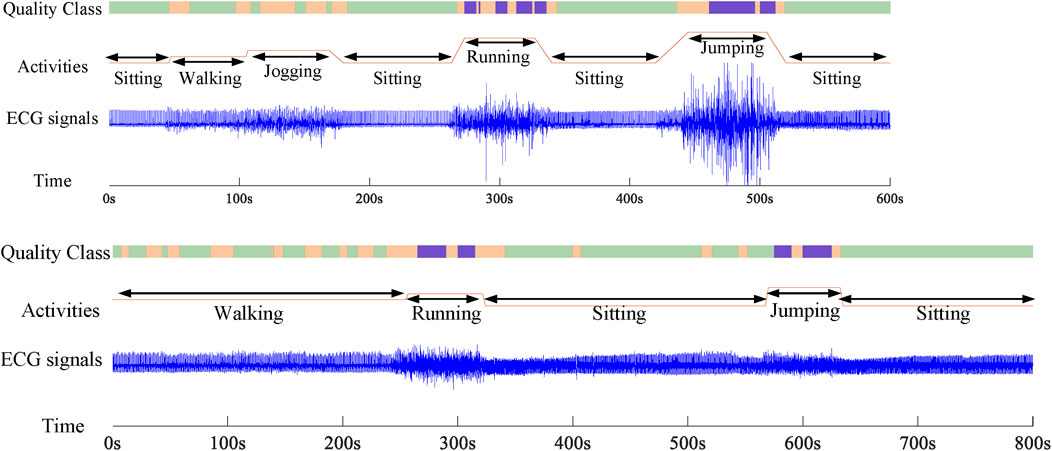
FIGURE 8. Two records about 10-min duration of dynamical ECG signals, physical activities, and evaluation results.
In this study, cross-database testing was also carried out to verify the generalization ability of this proposed method. As the results show, classification accuracy was greater than 80%. The performance of cross-database validation was not good as 10-fold cross-validation. But for class C,
In this study, the approach adding noise to clean data was used to balance the database classes. Also, those clear recordings from classes A and B used to upsample class C, were put back into the original classes. It needs to be considered if this synthetic noise is going to play a role in the classification results. If one clear recording from class A is in the training set and it was also corrupted by noises used to upsample the class C in the test set. If this recording includes some information on the test set, this information will tend to judge this recording as class A. However, it was a contaminated recording and labeled as class C. Therefore, if there is some information generated by balancing the dataset on the test set, classification accuracy will be reduced. However, the classification performance of this method was very good. Therefore, the approach used to balance the dataset did not influence the classification results. The testing of real signals without synthetic addition was also carried out to consider the influence of this balancing data approach. A new database was built with 5,687 recordings without any synthetic noise added, class A: 2,000, class B: 2,000, and class C: 1,687. We used 30% of the data for testing and the remaining 70% of the data for training. The values of 11 evaluation indexes were nearly all greater than 90%, mACC = 94.05%, mF1 = 94.03%, SeA = 93.35%, SeB = 91.25%, SeC = 97.55%, +PA = 94.44%, +PB = 92.73%, +PC = 94.94%, F1A = 93.89%, F1B = 91.98%, and F1C = 96.23%. The reduction in the data volume reduced the accuracy of the model, which was also acceptable. The approach of adding noise to clean data to balance the database classes was also used in Clifford et al. (2012).
Most notably, there is no unified evaluation criterion to determine the quality levels of wearable ECG at present. Different databases provide different evaluation methods. For example, the data in the 2011 PhysioNet/CinC Challenge are 12-lead recordings, having a length of 10 s 3–18 annotators marking each signal, and each record was assigned to one of the three groups (acceptable 773, indeterminate 2, and unacceptable 225) based on the average score. Some studies considered that the label of “acceptable” or “unacceptable” was for the whole 12 channels, not for the single channel. Therefore, they re-labeled each channel (Clifford et al., 2012; Liu et al., 2018), and balanced the classes by adding noise to some of the clean data. However, in the BUTQDB database, 18 single-lead signals longer than 24 h were recorded using the Bittium Faros 180 device. The parts of signals were selected to be grouped into three quality levels based on the labels annotated by three experts. Also, some studies constructed a manually annotated gold standard, collected and annotated ECG recordings by themselves (Redmond et al., 2012; Satija et al., 2017; Liu et al., 2019b; Smital et al., 2020). Different classification standards and annotating methods could have great influence on the SQA performance.
Wearable electrocardiogram quality assessment is quite crucial for cardiovascular disease prevention and diagnosis. It is also an important issue for wearable device development. Although the proposed new method had great performance on the quality assessment, it was not very well for cross-database validation. The main reason is the difference between annotation methods and classification grades. For future work, uniform and standardized evaluation criterion is quite crucial for the wearable ECG quality assessment.
This study aimed to provide a method to classify wearable dynamic ECG signals into three grades: high quality (A), medium quality (B), and low quality (C). A new SQA classification method based on a three-layer wavelet scattering network and transfer learning LSTM was proposed, and a wearable ECG quality database with 50,085 recordings for three quality grades was built. In order to avoid the adverse impact of invalid samples on the training models, the quality pre-assessment was used to delete the lead-fall signals and pure noise. A three-layer wavelet scattering network was performed on the selected 10-s-long signal segments, which can extract more systematic and comprehensive characteristics by analyzing the signals thoroughly and deeply. The Bi-LSTM network with ADAM solver was employed to train the classification model. The 11 evaluating indexes (
The raw data supporting the conclusion of this article will be made available by the authors, without undue reservation.
FL, CL, and SX designed the research. FL designed the algorithm and analyzed the data. SW, LC, and YR contributed to signal relabeling. XR, ZX, and SA, contributed to collecting and sorting data. FL wrote the manuscript. CL contributed to revising it critically for the important intellectual content. All authors have read and approved of the version to be published.
This work was supported by the National Natural Science Foundation of China (grant numbers 61901114, 82072014, 81871444, 62171123), Shandong Province Key Basic Research program (grant numbers ZR2020ZD25), the National Key R&D Program of China (grant numbers 2019YFE0113800), and the Shandong Province Natural Science Foundation (grant numbers ZR2020MF028).
The authors declare that the research was conducted in the absence of any commercial or financial relationships that could be construed as a potential conflict of interest.
All claims expressed in this article are solely those of the authors and do not necessarily represent those of their affiliated organizations, or those of the publisher, the editors, and the reviewers. Any product that may be evaluated in this article, or claim that may be made by its manufacturer, is not guaranteed or endorsed by the publisher.
The authors would like to thank the cardiology team at the Department of Biomedical Engineering, Brno University of Technology and the 2011 PhysioNet/CinC Challenge for providing the ECG Quality Database.
Anden J., Mallat S. (2014). Deep Scattering Spectrum. J IEEE Trans. Signal Process. A Publ. IEEE Signal Process. Soc. 62 (16), 4114–4128.
Andrea N., Radovan S., Lucie M., Luká S., Martin V. J. B. R. I. (2018). A Comparative Analysis of Methods for Evaluation of ECG Signal Quality after Compression. Biomed. Res. Int. 2018, 1868519. doi:10.1155/2018/1868519
Behar J., Oster J., Qiao Li Q., Clifford G. D. (2013). ECG Signal Quality during Arrhythmia and its Application to False Alarm Reduction. IEEE Trans. Biomed. Eng. 60 (6), 1660–1666. doi:10.1109/tbme.2013.2240452
Bruna J., Mallat S. (2013). Invariant Scattering Convolution Networks. IEEE Trans. Pattern Anal. Mach. Intell. 35 (8), 1872–1886. doi:10.1109/tpami.2012.230
Chen W., Zhuang J., Yu W., Wang Z. (2009). Measuring Complexity Using FuzzyEn, ApEn, and SampEn. Med. Eng. Phys. 31 (1), 61–68. doi:10.1016/j.medengphy.2008.04.005
Clifford G. D., Behar J., Li Q., Rezek I. (2012). Signal Quality Indices and Data Fusion for Determining Clinical Acceptability of Electrocardiograms. Physiol. Meas. 33 (9), 1419–1433. doi:10.1088/0967-3334/33/9/1419
Clifford G. D., Moody G. B. (2012). Signal Quality in Cardiorespiratory Monitoring. Physiol. Meas. 33 (9), 1–6. doi:10.1088/0967-3334/33/9/e01
Destouet G., Dumas C., Frassati A., Perrier V. (2021). Wavelet Scattering Transform and Ensemble Methods for Side-Channel Analysis. Cham: Springer International Publishing.
Di Marco L. Y., Duan W., Bojarnejad M., Zheng D., King S., Murray A., et al. (2012). Evaluation of an Algorithm Based on Single-Condition Decision Rules for Binary Classification of 12-lead Ambulatory ECG Recording Quality. Physiol. Meas. 33 (9), 1435–1448. doi:10.1088/0967-3334/33/9/1435
Everss-Villalba E., Melgarejo-Meseguer F., Blanco-Velasco M., Gimeno-Blanes F., Sala-Pla S., Rojo-Álvarez J., et al. (2017). Noise Maps for Quantitative and Clinical Severity towards Long-Term ECG Monitoring. Sensors 17 (11), 2448. doi:10.3390/s17112448
Fousek P., Goel V., Kingsbury B., Marcheret E., Maymon S., Nahamoo D., et al. (2015). Deep Scattering Spectrum in Acoustic Modeling for Speech Recognition.
Goldberger A. L., Amaral L. A. N., Glass L., Hausdorff J. M., Ivanov P. C., Mark R. G., et al. (2000). PhysioBank, PhysioToolkit, and PhysioNet. Circulation 101 (23), e215–e220. doi:10.1161/01.CIR.101.23.e215
He J., Liu D., Chen X. (2020). Wearable Exercise Electrocardiograph Signal Quality Assessment Based on Fuzzy Comprehensive Evaluation Algorithm. Comput. Commun. 151, 86–97. doi:10.1016/j.comcom.2019.12.051
Huerta A., Martínez-Rodrigo A., González V., Quesada A., Rieta J. J., Alcaraz R. (2019). “Quality Assessment of Very Long-Term ECG Recordings Using a Convolutional Neural Network,” in 2019 E-Health and Bioengineering Conference (EHB), Iasi, Romania, 21-23 November 2019.
Ip J. E. (2019). Wearable Devices for Cardiac Rhythm Diagnosis and Management. JAMA 321 (4), 337–338. doi:10.1001/jama.2018.20437
Joy N. M., Oglic D., Cvetkovic Z., Bell P., Renals S. (2020). “Deep Scattering Power Spectrum Features for Robust Speech Recognition,” in Interspeech 2020, Shanghai, China, October 25–29, 2020. doi:10.21437/interspeech.2020-2656
Kaptoge S., Pennells L., De Bacquer D., Cooney M. T., Kavousi M., Stevens G., et al. (2019). World Health Organization Cardiovascular Disease Risk Charts: Revised Models to Estimate Risk in 21 Global Regions. Lancet Glob. Health 7 (10), e1332–e1345. doi:10.1016/S2214-109X(19)30318-3
Li P., Liu C., Li K., Zheng D., Liu C., Hou Y., et al. (2015). Assessing the Complexity of Short-Term Heartbeat Interval Series by Distribution Entropy. Med. Biol. Eng. Comput. 53 (1), 77–87. doi:10.1007/s11517-014-1216-0
Li Q., Mark R. G., Clifford G. D. (2008). Robust Heart Rate Estimation from Multiple Asynchronous Noisy Sources Using Signal Quality Indices and a Kalman Filter. Physiol. Meas. 29 (1), 15–32. doi:10.1088/0967-3334/29/1/002
Li Q., Rajagopalan C., Clifford G. D. (2014). A Machine Learning Approach to Multi-Level ECG Signal Quality Classification. Comput. Methods Programs Biomed. 117 (3), 435–447. doi:10.1016/j.cmpb.2014.09.002
Li Z., Hou Y., Xie X., Li S., Liu W. (2019). “Multi-level Attention Model with Deep Scattering Spectrum for Acoustic Scene Classification,” in 2019 IEEE International Conference on Multimedia & Expo Workshops (ICMEW), Shanghai, China, 08-12 July 2019.
Liu C., Li P., Zhao L., Liu F. (2011). Real-time Signal Quality Assessment for ECGs Collected Using Mobile Phones. Computing in Cardiology. Hangzhou, China, 38, 357–360.
Liu C., Yang M., Di J., Xing Y., Li Y., Li J. (2019a). Wearable ECG: History, Key Technologies and Future Challenges. Chin. J. Biomed. Eng. 38 (6), 641–652. doi:10.3969/j.issn.0258-8021.2019.06.001
Liu C., Zhang X., Zhao L., Liu F., Chen X., Yao Y., et al. (2019b). Signal Quality Assessment and Lightweight QRS Detection for Wearable ECG SmartVest System. IEEE Internet Things J. 6, 1363–1374. doi:10.1109/JIOT.2018.2844090
Liu F., Liu C., Zhao L., Jiang X., Zhang Z., Li J., et al. (2018). Dynamic ECG Signal Quality Evaluation Based on the Generalized bSQI Index. IEEE Access 6, 41892–41902. doi:10.1109/ACCESS.2018.2860056
Liu F., Wei S., Lin F., Jiang X., Liu C. (2020). “An Overview of Signal Quality Indices on Dynamic ECG Signal Quality Assessment,” in Feature Engineering and Computational Intelligence in ECG Monitoring. Editors C. Liu., and J. Li (Singapore: Springer), 33–54. doi:10.1007/978-981-15-3824-7_3
Liu Z., Yao G., Zhang Q., Zhang J., Zeng X. (2020). Wavelet Scattering Transform for ECG Beat Classification. J Comput. Math. Methods Med. 2020 (7), 3215681. doi:10.1155/2020/3215681
Mallat S. (2012). Group Invariant Scattering. Comm. Pure Appl. Math. 65 (10), 1331–1398. doi:10.1002/cpa.21413
Mei N., Wang H., Zhang Y., Liu F., Jiang X., Wei S. (2021). Classification of Heart Sounds Based on Quality Assessment and Wavelet Scattering Transform. Comput. Biol. Med. 137, 104814. doi:10.1016/j.compbiomed.2021.104814
Moody G. B., Muldrow W. K., Mark R. G. (1984). Noise Stress Test for Arrhythmia Detectors. J Comput. Cardiol. 11, 381–384.
Nemati S., Malhotra A., Clifford D. C. (2010). Data Fusion for Improved Respiration Rate Estimation. EURASIP J. Adv. Signal Process 2010, 926305. doi:10.1155/2010/926305
Nemcova A., Smisek R., Opravilová K., Vitek M., Smital L., Maršánová. L. (2020). Brno University of Technology ECG Quality Database (BUT QDB). PhysioNet. doi:10.13026/kah4-0w24
Pincus S. M., Gladstone I. M., Ehrenkranz R. A. (1991). A Regularity Statistic for Medical Data Analysis. J. Clin. Monit. Comput. 7 (4), 335–345. doi:10.1007/bf01619355
Redmond S. J., Xie Y., Chang D., Basilakis J., Lovell N. H. (2012). Electrocardiogram Signal Quality Measures for Unsupervised Telehealth Environments. Physiol. Meas. 33 (9), 1517–1533. doi:10.1088/0967-3334/33/9/1517
Roth G. A., Abate D., Abate K. H., Abay S. M., Abbafati C., Abbasi N., et al. (2018). Global, Regional, and National Age-sex-specific Mortality for 282 Causes of Death in 195 Countries and Territories, 1980-2017: a Systematic Analysis for the Global Burden of Disease Study 2017. Lancet 392, 1736–1788. doi:10.1016/S0140-6736(18)32203-7
Satija U., Ramkumar B., Manikandan M. S. (2018). A Review of Signal Processing Techniques for Electrocardiogram Signal Quality Assessment. IEEE Rev. Biomed. Eng. 11, 36–52. doi:10.1109/RBME.2018.2810957
Satija U., Ramkumar B., Sabarimalai Manikandan M. (2017). Real-Time Signal Quality-Aware ECG Telemetry System for IoT-Based Health Care Monitoring. IEEE Internet Things J. 4 (3), 815–823. doi:10.1109/jiot.2017.2670022
Sepúlveda A., Castillo F., Palma C., Rodriguez-Fernandez M. (2021). Emotion Recognition from ECG Signals Using Wavelet Scattering and Machine Learning. Appl. Sci. 11 (11), 4945.
Silva I., Moody G. B., Celi L. (2011). “Improving the Quality of ECGs Collected Using Mobile Phones: The PhysioNet/Computing in Cardiology Challenge 2011,” in 2011 Computing in Cardiology, Hangzhou, China, September 18–21, 2011, 273–276.
Smital L., Haider C. R., Vitek M., Leinveber P., Jurak P., Nemcova A., et al. (2020). Real-Time Quality Assessment of Long-Term ECG Signals Recorded by Wearables in Free-Living Conditions. IEEE Trans. Biomed. Eng. 67 (10), 2721–2734. doi:10.1109/TBME.2020.2969719
Tang Y. Y., Lu Y., Yuan H. (2015). Hyperspectral Image Classification Based on Three-Dimensional Scattering Wavelet Transform. IEEE Trans. Geosci. Remote Sens. 53 (5), 2467–2480. doi:10.1109/tgrs.2014.2360672
Tobon Vallejo D., Falk T., Maier M. (2014). MS-QI: A Modulation Spectrum-Based ECG Quality Index for Telehealth Applications. Ieee. Trans. Biomed. Eng. 63 (8), 1613–1622. doi:10.1109/TBME.2014.2355135
Xu H., Yan W., Lan K., Ma C., Wu D., Wu A., et al. (2021). Assessing Electrocardiogram and Respiratory Signal Quality of a Wearable Device (SensEcho): Semisupervised Machine Learning-Based Validation Study. JMIR Mhealth Uhealth 9 (8), e25415. doi:10.2196/25415
Zhang Y.-t., Liu C.-y., Wei S.-s., Wei C.-z., Liu F.-f. (2014). ECG Quality Assessment Based on a Kernel Support Vector Machine and Genetic Algorithm with a Feature Matrix. J. Zhejiang Univ. - Sci. C 15 (7), 564–573. doi:10.1631/jzus.c1300264
Zhang Y., Wei S., Liu H., Zhao L., Liu C. (2016). A Novel Encoding Lempel-Ziv Complexity Algorithm for Quantifying the Irregularity of Physiological Time Series. Comput. Methods Programs Biomed. 133, 7–15. doi:10.1016/j.cmpb.2016.05.010
Keywords: dynamic electrocardiogram, signal-quality assessment, wavelet scattering, signal-quality index, long short-term memory network
Citation: Liu F, Xia S, Wei S, Chen L, Ren Y, Ren X, Xu Z, Ai S and Liu C (2022) Wearable Electrocardiogram Quality Assessment Using Wavelet Scattering and LSTM. Front. Physiol. 13:905447. doi: 10.3389/fphys.2022.905447
Received: 27 March 2022; Accepted: 30 May 2022;
Published: 30 June 2022.
Edited by:
Jichao Zhao, The University of Auckland, New ZealandReviewed by:
Lakhan Dev Sharma, VIT-AP University, IndiaCopyright © 2022 Liu, Xia, Wei, Chen, Ren, Ren, Xu, Ai and Liu. This is an open-access article distributed under the terms of the Creative Commons Attribution License (CC BY). The use, distribution or reproduction in other forums is permitted, provided the original author(s) and the copyright owner(s) are credited and that the original publication in this journal is cited, in accordance with accepted academic practice. No use, distribution or reproduction is permitted which does not comply with these terms.
*Correspondence: Shengxiang Xia, eGlhc0BzZGp6dS5lZHUuY24=; Chengyu Liu, Y2hlbmd5dUBzZXUuZWR1LmNu
Disclaimer: All claims expressed in this article are solely those of the authors and do not necessarily represent those of their affiliated organizations, or those of the publisher, the editors and the reviewers. Any product that may be evaluated in this article or claim that may be made by its manufacturer is not guaranteed or endorsed by the publisher.
Research integrity at Frontiers
Learn more about the work of our research integrity team to safeguard the quality of each article we publish.