- 1Section Solutions Division, Healthcare Solutions Development Unit, Fujitsu Japan Limited, Shiodome City Center, Tokyo, Japan
- 2RIKEN Center for Computational Science HPC- and AI-driven Drug Development Platform Division, AI-driven Drug Discovery Collaborative Unit, Kobe, Japan
- 3UT-Heart Inc., Kashiwanoha Campus Satellite, Kashiwa, Japan
- 4Graduate School of Frontier Sciences, University of Tokyo, Kashiwanoha Campus Satellite, Kashiwa, Japan
Changes in intracellular calcium concentrations regulate heart beats. However, the decline in the left ventricular pressure during early diastole is much sharper than that of the Ca2+ transient, resulting in a rapid supply of blood to the left ventricle during the diastole. At the tissue level, cardiac muscles have a distinct characteristic, known as stretch activation, similar to the function of insect flight muscles. Stretch activation, which is a delayed increase in force following a rapid muscle length increase, has been thought to be related to autonomous control in these muscles. In this numerical simulation study, we introduced a molecular mechanism of stretch activation and investigated the role of this mechanism in the pumping function of the heart, using the previously developed coupling multiple-step active stiffness integration scheme for a Monte Carlo (MC) cross-bridge model and a bi-ventricular finite element model. In the MC cross-bridge model, we introduced a mechanism for trapping the myosin molecule in its post-power stroke state. We then determined the rate constants of transitions for trapping and escaping in a thermodynamically consistent manner. Based on our numerical analysis, we draw the following conclusions regarding the stretch activation mechanism: (i) the delayed force becomes larger than the original isometric force because the population of trapped myosin molecules and their average force increase after stretching; (ii) the delayed force has a duration of more than a few seconds owing to a fairly small rate constant of escape from the trapped state. For the role of stretch activation in heart pumping, we draw the following conclusions: (iii) for the regions in which the contraction force decreases earlier than the neighboring region in the end-systole phase, the trapped myosin molecules prevent further lengthening of the myocytes, which then prevents further shortening of neighboring myocytes; (iv) as a result, the contraction forces are sustained longer, resulting in a larger blood ejection, and their degeneration is synchronized.
Introduction
Stretch activation is a distinctive feature in the tension response that occurs after a small rapid stretch (lengthening of approximately 1% of the initial length) is imposed in the fiber direction to the isometrically contracting muscle. As illustrated in Figure 1A, after the rapid rise of tension during stretching (phase 1), the tension declines to a certain level (phase 2) and then rises again to a level higher than that of the original isometric force (phase 3). In the following, we refer to the force in phase 3 as the delayed force following Stelzer et al. (2006). The degree of delayed force development, or stretch activation, varies for different types of muscles. In particular, an increased delayed force is prominent in asynchronous insect flight muscles, in which stretch activation is thought to be a key factor of the spontaneous oscillations (SPOCs) that occur without intracellular Ca2+ regulation (Pringle 1978). Although heartbeats are regulated by the intracellular Ca2+ transient ([Ca2+]), the stretch activation mechanism is thought to promote efficient switching between the systole and diastole. In our previous work on a numerical bi-ventricular model (Washio et al., 2018), we showed that stretch activation might aid in synchronizing the generation of contraction force over all of the ventricles for a non-uniform rapid rise of [Ca2+] during isovolumetric contraction. The stretch activation may also aid in synchronizing the degeneration of contraction force against a non-uniform slow decline of [Ca2+] during early diastole. In the simulation, although the total length change of cardiomyocytes in the systole and diastole was approximately 15–20% larger than the length change in the stretch activation, it was shown that the activated force can be generated locally by instantaneous small stretches at the location where the active tension is smaller than the surrounding part because of inhomogeneities of the activation level (Washio et al., 2018). In this simulation study, we assumed a trapping mechanism for strongly binding myosin molecules and modeled this mechanism using a Langevin dynamics model of the power stroke transition. However, the fairly fine time step (∼0.25 ns) used in solving the Langevin equations presented an obstacle in extending this approach for clinical applications. Furthermore, we showed that a multiple-step active stiffness integration scheme that couples the Monte Carlo (MC) model with a larger time step (∼5
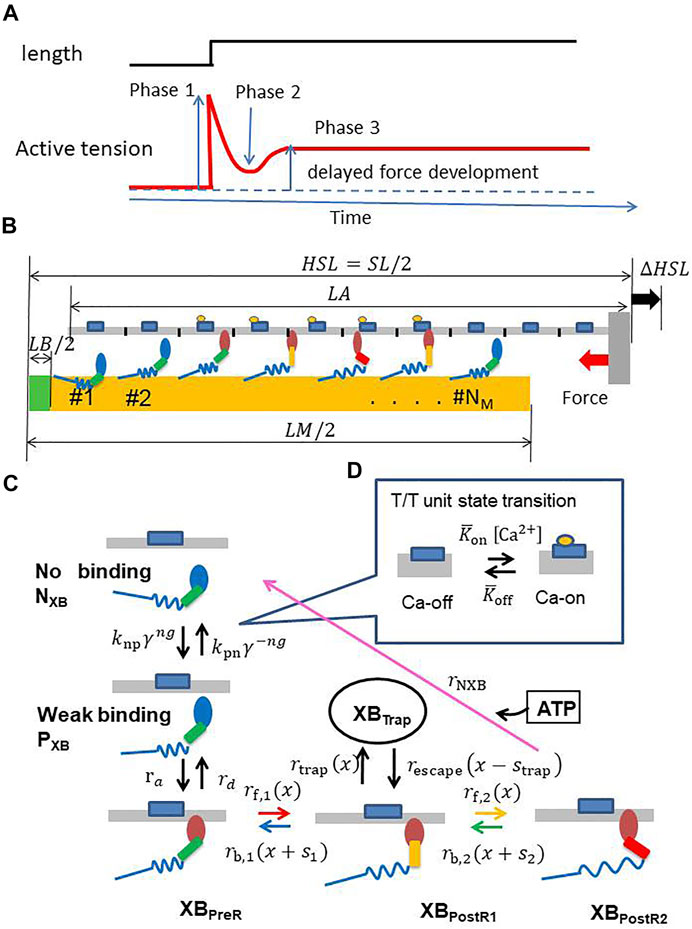
FIGURE 1. (A) A typical stretch activation response for a cardiomyocyte. Time course of the active tension (bottom) is illustrated for the response of length change (1–2%) (top) after steady-state is achieved. There is an initial increase in the active tension with the stretch (Phase 1), followed by a rapid decay in tension (Phase 2) to a minimum, and finally a delayed increase in tension (Phase 3, stretch activation). (B) A filament pair in the half-sarcomere model (C) the state transition MC model of the myosin molecule, and (D) the T/T unit.
We briefly present an overview of our sarcomere model (Figure 1B) with the MC cross-bridge model used in this study (Figures 1C,D). We provide details in the Materials and Methods section. We assume that NM (= 38) myosin molecules are arranged on the thick filament at regular intervals, except for the bare zone, whereas the thin filament is divided into NT (= 32) segments, termed troponin/tropomyosin (T/T) units. These numbers of myosin molecules and T/T units were determined by assuming that our one-dimensional model corresponds to one of the double spirals of the actual thin filament and surrounding accessible myosin molecules (Washio et al., 2016). A myosin molecule in our cross-bridge model has one non-binding state (NXB), one weakly binding state (PXB), and four strong binding states (XBPreR, XBPostR1, XBPostR2, and XBTrap) (Figure 1C). Here, the trap state XBTrap is added to our previous model (Yoneda et al., 2021) to reproduce the stretch activation. Ca2+ sensitivity is reproduced based on state transitions in the T/T units on the thin filament (Figure 1D). The coefficients knp and kpn in the rate constants between the non-binding state NXB and the weakly binding state PXB are changed according to the state of the T/T unit above the myosin molecule. Cooperativity in nearest neighbor interactions is incorporated with the factors γng and γ−ng to reproduce the force–pCa2+ relationship (Rice et al., 2003), where γ = 80 is used and ng = 0, 1, or 2 is the number of neighboring myosin molecules either in the weakly binding (PXB) or strong binding (XBPreR, XBPostR1, XBPostR2, and XBTrap) states.
The contraction force is generated by power stroke transitions in which the lever arm swing distance increases by
where
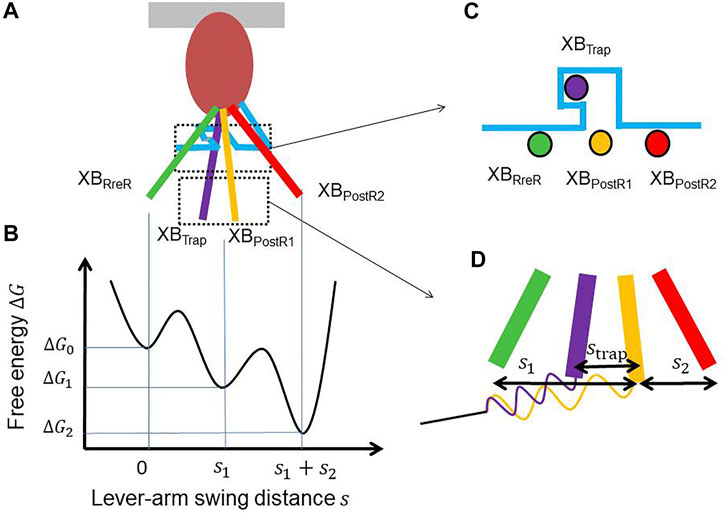
FIGURE 2. (A) Lever arm rotations at the four attached states with a hook (light blue) that traps the XBTrap state. (B) The free energy profile that drives the power strokes. (C) A cross-sectional view of the lever arm positions of the four attached states. (D) Magnification of the lever arm rotations with the spring of the myosin rod. The distortion of the myosin rod decreases by
Under the above formulation, the ratio
In Figure 2C, the trap mechanism is illustrated using a hook that inhibits the reverse transition to the XBPreR state. The power stroke distance is slightly shortened by
where
and the rate constant for escaping is:
From Eq. 2, the relationship between the ratio of the coefficients
If we assume linear elasticity for the myosin rod, the potential energy difference in Eq. 4 is represented by:
where
The structural mechanism of trapping has not yet been identified. However, the conformation change between the XBPreR state and XBPostR1 state (Figure 3A) and the arrangement of the converter domain and the lever arm in the XBPostR1 state (Figure 3B) produced by our coarse-grained molecular dynamic simulation (Washio et al., 2021) indicate that the V-shaped region in the converter domain could hold the lever arm when it is strongly pulled in the opposite direction (Figure 3C). Note that these configurations of the myosin molecule are drawn from the viewpoint indicated in Figure 3D. Once the lever arm is strongly held in the V-shaped region, it might inhibit reverse rotation of the converter domain (from Figures 3A,B), resulting in trapping of the lever arm. Supplementary Video 1 shows a simulation of the power stroke transition from the XBPreR state to the XBPostR1 state.
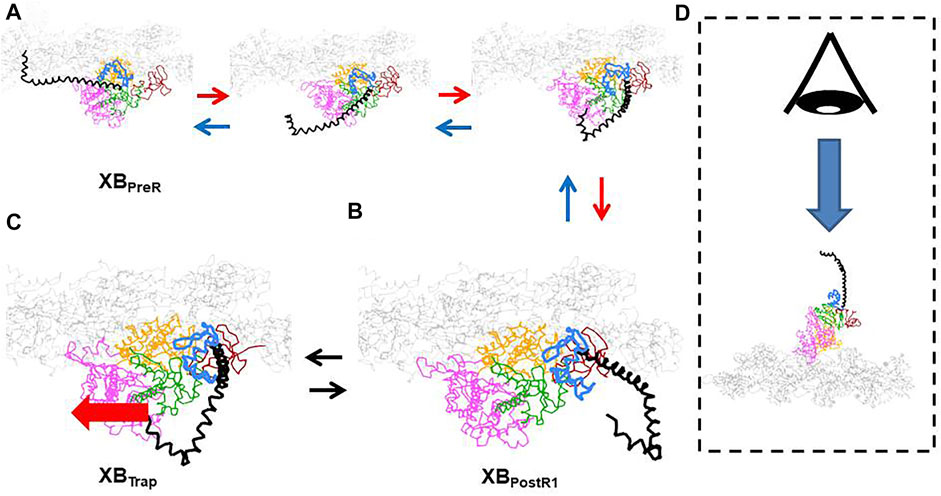
FIGURE 3. The conformation change of the myosin molecule in the first power stroke transition. (A) Intermediate conformations between the XBPreR and XBPostR1 states. (B) Conformation in the XBPostR1 states (C) A candidate of conformation of the XBTrap state with the imposed pulling force (thick red arrow). (D) The viewpoint for (A–C). The myosin molecule is divided into the following domains: lever arm (black), converter (light blue), N-terminal (brown), central domain (green), upper 50 k (pink), and lower 50 k (orange). The thin filament is colored gray. In the XBTrap state, the lever arm is trapped in the V-shaped region of the converter. The rotation of the converter might be inhibited in the case of a strong pulling force.
Determining which part of the contractile proteins is responsible for stretch activation remains controversial. Campbell and Chandra (Campbell and Chandra. 2006) reproduced stretch activation in cardiac muscle (Stelzer et al., 2006) by applying a numerical model, where they assumed that the thin filament regulatory unit (RU) was responsible. Conversely, Straight et al. (2019) proposed a myosin-based mechanism focusing on the ADP state, which corresponds to XBPostR1 in our MC model, although a trapping mechanism was not introduced in their model. A unique feature of our numerical model is its theoretical basement based on the Boltzmann distribution law under the strain energy for distortion of the myosin rod Eq. 2.
Materials and methods
Here, we introduce the cross-bridge MC model and its use in multiscale analyses. Cross-bridge MC models are arranged on a thick filament and interact with a thin filament. The pairs of filaments compose the half-sarcomere model (Figure 4A). Half-sarcomere models are imbedded into the myofibril model (Figure 4B) or the ventricle model (Figure 4C), where interactions of the half-sarcomere models in adjacent elements are analyzed. In the following, informative numerical results, representing basic properties of the MC cross-bridge model with the trapping mechanism are introduced to help readers understand the definitions of crucial parameters in the MC cross-bridge model.
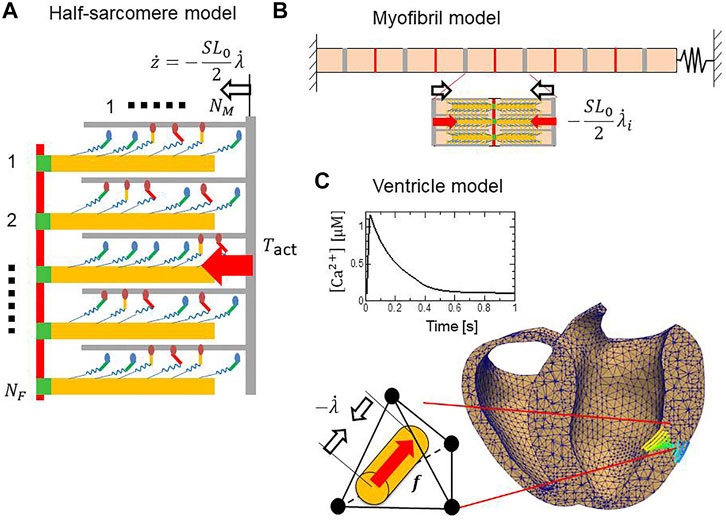
FIGURE 4. Computational models at three scales. (A) A half-sarcomere model consisting of
The parameter values, which are not related to the trap model, are listed in Table 1. Some of these values came from the following references [H2021]: Hwang et al., 2021 [K2016]: Kolb et al., 2016 [L2000]: Lodish et al., 2000 [R2008]: Rice et al., 2008 [S2013]: Sato et al., 2013, and [Y2021]: Yoneda et al., 2021.
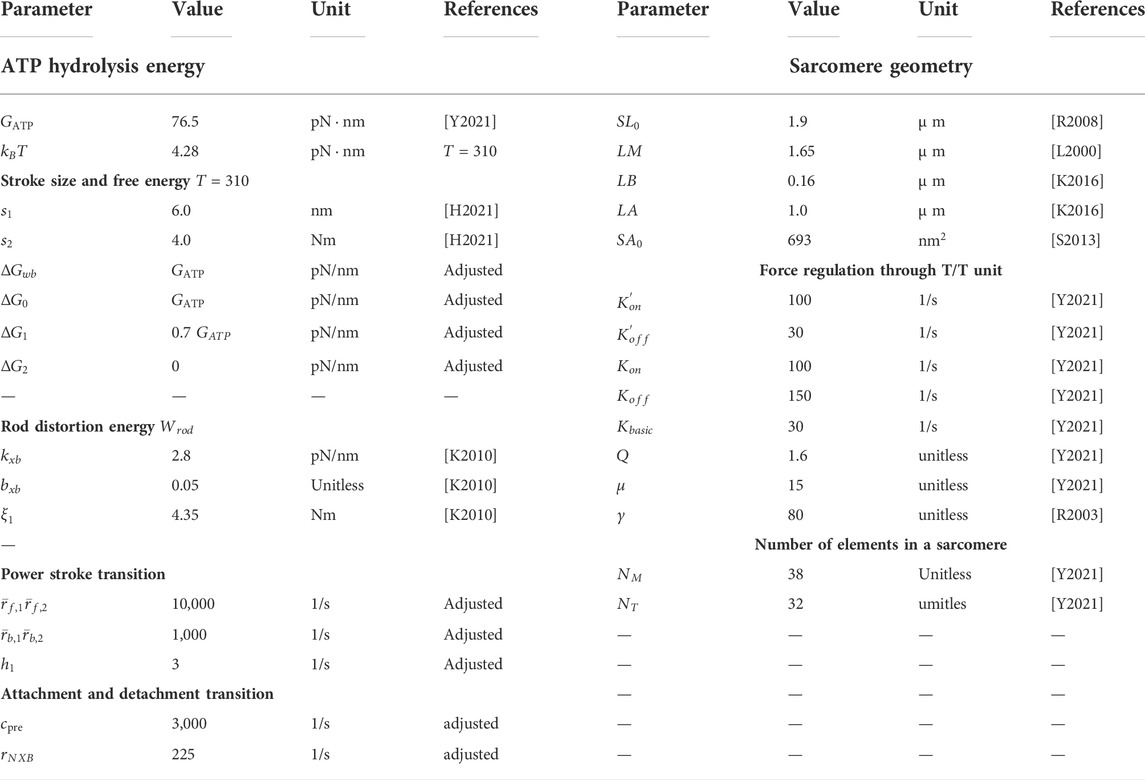
TABLE 1. Parameters for the actomyosin dynamics. “Adjusted” indicates that they were adjusted to reproduce the phenomena.
Parameters for the trap mechanism
Three parameters,
Control model of attachment and detachment and its effects on heart pumping
In our model, we assume that attachment, which represents the transition from the PXB state to the XBPreR state (Figure 1C), is allowed only in the single overlap region of the thin and thick filaments. The myosin head (MH) (#
Here, the middle term is the distance from the center of the sarcomere
Two states (Ca-off and Ca-on) are assumed by each T/T unit (Figure 1D). The transitions between the states of the T/T unit are determined by the Ca2+ concentration,
The transitions between the NXB and PXB states (Figure 1C) are affected by the status of the T/T unit above, via modifications of
Here, ⌊ ⌋ indicates the floor function, which rounds down after the decimal point. The parameter
Here,
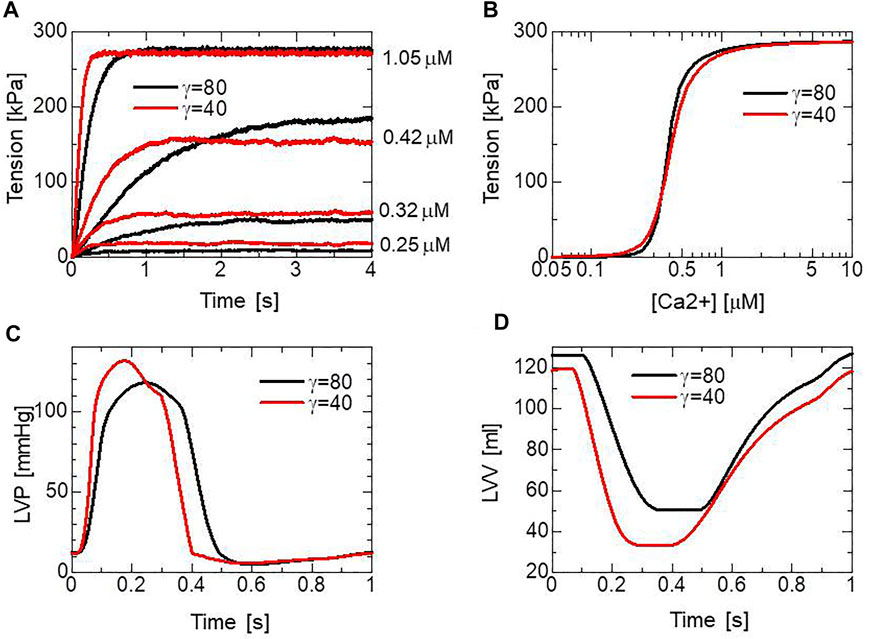
FIGURE 5. The simulated pCa-tension relationship of the MC cross-bridge model and its effects on heart pumping. (A) Time courses of the active tensions in the isometric contraction for [Ca2+] = 0.25, 0.42, and 1.05
We assume that one thin filament in the three-dimensional arrangement corresponds to two thin filaments in our half-sarcomere model. This case arises because we assumed that cooperative behavior exists along the tropomyosin molecules wrapped around the thin filament in a double-spiral fashion, and one spiral is modeled in our half-sarcomere. The constants
Here,
The values
The rate constants of attachment
The initial rod distortion at attachment is given stochastically based on a Boltzmann distribution determined from the rod strain energy,
Using the rate constants, we also considered forced detachments from the XBPreR, XBPostR1, and XBPostR2 states to the NXB state caused by extreme strain on the myosin rod:
Similarly, the rate constant of detachment from the XBTrap state is given by:
We paid close attention to the adjustments of parameters in Eqs 14 and 15 in reproducing the stretch activation. These parameters affect the degree of the increased delayed force. In this study, we used the following parameters to reproduce the characteristics of cardiac muscles:
Power stroke and reverse transitions
In our model, the rate constants of the power and reverse strokes are determined from the Kramers escape theory (Kramers 1940), in which rate constants are defined by the Boltzmann factor associated with the height of the energy barrier from the origin.
Here,
Here,
The elastic force of a myosin rod is nonlinear with respect to the strain (Kaya and Higuchi, 2010). We assume that the myosin rod behaves as a linear spring for positive stretches, whereas nonlinear behavior is introduced for negative stretches because of the slack induced along the myosin rod. The strain energy
Here,
Half-sarcomere model and its basic properties
We constructed a half-sarcomere model (Figure 5A) with
Here,
For the feedback between sarcomere dynamics and actomyosin dynamics, the relation between the time transients of the molecular and sarcomere variables can be expressed by:
Here,
where
The half-sarcomere shortening (
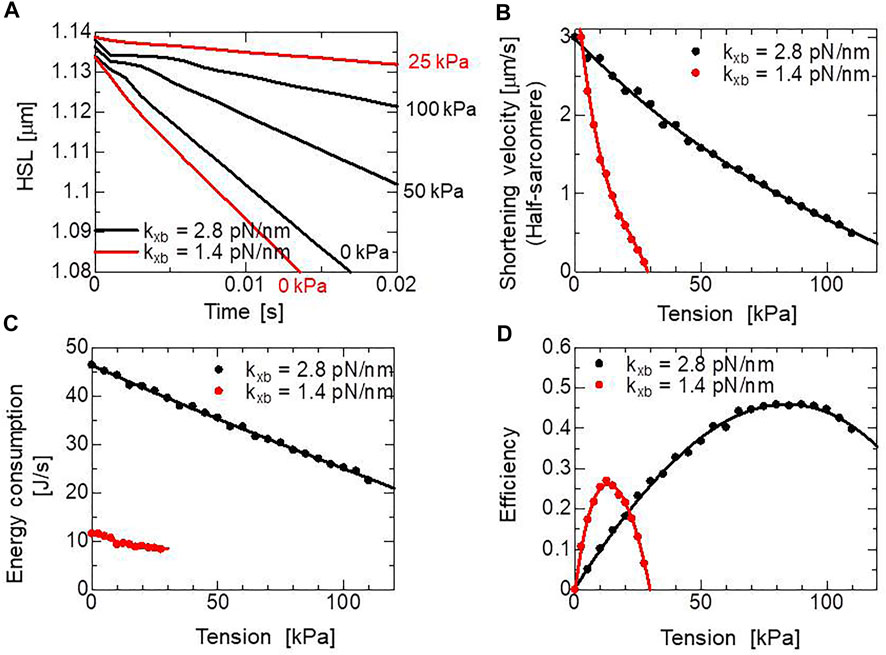
FIGURE 6. Simulated half-sarcomere length changes under isotonic conditions with the two cross-bridge model using different myosin rod stiffnesses,
The energy loss in the cross-bridge cycle is given during the power stroke transitions and detachment from the XBPostR2 state. The difference between
Coupling with macroscale models
In this study, coupling of the half-sarcomere model (Figure 4A) and the myofibril model (Figure 5B) or the ventricle model (Figure 4C) was achieved by applying the multiple-step active stiffness integration scheme in the exchange of the active tension
In the macroscale model, a much larger time step
The active tension
For simplicity, we introduce the Newton iteration for the one half-sarcomere model under the isotonic condition, as in Figure 6A.
where
After executing
where the residual is given by
Here,
See our previous work (Yoneda et al., 2021) for the actual computation of the right-hand side in Eq. 30. Under normal situations, the stiffness coefficient
The above implicit time integration scheme can be naturally extended to more general cases where the half-sarcomere models are imbedded in different elements that interact with each other at the element interfaces. In the myofibril model (Figure 4B), two degrees of freedom, the stretches
Here, the function
with
where the half-sarcomeres are separated by the M-band for the top expression, and are separated by the Z-disc for the lower expression.
Within each half-sarcomere, the following tensions act at the left and right edges:
The longitudinal mechanical equilibrium condition at the element boundaries:
and the transversal mechanical equilibrium condition at each element:
are simultaneously solved with the boundary condition, where one end of the myofibril is fixed and the other end is connected to a fixed linear spring (Figure 4B). The parameter
In the finite element ventricle model, the half-sarcomere model is imbedded in each tetrahedral element along the fiber orientation
where
where
As a result, with the active stress represented by
the virtual work by the active stress per unit volume is given by
The equation of motion for the displacement,
Here,
where
Assuming a periodical solution over a heartbeat, the time integration on a cycle with the substitutions of
Here, the inertia and the passive energy terms disappear for the sake of the periodicity assumption. If the viscous energy loss is negligible, the following work done by the active stress is almost equal to the cardiac output.
The above relationship between the blood dynamics and muscle dynamics of the left ventricle (the left ventricular free wall and the septum) in our ventricle model is depicted in Figures 7A,B, where the two cases of the myosin rod stiffness with
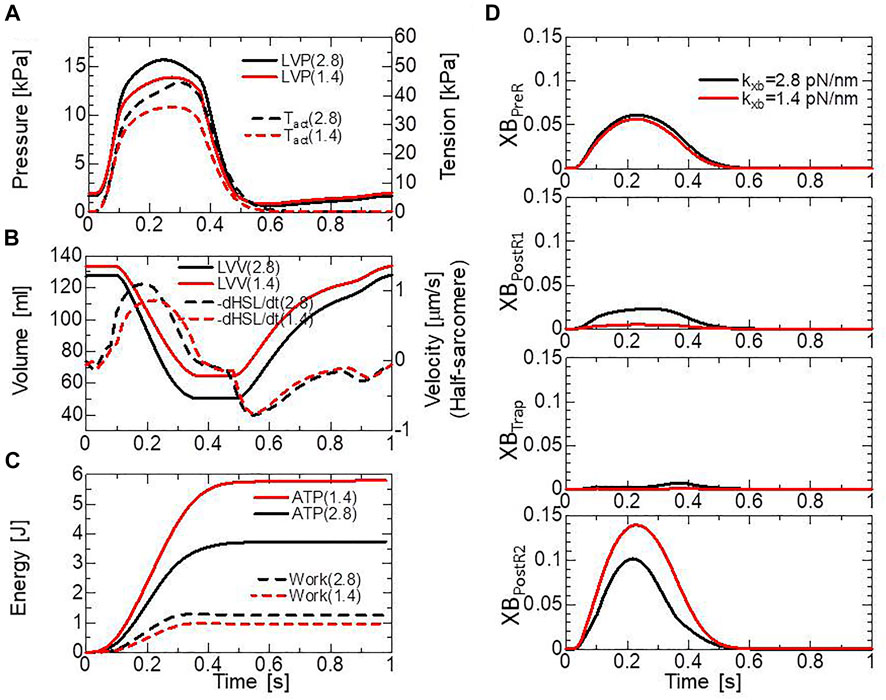
FIGURE 7. The comparison of pumping heart performance for different myosin rod distortion stiffnesses. The spring constants tested were
Results
Stretch activation in the half-sarcomere model
To assess the effectiveness of the trapping mechanism, a stretch-activation test was performed for a single half-sarcomere model consisting of 32,768 filament pairs. Here, stretch lengths of 5, 6, 7, or 8 nm were applied over a 1-ms time interval after the active tension had sufficiently matured. During the simulations, the Ca2+ concentration ([Ca2+]) was held at a constant value of
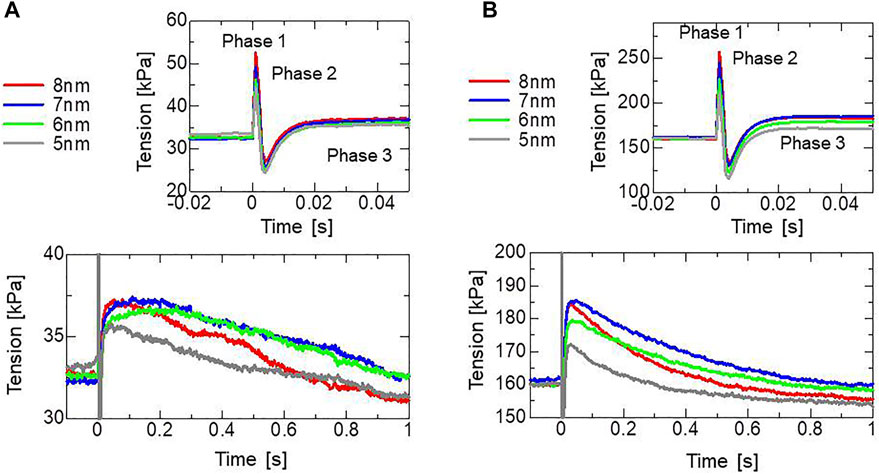
FIGURE 8. Numerical results of the stretch activation simulation. Stretches of 5, 6, 7, or 8 nm were applied over the time span of 1 ms at
Focusing on the result for a 7-nm stretch (Figures 9A–F), compared with the pre-stretch steady state, the lasting increase in tension apparently arose from a lasting increase in the population of the XBTrap state (Figures 9C,D). The effect of the XBTrap state is more emphasized when the individual contributions in the active tension of the attached states are plotted (Figures 9E,F). In the half-sarcomere model, we assumed that one thin filament is surrounded by 76 (=
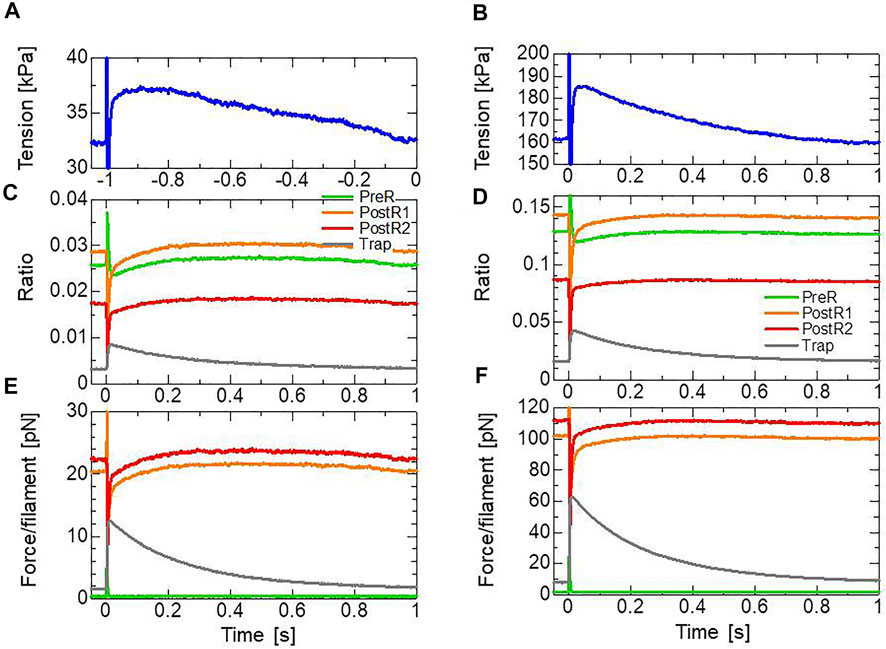
FIGURE 9. Transients of the four attached states during and after the 1-ms stretching in the stretch activation test with [Ca2+] = 0.3 μm (left) and [Ca2+] = 0.4 μm (right). (A,B) Time courses of the tension for a 7-nm stretch. (C,D) Time courses of the population ratio of the attached states: XBPreR (green), XBPostR1 (orange), XBPostR2 (red), and XBTrap (gray). (E,F) Time courses of the force per thin filament in each state.
As observed by Stelzer et al. (2006), the MC cross-bridge model also reproduced the different behaviors in Phase 3 (Figure 1A) in the different activation levels. In our model, this difference is made by the differences in the time courses of the population ratio of the attached states (Figures 9C,D) that are produced by the cooperativity effects, as shown in Figure 5A.
Effects of the trap mechanism on SPOCs in a single myofibril model
The effects of the trap mechanism on SPOCs of a single myofibril model consisting of 40 half-sarcomeres were investigated (Figures 10A,B). Here, 2048 filament pairs were imbedded in each half-sarcomere model. SPOCs were produced for all Ca2+ concentrations ([Ca2+]) in the no-trap model. In contrast, SPOCs were reproduced only for the intermediate concentration ([Ca2+] = 0.4
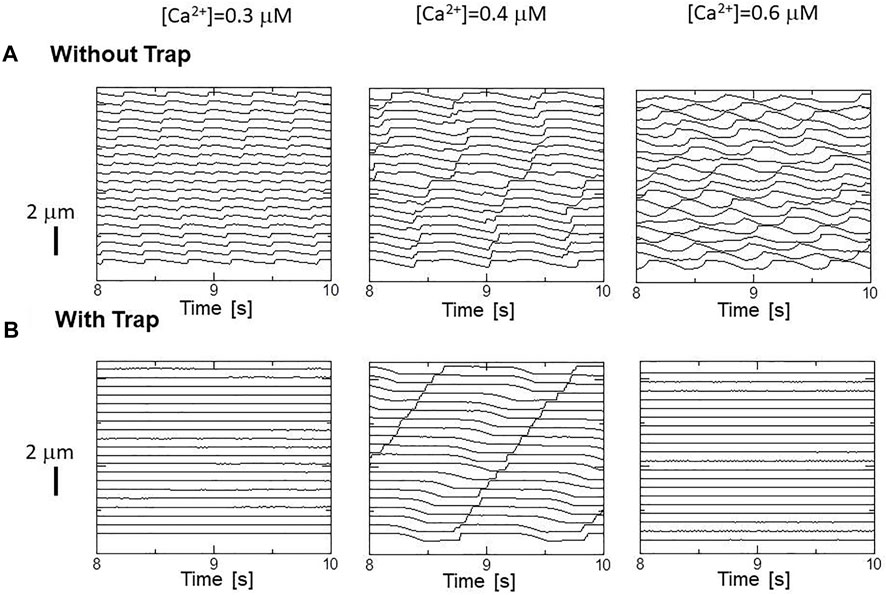
FIGURE 10. Sarcomere length changes in the myofibril model under activations with different constant calcium concentrations [Ca2+] = 0.3
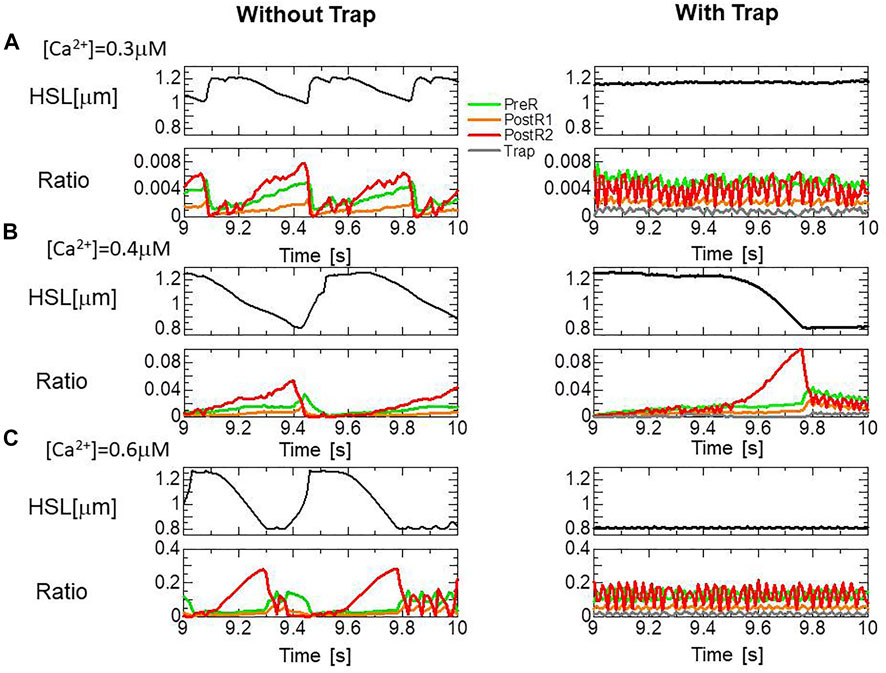
FIGURE 11. Transitions of the four attached states for the no-trap model (left) and the trap model (right) during SPOCs in a half-sarcomere model imbedded in the myofibril model. Time courses are shown for the half-sarcomere length (black) and the population ratio of binding states: XBPreR (green), XBPostR1 (orange), XBPostR2 (red), and XBTrap (gray), for the no-trap model (left) and the trap model (right). (A) [Ca2+] = 0.3
Effects in beating ventricle simulation
Beating-ventricle simulations were performed using a finite element ventricle model with the same setup as our previous work (Yoneda et al., 2021). In each element, a sarcomere model consisting of 16 filament pairs was imbedded along the appropriate fiber orientation
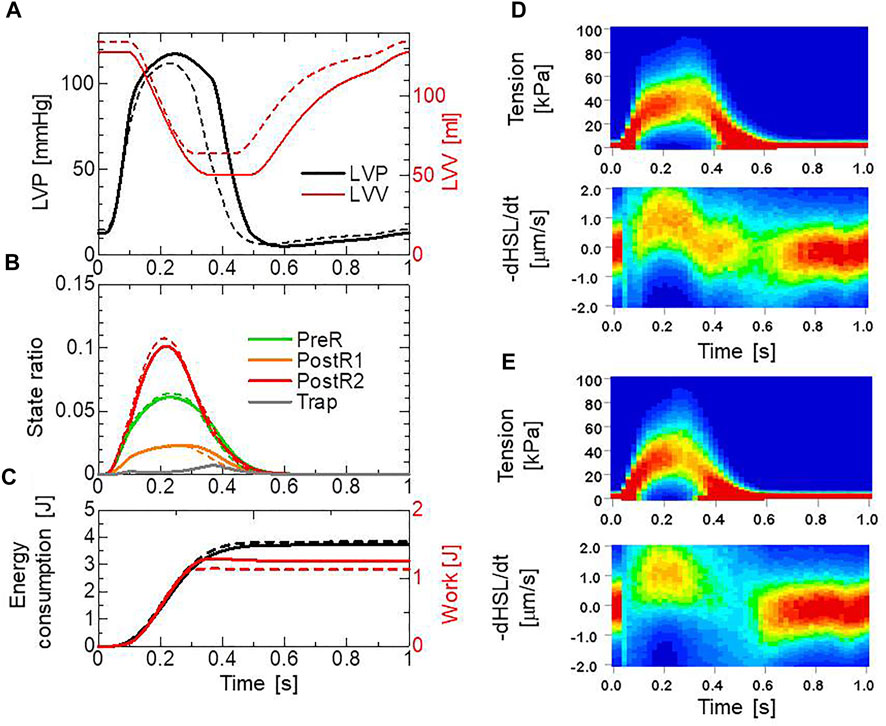
FIGURE 12. Numerical results of the beating ventricle simulation using the bi-ventricular FEM. (A) Time courses of the left ventricular pressure (black) and volume (red) for the no-trap MH model (broken lines) and the trap model (solid lines). (B) Time courses of the population ratio of attached MHs in the left ventricular wall classified according to the attached states: XBPreR (green), XBPostR1 (orange), XBPostR2 (red), and XBTrap (gray), for the no-trap model (broken lines) and the trap model (solid lines). (C) Time courses of the cumulative ATP energy consumption (black) and work (red) in the left ventricular wall for the no-trap model (broken line) and the trap model (solid line). (D) Contours of the tension distribution (upper) and the half-sarcomere shortening velocity (lower) for the trap MH model. (E) Contours of the tension distribution (upper) and the half-sarcomere shortening velocity (lower) for the no-trap MH model.
In the systolic phase, the cardiac myocytes within the shared fiber bundle support each other by pulling their neighbors via contractile forces, with the active tension in Eq. 22 playing the greatest role. Therefore, based on the mechanical equilibrium condition in the fiber direction, the active tensions must be almost equal. Consequently, if there is a loss of active tension at one point of the fiber bundle prior to the remaining parts in the early-systole or in the end-systolic phase, this portion would be lengthened quickly, and the sarcomeres in the remaining parts would be shortened until a mechanical equilibrium is reached. Because this transition accompanies decreases in the active tension owing to the loss of distortion in the myosin rods, stopping this process as early as possible is desirable to maintain blood pressure. The trapping mechanism can achieve this goal, as shown in Figures 13A–C, which depict the distributions of the active tension generated by the individual states XBPostR2 and XBTrap in the end-systolic phase. The degenerated forces of the XBPostR2 state in the no-trap model (Figure 13A) are compensated by the force generated by the XBTrap state in the trap model (Figure 13B). Furthermore, the forces of the XBPostR2 state in the trap model around the degenerated regions in the no-trap model (Figure 13C) are well maintained, owing to the contributions of the reinforced regions via the trap mechanism. As shown in the frequencies of transitions (Figure 14), the reverse power stroke contributes to diastolic relaxation to the same extent as the detachment from the XBPostR2 state (Figure 14A). Although the difference between the trapping and escaping frequencies averaged over the left ventricular wall (Figure 14B) is relatively small, the two peaks of the difference in Figure 14C agree with the differences in LVP between the trap model and the no-trap model in Figure 12A. Figure 14C also indicates that a certain extent of the trapped MHs is forced to detach because of the extreme distortion (Eq. 15).
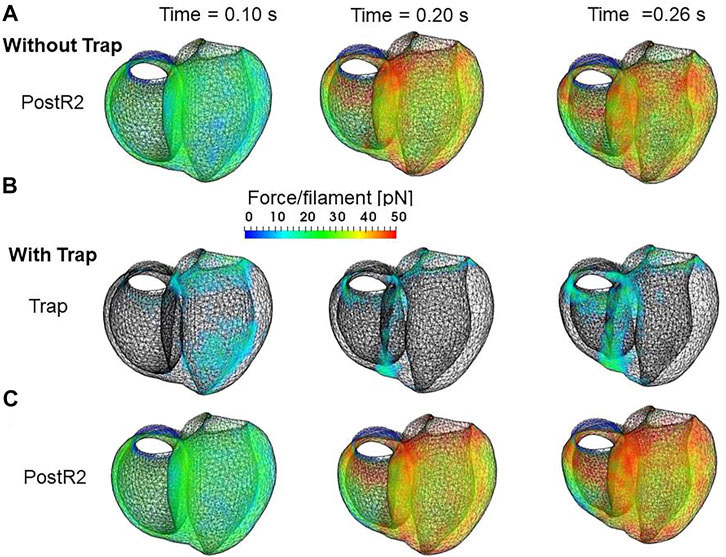
FIGURE 13. Distribution of contraction forces in the ventricles in the systolic phase at the early systole: 0.10 s (left), at the mid-systole: 0.20 s (center), and at the end-systole: 0.26 s (right) for (A) the XBPostR2 state in the no-trap model (B) XBTrap, and (C) the XBPostR2 state in the trap model. In (B), the regions in which the forces are less than 10 pN are transparent.
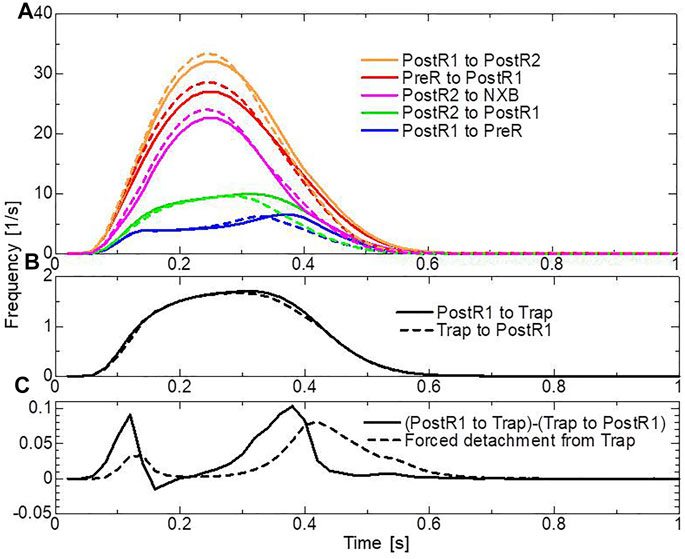
FIGURE 14. Transition frequencies of binding MHs during a heartbeat. (A) The frequencies per MH of the transitions from XBPostR1 to XBPostR2 (orange), XBPre to XBPostR1 (red), XBPostR2 to NXB (pink), XBPostR2 to XBPostR1 (green), and XBPostR1 to XBPreR (blue). The solid and broken lines represent the trap model and the no-trap model, respectively. (B) Frequencies per MH of trapping (solid line) and escaping (broken line). (C) The difference between the trapping frequency and the escaping frequency (solid line), and the frequency of the forced detachment from XBTrap.
Discussion
Effects of the trapping mechanism
In the stretch activation tests, the step length dependence was reproduced (Figure 8), similar to the experimental results of Stelzer (Stelzer et al., 2006). However, the minimum values for the rapid force decay (phase 2) in the numerical results were lower than the original isometric force before stretching and higher than the isometric force in the experimental results of Stelzer. Conversely, minimum values smaller than the original isometric force were reported for wild-type myocardium by Mamidi et al. (Mamidi et al., 2018). Thus, the level of the minimum force in phase 2 compared with the original isometric force seems to depend on the experimental conditions. In our model, the decay was determined from decreases in the XBPostR1 and XBPostR2 states owing to the reverse strokes from XBPostR2 to XBPostR1 and XBPostR1 to XBPreR. Meanwhile, the loss of force was compensated by the increase in population and the distortions of the trapped myosin molecules in the XBTrap state (Figures 9B,C). Here, the rates of reverse strokes are limited by the upper bounds
In our model, the trap mechanism was added to the XBPostR1 state, which is the state after the first power stroke. Alternatively, it might be conceivable to add a similar trap mechanism in the XBPostR2 state (the state after the second power stroke) if a force-dependent detachment rate constant (Greenberg et al., 2014) is adopted in the numerical model. Hwang et al. (2021) reported a much gentler increase in the reverse stroke rate constant of the first stroke compared with that of the second stroke, with a force increase of 8–14 pN. Their single-molecule experimental results support the adequacy of adding the trap mechanism to the XBPostR1 state.
The numerical SPOC results indicate that the trap mechanism affects the calcium activation sensitivity for the relaxation dynamics in an advantageous manner. The trap mechanism prevents sarcomere lengthening at high or low levels of calcium activation (Figure 10). The sarcomere lengthening maximizes the single overlap region between the two filaments, resulting in a facilitation of re-activation. Thus, the prevention of lengthening at low calcium levels (Figure 11A) stops weak re-activation, leading to a smooth relaxation of muscle in the diastolic phase (Figure 12A). Conversely, the prevention of lengthening at high calcium levels (Figure 11C) stops sarcomere shortening in the neighboring cardiomyocytes, causing a retention of high active tension in the fiber bundle (Figures 13B,C).
Advantages of MC simulations
The above-mentioned features for heartbeats are similar to those found in our previous work (Washio et al., 2018) with the Langevin dynamics model. However, the new MC model produced better results in the tension response for the step length changes and SPOCs owing to the simpler adjustment of related parameters. In a previous study, MC simulations were performed for a three-dimensional half-sarcomere model consisting of three myosin filaments and 13 thin filaments implemented with 360 myosin molecules and 1,170 binding sites to examine the impact of filament compliance on Ca2+ activation (Chase et al., 2004). However, these simulations were conducted only under steady-state conditions and were not coupled with a macroscopic finite element model (FEM). Moreover, in the beating ventricle simulation, the computation cost per beat was 1.5 h when 320 cores of a conventional parallel computer system were used for the MC model (Yoneda et al., 2021), while the cost was 105 h when 1920 cores of the same computer system were used (Washio et al., 2018). The former simulation was performed for a bi-ventricular FEM consisting of 45,000 tetrahedral elements with 16 filament pairs, while the latter was performed for a smaller FEM consisting of 7,900 elements with eight filament pairs. The improvements of the MC model, such as those demonstrated in the current study, will lead to better predictions in clinical applications (Kariya et al., 2020).
Limitations
Smith et al. argued that multiple working strokes are required for a cross-bridge cycle to satisfy energetic constraints and demonstrated that a cross-bridge cycling model with three strokes can reproduce various experimental findings observed for frog muscle, including absolute values of active tension, stiffness, and ATPase rate; the phase-2 tension response to a length release; and the transient tension rise during ramp stretching (Smith et al., 2008a; Smith et al., 2008b). This line of reasoning led us to adopt a model with two strokes with lengths of 6.0 and 4.0 nm to realize the 10-nm stroke suggested by the crystal structure of myosin molecules. In the three-stroke model of Smith et al., the first two strokes, which each have a length of 5.0 nm, occur around the Pi release, and a third small stroke was implemented to account for the strain-dependent ADP release rate. Although we did not explicitly define the relationship between strokes and the nucleotide released in our model, these points should be examined by comparing our results against various experimental findings in future work.
The average force of the trapped MH was larger than the maximal force ever observed experimentally. In our model, this discrepancy comes from our stiffness parameter
In our model, we didn’t account for the elasticity of the components, such as the thin and thick filaments and the Z-band in the sarcomere. Namely, we assumed that all of the sarcomere components (except for the myosin rods) are rigid. Thus, the macroscopic stretch change
By eliminating the Z-line distortion increment
Thus, the distortion increment
Razumova et al. modeled and compared three possible mechanisms of cooperativity: 1) interactions between adjacent T/T RUs, 2) interactions between adjacent cycling cross-bridges, and 3) a facilitation of the transition to the on-state of a RU by the adjacent attached cross-bridge, which all control the open and closed states of the thin filament (Razumova et al., 2000). Their results clearly demonstrated distinct roles of these interactions in the maximal force and cooperativity; however, their formulations are conceptual and thus do not represent specific molecular interactions. McKillop and Geeves proposed a three-state (blocked, closed, and open) model of thin filament activation, which is compatible with X-ray diffraction data (McKillop and Geeves, 1993). Smith et al. further attempted to establish the relation between RU–RU interactions and physical entities (Smith et al., 2003) by modeling the flexible-chain-like structure of the tropomyosin molecule with a continuous-flexible-chain model. In this regard, the RU–RU model used in this study is also empirical and lacks a relation to a physical entity. Moreover, only part of the above-mentioned mechanism of cooperativity was considered.
In the finite element ventricular model, a single half-sarcomere model was imbedded in each tetrahedral element, and the half-sarcomere length changed according to the stretch of the element in the fiber direction. This is nothing but assuming that the movements of sarcomeres contained in each element are perfectly synchronized. In reality, there may be time lags in the length changes between the neighboring sarcomeres particularly in the relaxation phase. In our future work, the issue will be studied by using the homogenization method (Washio et al., 2013) whereby the bundle of myofibril models is imbedded in each element.
Data availability statement
The raw data supporting the conclusion of this article will be made available by the authors, without undue reservation.
Author contributions
TH, SS, and MW designed the project; RK, J-IO, and KY prepared the input data for the computer simulations; TW designed and conceived the trap model and ran the simulations; TW and KY analyzed the simulation data; TW, RK, J-IO, and KY developed the simulation code with input from SS, TH, MW, TW, and KY wrote the paper with input from SS, TH, and MW.
Funding
This work was supported by the MEXT under the “Program for Promoting Research on the Supercomputer Fugaku” (hp200121) and by AMED under Grant Number JP21he2102003. The computational resources of Supercomputer Fugaku were provided by the RIKEN Center for Computational Science.
Acknowledgments
We thank Rosalie Tran, and Kristi Hatch, from Edanz (https://jp.edanz.com/ac) for editing a draft of this manuscript.
Conflict of interest
TW, JO, SS, and TH are employed by UT-Heart Inc. KY and MW were employed by Fujitsu Japan, Limited.
The authors declare that the research was conducted in the absence of any commercial or financial relationships that could be construed as a potential conflict of interest.
Publisher’s note
All claims expressed in this article are solely those of the authors and do not necessarily represent those of their affiliated organizations, or those of the publisher, the editors and the reviewers. Any product that may be evaluated in this article, or claim that may be made by its manufacturer, is not guaranteed or endorsed by the publisher.
Supplementary material
The Supplementary Material for this article can be found online at: https://www.frontiersin.org/articles/10.3389/fphys.2022.855303/full#supplementary-material
References
Campbell K. B., Chandra M. (2006). Functions of stretch activation in heart muscle. J. Gen. Physiol. 127 (2), 89–94. doi:10.1085/jgp.200509483
Chase P. B., Macpherson J. M., Daniel T. L. (2004). A spatially explicit nanomechanical model of the half-sarcomere: Myofilament compliance affects Ca2+-activation. Ann. Biomed. Eng. 32 (11), 1559–1568. doi:10.1114/b:abme.0000049039.89173.08
Fabiato A., Fabiato F. (1978). Myofilament-generated tension oscillations during partial calcium activation and activation dependence of the sarcomere length-tension relation of skinned cardiac cells. J. Gen. Physiol. 72 (5), 667–699. doi:10.1085/jgp.72.5.667
Greenberg M. J., Shuman H., Ostap E. M. (2014). Inherent force-dependent properties of β-cardiac myosin contribute to the force-velocity relationship of cardiac muscle. Biophys. J. 107 (12), L41–L44. doi:10.1016/j.bpj.2014.11.005
Hwang Y., Washio T., Hisada T., Higuchi H., Kaya M. (2021). A reverse stroke characterizes the force generation of cardiac myofilaments, leading to an understanding of heart function. Proc. Natl. Acad. Sci. U. S. A. 118 (23), e2011659118. doi:10.1073/pnas.2011659118
Kariya T., Washio T., Okada J., Nakagawa M., Watanabe M., Kadooka Y., et al. (2020). Personalized perioperative multi-scale, multi-physics heart simulation of double outlet right ventricle. Ann. Biomed. Eng. 48 (6), 1740–1750. doi:10.1007/s10439-020-02488-y
Kaya M., Higuchi H. (2010). Non-linear elasticity and an 8 nm working stroke of single myosin molecules in myofilaments. Science 329 (5992), 686–689. doi:10.1126/science.1191484
Kolb J., Li F., Methawasin M., Adler M., Escobar Y. N., Nedrud J., et al. (2016). Thin filament length in the cardiac sarcomere varies with sarcomere length but is independent of titin and nebulin. J. Mol. Cell. Cardiol. 97, 286–294. doi:10.1016/j.yjmcc.2016.04.013
Kramers H. A. (1940). Brownian motion in a field of force and the diffusion model of chemical reactions. Physica 7, 284–304. doi:10.1016/S0031-8914(40)90098-2
Lodish H., Berk A., Zipursky S. L., Matsudaira P., Baltimore D., Darnell J. (2000). Molecular cell biology. 4th edition. New York: W. H. Freeman.
Mamidi R., Li J., Doh C. Y., Verma S., Stelzer J. E. (2018). Impact of the myosin modulator Mavacamten on force generation and cross-bridge behavior in a murine model of hypercontractility. J. Am. Heart Assoc. 7 (17), e009627. doi:10.1161/JAHA.118.009627
McKillop D. F., Geeves M. A. (1993). Regulation of the interaction between actin and myosin subfragment 1: Evidence for three states of the thin filament. Biophys. J. 65 (2), 693–701. doi:10.1016/S0006-3495(93)81110-X
Pringle J. W. S. (1978). The croonian lecture 1977-stretch activation of muscle: Function and mechanism. Proc. R. Soc. Lond. B Biol. Sci. 201, 107–130. doi:10.1098/rspb.1978.0035
Razumova M. V., Bukatina A. E., Campbell K. B. (2000). Different myofilament nearest-neighbor interactions have distinctive effects on contractile behavior. Biophys. J. 78 (6), 3120–3137. doi:10.1016/S0006-3495(00)76849-4
Rice J. J., Stolovitzky G., Tu T., de Tombe P. P. (2003). Ising model of cardiac thin filament activation with nearest-neighbor cooperative interactions. Biophys. J. 84, 897–909. doi:10.1016/S0006-3495(03)74907-8
Rice J. J., Wang F., Bers D. M., de Tombe P. P. (2008). Approximate model of cooperative activation and crossbridge cycling in cardiac muscle using ordinary differential equations. Biophys. J. 95 (5), 2368–2390. doi:10.1529/biophysj.107.119487
Rodriguez E. K., Omens J. H., Waldman L. K., McCulloch A. D. (1993). Effect of residual stress on transmural sarcomere length distributions in rat left ventricle. Am. J. Physiol. 264, H1048–H1056. doi:10.1152/ajpheart.1993.264.4.H1048
Sato K., Kuramoto Y., Ohtaki M., Shimamoto Y., Ishiwata S. (2013). Locally and globally coupled oscillators in muscle. Phys. Rev. Lett. 111 (10), 108104. doi:10.1103/PhysRevLett.111.108104
Smith D. A., Geeves M. A., Sleep J., Mijailovich S. M. (2008b). Toward a unified theory of muscle contraction. II: Predictions with the mean-field approximation. Ann. Biomed. Eng. 36 (8), 1353–1371. doi:10.1007/s10439-008-9514-z
Smith D. A., Geeves M. A., Sleep J., Mijailovich S. M. (2008a). Towards a unified theory of muscle contraction. I: Foundations. Ann. Biomed. Eng. 36 (10), 1624–1640. doi:10.1007/s10439-008-9536-6
Smith D. A., Maytum R., Geeves M. A. (2003). Cooperative regulation of myosin-actin interactions by a continuous flexible chain I: Actin-tropomyosin systems. Biophys. J. 84 (5), 3155–3167. doi:10.1016/S0006-3495(03)70040-X
Stelzer J. E., Larsson L., Fitzsimons D. P., Moss R. L. (2006). Activation dependence of stretch activation in mouse skinned myocardium: Implications for ventricular function. J. Gen. Physiol. 127 (2), 95–107. doi:10.1085/jgp.200509432
Taggart P., Sutton P. M., Opthof T., Coronel R., Trimlett R., Pugsley W., et al. (2000). Inhomogeneous transmural conduction during early ischaemia in patients with coronary artery disease. J. Mol. Cell. Cardiol. 32 (4), 621–630. doi:10.1006/jmcc.2000.1105
ten Tusscher K. H., Panfilov A. V. (2006). Alternans and spiral breakup in a human ventricular tissue model. Am. J. Physiol. Heart Circ. Physiol. 291, H1088–H1100. doi:10.1152/ajpheart.00109.2006
Washio T., Kanada R., Cui X., Okada J., Sugiura S., Takada and S., et al. (2021). Semi-implicit time integration with Hessian eigenvalue corrections for a larger time step in molecular dynamics simulations. J. Chem. Theory Comput. 17 (9), 5792–5804. doi:10.1021/acs.jctc.1c00398
Washio T., Okada J., Takahashi A., Yoneda K., Kadooka Y., Sugiura S., et al. (2013). Multiscale heart simulation with cooperative stochastic cross-bridge dynamics and cellular structures. Multiscale Model. Simul. 11 (4), 965–999. doi:10.1137/120892866
Washio T., Shintani S. A., Higuchi H., Hisada T. (2019). Effect of myofibril passive elastic properties on the mechanical communication between motor proteins on adjacent sarcomeres. Sci. Rep. 9, 9355. doi:10.1038/s41598-019-45772-1
Washio T., Sugiura S., Kanada R., Okada J., Hisada T. (2018). Coupling Langevin dynamics with continuum mechanics: Exposing the role of sarcomere stretch activation mechanisms to cardiac function. Front. Physiol. 9, 333. doi:10.3389/fphys.2018.00333
Washio T., Sugiura S., Okada J., Hisada T. (2020). Using systolic local mechanical load to predict fiber orientation in ventricles. Front. Physiol. 11, 467. doi:10.3389/fphys.2020.00467
Washio T., Yoneda K., Okada J., Kariya T., Sugiura S., Hisada T. (2016). Ventricular fiber optimization utilizing the branching structure. Int. J. Numer. Method. Biomed. Eng. 32 (7), e02753. doi:10.1002/cnm.2753
Yoneda K., Okada J., Watanabe M., Sugiura S., Hisada T., Washio T. (2021). A multiple step active stiffness integration scheme to couple a stochastic cross-bridge model and continuum mechanics for uses in both basic research and clinical applications of heart simulation. Front. Physiol. 12, 712816. doi:10.3389/fphys.2021.712816
Keywords: stretch activation, Monte Carlo method, finite element method, heartbeat, excitation contraction coupling, spontaneous oscillation, cross-bridge cycle
Citation: Yoneda K, Kanada R, Okada J-i, Watanabe M, Sugiura S, Hisada T and Washio T (2022) A thermodynamically consistent monte carlo cross-bridge model with a trapping mechanism reveals the role of stretch activation in heart pumping. Front. Physiol. 13:855303. doi: 10.3389/fphys.2022.855303
Received: 15 January 2022; Accepted: 18 July 2022;
Published: 08 September 2022.
Edited by:
Guido Caluori, INSERM Institut de Rythmologie et Modélisation Cardiaque (IHU-Liryc), FranceReviewed by:
Kenneth Scott Campbell, University of Kentucky, United StatesWenjun Kou, Northwestern University, United States
Copyright © 2022 Yoneda, Kanada, Okada, Watanabe, Sugiura, Hisada and Washio. This is an open-access article distributed under the terms of the Creative Commons Attribution License (CC BY). The use, distribution or reproduction in other forums is permitted, provided the original author(s) and the copyright owner(s) are credited and that the original publication in this journal is cited, in accordance with accepted academic practice. No use, distribution or reproduction is permitted which does not comply with these terms.
*Correspondence: Takumi Washio, d2FzaGlvQHV0LWhlYXJ0LmNvbQ==
 Kazunori Yoneda
 Ryo Kanada
 Jun-ichi Okada
 Masahiro Watanabe
 Seiryo Sugiura
 Toshiaki Hisada
 Takumi Washio