 Yajuan Lin
 Rui Fan
 Zhujing Hao
 Jiatian Li
 Xiaolei Yang
 Ying Zhang
 Yunlong Xia
94% of researchers rate our articles as excellent or good
Learn more about the work of our research integrity team to safeguard the quality of each article we publish.
Find out more
ORIGINAL RESEARCH article
Front. Physiol. , 02 February 2022
Sec. Exercise Physiology
Volume 13 - 2022 | https://doi.org/10.3389/fphys.2022.809669
Objectives: Insulin resistance (IR) has been shown to play important role in the pathogenesis of type 2 diabetes mellitus (T2DM). There is an intricate interplay between IR, dyslipidemia, and serum uric acid (SUA) in people with and without diabetes. Physical activity has a positive impact on insulin sensitivity in insulin-resistant populations. However, the effect of different intensities of physical activity on insulin levels under different lipid indices and SUA levels is unclear.
Methods: To explore the association between physical activity and insulin, we enrolled 12,982 participants aged above 18 years from the National Health and Nutrition Examination Survey (NHANES) conducted between 2009 and 2018. Next, we conducted multivariate logistic regression analyses, generated fitted smoothing curves, and visualized the data using generalized additive models.
Results: Increased intensities of physical activity can significantly reduce insulin levels. The association between physical activity and insulin persisted even after adjusting for confounding factors, with β value (95% CI) = −17.10 (−21.64, −12.56) in moderate group, β value (95% CI) = −28.60 (−33.08, −24.11) in high group, respectively. High-intensity physical activity significantly lowered insulin levels in the lower and higher SUA tertiles, and three tertiles of LDL-c, HDL-c, and TG. Moreover, the link between physical activity and insulin was stronger in male individuals.
Conclusion: This study shows that physical activity can significantly lower insulin levels, and high-intensity physical activity still has additional potential benefits for insulin levels, even in the condition of dyslipidemia and hyperuricemia.
Insulin resistance (IR) is defined as an impaired biologic response to glucose disposal and insulin stimulation of target tissues (mainly the liver, muscle, and adipose tissue), leading to a compensatory increase in beta-cell insulin production and hyperinsulinemia. IR can result in a series of metabolic consequences, such as dyslipidemia, hyperglycemia, visceral adiposity, hyperuricemia, hypertension, endothelial dysfunction, a prothrombotic state, and elevated inflammatory response (Freeman and Pennings, 2021). Fasting hyperinsulinemia was observed to precede the development of other characteristics of the syndrome, such as hypertension, hypertriglyceridemia, and low high-density lipoprotein cholesterol (HDL-c) by Haffner et al. (1992). Barnard et al. (1988) fed mice a high-fat sucrose diet for a few weeks and found that they developed skeletal muscle insulin resistance and hyperinsulinemia before mice developed hypertriglyceridemia, and hypertension, which resulted in MS. It is worth noting that IR is a key metabolic feature of obesity, type 2 diabetes mellitus (T2DM), and even type 1 diabetes mellitus (T1DM), and is associated with an increased risk of micro- and macro-vascular problems. It is increasingly becoming apparent that, even in the absence of diabetes, there is a link between IR and cardiovascular disease (CVD; Howard et al., 2000). Therefore, improving insulin sensitivity is an important part of preventing insulin resistance, diabetes, and CVD.
Physical activity (PA) improves insulin sensitivity in both normal and insulin-resistant people. Evidence suggests that insulin resistance (i.e., low insulin sensitivity) is the major underpinning link between physical inactivity and MS (Roberts et al., 2013). Thus, PA has been proposed for treating diabetes mellitus (Aune et al., 2015). Several recent epidemiological studies have found a link between PA and the occurrence of T2DM (Eriksson and Lindgarde, 1991; Manson et al., 1991). Through numerous changes in glucose transport and metabolism, PA enhances the effect of exercise on insulin sensitivity (Borghouts and Keizer, 2000). Therefore, aerobic exercise is generally considered the most adequate mode of exercise for improving insulin sensitivity.
It is well known that, in addition to controlling blood glucose levels, insulin regulates lipid metabolism by promoting lipid synthesis in the liver and fat cells while inhibiting lipolysis. Notably, PA may cause beneficial changes in lipid metabolism as well as improvements in hepatic glucose output regulation. In addition, the relationship between serum uric acid (SUA) and glucose/insulin balance is complicated. Based on pathophysiological and metabolic studies, hyperuricemia and IR are likely to interact. Hyperuricemia plays a role in the pathogenesis of T2DM, and insulin resistance by increasing inflammation recreation and oxidative stress (Lanaspa et al., 2012; Wan et al., 2016). IR, on the other hand, decreases uric acid excretion by increasing renal tubular sodium reabsorption and so producing hyperuricemia (Ter Maaten et al., 1997). Longitudinal studies on this issue have yielded inconsistent results. Increased uric acid levels have been linked to an increased risk of IR in several studies (Krishnan et al., 2012). Alternatively, IR might be a risk factor for later hyperuricemia on its own (Nakamura et al., 2014). According to the findings of these studies, the dynamic of the temporal relationship between hyperuricemia and IR is likely complex, as changes in one may precede those in the other.
Indeed, multiple studies in recent decades have demonstrated that increasing PA and cardiorespiratory fitness has a positive impact on each of the metabolic syndrome components (high waist circumference, dyslipidemia, hypertension, and insulin resistance; Duncan, 2006; Church, 2011; Zhang et al., 2017). However, there are currently no relevant studies evaluating the effect of PA on insulin levels under different levels of lipid indices (TG, LDL-c, and HDL-c) and SUA. This study explored the association between PA and insulin under different levels of lipid indices and SUA using a representative sample from the National Health and Nutrition Examination Survey (NHANES).
The National Health and Nutrition Examination Study (NHANES), which is a representative survey of the national population in the United States, was conducted by the Centers for Disease Control and Prevention (CDC). Using a complicated, multistage, and probabilistic sampling approach, this study provides a wealth of information about the nutrition and health of the overall US population (Curtin et al., 2013; Patel et al., 2016). This cross-sectional study analyzed the data collected from 2009 to 2018, representing five cycles of the NHANES.1 The research ethical review board of the National Center for Health Statistics authorized the study procedures. A total of 12,982 participants over the age of 18 were included in the analysis after excluding participants under the age of 18 (n = 19,341), those with missing PA data (n = 69), and those with missing insulin (n = 14,183) and other key data (n = 3,119). Notably, signed informed consent had been obtained from each participant during data collection.
The physical activity (the exposure variable) of participants between 2009 and 2018 was based on the Global Physical Activity Questionnaire (GPAQ; Hallal et al., 2012), which includes questions related to daily activities, leisure time activities, and sedentary activities. PA was then categorized into three levels (low, moderate, and high) according to the suggested MET score (Ainsworth et al., 2011).1
Insulin, the outcome variable, was measured by human insulin immunoassay using ROCHE ELECSYS 2010 at the Fairview-University Medical Center University Campus Collaborative Studies Clinical Laboratory Minneapolis, Minnesota between 2009 and 2012. The immunoenzymometric assay TOSOH AIA-900 Chemistry Analyzer was then used to measure insulin between 2013 and 2018 at the University of Missouri Columbia. Extensive quality control processes were performed by the analytical laboratory. External calibration was performed using whole-blood resources from the National Institute of Standards and Technology. The detailed information on PA and insulin is publicly available at http://www.cdc.gov/nchs/nhanes/.
Sex, smoking, PA, race/ethnicity, alcohol consumption, history of hypertension, and diabetes mellitus were collected as categorical variables, whereas age, body mass index (BMI), systolic blood pressure (SBP), waist circumference (WC), diastolic blood pressure (DBP), total cholesterol (TC), creatinine, aspartate aminotransferase (AST), and alanine aminotransferase (ALT) were collected as continuous variables. Detailed insulin and covariate information can be found at http://www.cdc.gov/nchs/nhanes/. The primary outcome was to determine the association between PA and insulin levels. Therefore, the results of the adjusted potential confounders model analyses were presented based on the recommendations of the STROBE statement (von Elm et al., 2007), when the covariates were added to the model, the odds ratio of the match was changed by at least 10%, and this covariate needed to be adjusted (Vandenbroucke et al., 2007). Consequently, the fully adjusted model was built using the following variables: age, sex, race/ethnicity, BMI, SBP, HDL, LDL-C, TG, ALT, AST, creatinine, glucose, SUA, smoking, and alcohol consumption.
All statistical analyses were performed using Empower Stats 2.22 and package R.3 According to the NHANES protocol, all of the data were integrated into a single dataset, and data analysis took into account the masked variance and applied the suggested weighting methodology. Participants were divided into three groups based on the intensity of PA. To explore the differences among groups, the weighted χ2 test was utilized for categorical variables expressed as percentages, whereas the weighted linear regression model was applied for continuous variables expressed as the means ± SD. In the association analyses, a weighted multivariate logistic regression model was used to explore the relationship between PA and insulin. Insulin levels regression coefficients (β value) and 95% confidence intervals (CIs) were evaluated by constructing a series of hierarchical models that adjusted for potential confounders: Model I, adjusted for age, sex, and race; Model II, additionally adjusted for BMI, SBP, HDL-c, LDL-c, TG, ALT, AST, creatinine, glucose, SUA, smoking, and alcohol consumption. The weighted multivariate regression model also analyzed the association between the SUA, lipid indices (LDL-c, HDL-c, and TG), and PA (predictor), and insulin levels (outcome), and SUA, LDL-c, HDL-c, and TG were all analyzed as categorical variables and classified into three groups (tertiles). SUA (T1, T2, and T3), LDL-c (T1, T2, and T3), TG (T1, T2, and T3), and HDL-c (T1, T2, and T3) have different cut-off values indicated at the footnote of each table. Subgroup analyses were also performed based on sex. To further explain the association between PA (predictor) and insulin levels (outcome). The participants were classified into diabetes and non-diabetes subgroups according to clinical diagnoses. Sensitivity analysis was performed based on participants without diabetes status. Stratified analyses were conducted according to age (≤44, 45–59, ≥60), gender, race, LDL-c tertiles (T1, T2, and T3), HDL-c tertiles (T1, T2, and T3), TG tertiles (T1, T2, and T3), glucose tertiles (T1, T2, and T3), SUA tertiles (T1, T2, and T3), and BMI (<25, ≥25), and the obtained results were presented using a forest plot. The nonlinear link between SUA, LDL-c, HDL-c, TG, and insulin was further evaluated using smooth curve fits and generalized additive models. A value of p < 0.05 was considered statistically significant.
This study included 12,982 participants aged >18 years. The baseline demographic and clinical characteristics are shown in Table 1, with the weighted characteristics of the participant’s sub-classified based on PA (low, moderate, and high). Results showed that the mean values of HbA1c, glucose, BMI, WC, TG, creatinine, insulin, BUN, and SBP were significantly lower in the high-intensity PA group than in the other two groups. However, the mean values of HDL-c, AST, ALT, and DBP levels were significantly higher in the high-intensity PA group than in the other two groups. Participants in the high-intensity PA group were younger (p < 0.001) and had a higher proportion of males and alcohol consumption (p < 0.001) compared to the other two groups, but with a lower proportion of hypertension, diabetes, Non-Hispanic black, and smokers (p < 0.001).
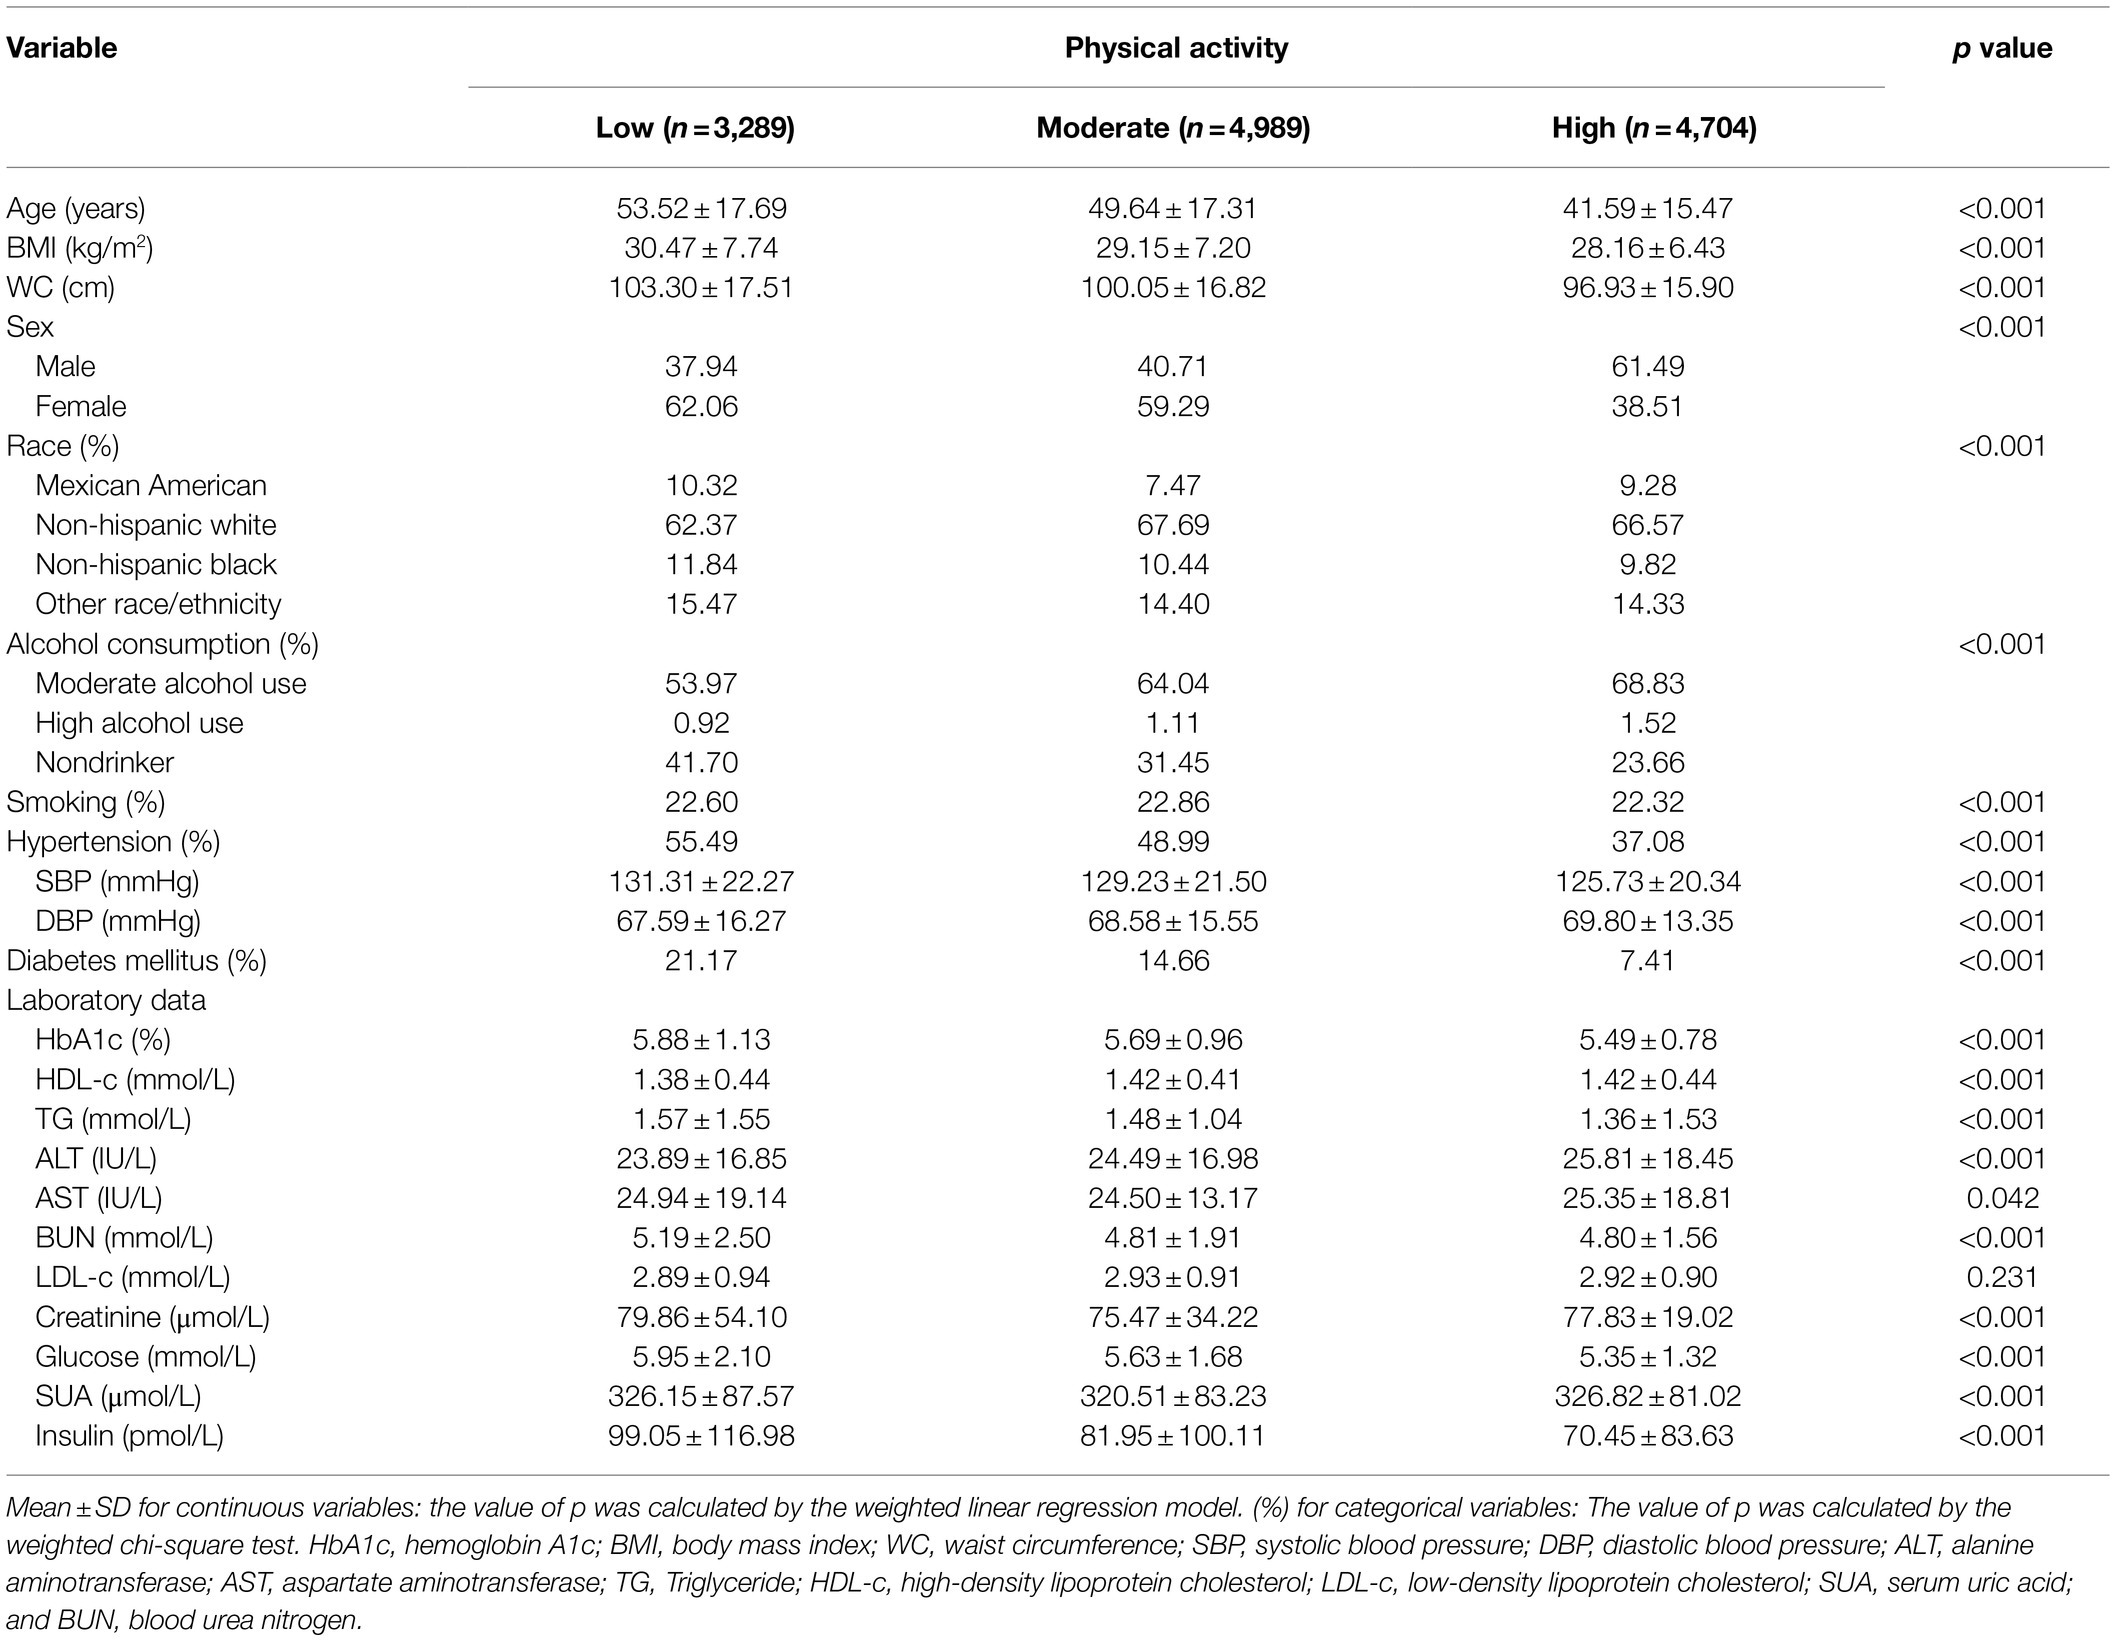
Table 1. Basic characters.
Table 2 shows the results of the multivariate regression analyses. In the unadjusted model, the high- and moderate-intensity PA groups were negatively correlated with insulin [β value (95% CI) = −17.10 (−21.64, −12.56), β value (95% CI) = −28.60 (−33.08, −24.11), respectively] compared to the low-intensity PA group. After adjusting for confounders, this association persisted in model II [β value (95% CI) = −8.74 (−12.90, −4.57), β value (95% CI) = −12.46 (−16.80, −8.11), respectively]. When grouped by sex, this association persisted in males, with β value (95% CI) = −15.15 (−22.72, −7.59), β value (95% CI) = −19.43 (−26.74, −12.13), respectively. However, in females, the significant negative association only persisted in the high-intensity PA group after adjusting for confounders (Model II), with β value of (95% CI) = −6.61 (−11.66, −1.56). Forest plot showed the crude subgroup analyses on the effect of PA on insulin (Figure 1). In the unadjusted analyses, negative associations were observed between PA and insulin in all stratified analyses.
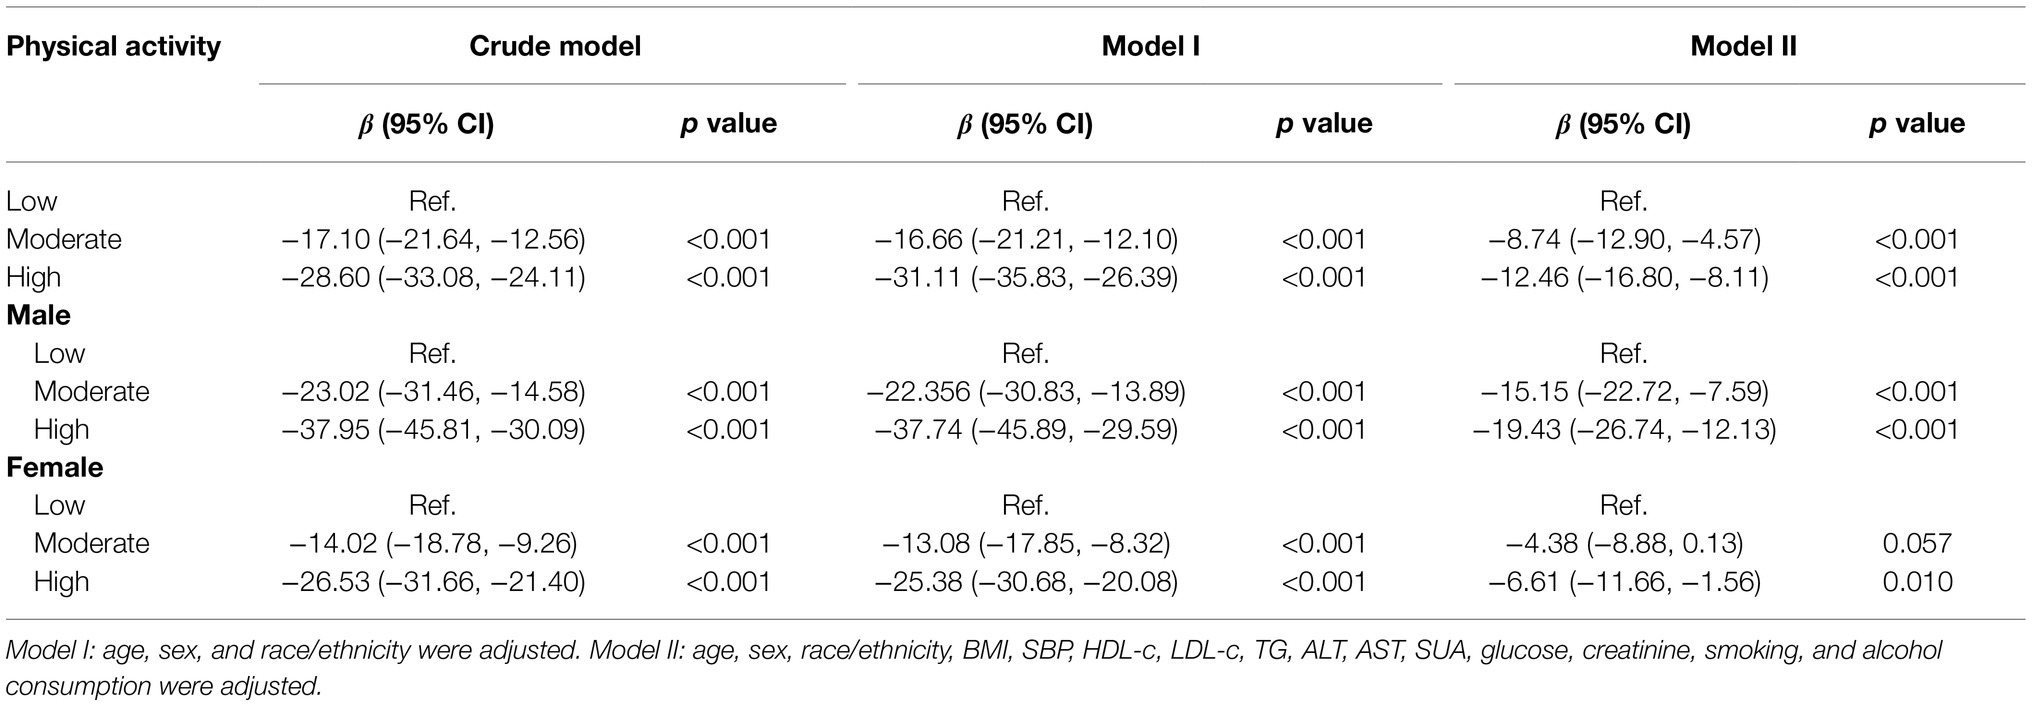
Table 2. The association between physical activity and insulin.
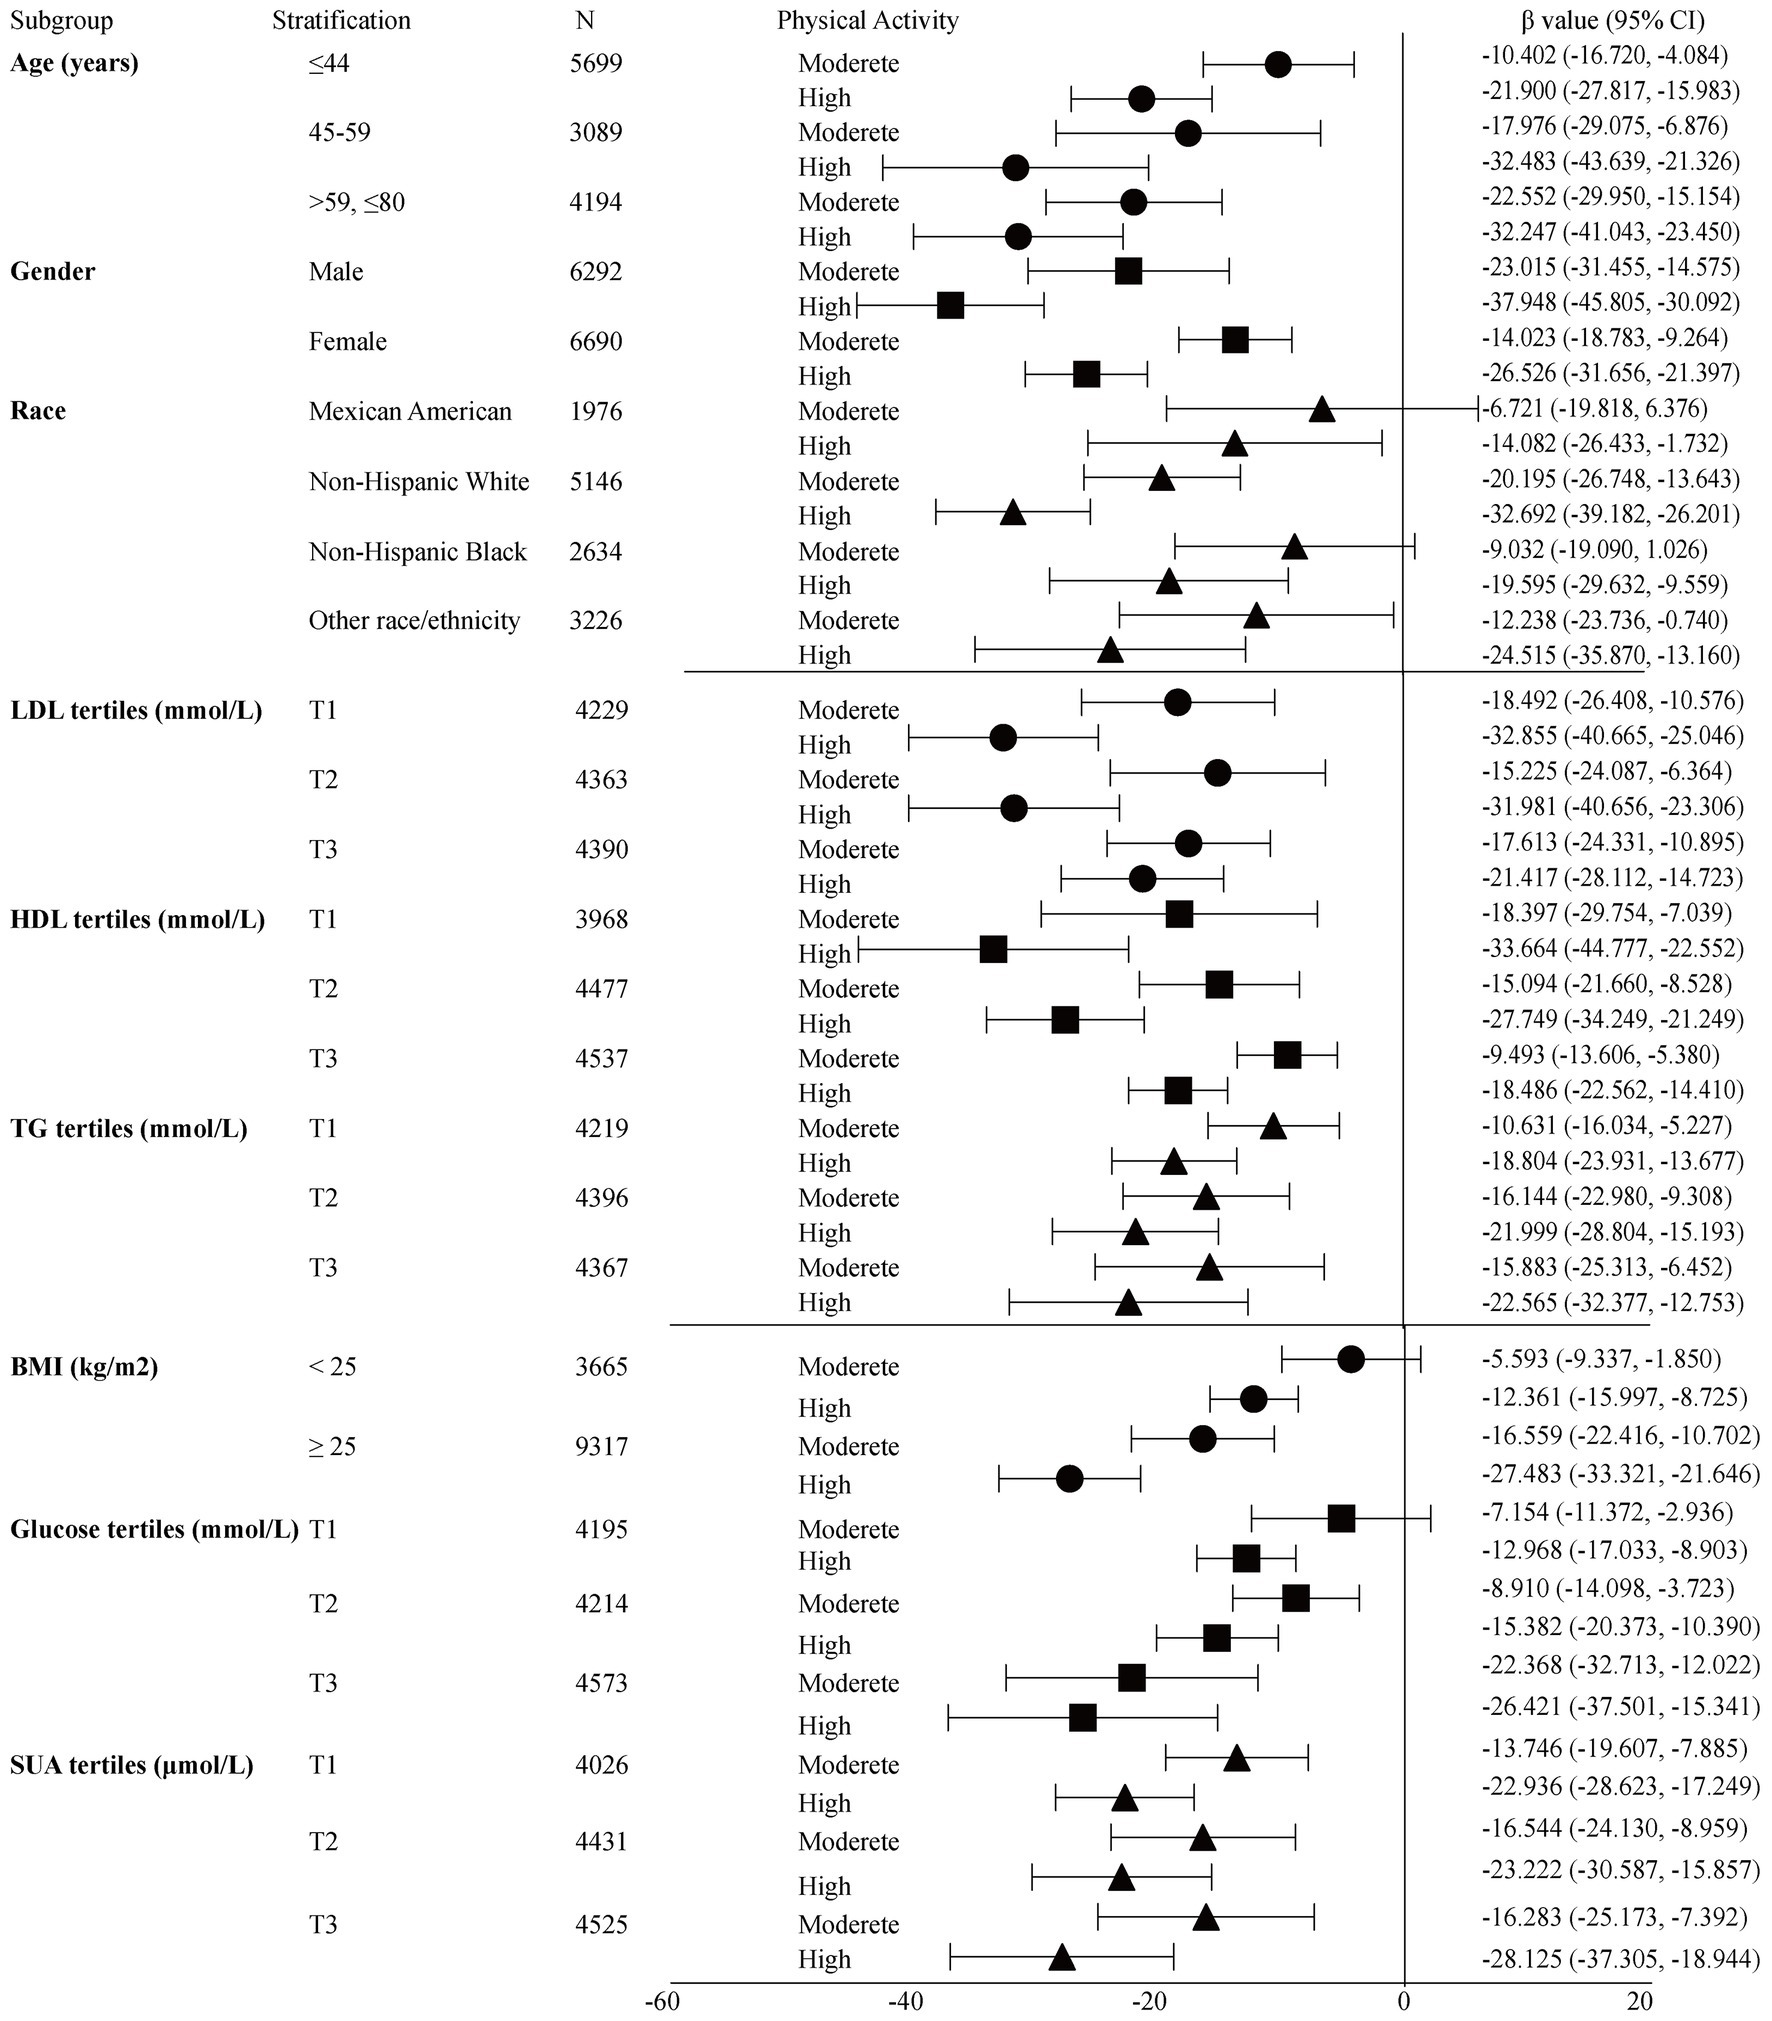
Figure 1. Crude subgroup analyses on effect of physical activity on insulin. Glucose tertiles = T1 1.05–4.94 mmol/L; T2 5.00–5.50 mmol/L; T3 5.55–24.81 mmol/L; HDL-c tertiles = T1 0.16–1.14 mmol/L; T2 1.16–1.47 mmol/L; T3 1.5–5.84 mmol/L; LDL-c tertiles = T1 0.23–2.43 mmol/L; T2 2.46–3.15 mmol/L; T3 3.18–9.69 mmol/L; TG tertiles = T1 0.10–0.89 mmol/L; T2 0.90–1.47 mmol/L; T3 1.48–68.38 mmol/L; SUA tertiles = male T1 23.80–321.20 μmol/L; T2 327.10–386.60 μmol/L; T3 392.60–773.20 μmol/L; Female T1 23.80–243.90 μmol/L; T2 249.80–303.30 μmol/L; and T3 309.30–1,070.60 μmol/L.
Supplementary Figure S1A shows that there was a positive correlation between SUA level and insulin, and the level of insulin decreased as the intensity of PA improved under the same SUA level (Supplementary Figure S1B). Table 3 shows the interactive analyses between SUA and PA on the level of insulin. In the lower SUA tertile, significant differences were only observed in the high-intensity PA group, with β values (95% CI) = −9.75 (−15.33, −4.16) adjusted β values. However, in the upper SUA tertile, the adjusted β values (95% CI) were −13.99 (−21.67, −6.31) and −18.883 (−27.42, −10.34), respectively. The negative association persisted in males, with an adjusted β value (95% CI) = −15.10 (−25.19, −5.01) in the lower SUA tertile, and β values (95% CI) = −29.14 (−43.68, −14.59), −29.48 (−43.83, −15.12) in the upper SUA tertile. However, in females, considerable differences were only observed in the high-intensity PA group in the lower SUA tertile [β values (95% CI) = −6.18 (−11.88, −0.47), p = 0.034; Supplementary Table S1].
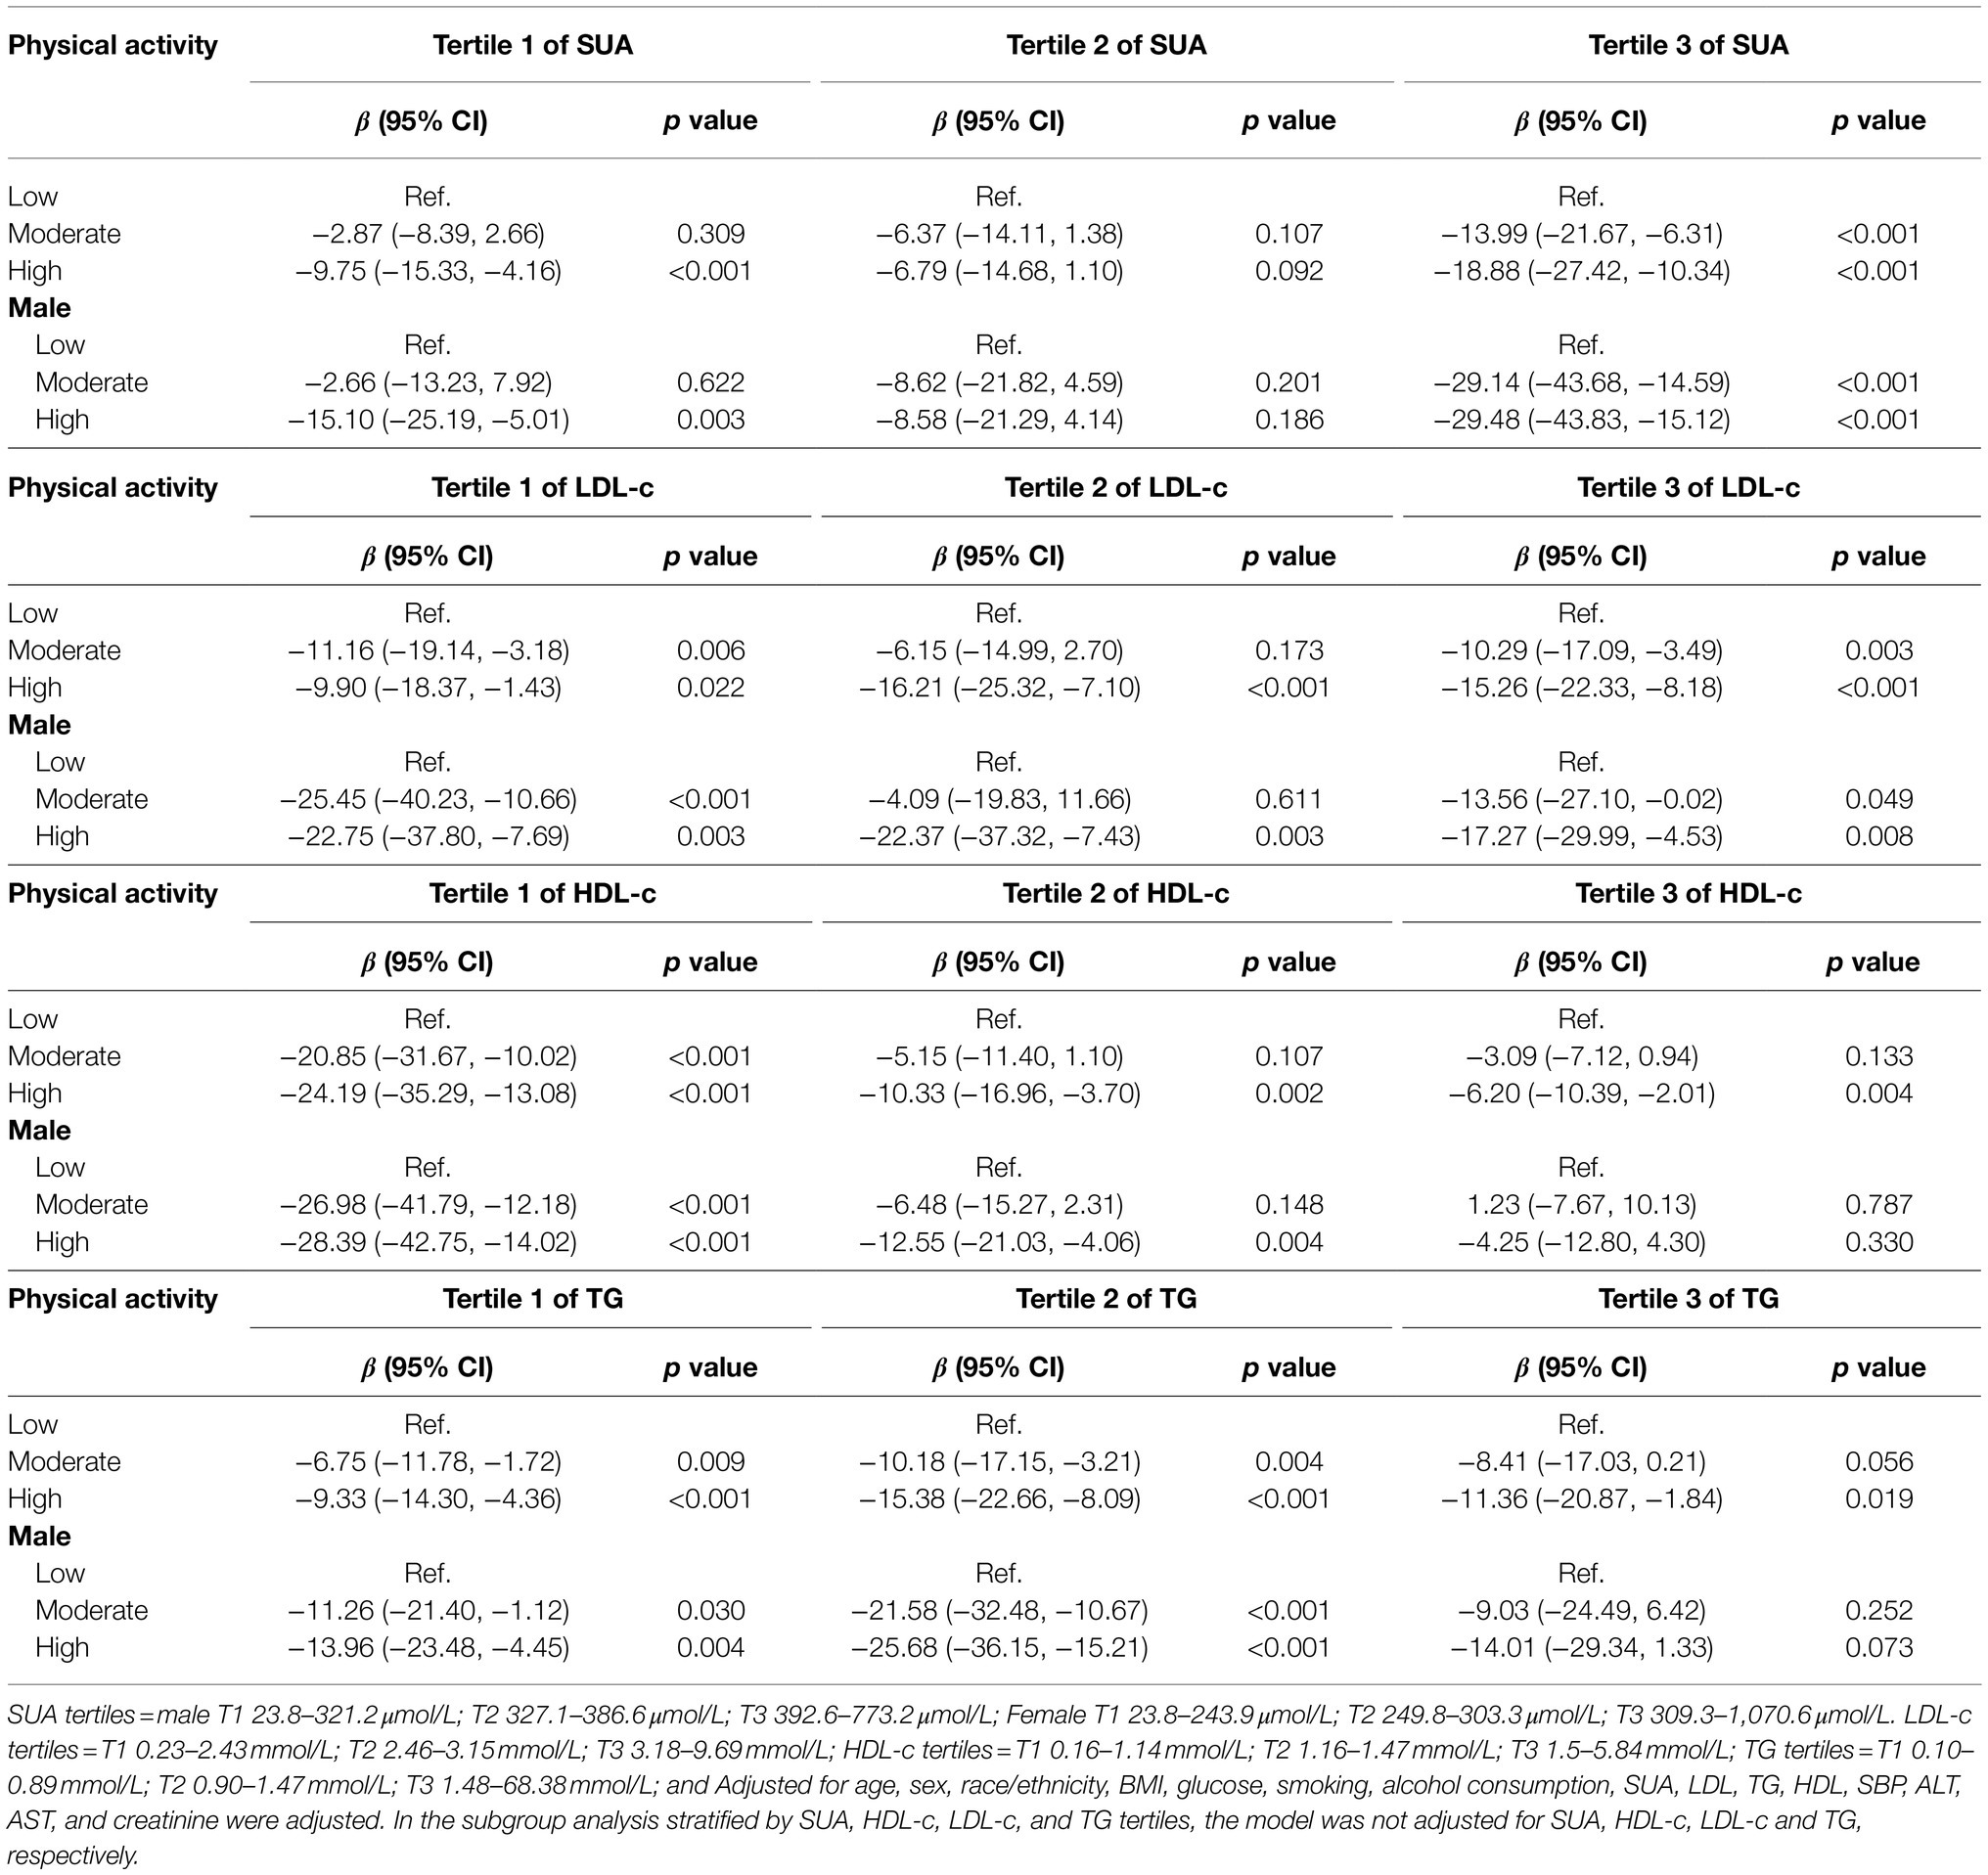
Table 3. The association between physical activity and insulin grouped by SUA, LDL-c, HDL-c, and TG tertiles.
There was a negative correlation between LDL-c and insulin, and the level of insulin decreased as the intensity of PA improved under the same LDL-c level (Supplementary Figure S2). Table 3 shows the β values of insulin associated with diverse levels of PA among participants grouped based on LDL-c tertiles. Participants in the lower and upper LDL-c tertiles had a significant decrease in the level of insulin [β value (95% CI) = −11.16 (−19.14, −3.18), −9.90 (−18.37, −1.43) in the lower tertile, and −10.29 (−17.09, −3.49), −15.26 (−22.33, −8.18) in the upper tertile, respectively] in the general population compared to participants in the low-intensity PA group. In the middle LDL-c tertile, only the high-intensity PA group had a significant decrease in insulin, with a β value (95% CI) = −16.21 (−25.32, −7.10). After adjusting for potential confounders, a similar significant decrease in the level of insulin was observed among male participants in the lower and the upper tertiles. However, in females (Supplementary Table S1), the multivariate logistic regression confirmed that only participants in the upper LDL-c tertile had a significant decrease in the level of insulin, with a gradual decrease as the intensity of physical exercise increased.
There was also a negative correlation between HDL-c and insulin, and the level of insulin decreased as the intensity of PA improved under the same HDL-c level (Supplementary Figure S3). Table 3 shows the β value of insulin associated with an increase in PA among participants grouped by HDL-c tertiles. In the general population, a gradual decrease of β value in insulin was confirmed for the first HDL-c tertile [β value (95% CI) = −20.85 (−31.67, −10.02), and −24.19 (−35.29, −13.08)] compared to participants in the low-intensity PA group. However, in the second and third HDL-c tertiles, only participants in the high-intensity PA group had a significant decrease in the level of insulin, with β values (95% CI) = −10.33 (−16.96, −3.70) and −6.20 (−10.39, −2.01), respectively. Similarly, the β value of insulin gradually decreased across male participants in the first HDL-c tertile. Meanwhile, in second HDL-c tertile, only participants in the high-intensity PA group had a significant decrease in the level of insulin. Notably, there was no significant statistical difference in the third HDL-c tertile. In females (Supplementary Table S1), the β value of insulin only reduced for participants in the high-intensity PA group under the third HDL-c tertile.
Furthermore, there was a positive correlation between TG and insulin, and the level of insulin decreased as the intensity of PA improved under the same TG level (Supplementary Figure S4). Table 3 shows the β value of insulin associated with an increase in PA among participants grouped based on TG tertiles. A gradual decrease in the β value in insulin was observed for the first and second TG tertiles [β value (95% CI) = −6.75 (−11.78, −1.72), −9.33 (−14.30, −4.36) and −10.18 (−17.15, −3.21), −15.38 (−22.66, −8.09), respectively] among the general population compared to the low-intensity physical group. However, in the third TG tertile, only participants in the high-intensity PA group had a significant decrease in the level of insulin, with a β value (95% CI) = −11.36 (−20.87, −1.84). Similarly, the β value of insulin gradually decreased across male participants in the first and second TG tertiles. However, there was no significant difference in the third TG tertile. In females (Supplementary Table S1), the β value of insulin only decreased in the high-intensity PA group under the first TG tertile.
It is necessary to consider DM as an important confounding factor. A sensitivity analysis was performed based on whether the participant was diagnosed with diabetes, and the relationship between PA and insulin was observed in participants without diabetes. Multivariate logistic regression showed that PA was also negatively correlated with insulin levels in participants without diabetes. The insulin levels decreased gradually with increasing intensity of PA [β value (95% CI) = −4.24 (−7.23, −1.25), p = 0.005, β value (95% CI) = −9.64 (−12.7, −6.58), p < 0.001 respectively, Table 4] after adjusting for confounders (Model II). When grouped by sex, this association persisted in males, with β value (95% CI) = −7.16 (−12.47, −1.84), β value (95% CI) = −14.63 (−19.68, −9.58), respectively. However, in females, the significant negative association only persisted in the high-intensity PA group after adjusting for confounders (Model II), with β value (95% CI) = −6.22 (−9.95, −2.50). When grouped by SUA tertiles, LDL-c tertiles, HDL-c tertiles, and TG tertiles, respectively, high-intensity PA significantly decreased insulin levels in three tertiles of SUA, HDL-c, TG, and in T2 and T3 of LDL-c (Figure 2 and Supplementary Table S2). Moreover, the link between PA and insulin was also stronger in males (Table 4 and Supplementary Table S2).
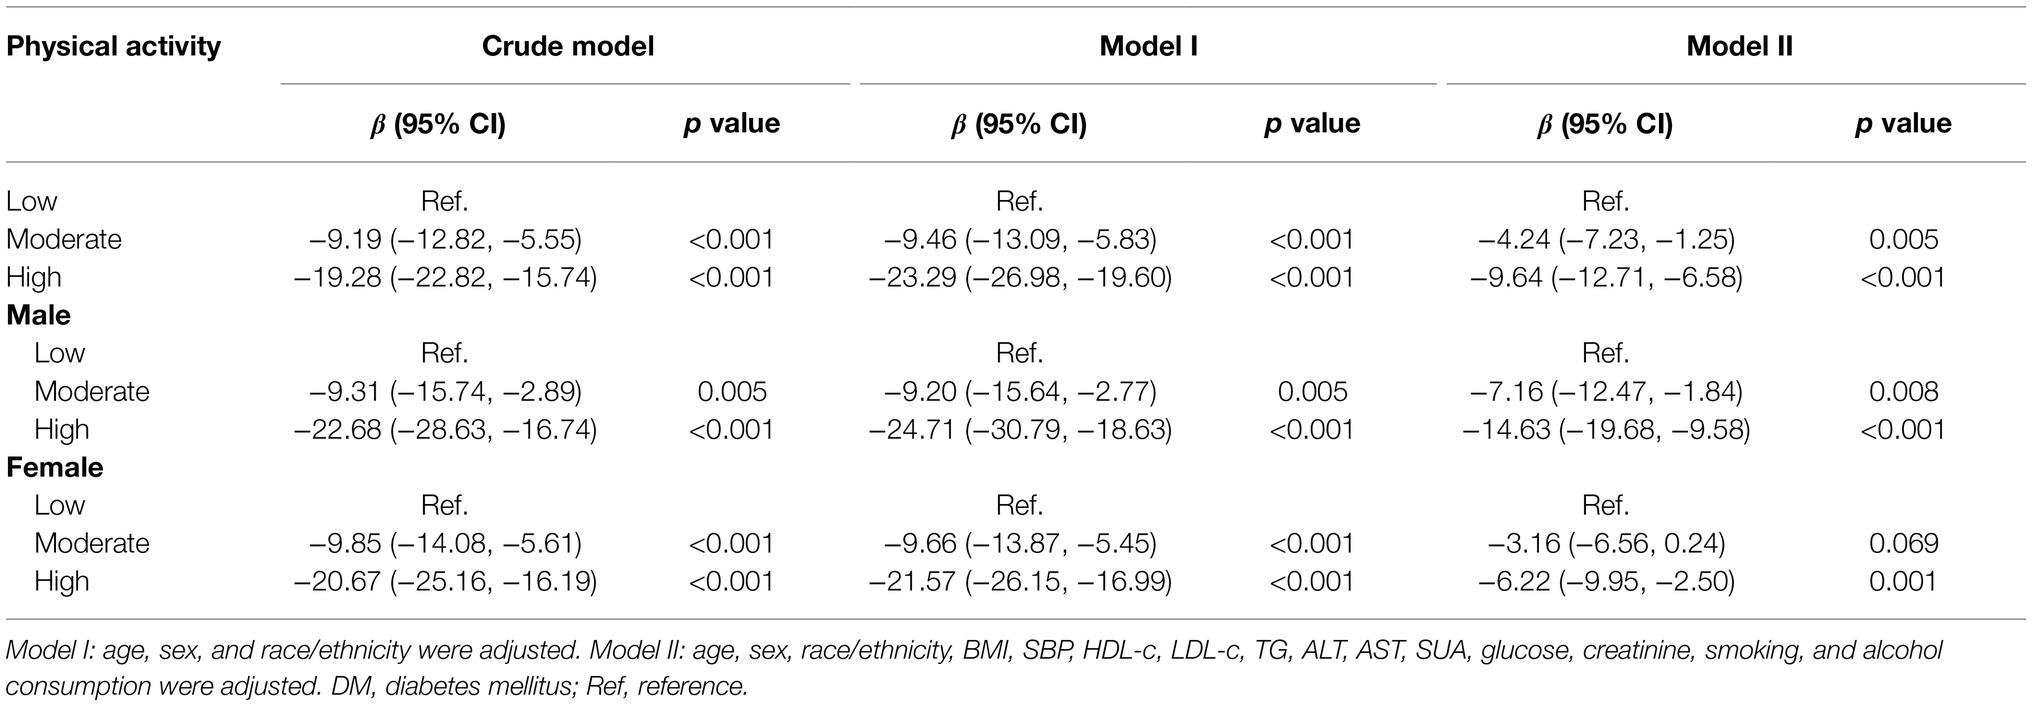
Table 4. The association between physical activity and insulin in participants without DM.
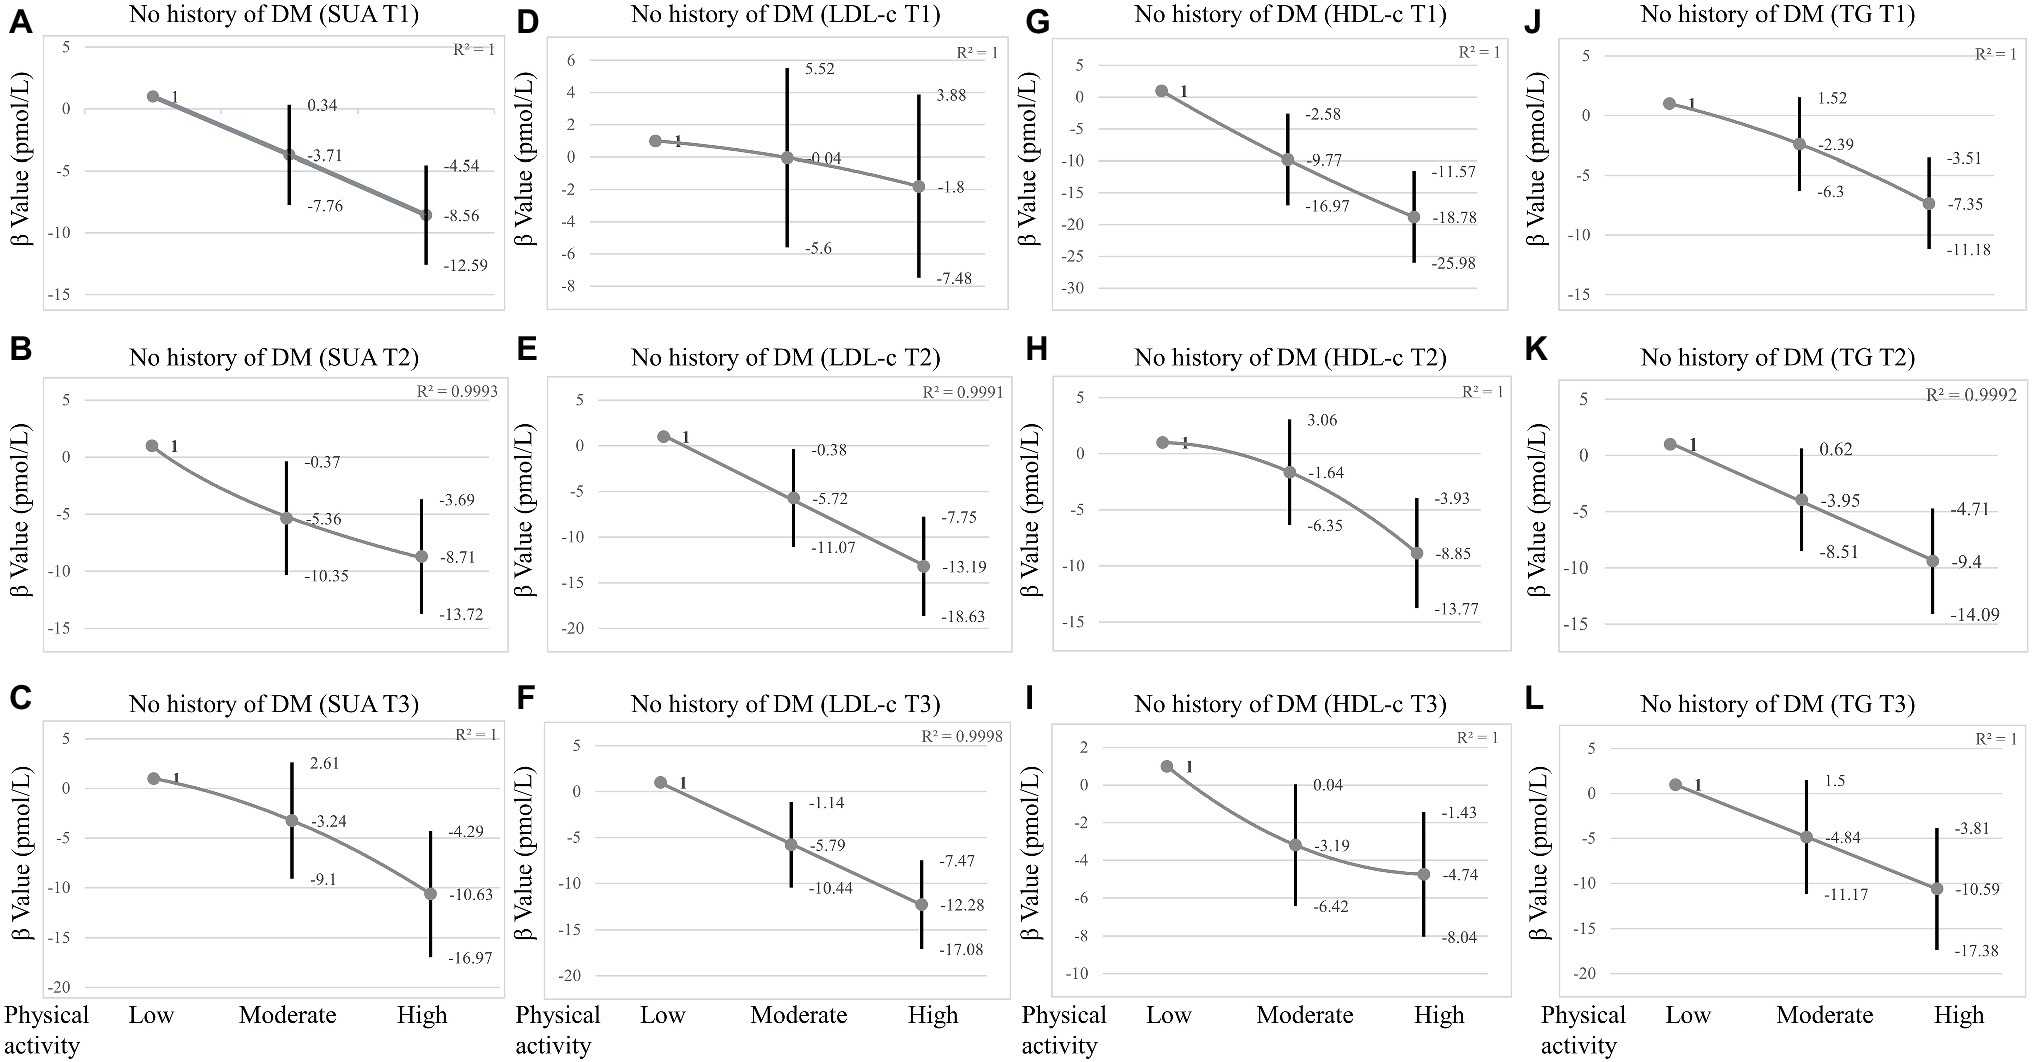
Figure 2. Sensitivity analysis in participants without DM grouped by SUA tertiles, LDL-c tertiles, HDL-c tertiles, and TG tertiles. (A–C) The association between physical activity and insulin grouped by SUA tertiles in participants without DM. (D–F) The association between physical activity and insulin grouped by LDL-c tertiles in participants without DM. (G–I) The association between physical activity and insulin grouped by HDL-c tertiles in participants without DM. (J–L) The association between physical activity and insulin grouped by TG tertiles in participants without DM. SUA tertiles = male T1 23.80–321.20 μmol/L; T2 327.10–380.70 μmol/L; T3 386.60–773.20 μmol/L; Female T1 23.80–243.90 μmol/L; T2 249.80–297.40 μmol/L; T3 303.30–1070.60 μmol/L. LDL-c tertiles = T1 0.23–2.46 mmol/L; T2 2.48–3.23 mmol/L; T3 3.26–9.70 mmol/L; HDL-c tertiles = T1 0.16–1.16 mmol/L; T2 1.19–1.50 mmol/L; T3 1.53–5.84 mmol/L; TG tertiles = T1 0.10–0.87 mmol/L; T2 0.88–1.40 mmol/L; T3 1.41–34.56 mmol/L; and Adjusted for age, sex, race/ethnicity, BMI, glucose, smoking, alcohol consumption, SUA, LDL-c, TG, HDL-c, SBP, ALT, AST, and creatinine were adjusted. In subgroup analysis stratified by SUA, HDL-c, LDL-c, and TG tertiles, the model is not adjusted for SUA, HDL-c, LDL-c, and TG, respectively.
It is well known that PA improves IR (Sampath Kumar et al., 2019). Herein, our logistic regression analyses showed that increased intensities of PA could significantly reduce insulin levels, and this tendency persisted in different stratified analysis. The link between PA and insulin persisted even after adjusting for confounding factors, independent of gender. High-intensity PA significantly lowered insulin levels in the lower and higher SUA tertiles, and in three tertiles of lipid indices (LDL-c, HDL-c, and TG) in the general population. In addition, the association between PA and insulin was stronger in male individuals than in females, and sensitivity analysis observed similar link between PA and insulin in participants without DM. Collectively, these results revealed that different intensities of PA had different effects on insulin under different lipid indices (LDL-c, HDL-c, and TG) and SUA levels. To the best of our knowledge, this is the first study to show the association between PA and insulin under different levels of SUA and lipid indices (LDL-c, HDL-c, and TG).
Insulin is the only hormone in the body that reduces blood glucose while also promoting the production of glycogen, fat, and protein. Insulin resistance occurs when the pancreas secretes a substantial amount of insulin to maintain glucose levels in the normal range. Evidence suggests that as many as 86 million Americans aged 20 and older suffer from insulin resistance (National Center for Chronic Disease and Health Promotion, 2014). In modern cultures, noncommunicable diseases, such as CVD, diabetes, and obesity, which account for more than 70% of all deaths worldwide, are on the rise (World Health Organization, 2018). Despite the high costs of chronic diseases, it is expected that the majority of noncommunicable diseases can be avoided. Physical inactivity is a big risk factor, and hence, PA is an obvious remedy, in addition to a poor diet, cigarette use, and problematic alcohol consumption. For example, it has been found that physically inactive middle-aged women have a 52% increases in all-cause death and a doubling in cardiovascular-related mortality (Hu et al., 2004; Myers et al., 2004). MS risk decreases have been recorded with as little as 30 min of moderate-intensity activity per day, and the process involves numerous pathways, including body mass regulation, hypertension, insulin resistance reduction, dyslipidemia, insulin sensitivity enhancement, and glycemic control (Bassuk and Manson, 2005).
This study found that increased intensities of PA can considerably reduce insulin levels, with high-intensity PA exhibiting the best results. The American College of Sports Medicine suggests 30–60 min of moderate-intensity aerobic exercise 5 or more days per week, or three or more 20–60 min vigorous-intensity exercise sessions (Garber et al., 2011). Although moderate-intensity exercise is beneficial in this regard, some studies have revealed that strenuous exercise is even more effective (Slentz et al., 2005; DiPietro et al., 2006; Swain and Franklin, 2006). The odds ratios for having MS in the Whitehall II research, which included 5,153 Caucasian Europeans, were 0.52 and 0.78, respectively, among persons engaging in high (METs > 5) and moderate (3 < METs < 5) activity (Rennie et al., 2003). These recommendations are consistent with mounting evidence that high-intensity training can be just as effective as traditional high-volume endurance training at moderate intensities, not only in terms of endurance performance improvements, but also in terms of health benefits, with some studies even indicating that high-intensity training may be superior (Wisloff et al., 2009; Kessler et al., 2012). The above recommendations, undoubtedly, better support our results.
This study confirmed that SUA and insulin were positively correlated. The strong intercorrelation between hyperuricemia and IR has been well demonstrated in previous studies. Some studies have reported that increased uric acid levels can predict the risk of IR (Krishnan et al., 2012) and higher uric acid levels probably precede insulin resistance (Han et al., 2017). It has been reported that lower uric acid levels with allopurinol can improve IR (Nakagawa et al., 2006; Takir et al., 2015). In this study, results obtained in the lower and higher SUA tertiles also showed that high-intensity PA could significantly reduce insulin levels. The underlying mechanism of this association may be clarified from the aspect of redox in the body. It is well known that SUA has a physiological function, acting as an antioxidant by enhancing superoxide dismutation to hydrogen peroxide and lowering superoxide availability and its detrimental interaction with nitric oxide (Davies et al., 1986). When the level of uric acid gradually rises, it will produce pro-oxidant properties. Hepatic IR can be caused by high uric acid levels, which cause hepatic steatosis by causing mitochondrial oxidative stress (Lanaspa et al., 2012). Elevated uric acid can cause peripheral IR through two main mechanisms: (1) decreased NO bioavailability and endothelial NO supply, which restricts glucose delivery to skeletal muscle (Roy et al., 1998; Khosla et al., 2005) and (2) activation of NADPH oxidase, which produces oxidized lipids and inflammatory mediators in adipocytes (Sautin et al., 2007). In addition, participants with high SUA seem to have an unhealthy lifestyle (Hu et al., 2020). In a recent investigation, SUA levels were found to be favorably linked with all indices of adiposity (Pirro et al., 2017). Similarly, another study found that adiposity variables could partially or completely mediate the relationship between SUA, glucose/insulin homeostasis, and inflammation (Mazidi et al., 2018). However, low SUA levels might reflect persons with a poor nutritional status (Beberashvili et al., 2015). Therefore, low SUA levels represent reduced total antioxidant capacity. Regular aerobic exercise improves antioxidant defenses and immunological response, which helps to improve vascular and cellular health (He et al., 2016). Furthermore, the positive effects of daily PA on oxidative stress levels have been demonstrated in patients with atherosclerosis (Gardner et al., 2017). To reduce oxidative damage, cells increase de novo synthesis of antioxidant enzymes during persistent exercise training. SOD has been shown to rise in response to exercise training (Toledo-Arruda et al., 2017), as one of the first antioxidant enzymes to respond to cellular ROS. Chronic PA has also been demonstrated to boost the two other primary antioxidant enzymes, glutathione peroxidase and catalase (Rowinski et al., 2013; Fraile-Bermudez et al., 2015). These results obtained in this study suggested that high-intensity PA still reduced insulin levels under conditions of oxidative stress of the body, possibly because PA can not only reduce weight, but also stabilize oxidative stress levels in the body, thereby increasing insulin sensitivity and reducing insulin levels. It is well known that both insulin resistance and insulin secretion defects are two core mechanisms during the development of DM. A series of cohort studies and a subsequent meta-analysis investigated the relationship between SUA levels and the incidence of impaired fasting glucose (IFG), and T2DM and discovered that hyperuricemia is an early and important sign of impaired glucose control (Krishnan et al., 2012; Jia et al., 2013; Cicero et al., 2014). Therefore, sensitivity analysis was performed in participants without DM. Interestingly, we observed that high-intensity PA reduced insulin levels at all levels of SUA. This may be related to the antioxidant of SUA itself and the complicated relationship between SUA and IR and DM, but the specific mechanism needs further epidemiological research and basic experimental studies to confirm.
In this study, we found a positive correlation between TG and insulin, and a negative correlation between LDL-c, HDL-c, and insulin. It is widely recognized that insulin resistance (IR) plays a critical role in the pathogenesis of dyslipidemia. However, in contrast, one study suggested that lipid buildup also causes IR (Medina-Santillan et al., 2013). Studies have shown that IR impacts the metabolism of triglycerides, HDL-c, and low-density lipoprotein cholesterol (LDL-c) through several mechanisms (Grundy, 1997; Festa et al., 2005; Bjornstad and Eckel, 2018). Increased levels of hepatic triglyceride lipase (HTGL) have also been associated with IR, which may result in faster HDL-c clearance and lower HDL-c levels (Baynes et al., 1991; Sparks et al., 2012), ultimately causing hypertriglyceridemia and reduced HDL-c values. It should be noted that IR and dyslipidemia are risk factors for CVDs and DM. Recent research on the relationship between physical inactivity and CVD has yielded sobering results, showing that physical inactivity is a potential risk factor that considerably increases susceptibility to CVD (Erlichman et al., 2002). In an RCT study, which the overall effects of PA were analyzed by quartiles of daily steps of all subjects, there were significant reductions in total and LDL cholesterol and visceral fat area between the highest (daily steps over 6,520) and the lowest quartile (1780–2,810 daily steps) and they confirmed that habitual and structured PA with the acceleration levels of 0.3–0.7 g and daily steps over 6,520 are clinically beneficial for overweight, obese, and physically inactive individuals with a high risk for T2DM (Herzig et al., 2014). In a variety of populations, including men and women with diabetes, glucose intolerance, obesity, sedentary moderately overweight, metabolic syndrome, and T2DM, recent studies have consistently shown that moderate aerobic exercise for 30 min or more three times per week for at least 8 weeks improves insulin sensitivity (Bird and Hawley, 2016). Furthermore, PA has been used as a therapeutic strategy for the prevention of CVD and DM (Pearson et al., 2002). Previous studies have focused on that PA not only improves IR, but also improves lipid homeostasis (Herzig et al., 2014) and body weight (Tuomilehto et al., 2001), reducing the risk of T2DM. In our study, however, the high-intensity PA effects on insulin were statistically significant regardless of changes in lipid indices (TG, HDL-c, and LDL-c) levels and other confounding factors. The improvement in the insulin levels of our participants appeared to be mostly an independent outcome and is not affected by lipid levels. Our new results in sensitivity analysis also confirmed that the change in PA had an independent effect on insulin levels regardless of the levels of lipid indices (TG, HDL-c, and LDL-c) in participants without DM, and these results may reflect the effects of PA on insulin signaling in the skeletal muscle (Despres et al., 2001).
Interestingly, we found that the relationship between PA and insulin was more pronounced in men. According to numerous research conducted predominantly in male populations (Lehtonen and Viikari, 1978; Huttunen et al., 1979), increased intensities of PA are associated with higher HDL cholesterol levels and lower triglyceride levels. Recent studies have revealed that sex hormones may play a role in the control of insulin receptors (Bertoli et al., 1980) and the maintenance of beta-cell competence (Bailey and Ahmed-Sorour, 1980). The lack of significant results in women suggests that estrogen and/or progesterone may influence the relationship between insulin sensitivity, PA, and lipoprotein indices. In addition, there are gender differences in substrate utilization during exercise (Ruby and Robergs, 1994). However, the role of sex hormones in this pathway is unclear, and thus further methodological studies should be conducted.
However, the study had some limitations. To begin with, the cross-sectional study design did not rule out the possibility of a causal link between SUA, lipid, and insulin levels. Second, we were unable to rule out the impact of underlying disorders and medications, particularly hypoglycemic medicines, on the outcomes. Further basic mechanism research and a large population-based sample should be conducted in a prospective manner to solve these constraints.
In conclusion, this study shows that PA can significantly lower insulin levels, and high-intensity PA still has additional potential benefits for insulin levels, even in the condition of dyslipidemia and hyperuricemia. When properly programmed, regular PA can not only reduce risk factors for a range of noncommunicable diseases, such as CVD, sarcopenia, metabolic syndrome, osteoporosis, and depression, but also increase physical performance (strength, power, and endurance), physical, and mental health. Unlike medication, PA typically has no adverse effects, is inexpensive, cures multiple health concerns at once, and may have extra potential advantages.
The datasets presented in this study can be found in online repositories. The names of the repository/repositories and accession number(s) can be found in the article/Supplementary Material.
YL and RF: conceptualization. YL, RF, ZH, and JL: methodology. YX: validation, resources, and project administration. YL, RF, and JL: formal analysis. YX and XY: investigation. YL, RF, and ZH: writing – original draft preparation. YX, YZ, and XY: writing – review and editing. YX and YZ: funding acquisition. All authors contributed to the article and approved the submitted version.
This research was funded by the National Natural Science Foundation of China (grant numbers 81900439 and 81970286), the Major Program of Science and Technology of Liaoning (2021JH1/10400050), the Science Foundation of Doctors of Liaoning Province (grant number 2020-BS-197), the Chang Jiang Scholars Program (grant number T2017124), and the Dalian Talents Innovation Supporting Project (grant number 2018RD09).
The authors declare that the research was conducted in the absence of any commercial or financial relationships that could be construed as a potential conflict of interest.
All claims expressed in this article are solely those of the authors and do not necessarily represent those of their affiliated organizations, or those of the publisher, the editors and the reviewers. Any product that may be evaluated in this article, or claim that may be made by its manufacturer, is not guaranteed or endorsed by the publisher.
The authors appreciate the time and effort given by participants during the data collection phase of the NHANES project.
The Supplementary Material for this article can be found online at: https://www.frontiersin.org/articles/10.3389/fphys.2022.809669/full#supplementary-material
Ainsworth, B. E., Haskell, W. L., Herrmann, S. D., Meckes, N., Bassett, D. R. Jr., Tudor-Locke, C., et al. (2011). Compendium of physical activities: a second update of codes and MET values. Med. Sci. Sports Exerc. 43, 1575–1581. doi: 10.1249/MSS.0b013e31821ece12
Aune, D., Norat, T., Leitzmann, M., Tonstad, S., and Vatten, L. J. (2015). Physical activity and the risk of type 2 diabetes: a systematic review and dose-response meta-analysis. Eur. J. Epidemiol. 30, 529–542. doi: 10.1007/s10654-015-0056-z
Bailey, C. J., and Ahmed-Sorour, H. (1980). Role of ovarian hormones in the long-term control of glucose homeostasis. Effects of insulin secretion. Diabetologia 19, 475–481.
Barnard, R. J., Roberts, C. K., Varon, S. M., and Berger, J. J. (1988). Diet-induced insulin resistance precedes other aspects of the metabolic syndrome. J. Appl. Physiol. 84, 1311–1315.
Bassuk, S. S., and Manson, J. E. (2005). Epidemiological evidence for the role of physical activity in reducing risk of type 2 diabetes and cardiovascular disease. J. Appl. Physiol. 99, 1193–1204. doi: 10.1152/japplphysiol.00160.2005
Baynes, C., Henderson, A. D., Anyaoku, V., Richmond, W., Hughes, C. L., Johnston, D. G., et al. (1991). The role of insulin insensitivity and hepatic lipase in the dyslipidaemia of type 2 diabetes. Diabet. Med. 8, 560–566.
Beberashvili, I., Sinuani, I., Azar, A., Shapiro, G., Feldman, L., Stav, K., et al. (2015). Serum uric acid as a clinically useful nutritional marker and predictor of outcome in maintenance hemodialysis patients. Nutrition 31, 138–147. doi: 10.1016/j.nut.2014.06.012
Bertoli, A., De Pirro, R., Fusco, A., Greco, A. V., Magnatta, R., and Lauro, R. (1980). Differences in insulin receptors between men and menstruating women and influence of sex hormones on insulin binding during the menstrual cycle. J. Clin. Endocrinol. Metab. 50, 246–250.
Bird, S. R., and Hawley, J. A. (2016). Update on the effects of physical activity on insulin sensitivity in humans. BMJ Open Sport Exerc. Med. 2:e000143. doi: 10.1136/bmjsem-2016-000143
Bjornstad, P., and Eckel, R. H. (2018). Pathogenesis of lipid disorders in insulin resistance: a brief review. Curr. Diab. Rep. 18:127. doi: 10.1007/s11892-018-1101-6
Borghouts, L. B., and Keizer, H. A. (2000). Exercise and insulin sensitivity: a review. Int. J. Sports Med. 21, 1–12. doi: 10.1055/s-2000-8847
Church, T. (2011). Exercise in obesity, metabolic syndrome, and diabetes. Prog. Cardiovasc. Dis. 53, 412–418. doi: 10.1016/j.pcad.2011.03.013
Cicero, A. F., Derosa, G., Rosticci, M., D’Addato, S., Agnoletti, D., Borghi, C., et al. (2014). Long-term predictors of impaired fasting glucose and type 2 diabetes in subjects with family history of type 2 diabetes: a 12-years follow-up of the Brisighella heart study historical cohort. Diabetes Res. Clin. Pract. 104, 183–188. doi: 10.1016/j.diabres.2014.02.005
Curtin, L. R., Mohadjer, L. K., Dohrmann, S. M., Kruszon-Moran, D., Mirel, L. B., Carroll, M. D., et al. (2013). National Health and Nutrition Examination Survey: sample design, 2007-2010. Vital Health Stat. 2, 1–23.
Davies, K. J., Sevanian, A., Muakkassah-Kelly, S. F., and Hochstein, P. (1986). Uric acid-iron ion complexes. A new aspect of the antioxidant functions of uric acid. Biochem. J. 235, 747–754. doi: 10.1042/bj2350747
Despres, J. P., Lemieux, I., and Prud’homme, D. (2001). Treatment of obesity: need to focus on high risk abdominally obese patients. BMJ 322, 716–720. doi: 10.1136/bmj.322.7288.716
DiPietro, L., Dziura, J., Yeckel, C. W., and Neufer, P. D. (2006). Exercise and improved insulin sensitivity in older women: evidence of the enduring benefits of higher intensity training. J. Appl. Physiol. 100, 142–149. doi: 10.1152/japplphysiol.00474.2005
Duncan, G. E. (2006). Exercise, fitness, and cardiovascular disease risk in type 2 diabetes and the metabolic syndrome. Curr. Diab. Rep. 6, 29–35. doi: 10.1007/s11892-006-0048-1
Eriksson, K. F., and Lindgarde, F. (1991). Prevention of type 2 (non-insulin-dependent) diabetes mellitus by diet and physical exercise. The 6-year Malmo feasibility study. Diabetologia 34, 891–898.
Erlichman, J., Kerbey, A. L., and James, W. P. (2002). Physical activity and its impact on health outcomes. Paper 1: the impact of physical activity on cardiovascular disease and all-cause mortality: an historical perspective. Obes. Rev. 3, 257–271. doi: 10.1046/j.1467-789X.2002.00077.x
Festa, A., Williams, K., Hanley, A. J., Otvos, J. D., Goff, D. C., Wagenknecht, L. E., et al. (2005). Nuclear magnetic resonance lipoprotein abnormalities in prediabetic subjects in the insulin resistance atherosclerosis study. Circulation 111, 3465–3472. doi: 10.1161/CIRCULATIONAHA.104.512079
Fraile-Bermudez, A. B., Kortajarena, M., Zarrazquin, I., Maquibar, A., Yanguas, J. J., Sanchez-Fernandez, C. E., et al. (2015). Relationship between physical activity and markers of oxidative stress in independent community-living elderly individuals. Exp. Gerontol. 70, 26–31. doi: 10.1016/j.exger.2015.07.005
Garber, C. E., Blissmer, B., Deschenes, M. R., Franklin, B. A., Lamonte, M. J., Lee, I. M., et al. (2011). American College of Sports, American College of Sports Medicine position stand. Quantity and quality of exercise for developing and maintaining cardiorespiratory, musculoskeletal, and neuromotor fitness in apparently healthy adults: guidance for prescribing exercise. Med. Sci. Sports Exerc. 43, 1334–1359. doi: 10.1249/MSS.0b013e318213fefb
Gardner, A. W., Montgomery, P. S., Zhao, Y. D., Silva-Palacios, F., Ungvari, Z., Csiszar, A., et al. (2017). Association between daily walking and antioxidant capacity in patients with symptomatic peripheral artery disease. J. Vasc. Surg. 65, 1762–1768. doi: 10.1016/j.jvs.2016.12.108
Grundy, S. M. (1997). Small LDL, atherogenic dyslipidemia, and the metabolic syndrome. Circulation 95, 1–4.
Haffner, S. M., Valdez, R. A., Hazuda, H. P., Mitchell, B. D., Morales, P. A., and Stern, M. P. (1992). Prospective analysis of the insulin-resistance syndrome (syndrome X). Diabetes 41, 715–722. doi: 10.2337/diab.41.6.715
Hallal, P. C., Andersen, L. B., Bull, F. C., Guthold, R., Haskell, W., Ekelund, U., et al. (2012). Lancet physical activity series working, global physical activity levels: surveillance progress, pitfalls, and prospects. Lancet 380, 247–257. doi: 10.1016/S0140-6736(12)60646-1
Han, T., Lan, L., Qu, R., Xu, Q., Jiang, R., Na, L., et al. (2017). Temporal relationship between hyperuricemia and insulin resistance and its impact on future risk of hypertension. Hypertension 70, 703–711. doi: 10.1161/HYPERTENSIONAHA.117.09508
He, F., Li, J., Liu, Z., Chuang, C. C., Yang, W., and Zuo, L. (2016). Redox mechanism of reactive oxygen species in exercise. Front. Physiol. 7:486. doi: 10.3389/fphys.2016.00486
Herzig, K. H., Ahola, R., Leppaluoto, J., Jokelainen, J., Jamsa, T., and Keinanen-Kiukaanniemi, S. (2014). Light physical activity determined by a motion sensor decreases insulin resistance, improves lipid homeostasis and reduces visceral fat in high-risk subjects: PreDiabEx study RCT. Int. J. Obes. 38, 1089–1096. doi: 10.1038/ijo.2013.224
Howard, B. V., Robbins, D. C., Sievers, M. L., Lee, E. T., Rhoades, D., Devereux, R. B., et al. (2000). LDL cholesterol as a strong predictor of coronary heart disease in diabetic individuals with insulin resistance and low LDL: The strong heart study. Arterioscler. Thromb. Vasc. Biol. 20, 830–835. doi: 10.1161/01.ATV.20.3.830
Hu, L., Hu, G., Xu, B. P., Zhu, L., Zhou, W., Wang, T., et al. (2020). U-shaped association of serum uric acid with all-cause and cause-specific mortality in US adults: A cohort study. J. Clin. Endocrinol. Metab. 105, e597–e609. doi: 10.1210/clinem/dgz068
Hu, F. B., Willett, W. C., Li, T., Stampfer, M. J., Colditz, G. A., and Manson, J. E. (2004). Adiposity as compared with physical activity in predicting mortality among women. N. Engl. J. Med. 351, 2694–2703. doi: 10.1056/NEJMoa042135
Huttunen, J. K., Lansimies, E., Voutilainen, E., Ehnholm, C., Hietanen, E., Penttila, I., et al. (1979). Effect of moderate physical exercise on serum lipoproteins. A controlled clinical trial with special reference to serum high-density lipoproteins. Circulation 60, 1220–1229.
Jia, Z., Zhang, X., Kang, S., and Wu, Y. (2013). Serum uric acid levels and incidence of impaired fasting glucose and type 2 diabetes mellitus: a meta-analysis of cohort studies. Diabetes Res. Clin. Pract. 101, 88–96. doi: 10.1016/j.diabres.2013.03.026
Kessler, H. S., Sisson, S. B., and Short, K. R. (2012). The potential for high-intensity interval training to reduce cardiometabolic disease risk. Sports Med. 42, 489–509. doi: 10.2165/11630910-000000000-00000
Khosla, U. M., Zharikov, S., Finch, J. L., Nakagawa, T., Roncal, C., Mu, W., et al. (2005). Hyperuricemia induces endothelial dysfunction. Kidney Int. 67, 1739–1742. doi: 10.1111/j.1523-1755.2005.00273.x
Krishnan, E., Pandya, B. J., Chung, L., Hariri, A., and Dabbous, O. (2012). Hyperuricemia in young adults and risk of insulin resistance, prediabetes, and diabetes: a 15-year follow-up study. Am. J. Epidemiol. 176, 108–116. doi: 10.1093/aje/kws002
Lanaspa, M. A., Sanchez-Lozada, L. G., Choi, Y. J., Cicerchi, C., Kanbay, M., Roncal-Jimenez, C. A., et al. (2012). Uric acid induces hepatic steatosis by generation of mitochondrial oxidative stress: potential role in fructose-dependent and -independent fatty liver. J. Biol. Chem. 287, 40732–40744. doi: 10.1074/jbc.M112.399899
Lehtonen, A., and Viikari, J. (1978). Serum triglycerides and cholesterol and serum high-density lipoprotein cholesterol in highly physically active men. Acta Med. Scand. 204, 111–114.
Manson, J. E., Rimm, E. B., Stampfer, M. J., Colditz, G. A., Willett, W. C., Krolewski, A. S., et al. (1991). Physical activity and incidence of non-insulin-dependent diabetes mellitus in women. Lancet 338, 774–778.
Mazidi, M., Katsiki, N., Mikhailidis, D. P., and Banach, M. (2018). The link between insulin resistance parameters and serum uric acid is mediated by adiposity. Atherosclerosis 270, 180–186. doi: 10.1016/j.atherosclerosis.2017.12.033
Medina-Santillan, R., Lopez-Velazquez, J. A., Chavez-Tapia, N., Torres-Villalobos, G., Uribe, M., and Mendez-Sanchez, N. (2013). Hepatic manifestations of metabolic syndrome. Diabetes Metab. Res. Rev. doi: 10.1002/dmrr.2410 [Epub ahead of print].
Myers, J., Kaykha, A., George, S., Abella, J., Zaheer, N., Lear, S., et al. (2004). Fitness versus physical activity patterns in predicting mortality in men. Am. J. Med. 117, 912–918. doi: 10.1016/j.amjmed.2004.06.047
Nakagawa, T., Hu, H., Zharikov, S., Tuttle, K. R., Short, R. A., Glushakova, O., et al. (2006). A causal role for uric acid in fructose-induced metabolic syndrome. Am. J. Physiol. Ren. Physiol. 290, F625–F631. doi: 10.1152/ajprenal.00140.2005
Nakamura, K., Sakurai, M., Miura, K., Morikawa, Y., Nagasawa, S. Y., Ishizaki, M., et al. (2014). HOMA-IR and the risk of hyperuricemia: a prospective study in non-diabetic Japanese men. Diabetes Res. Clin. Pract. 106, 154–160. doi: 10.1016/j.diabres.2014.07.006
National Center for Chronic Disease and Health Promotion (2014). National Diabetes Statistics Report, 2014: Estimates of Diabetes and its Burden in the United States. Atlanta, GA: Division of Diabetes.
Patel, C. J., Pho, N., McDuffie, M., Easton-Marks, J., Kothari, C., Kohane, I. S., et al. (2016). A database of human exposomes and phenomes from the US National Health and Nutrition Examination Survey. Sci. Data 3:160096. doi: 10.1038/sdata.2016.96
Pearson, T. A., Blair, S. N., Daniels, S. R., Eckel, R. H., Fair, J. M., Fortmann, S. P., et al. (2002). AHA guidelines for primary prevention of cardiovascular disease and stroke: 2002 update: consensus panel guide to comprehensive risk reduction for adult patients Without coronary or other atherosclerotic vascular diseases. American Heart Association science advisory and coordinating committee. Circulation 106, 388–391. doi: 10.1161/01.cir.0000020190.45892.75
Pirro, M., Mannarino, M. R., Bianconi, V., De Vuono, S., Sahebkar, A., Bagaglia, F., et al. (2017). Uric acid and bone mineral density in postmenopausal osteoporotic women: the link lies within the fat. Osteoporos. Int. 28, 973–981. doi: 10.1007/s00198-016-3792-3
Rennie, K. L., McCarthy, N., Yazdgerdi, S., Marmot, M., and Brunner, E. (2003). Association of the metabolic syndrome with both vigorous and moderate physical activity. Int. J. Epidemiol. 32, 600–606. doi: 10.1093/ije/dyg179
Roberts, C. K., Hevener, A. L., and Barnard, R. J. (2013). Metabolic syndrome and insulin resistance: underlying causes and modification by exercise training. Compr. Physiol. 3, 1–58. doi: 10.1002/cphy.c110062
Rowinski, R., Kozakiewicz, M., Kedziora-Kornatowska, K., Hubner-Wozniak, E., and Kedziora, J. (2013). Markers of oxidative stress and erythrocyte antioxidant enzyme activity in older men and women with differing physical activity. Exp. Gerontol. 48, 1141–1146. doi: 10.1016/j.exger.2013.07.010
Roy, D., Perreault, M., and Marette, A. (1998). Insulin stimulation of glucose uptake in skeletal muscles and adipose tissues in vivo is NO dependent. Am. J. Phys. 274, E692–E699.
Ruby, B. C., and Robergs, R. A. (1994). Gender differences in substrate utilisation during exercise. Sports Med. 17, 393–410.
Sampath Kumar, A., Maiya, A. G., Shastry, B. A., Vaishali, K., Ravishankar, N., Hazari, A., et al. (2019). Exercise and insulin resistance in type 2 diabetes mellitus: a systematic review and meta-analysis. Ann. Phys. Rehabil. Med. 62, 98–103. doi: 10.1016/j.rehab.2018.11.001
Sautin, Y. Y., Nakagawa, T., Zharikov, S., and Johnson, R. J. (2007). Adverse effects of the classic antioxidant uric acid in adipocytes: NADPH oxidase-mediated oxidative/nitrosative stress. Am. J. Phys. Cell Physiol. 293, C584–C596. doi: 10.1152/ajpcell.00600.2006
Slentz, C. A., Aiken, L. B., Houmard, J. A., Bales, C. W., Johnson, J. L., Tanner, C. J., et al. (2005). Inactivity, exercise, and visceral fat. STRRIDE: a randomized, controlled study of exercise intensity and amount. J. Appl. Physiol. 99, 1613–1618. doi: 10.1152/japplphysiol.00124.2005
Sparks, J. D., Sparks, C. E., and Adeli, K. (2012). Selective hepatic insulin resistance, VLDL overproduction, and hypertriglyceridemia. Arterioscler. Thromb. Vasc. Biol. 32, 2104–2112. doi: 10.1161/ATVBAHA.111.241463
Swain, D. P., and Franklin, B. A. (2006). Comparison of cardioprotective benefits of vigorous versus moderate intensity aerobic exercise. Am. J. Cardiol. 97, 141–147. doi: 10.1016/j.amjcard.2005.07.130
Takir, M., Kostek, O., Ozkok, A., Elcioglu, O. C., Bakan, A., Erek, A., et al. (2015). Lowering uric acid with allopurinol improves insulin resistance and systemic inflammation in asymptomatic hyperuricemia. J. Investig. Med. 63, 924–929. doi: 10.1097/JIM.0000000000000242
Ter Maaten, J. C., Voorburg, A., Heine, R. J., Ter Wee, P. M., Donker, A. J., and Gans, R. O. (1997). Renal handling of urate and sodium during acute physiological hyperinsulinaemia in healthy subjects. Clin. Sci. 92, 51–58.
Toledo-Arruda, A. C., Vieira, R. P., Guarnier, F. A., Suehiro, C. L., Caleman-Neto, A., Olivo, C. R., et al. (2017). Time-course effects of aerobic physical training in the prevention of cigarette smoke-induced COPD. J. Appl. Physiol. 123, 674–683. doi: 10.1152/japplphysiol.00819.2016
Tuomilehto, J., Lindstrom, J., Eriksson, J. G., Valle, T. T., Hamalainen, H., Ilanne-Parikka, P., et al. (2001). Finnish diabetes prevention study, prevention of type 2 diabetes mellitus by changes in lifestyle among subjects with impaired glucose tolerance. N. Engl. J. Med. 344, 1343–1350. doi: 10.1056/NEJM200105033441801
Vandenbroucke, J. P., von Elm, E., Altman, D. G., Gotzsche, P. C., Mulrow, C. D., Pocock, S. J., et al. (2007). Strengthening the reporting of observational studies in epidemiology (STROBE): explanation and elaboration. Epidemiology 18, 805–835. doi: 10.1097/EDE.0b013e3181577511
von Elm, E., Altman, D. G., Egger, M., Pocock, S. J., Gotzsche, P. C., Vandenbroucke, J. P., et al. (2007). The strengthening the reporting of observational studies in epidemiology (STROBE) statement: guidelines for reporting observational studies. PLoS Med. 4:e296. doi: 10.1371/journal.pmed.0040296
Wan, X., Xu, C., Lin, Y., Lu, C., Li, D., Sang, J., et al. (2016). Uric acid regulates hepatic steatosis and insulin resistance through the NLRP3 inflammasome-dependent mechanism. J. Hepatol. 64, 925–932. doi: 10.1016/j.jhep.2015.11.022
Wisloff, U., Ellingsen, O., and Kemi, O. J. (2009). High-intensity interval training to maximize cardiac benefits of exercise training? Exerc. Sport Sci. Rev. 37, 139–146. doi: 10.1097/JES.0b013e3181aa65fc
World Health Organization (2018). World Health Statistics 2018: Monitoring Health for the SDGs, Sustainable Development Goals. Geneva: World Health Organization. Licence: CC BY-NC-SA 3.0 IGO.
Keywords: physical activity, insulin, NHANES, SUA, lipids
Citation: Lin Y, Fan R, Hao Z, Li J, Yang X, Zhang Y and Xia Y (2022) The Association Between Physical Activity and Insulin Level Under Different Levels of Lipid Indices and Serum Uric Acid. Front. Physiol. 13:809669. doi: 10.3389/fphys.2022.809669
Edited by:
Hassane Zouhal, University of Rennes 2 – Upper Brittany, FranceReviewed by:
Yingyun Gong, Nanjing Medical University, ChinaCopyright © 2022 Lin, Fan, Hao, Li, Yang, Zhang and Xia. This is an open-access article distributed under the terms of the Creative Commons Attribution License (CC BY). The use, distribution or reproduction in other forums is permitted, provided the original author(s) and the copyright owner(s) are credited and that the original publication in this journal is cited, in accordance with accepted academic practice. No use, distribution or reproduction is permitted which does not comply with these terms.
*Correspondence: Ying Zhang, enkxMTQxMjlAc2luYS5jb20=; Yunlong Xia, eXVubG9uZ194aWFAMTI2LmNvbQ==
†These authors have contributed equally to this work
Disclaimer: All claims expressed in this article are solely those of the authors and do not necessarily represent those of their affiliated organizations, or those of the publisher, the editors and the reviewers. Any product that may be evaluated in this article or claim that may be made by its manufacturer is not guaranteed or endorsed by the publisher.
Research integrity at Frontiers
Learn more about the work of our research integrity team to safeguard the quality of each article we publish.