Corrigendum: Rotavirus-Mediated Prostaglandin E2 Production in MA104 Cells Promote Virus Attachment and Internalisation, Resulting in an Increased Viral Load
 Willem J. Sander
 Gabré Kemp
 Arnold Hugo
 Carolina H. Pohl
 Hester G. O’Neill
- 1Department of Microbiology and Biochemistry, University of the Free State, Bloemfontein, South Africa
- 2Department of Animal Science, University of the Free State, Bloemfontein, South Africa
Rotaviruses are one of the leading causes of severe dehydrating diarrhoea in infants and children under the age of five. Despite the introduction of vaccines, disease burden remains high in sub-Saharan Africa, with no known anti-viral treatments available. During early infection rotavirus attaches to several cellular receptors and enters the cells by either clathrin-dependent or -independent endocytosis. Prostaglandin E2, an abundant eicosanoid, is produced from arachidonic acid during rotavirus infection and inhibition of prostaglandin E2 formation have a deleterious effect on rotavirus infection. In this study, MA104 cells were supplemented with γ-linolenic acid (GLA), a precursor of arachidonic acid. Infection of supplemented cells with rotavirus SA11 led to a depletion in the relative percentages of GLA and arachidonic acid which coincided with an increased production of prostaglandin E2 as monitored by ELISA. Confocal microscopy demonstrated that prostaglandin E2 co-localises with the viroplasm-forming proteins, NSP5 and NSP2. Due to the known association of viroplasms with lipid droplets and the fact that lipid droplets are sites for prostaglandin E2 production, our results indicate a possible role for viroplasms in the production of rotavirus-induced prostaglandin E2. Replication kinetics showed that inhibitors, targeting the biosynthesis of prostaglandin E2, had negative effects on rotavirus yield, especially during the early stages of infection. Using flow cytometry and prostaglandin E2 addback experiments, we show that prostaglandin E2 enhances the attachment and internalisation of rotavirus in MA104 cells indicating a possible role for prostaglandin E2 during clathrin-mediated rotavirus entry. The production of prostaglandin E2 during rotavirus infection could serve as a possible target for anti-viral treatment.
Introduction
Rotavirus (RV), a member of the Reoviridae family, causes severe dehydrating diarrhoea in infants and young children (Estes and Greenberg, 2013). Despite the global introduction of several RV vaccines, mortality in Sub-Saharan Africa remains high (Godfrey et al., 2020). The 11-segmented dsRNA genome of RV encodes six structural viral proteins (VP) and five or six non-structural proteins (NSP; Estes and Greenberg, 2013). Although RV attachment and internalisation are not well understood it is known that RV binds to several cell receptors, where after internalisation occurs rapidly by either clathrin-dependent or -independent endocytosis, depending on viral strain (Arias and López, 2021). During viral replication, RV forms cytoplasmic inclusion bodies, termed viroplasms, which are required for assortment, genome replication and formation of progeny viral particles (Papa et al., 2021). The formation of viroplasms requires host lipid droplets (LDs) and several viral proteins, specifically NSP2 and NSP5 (Cheung et al., 2010; Kim et al., 2012; Gaunt et al., 2013; Crawford and Desselberger, 2016).
Lipid droplets are organelles that play diverse roles in the physiology and pathophysiology of cells (Walther et al., 2017; Brink et al., 2021). The major components, making up the neutral core of LDs, are triacylglycerols and sterol esters, which serve as energy stores during nutrient deprivation (Jackson et al., 2016). This core is surrounded by a phospholipid monolayer that contains diverse membrane-bound proteins (Bartz et al., 2007). Some of these proteins, such as viperin, immunity-related GTPases, lipoxygenases and cyclooxygenases (COX), are involved in the production of lipid mediators, which play crucial roles during the immune response to viral infections (Accioly et al., 2008; Bozza et al., 2011; Monson et al., 2021). Important examples of such lipid mediators are the eicosanoids belonging to the prostaglandins, which modulate inflammation (Ricciotti and FitzGerald, 2011).
Prostaglandins are bioactive molecules that are derived from arachidonic acid (AA; Phipps et al., 1991; Ricciotti and FitzGerald, 2011). The most common PGs, prostaglandin E2 (PGE2), are produced by all mammalian cell types and regulate several physiological processes, including blood pressure, fertility, gastrointestinal integrity, immunity and inflammation (Ricciotti and FitzGerald, 2011). During viral infections, the production of PGE2 can, to the detriment of the host, be modulated to benefit the virus (Sander et al., 2017). Rotavirus has been shown to increase PGE2 levels in vitro during infection of human colorectal adenocarcinoma (Caco-2) cells (Rossen et al., 2004) and in vivo in piglets (Zijlstra et al., 1999). Increased levels of PGE2 were also detected in the stool of RV-infected children and treatment with the COX inhibitor, acetylsalicylic acid, reduced the duration of diarrhoea (Yamashiro et al., 1989). In addition, Hagbom et al. (2012) suggested that the ability of PGE2 to stimulate the excretion of water could contribute to RV disease progression. A previous study suggested a role for PGE2 during the early stages of infection, with no effect on viral RNA, while decreases in protein synthesis and production of viral progeny were observed (Rossen et al., 2004).
To further elucidate the role of PGE2 during RV infection, MA104 cells supplemented with the AA precursor, γ-linolenic acid (GLA), were infected with RV and compared to unsupplemented infected and uninfected cells. We show that RV decreases the relative percentage of AA (a precursor to PGE2) and increases PGE2 levels. The increase in PGE2 coincides with an increase in viral replication in a time- and dose-dependent manner. Most significantly, we show that the inhibition of PGE2 biosynthesis affects RV replication at the attachment and internalisation stage.
Materials and Methods
Cells, Virus and Inhibitors
The African Green Monkey kidney (MA104) cell line was maintained in Dulbecco’s modified Eagle medium (DMEM; Gibco), supplemented with 5% (v/v) foetal bovine serum (FBS; Gibco), 1% (v/v) Penicillin-Streptomycin-Amphotericin B Mixture (10,000 U, 10,000 μg and 25 μg/ml; Lonza) and 1% (v/v) nonessential amino acids (NEAA; Lonza) at 37°C and 5% CO2. Subconfluent cells were supplemented with 50 μM GLA (Thermo Fischer Scientific) for 24 h according to Tanaka et al. (2001). Rotavirus simian agent 11 strain (SA11; Mlera et al., 2013) was used to infect MA104 cells and viral yield was determined using 50% tissue culture infectious doses (TCID50; Reed and Muench, 1938). To facilitate infection, pancreatic porcine trypsin type IX (1 μg/ml; Sigma-Aldrich) was added during all viral replication experiments.
The non-specific cyclooxygenases inhibitor, indomethacin; the COX-1-specific inhibitor, SC-560; the COX-2-specific inhibitor, Celecoxib; cytoplasmic phospholipase A2 inhibitor, CAY10502 and PGE2 were obtained from Sigma-Aldrich and resuspended in 100% (v/v) dimethyl sulfoxide (DMSO; Sigma-Aldrich). Cellular toxicity for the inhibitors and DMSO was evaluated with the XTT assay (Sigma-Aldrich; Supplementary Figure S1). Final DMSO concentration did not exceed 1%.
Cellular Lipid Analysis
MA014 cells (4.9 × 10⁶ cells/ml) were seeded into 175-cm3 flasks (Thermo Fischer Scientific) and allowed to grow to 80% confluence. After 24 h incubation with supplemented GLA at 37°C, the MA104 cells were infected with SA11 [multiplicity of infection (MOI) = 1] for 16 h and rinsed three times with Phosphate-buffered saline (PBS) before they were scraped from the plates. Mock controls, which were not infected, were processed in parallel. Wet biomass was determined and total lipids extracted with chloroform:methanol (2:1; Folch et al., 1957). The total lipids were separated into neutral and phospholipid fractions with 500 mg aminopropyl silica cartridges (Varian) according to the method of Bossio and Scow (1998). The eluates were collected and dried under N2 at room temperature. Fatty acid methyl esters of the lipid fractions were prepared using methanol–BF3 and quantified using a Varian 430 gas chromatograph, with a fused silica capillary column (Chrompack CPSIL 88, 100 m length, 0.25 mm ID, 0.2 μM film thickness). The column temperature was 40–230°C (hold 2 min; 4°C/min; hold 10 min). Fatty acid methyl esters in hexane (1 μl) were injected into the column using a Varian 8400 Autosampler with a split ratio of 100:1. The injection port and detector temperatures were maintained at 250°C. Hydrogen, at 45 psi, functioned as the carrier gas, while nitrogen was employed as the makeup gas. Galaxy Chromatography Data System software recorded the chromatograms. Fatty acid methyl esters were identified by comparing the relative retention times of peaks from samples with those of standards. Fatty acids were expressed as the percentage of each individual fatty acid relative to the total of all fatty acids present in the sample.
Prostaglandin E2 Quantification and Authentication
MA014 cells (0.3 × 10⁶ cells/ml) were seeded into 6-well plates (Thermo Fischer Scientific) and allowed to grow to 100% confluence. The amount of secreted PGE2 in the supernatants of mock- or RV-infected (MOI = 5), both in the presence and absence of inhibitors, was determined at 2 and 4 h post-infection, using an ELISA (Cayman Chemicals) according to the manufacturer’s protocol. In order to determine the effect of viral load on PGE2 production, PGE2 was measured at different MOIs (0.1; 1; 10). LC-MS/MS was used for authentication of PGE2 production. Briefly, the supernatant of each infection was divided into two 500 μl aliquots. One of the 500 μl aliquots was spiked with PGE2 to a final concentration of 100 ng/ml. In order to prevent free radical catalysed lipid peroxidation, citric acid (Sigma-Aldrich) and butylated hydroxytoluene (Sigma-Aldrich, United States) were added to a final concentration of 80 mm and 0.1% (v/v), respectively. Prostaglandins were extracted by addition of 2 ml hexane/ethyl acetate (1:1, v/v), followed by vortex mixing for 1 min. After centrifugation for 5 min at 1,000 × g at 4°C, the upper, organic phase was removed (Caoa et al., 2008). The extraction procedure was repeated, and the organic phases were combined and evaporated to dryness under a stream of nitrogen gas. Twenty microliters of each sample were separated on a C18 column (Luna 3 μM C18, 150 × 3 mm, Phenomenex) at a flow rate of 200 μl/min, using 0.1% (v/v) formic acid (mobile phase A) and acetonitrile with 0.1% formic acid (mobile phase B). The column was equilibrated and loaded at 20% of mobile phase B, increasing to 42.5% B over 50 min, 95% B for 10 min, followed by re-equilibration at 20% B for a total run time of 70 min. Ion spray voltage was set at 4,500 V, nebuliser gas (GS1) was at 40 psi and heater gas (GS2) at 30 psi with the heater temperature set at 400°C. Samples were analysed using a 4000 QTRAP hybrid triple quadrupole ion trap mass spectrometer (AB Sciex) and Shimadzu UFLC stack with LC-20AB binary pump and SIL-20A HT Autosampler as front end. All data acquisition and processing were performed using Analyst 1.5.2 (AB SCIEX) software. To analyse the sample, a targeted Multiple Reaction Monitoring (MRM) workflow was followed on the instrument. All compound- and source-dependent parameters were optimised using compound optimization in Analyst 1.5.2. The targeted analysis for the extracted PGE2 used 5 MRM transitions: 351.17 > 315.2; 351.17 > 271.2; 351.17 > 333.3; 351.17 > 189.0; and 351.17 > 235.1. Only if all five transitions were recorded at the same retention time would the presence of PGE2 be confirmed.
Confocal-Laser Scanning Microscopy
To determine the co-localization between viroplasms and PGE2, MA104 cells (0.1 × 10⁶ cells/ml) were seeded into coverslips in 24-well plates (Thermo Fischer Scientific) and allowed to grow to 80% confluence before being infected at a MOI of 5. The cells were then processed according to Bandeira-Melo et al. (2011) with slight modifications, 2 and 4 h post-infection. Briefly, MA104 cells were fixed and permeabilised with a mixture of 0.5% (w/v) 1-ethyl-3-(3-dimethylamino-propyl) carbodiimide hydrochloride (Sigma-Aldrich) and 1% (v/v) paraformaldehyde in PBS, for 1 h at 37°C. In addition to cross-linking the carboxyl groups of eicosanoids to the amines of adjacent proteins localised at eicosanoid-synthesizing sites, 1-ethyl-3-(3-dimethylamino-propyl) carbodiimide hydrochloride is also able to both fix and permeabilise cells (Bandeira-Melo et al., 2011). After fixation and permeabilisation, the cells were blocked with 1% (w/v) bovine serum albumin (BSA) plus 0.1% (v/v) Triton X-100 in PBS and washed with PBS before overnight incubation (4°C) with PBS containing 1% BSA and 1:100 anti-PGE2 monoclonal antibody (Cayman Chemicals). The cells were washed three times and then incubated in PBS containing 1% BSA and 1:500 rabbit anti-NSP2 (kind gift from Prof. AC Potgieter, Deltamune, South Africa) and/or rabbit anti-NSP5 peptide (KSPEDIGPSDSASNC; GenScript) for 1 h at 37°C. The cells were then washed three times and incubated with 1:500 anti-mouse Alexa-Flour 488 (Thermo Fischer Scientific) and 1:500 anti-rabbit Alexa-Flour 647 (Thermo Fischer Scientific) for 1 h at 37°C. Cells were extensively washed and incubated with 300 nM DAPI (Thermo Fischer Scientific) for 5 min at room temperature. After three washes, the coverslips were mounted on glass slides with 90% (v/v) glycerol in PBS. The samples were analysed by CLSM, using a Zeiss LSM 900 instrument, Zen Blue software and ImageJ (Schneider et al., 2012).
Replication Kinetics
MA104 cells (0.7 × 10⁶ cells/ml) were seeded in 25-cm3 flasks (Thermo Fischer Scientific) and allowed to grow to 80% confluence before being supplemented with 50 μM GLA 24 h prior to infection or rinsed three times with PBS and incubated with either 25 μM indomethacin, 5 μM celecoxib, 2.5 μM SC-560 or 25 nM CAY10502 in serum-free DMEM for 1 h prior to infection. The aforementioned was repeated every 4 h till the completion of the experiment. For addback experiments, 0.1 μM of exogenous PGE2 was added to the cells directly after addition of inhibitors. SA11 was activated for 1 h at 37°C with 10 μg of trypsin/ml, diluted in serum-free DMEM Subsequently, MA104 cells were infected with SA11 at a MOI of 5, both in the presence and absence of GLA or the inhibitors. For the replication studies, time point 00:00 is defined as the initial viral inoculum, while time point 00:30 is cells that were washed with PBS and subsequently freeze-thawed. After infection for 1 h at 37°C, the inoculum was removed and replaced with serum-free DMEM containing 1 μg of trypsin/ml. SA11 was harvested from MA104 cells by three cycles of freeze-thawing, whereafter cellular debris was removed by centrifugation for 10 min at 4,000 × g. The supernatant was used to determine viral RNA yield (qRT-PCR) and infectious viral yield (TCID50).
RNA Isolation and RT-qPCR
In order to evaluate the production of VP6 transcripts, the VP6 coding sequence was inserted into the pTZ57R/T cloning vector (Thermo Fischer Scientific). Positive-sense single-stranded RNA was transcribed using the TranscriptAid T7 High Yield Transcription Kit (Thermo Fischer Scientific), using 1 μg XbaI-linearized (Thermo Fischer Scientific) plasmid DNA as template, followed by incubation with DNaseI (Thermo Fischer Scientific) at 37°C for 20 min. In vitro synthesized RNA was purified using Trizol reagent (Thermo Fischer Scientific) according to the manufacturer’s instructions and quantified with a Qubit RNA BR kit (Thermo Fischer Scientific). RNA from RV-infected MA104 cells, in the presence or absence of PGE2 biosynthesis inhibitors, was semi-purified by 35% (w/v) sucrose cushion ultracentrifugation at 6 h post-infection (Arnold et al., 2009). RNA was extracted from the semi-purified virus by using Trizol reagent according to the manufacturer’s instructions.
Transcribed RNA was used in 2-fold serial dilutions to generate standard curves for determination of the assay efficiency. The Qiagen Rotor-Gene Q System with the Luna® Universal Probe One-Step RT-qPCR Kit (New England Biolabs) was used for RT-qPCR according to the manufacturers protocol using the following primers: cDNA primer (5′-AGGAACGGAATTGCACCT-3′; Integrated DNA Technologies), qPCR forward (5′-CTGGATTTGACTACTCATG-3′) reverse (5′-CGTCTGGTAGAAGAGTTA-3′) and probe (5′-/56-FAM/AACGCACCAGCCAATATACAA-3′; Integrated DNA Technologies). Cycling conditions were 55°C for 10 min, then 95°C for 1 min, followed by 40 cycles of 95°C for 10 s and 60°C for 30 s. Data were analysed with Q-Rex Software Version 1.1.
Attachment and Internalisation Assay
The effect of PGE2 on RV attachment and internalisation was determined using a modified protocol for influenza A virus (Pohl and Stertz, 2015). Twenty-four-well plates were seeded with MA104 cells (0.2 × 10⁶ cells/ml) and supplemented and/or treated with inhibitors/exogenous PGE2 as previously described. To determine if the inhibitors of PGE2 affected attachment, RV-infected MA104 cells were tagged with FITC anti-RV (Abcam) and anti-DLP (rabbit polyclonal antibody raised against RV double-layered particle; a kind gift from Prof. AC Potgieter, Deltamune, South Africa) at time 0 min. The experimental set consisted of two groups: ‘0 min’ and ‘0 min + anti-DLP’. Rotavirus (MOI = 10) was allowed to cold-bind to supplemented and/or treated MA104 cells for 1 h on ice and then washed three times with ice-cold PBS. The ‘0 min’ and ‘0 min + anti-DLP’ samples were fixed in 4% (v/v) paraformaldehyde for 10 min at room temperature, washed three times and stored at 4°C until analysis.
To determine if the inhibitors of PGE2 affected internalisation, RV-infected MA104 cells were again tagged with FITC anti-RV and anti-DLP at 30 min. After the incubation on ice, the ‘30 min’ and ‘30 min + anti-DLP’ samples were washed and PBS containing 2% (w/v) BSA and 1 μg/ml trypsin was added to the MA104 cells, which were then incubated for 30 min at 37°C, fixed and washed three times. Following fixation, all samples were permeabilised with PBS containing 0.5% (v/v) Triton X-100 for 5 min at room temperature.
All the permeabilised cells were incubated for 1 h at 37°C in PBS containing 2% BSA and 1:500 FITC anti-RV. After staining with FITC Anti-RV, cells were washed three times and all the cells were incubated for 1 h at 37°C in PBS containing 2% BSA and 1:500 anti-DLP. Cells were again washed and incubated with 1:500 Alexa Fluor 532 (Thermo Fischer Scientific). Cells were extensively washed and detached with StemPro™ Accutase™ (Thermo Fischer Scientific) for 30 min at 37°C before analyses on the BD Accuri C6 Plus instrument.
Statistical Analysis
Each assay was carried out at least in triplicate (biological/independent replicates) on separate days. Each repeat was analysed in duplicate (n = 3). Data are presented as means ± standard error of the mean. For statistical analysis, two-way ANOVA was performed using a Tukey-Kramer test in GraphPad Prism version 3.00 for Windows (GraphPad Software, San Diego, Calif.). In all tests, p < 0.05 was considered statistically significant.
Results
Rotavirus Infection Decreases the Relative Percentage of γ-Linolenic and Arachidonic Acid
During PGE2 biosynthesis, AA is liberated by phospholipase A2 (Kudo and Murakami, 2002), and converted to PGH2, by either COX-1 (in a continuous manner) or COX-2 (in a stimuli-dependent manner; Park et al., 2006). In the final step of PGE2 synthesis, PGH2 is converted to PGE2 by one of three prostaglandin E synthetases (Figure 1A). Arachidonic acid can also be synthesized in cells by the addition of two-carbons to GLA, to form dihomo-γ-linolenic acid, followed by the introduction of a double bond (Lagarde et al., 2013; Figure 1A). As expected, it was found that GLA supplementation of MA104 cells causes a significant increase in the relative percentages of GLA and AA in the neutral (p = 0.004; p = 0.0042, respectively; Figure 1B) and phospholipid fractions (p = 0.026; p = 0.016, respectively; Figure 1C). Interestingly, when both the unsupplemented and supplemented MA104 cells were infected with SA11, the relative percentages of both GLA and AA were significantly reduced in both fractions (p = 0.04; p = 0.0028, respectively), compared to the uninfected cells. The phenomenon is more pronounced in the phospholipid fraction with an 8× decrease compared to a 3× decrease in neutral lipid fraction.
FIGURE 1
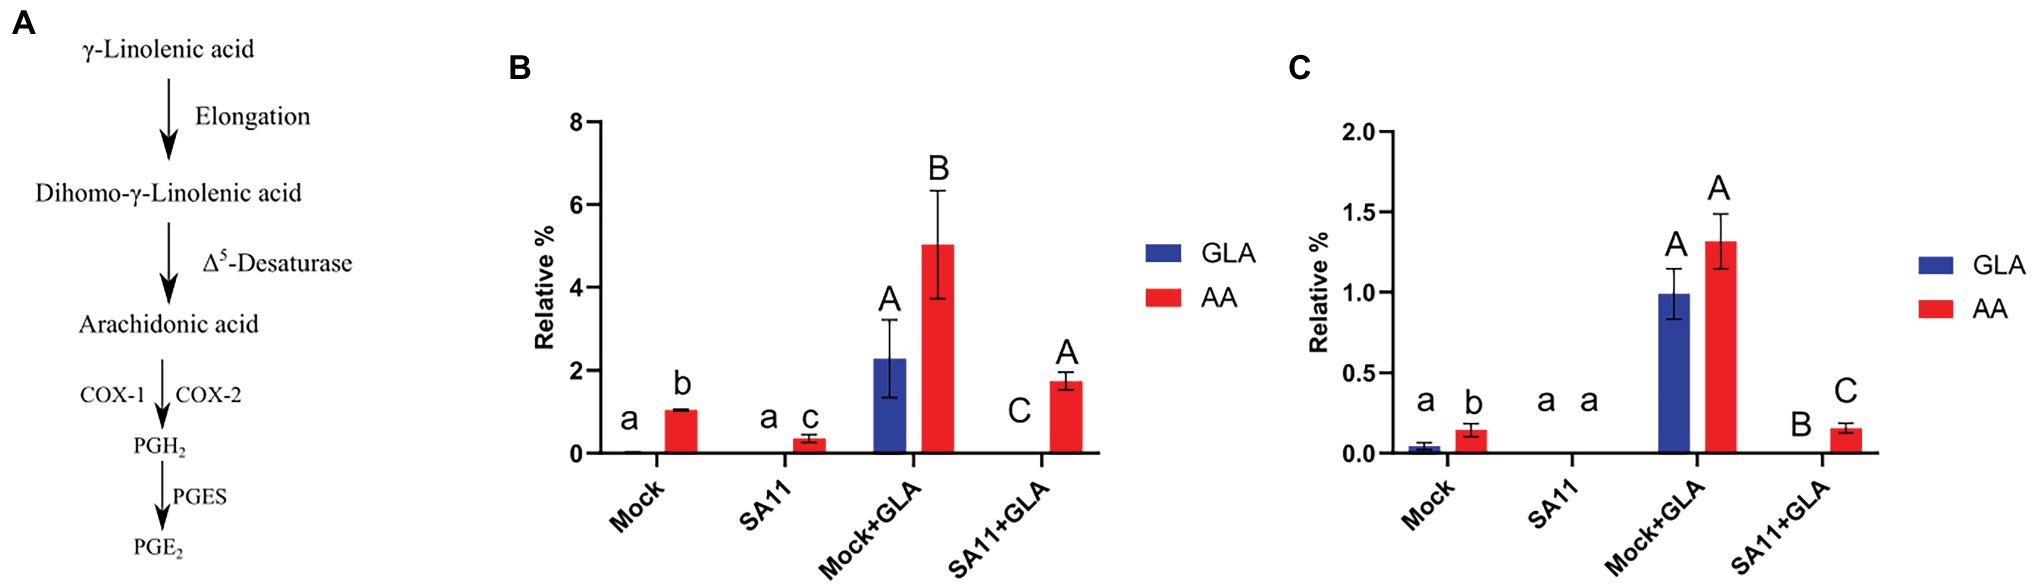
Figure 1. Conversion of GLA to AA at 16 h post-infection. (A) γ-Linolenic acid (GLA) is converted to dihomo-γ-linolenic acid by elongases which is subsequently converted to arachidonic acid (AA) via Δ5-desaturase. Finally, AA is converted to PGE2 by either COX-1/2 and PGES (Funk, 2001). (B) The effect of rotavirus on the relative percentage of GLA (blue) and AA (red) in the neutral lipid fraction (B) and phospholipid fraction (C) was evaluated in unsupplemented (mock; SA11) and supplemented (mock + GLA; SA11 + GLA) MA104 cells. Error bars indicate the standard error of the mean (n = 3). Lowercase and uppercase letters indicate a significant difference (p < 0.05) compared to the control. Cyclooxygenases (COX1/2), prostaglandin E2 synthase (PGES); and prostaglandin E2 (PGE2).
Rotavirus Infection Stimulates PGE2 Production in a Dose-Dependent Manner
The decrease in both the relative percentages of GLA and AA in GLA-supplemented, infected cells could possibly be due to the conversion of AA to PGE2, which is rapidly produced in response to stimuli (Berenbaum, 2000). Therefore, the concentration of PGE2 produced by cells during viral infection was determined. The supplementation of MA104 cells with GLA in the absence of virus caused an increase in PGE2, as measured by ELISA, at both 2 and 4 h post-infection, indicating a shift in the baseline production of PGE2 in GLA-supplemented cells (Figure 2). Rotavirus infection of unsupplemented cells also caused a significant increase in PGE2 production at both time points (p = 0.00004; p = 0.00008, respectively). It should also be noted that the concentration of PGE2 increased from 2 to 4 h post-infection regardless of supplementation, but the effect is more significant in supplemented MA104 cells (increase of ~38 pg/ml vs. ~18.5 pg/ml increase in unsupplemented cells; p = 0.047).
FIGURE 2
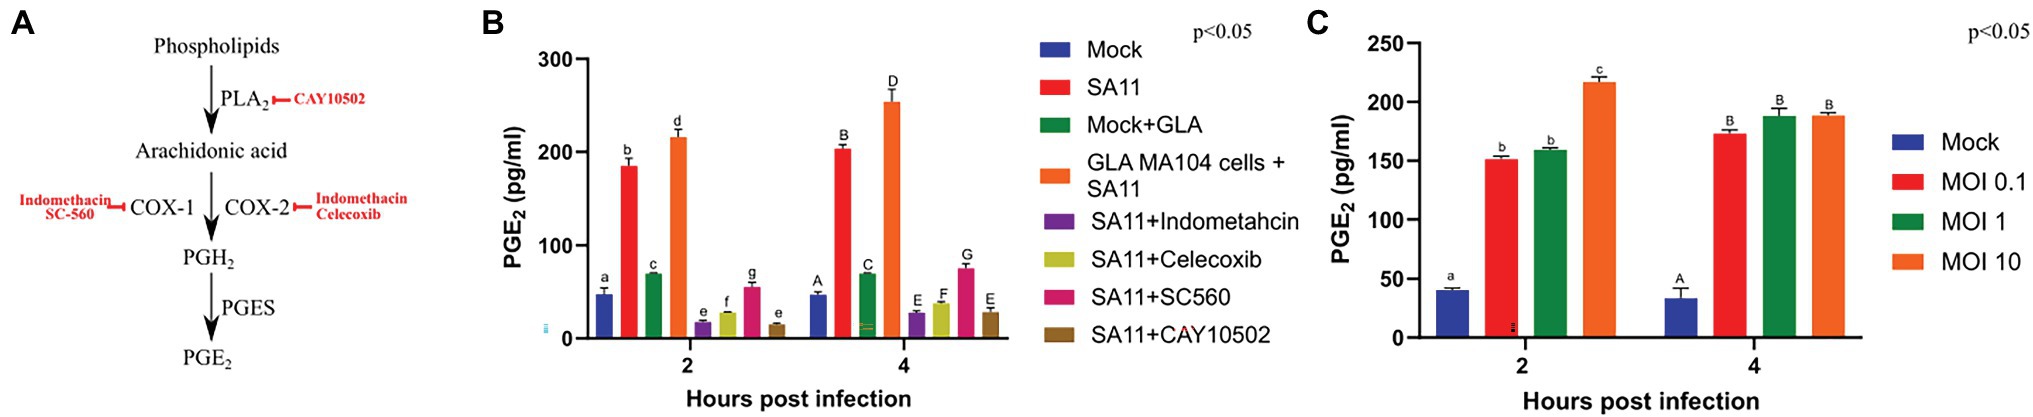
Figure 2. Rotavirus increases the concentration of prostaglandin E2 in MA104 cells in a dose- and time-dependent manner. (A) CAY10502 inhibits the releases of AA from phospholipids, while indomethacin non-specifically inhibits both COX-1 and COX-2. In contrast, SC-560 specifically inhibits COX-1 and celecoxib specifically inhibits COX-2. (B) The amount of PGE2 produced during rotavirus (SA11) infection (MOI = 5) as determined by ELISA was compared to uninfected MA104 cells (mock), in the presence and absence of GLA and inhibitors of the PGE2-biosynthetic pathway at 2 and 4 h post-infection. (C) The amount of PGE2 produced at increasing multiplicities of infection (MOI) at 2 and 4 h post-infection. Error bars indicate the standard error of the mean (n = 3). Lowercase and uppercase letters indicate a significant difference (p < 0.05) compared to the control. Cyclooxygenases (COX1/2), phospholipaseA2 (PLA2), prostaglandin E2 synthase (PGES); and prostaglandin E2 (PGE2).
Figure 2A indicates where each of the inhibitors act in the PGE2 biosynthesis pathway. Treatment of infected MA104 cells with inhibitors of PGE2 biosynthesis decreased the levels on PGE2, with the indomethacin (p = 0.0008) and CAY10502 (p = 0.0004) having the biggest effect followed by celecoxib (p = 0.00009) and SC560 (p = 0.0007; Figure 2B). To evaluate if PGE2 production is viral load dependent, PGE2 production was evaluated at different MOIs using ELISA (Figure 2C). The production of PGE2 by mock-infected cells remained constant from 2 to 4 h post-infection, while there was a steady increase in the amount of PGE2 produced in cells infected at a MOI of 0.1 and 1. Interestingly, the production of PGE2 increased rapidly in cells infected with a MOI of 10, appearing to peak at 2 h post-infection. The difference in PGE2 levels at different MOIs shows that SA11 modulates PGE2 concentration in a time- and viral dose-dependent manner. Chromatograms obtained from LC-MS/MS showed that all five transitions of PGE2 were present in all the infected samples, thus authenticating its presence (Supplementary Figure S2). The discrepancy between ELISA and LC-MS/MS data for the mock control could be due to the ability of the ELISA to cross-react with PGE2-ethanolamide and/or PGE2-1-glycerylester or the inherently low concentration of PGE2 in unstimulated cells (Funk, 2001). In addition, the discrepancy could also be attributed to the higher sensitivity of the ELISA compared to LC-MS.
Prostaglandin E2 and Rotavirus Co-localise
Lipid droplets are known sites for PGE2 synthesis (Accioly et al., 2008; Bozza et al., 2011) and RV viroplasms are known to associate with LDs (Cheung et al., 2010). Therefore, to assess if there is co-localisation between viroplasms and PGE2, we targeted NSP5 and NSP2 to visualise viroplasms. Both anti-NSP2 and anti-NSP5 antibodies were able to independently detect viroplasms (Figures 3B,C). As expected, cells treated with indomethacin showed no co-localisation due to reduced PGE2 production (Figure 3D). Indomethacin is a non-specific inhibitor of both COX-1 and COX-2 (Mitchell et al., 1993) and is included in the EicosaCell procedure as negative control to inhibit PGE2 production (Bandeira-Melo et al., 2011). Co-localisation, albeit at a relative low level, was observed 2 h post-infection in both unsupplemented (Figure 3E) and GLA-supplemented cells (Figure 3F). This observation is confirmed by the Pearson:Pearson correlation coefficient (0.40; Figure 3). An increase in co-localisation was observed 4 h post-infection (Figures 3G,H) with the Pearson:Pearson correlation coefficient reaching a maximum of 0.81 (Figure 3).
FIGURE 3
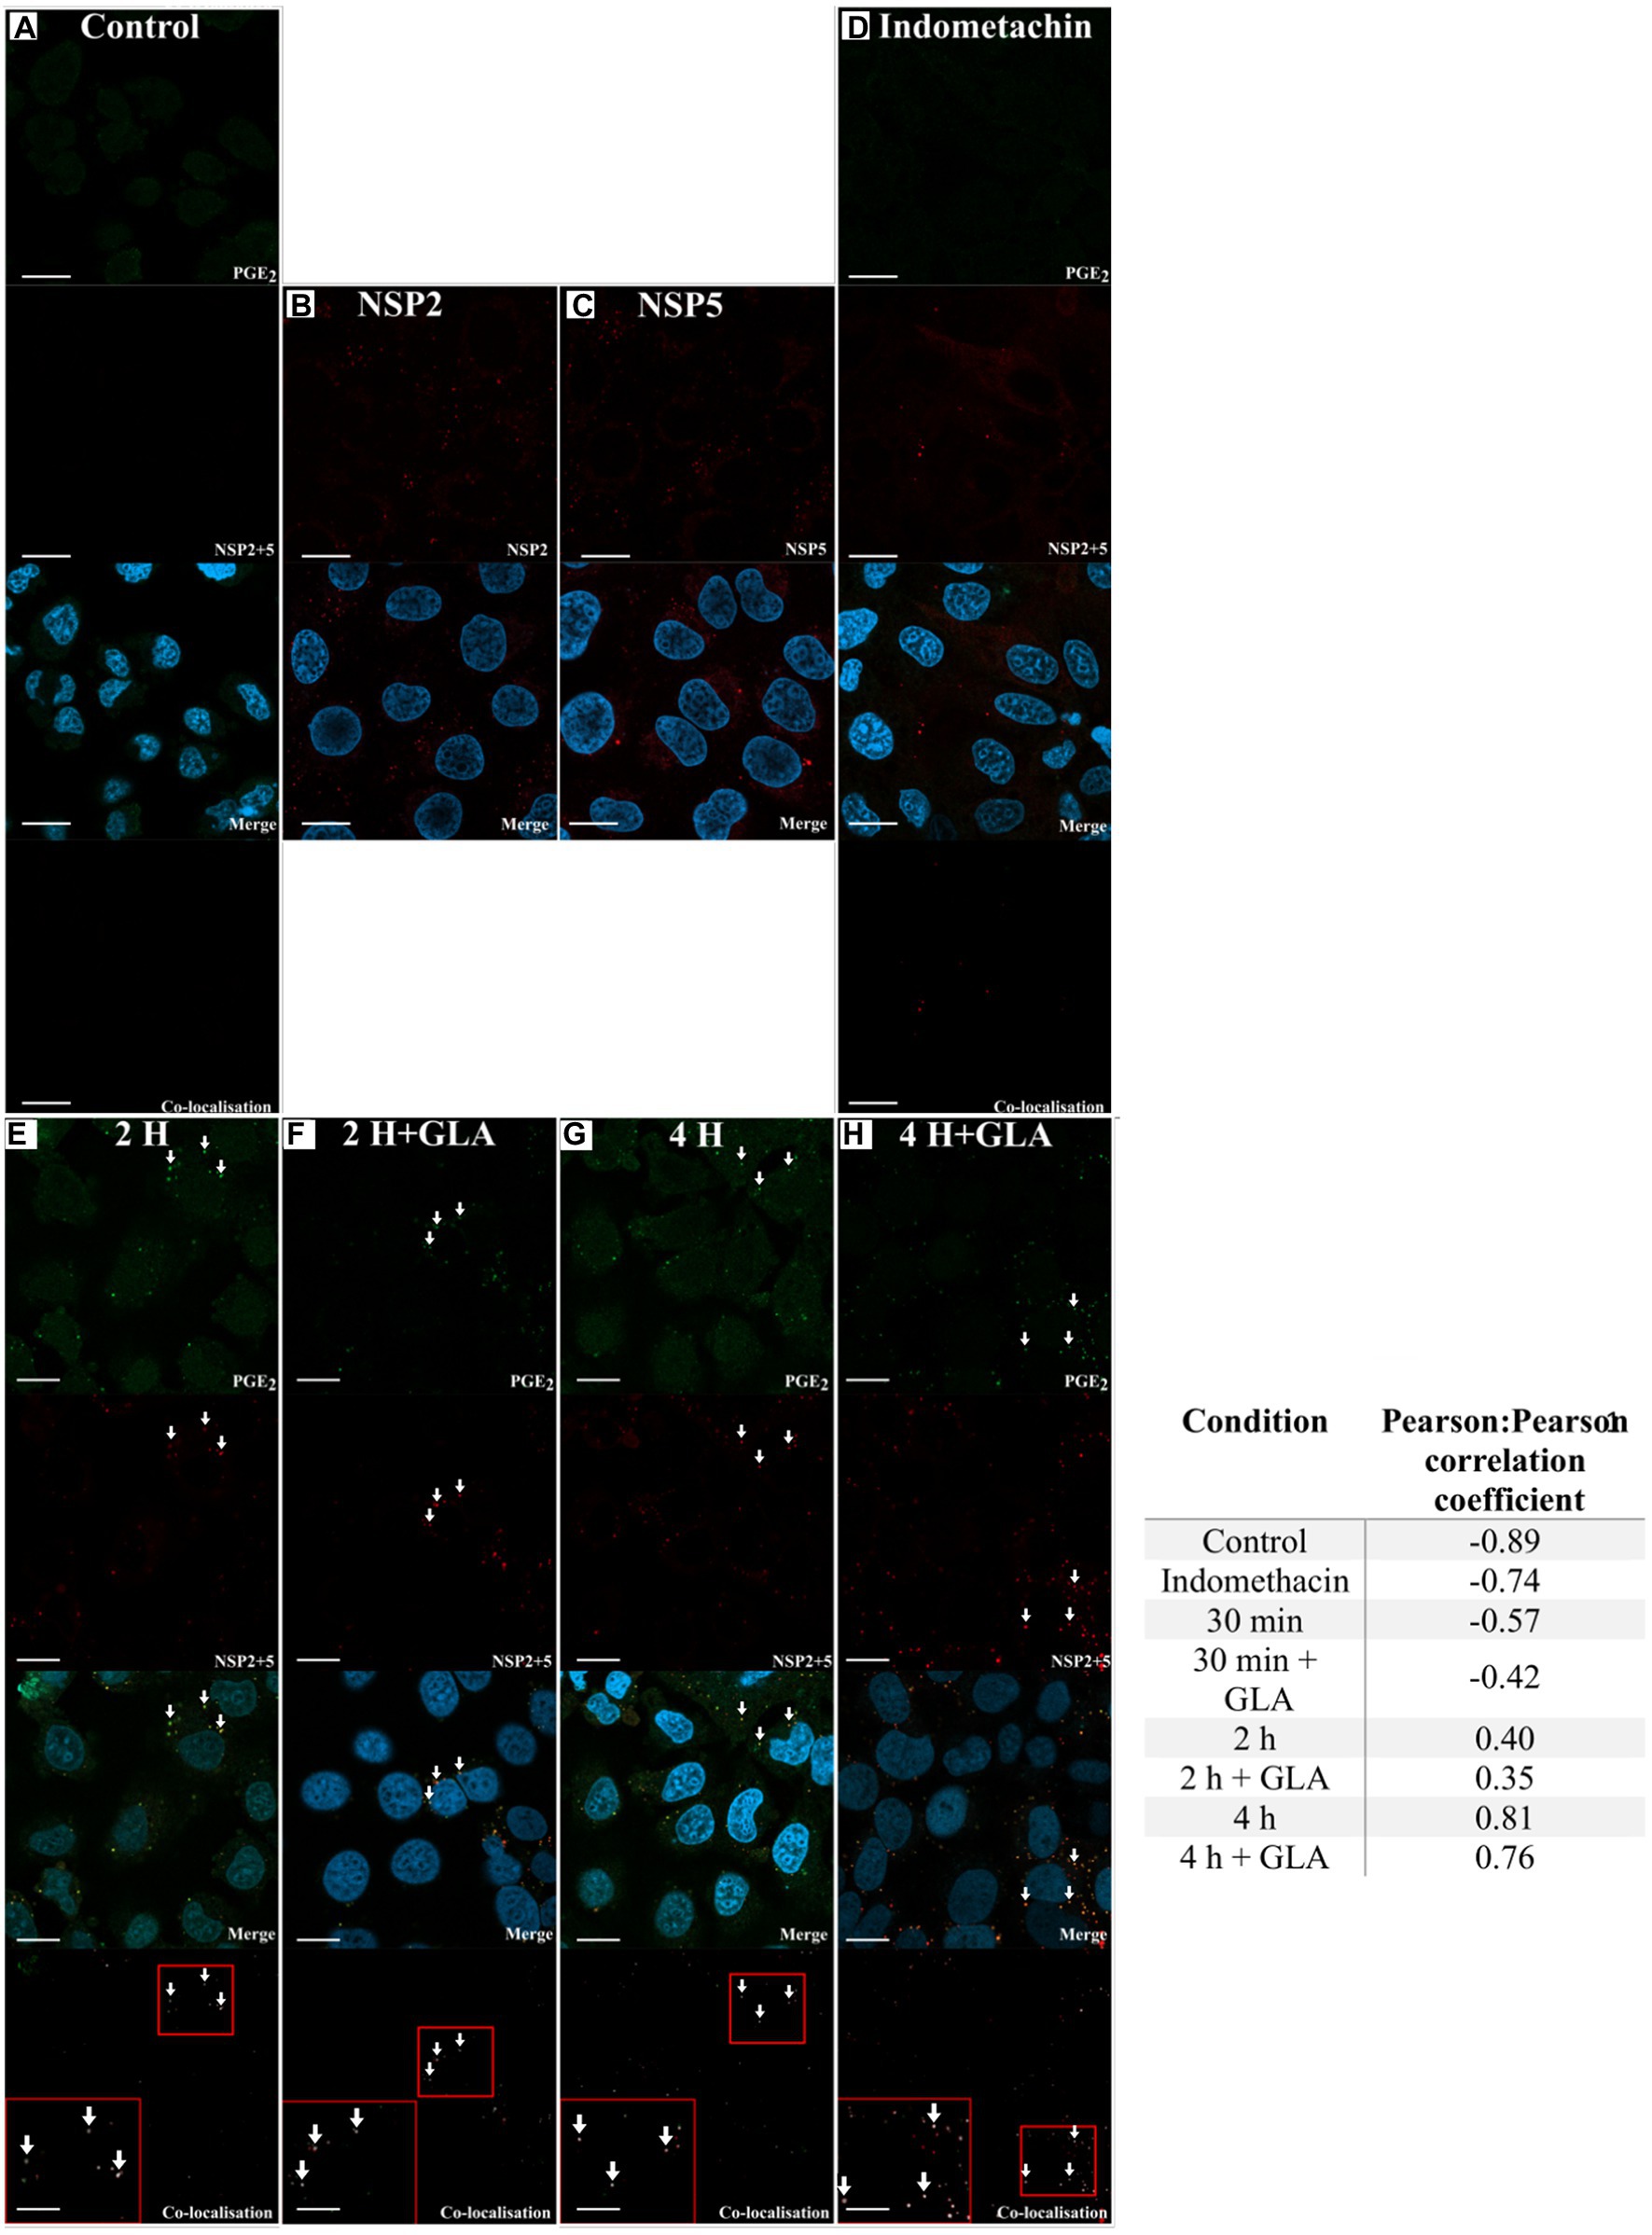
Figure 3. Laser scanning microscopy images showing co-localisation between RV and PGE2. The presence of co-localisation (white arrows) between PGE2 (green) and RV NSP2 and NSP5 (red) was evaluated using Coloc2 in ImageJ. Blue DAPI-staining indicates cell nuclei. (A) The no-virus control showed no detection of RV. The ability of the (B) anti-NSP2 and (C) anti-NSP5 antibodies to detect RV was independently assessed. (D) The required inclusion of indomethacin shows no detection of PGE2. After 2 h post-infection, NSP2 and NSP5 were detected in both (E) GLA unsupplemented and (F) supplemented cells, with co-localisation with PGE2 first detected as suggested in the merge and confirmed in the co-localisation panels. Co-localisation increases at 4 h post-infection both in the (G) absence or (H) presence of GLA. Small red squares in the co-localisation panels indicate the area that was magnified and shown in the large red square in the same panel. Pearson:Pearson correlation coefficients of confocal microscopy images as determined by ImageJ are shown in the adjacent table (Schneider et al., 2012). Values close to −1 indicate no co-localisation with values close to 0 indicating random co-localisation, while values close to 1 indicate co-localisation with a high degree of certainty. Prostaglandin E2(PGE2). White arrows indicate co-localisation. Scale bar 10 μM.
Rotavirus Replication Is Enhanced by Changes in Cellular Lipids
In order to determine if the modulation of AA and GLA and the subsequent increase in PGE2 had any effect on viral replication, we employed replication kinetics to determine the effect of GLA supplementation on the replication of SA11. The supplementation of MA104 cells with GLA increased the viral yield at 30 min (Figure 4A). This initial effect caused an approximate 1 log increase in the overall viral yield after the 16-h period, compared to the unsupplemented MA104 cells. The addition of several PGE2 biosynthetic inhibitors affected the yield of SA11 during the 16-h period (Figure 4B). Treatment of MA104 cells with indomethacin (non-specific COX inhibitor) caused the largest decrease in viral yield at 30 min, followed by CAY10502 (cPLA2 inhibitor), celecoxib (COX-2-specific inhibitor) and SC-560 (COX-1-specific inhibitor). The rate of replication between different time points is shown in Figure 4C. Interestingly, the supplementation of MA104 cells with GLA only increased the rate of replication significantly between 2 and 8 h post-infection, while the rate of replication remained comparable to the control at 30 min to 2 h as well as between 8 and 16 h post-infection. Similarly, the treatment of MA104 cells with PGE2 biosynthesis inhibitors significantly decreased the rate of replication between 30 min to 2 h, while no significant difference was observed at the other time points.
FIGURE 4
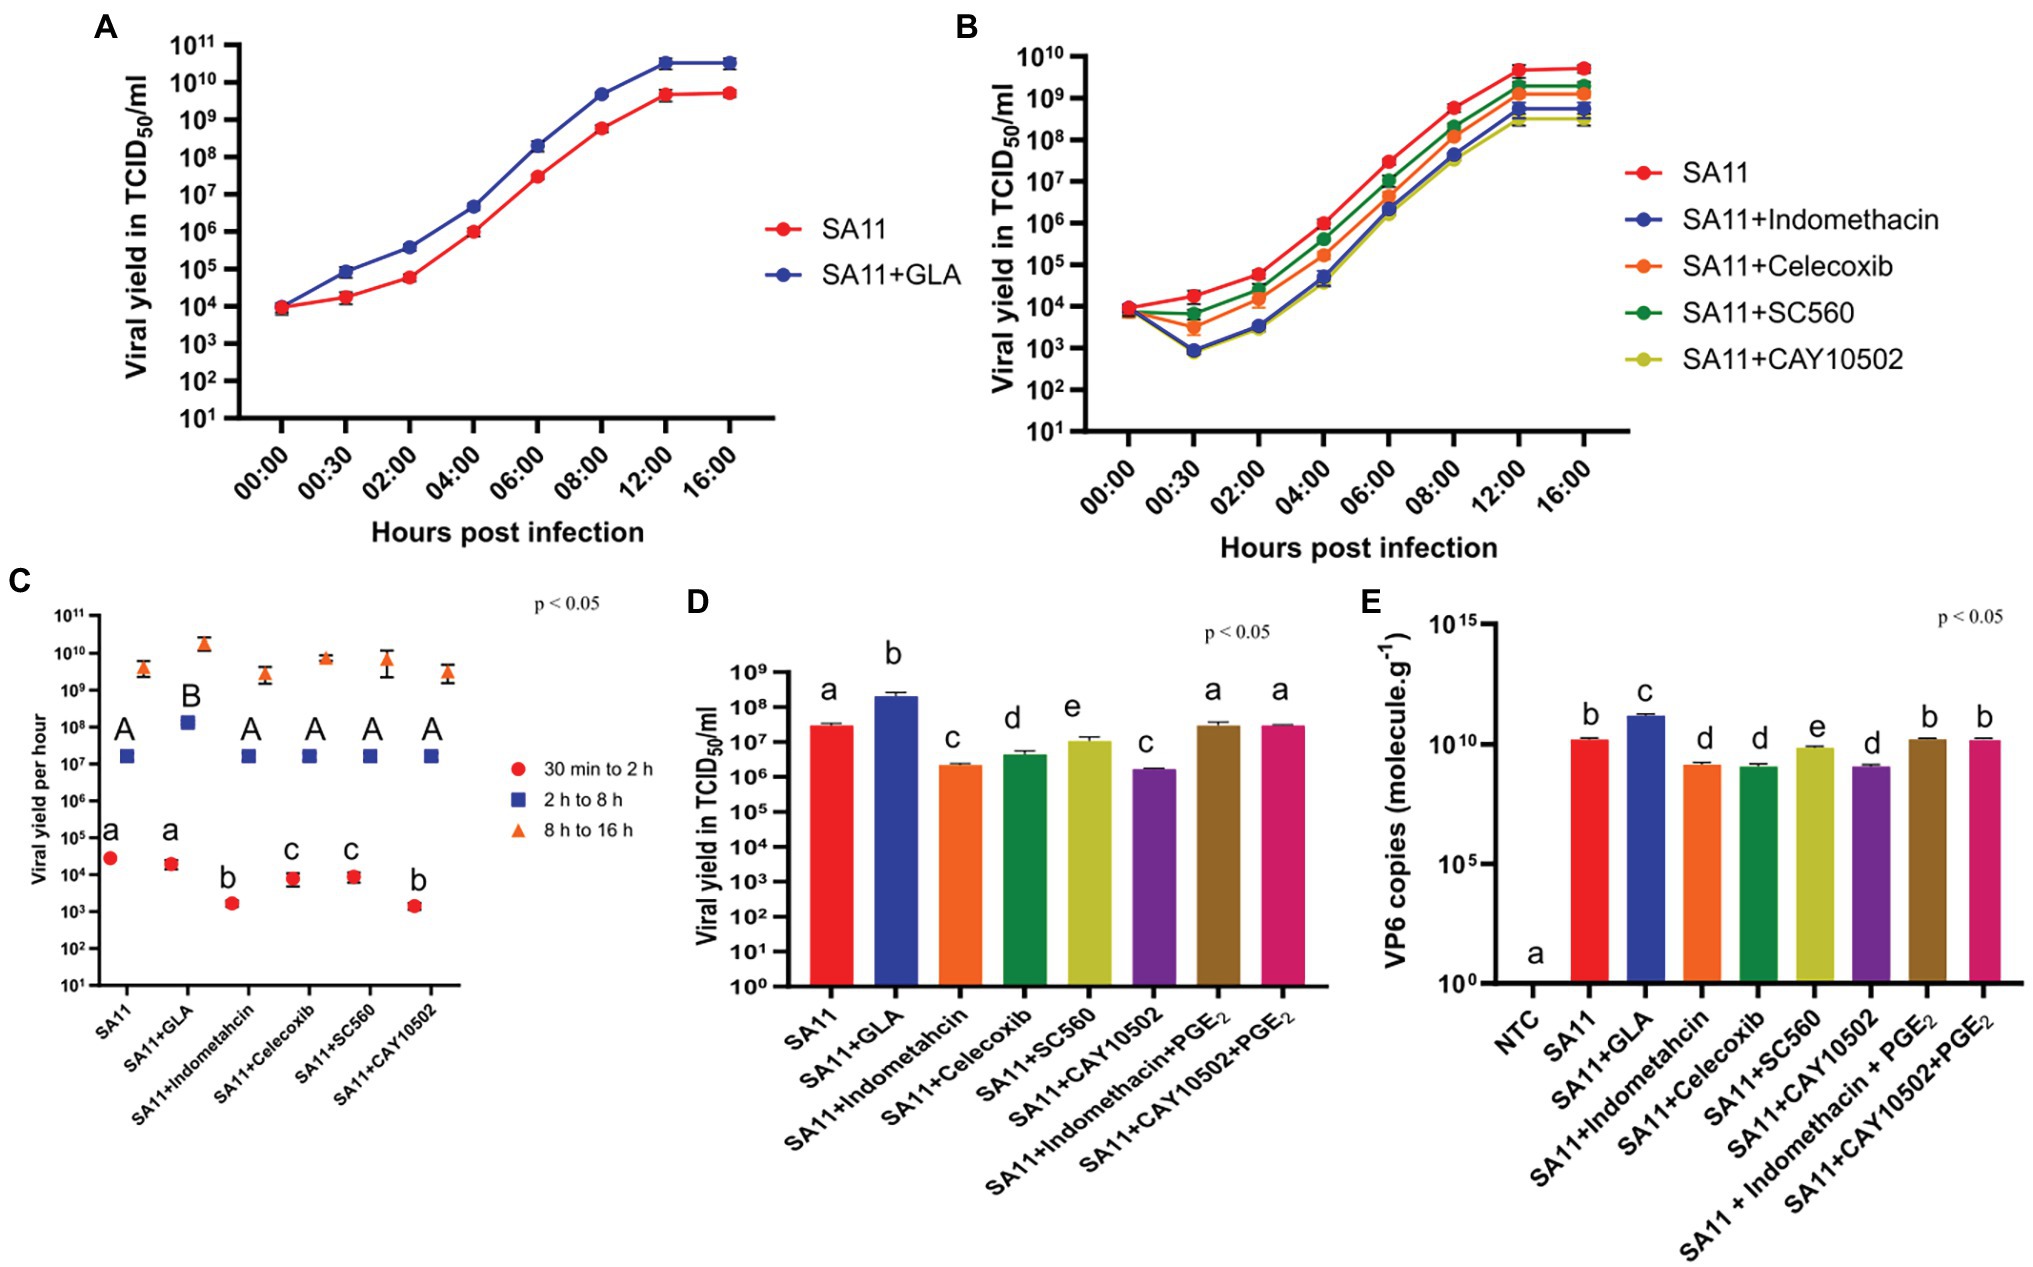
Figure 4. GLA supplementation and treatment with inhibitors of PGE2 biosynthesis affect RV replication. (A) Rotavirus yield determined by TCID50 was compared to SA11-infected MA104 cells, in the presence and absence of GLA and (B) inhibitors of the PGE2-biosynthetic pathway at several time points post-infection. (C) The replication rate of rotavirus as determined by calculating the slope between 30 min and 2 h (red), 2 h and 8 h (blue) or 8 h and 16 h (orange), was compared to SA11-infected MA104 cells, in the presence and absence of GLA and inhibitors of the PGE2-biosynthetic pathway. (D) Rotavirus yield as determined by TCID50 and (E) copy number of VP6 as determined by RT-qPCR was compared to SA11-infected MA104 cells, in the presence and absence of GLA and inhibitors of the PGE2-biosynthetic pathway at 6 h post-infection. Error bars indicate the standard error of the mean (n = 3). Lowercase and uppercase letters indicate significant difference (p < 0.05) compared to the control.
To ensure that the effect of the inhibitors on viral yield was due to their inhibitory effect on PGE2 biosynthesis, viral yield was determined with indomethacin in the presence of 0.1 μM PGE2 at 6 h post-infection (Figure 4D). In addition, RNA production was determined with RT-qPCR, targeting the genome segment encoding VP6, and calculating the relative copy number in GLA-supplemented MA104 cells and in cells treated with the different PGE2 biosynthesis inhibitors (Figure 4E). GLA supplementation of MA104 cells and subsequent infection with SA11 significantly increased both viral yield and the copy number of the VP6 genome segment. In contrast, treatment of SA11 infected MA104 cells with COX inhibitors significantly decreased the viral yield and copies of the VP6 genome segment. The viral yield was most affected by indomethacin and CAY10502, followed by celecoxib and SC-560. Interestingly, indomethacin, CAY10502 and celecoxib appear to have the same decreasing effect on the copy number of the VP6 genome segment, while SC-560 has the least potent effect. The addition of PGE2 to MA104 cells treated with indomethacin or CAY10502, restored both the viral yield and copies of VP6 to control levels, indicating that PGE2 is important for SA11 replication in MA104 cells.
Cyclooxygenase Inhibition and GLA Supplementation Affect Rotavirus Internalisation
Due to the effect of GLA supplementation and inhibition of PGE2 biosynthesis observed during the initial stages on SA11 replication, we used flow cytometry to determine if PGE2 and GLA supplementation play a role during the attachment and/or internalisation of SA11. Figure 5A shows the principle of the internalisation and attachment assay. Briefly, RV was allowed to cold-bind to MA104 cells. The virus was then subsequently tagged with anti-RV-FITC, which detects the outer capsid protein VP7, indicating the percentage of attached virus. When RV is internalised and released from the endosomes, the shedding of the outer layer exposes VP6 and allows for tagging with anti-DLP (targeting the outer VP6-layer of the DLP) and Alexa Fluor 532, quantifying intracellular RV. Internalisation was calculated by dividing relative percentage intracellular RV (30 min + DLP) by relative percentage attached RV (0 min). Results compiled from raw flow cytometry data (Figure 5B) indicate that the supplementation of MA104 cells with GLA had no significant effect (p = 0.067) on SA11 attachment, but the treatment of MA104 cells with indomethacin (p = 0.008) and CAY10502 significantly decreased (p = 0.019) the percentage of attached SA11. The addition of exogenous PGE2 to the inhibitor-treated cells fully restored the percentage of attached SA11. Interestingly, the supplementation of inhibitor-treated cells with GLA only partially restored the percentage of attached SA11, indicating that the amount of PGE2 produced from GLA may not be sufficient to completely restore attachment. Figure 5C shows the amount of RV that was internalised after 30 min. Although the effect of PGE2 inhibition on attachment is significant, the effect on internalisation is much more pronounced (Figure 5D). Treatment of MA104 cells with either indomethacin (p = 0.0014) or CAY10502 (p = 0.003) decreased the percentage of internalised SA11, while the addition of exogenous PGE2 fully restored the percentage of internalised SA11 and GLA supplementation only partially restored the percentage of internalised SA11. This shows a role of PGE2 during both the attachment and internalisation of SA11.
FIGURE 5
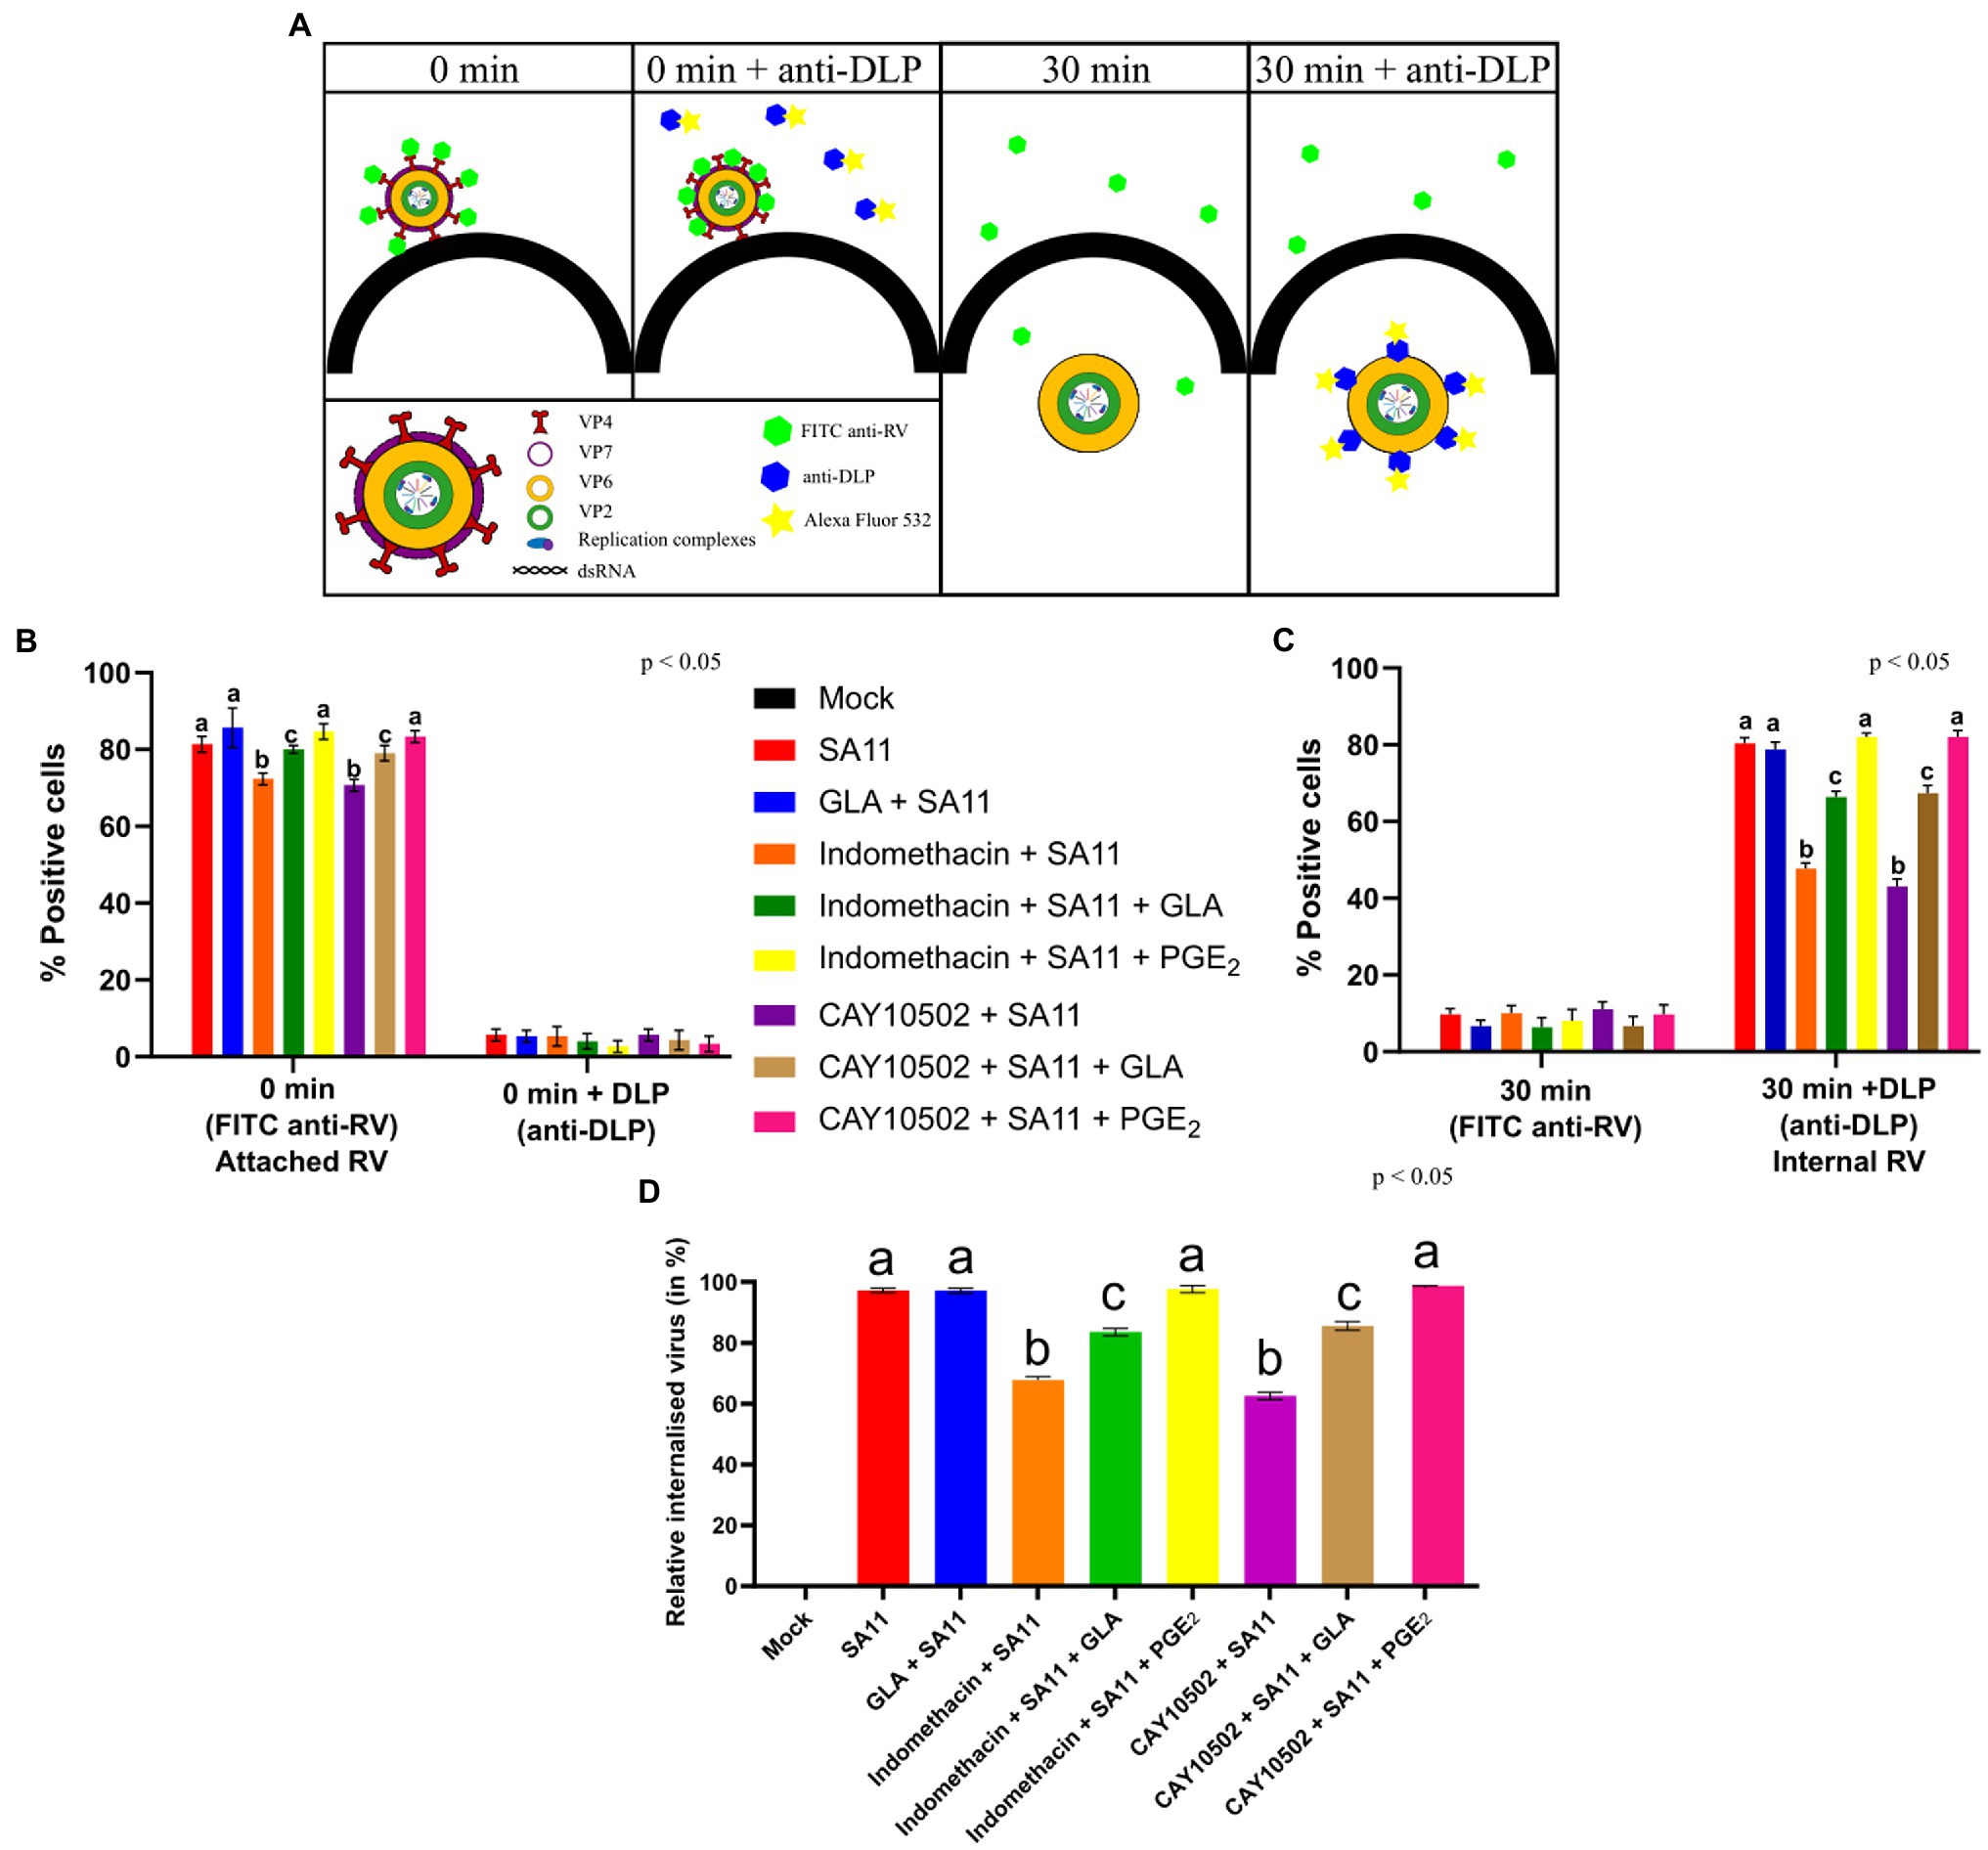
Figure 5. Inhibition of PGE2 biosynthesis affects RV attachment and internalisation. (A) At time zero, RV at an MOI = 10 is cold-bound to MA104 cells and is visualised by anti-RV-FITC labelling, which detected the outer capsid protein VP7. When labelling with anti-double-layered particle (DLP) is applied, virus at the cell surface cannot be detected as the antibodies target the middle-layer protein, VP6, which is only accessible after the outer layer has been shed. Thus, the signal intensity of 0 min + anti-DLP is strongly reduced compared to 0 min + anti-RV due to the inability to detect VP6. When the temperature is increased, RV is internalised and the loss of the outer capsid allows for the detection of VP6, i.e., DLPs, to be accessible for staining. (B) Graph showing a higher positive detection of anti-RV-FITC compared to anti-DLP at 0 min. (C) Graph showing a higher positive detection of anti-DLP compared to anti-RV-FITC at 30 min. (D) Relative percentage of internalised virus from untreated and inhibitor-treated cells at 30 min post-infection is calculated by dividing the relative internalised RV (30 min) (C) by relative attached RV (0 min) (B). Error bars indicate the standard error of the mean (n = 3). Lowercase letters indicate significant differences (p < 0.05) compared to the control.
Discussion
Lipids and in particular LDs are crucial for RV replication, as chemical compounds affecting the integrity of LDs can disrupt viroplasms and subsequently, viral RNA replication and progeny production (Cheung et al., 2010; Crawford and Desselberger, 2016). Previously, it was shown that supplementation of cells with saturated fatty acids increased RV yield (Superti et al., 1995). Furthermore, studies have shown that PGE2 is elevated during both in vitro (Rossen et al., 2004) and in vivo (Zijlstra et al., 1999) RV infection, with the inhibition of PGE2 biosynthesis, decreasing the duration of diarrhoea (Yamashiro et al., 1989).
Viruses have been shown to modulate lipid metabolism, composition and/or signalling to ensure successful viral entry, replication, assembly and/or secretion (Heaton and Randall, 2011). We show that RV depletes both AA and GLA during infection of MA104 cells, indicating the ability of the virus to modulate the metabolism of these cellular fatty acids, leading to increased PGE2 production. Although AA is present in both the neutral lipid and phospholipid fractions of LDs, it is speculated that AA found in the neutral lipid fraction only replenishes the AA levels in the phospholipid fraction when levels are depleted due to eicosanoid production (Bozza et al., 2011). Prostaglandin E2 is the most abundant prostanoid and exerts homeostatic, pro- and, in certain cases, anti-inflammatory effects in host cells (Park et al., 2006). Thus, it is not surprising that PGE2 plays a role in the pathogenesis of several viruses, including human immunodeficient virus, influenza A and herpes simplex virus (Sander et al., 2017). Along with the aforementioned viruses, RV has been shown to increase PGE2 in both in vitro (Rossen et al., 2004) and in vivo studies (Zijlstra et al., 1999), while increased levels of PGE2 have also been found in the stool of children infected with RV (Yamashiro et al., 1989). In these studies, an increase in PGE2 was accompanied by an increase in RV yield as well as severity and longevity of gastroenteritis.
In concurrence with previous studies (Yamashiro et al., 1989; Zijlstra et al., 1999; Rossen et al., 2004), we have also shown that SA11 increases the concentration of PGE2 and that the GLA supplementation of MA104 cells leads to a further increase in the concentration of PGE2. These increases in PGE2 levels are time and viral dose-dependent and coincide with the decrease in AA and GLA during RV infection. Supplementation of MA104 cells with GLA significantly increased the rate of RV replication only between 2 and 8 h post-infection, with no significant effect on the rate of replication early (30 min to 2 h) or late (8–16 h) during infection. This indicates that GLA has no effect on early replication but may play a role later during replication, probably during the formation of viroplasms, as these occur approximately 2 h post-infection (Carreño-Torres et al., 2010), by increasing the amount of LD available as scaffolds (Exner et al., 2019).
It is well known that PGE2 is produced in LDs in response to external stimuli, such as viral infections (Accioly et al., 2008; Bozza et al., 2011). Furthermore, during RV, replication LDs serve as scaffolds for the formation of viroplasms (Cheung et al., 2010). Viroplasms consist of several viral proteins, with NSP2 and NSP5 being essential for their formation. Viroplasms start to form at 2 h post-infection and increase in number as infection progresses (Carreño-Torres et al., 2010; Contin et al., 2010). We show that co-localisation does occur between NSP2 and NSP5 and PGE2 at 2 and 4 h post-infection. Interestingly, we show that co-localisation between NSP2 and NSP5 and PGE2 increases as infection progresses and could be due to an increase in both the number of viroplasms that are formed and the increase in PGE2 levels as shown by ELISA.
The inhibition of COXs has shown that these enzymes are essential during replication of several viruses (Steer and Corbett, 2003). Although, indomethacin is a well-known non-selective inhibitor of COX-1 (IC50 = 1.67 μM) and COX-2 (IC50 = 24.6 μM) it has several off-targets effects including the inhibition of phospholipase A2 (Kaplan et al., 1978). We therefore employed more specific inhibitors for COX-1 (SC-560, IC50 = 9 nM; Smith et al., 1998), COX-2 (celecoxib, IC50 = 5 nM; Uddin et al., 2003) and phospholipase A2 (CAY10502, IC50 = 4.3 nM; Ludwig et al., 2006). It should however be noted that celecoxib has been shown to inhibit several other enzymes, such as carbonic anhydrases (IC50 = 16 nM), phosphoinositide-dependent kinase-1 (IC50 = 48 μM) and sarcoplasmic/ER calcium ATPase (Schönthal, 2007). It is therefore possible that at the concentration of celecoxib (5 μM) used in this study, carbonic anhydrases could also have been inhibited. However, the results for indomethacin and celecoxib correlate with that for the COX-1 (SC-560) and phospholipase A2 (CAY10502) inhibitors. Phospholipase A2 is also the rate-limiting enzyme during the biosynthesis of PGE2 (Funk, 2001). In addition, the effects on RV replication and entry were neutralised when exogenous PGE2 was added. Combined, these results therefore suggest that the inhibition of PGE2 affects RV replication.
Treatment of MA104 cells with inhibitors of PGE2 biosynthesis has detrimental effects on viral yield and on the rate of replication between 30 min and 2 h post-infection. This is in concurrence with Rossen et al. (2004), who determined that RV replication is negatively affected by treatment with PGE2 biosynthesis inhibitors and indicated a role of PGE2 during early RV replication. However, in contrast to their results, showing no effect on total RNA levels from RV NSP4 and VP4 or on the ssRNA and dsRNA derived from VP4, our results show that all the inhibitors had a detrimental effect on the RNA levels of the VP6 genome segment. The discrepancy could be due to differences in experimental procedures used as well as the time point measured. In the current study, purified viral RNA was used in a RT-qPCR analysis, compared to a semiquantitative RT-PCR evaluation of total, single-stranded and double-stranded RNA by Rossen et al. (2004). The authors also determined RNA levels at 15 h post-infection, while we determined RNA levels at 6 h post-infection. The addition of exogenous PGE2 to inhibitor-treated cells restored both the viral yield and RNA levels of VP6. Similar to the findings by Rossen et al. (2004), we show that there is no significant effect of PGE2 biosynthetic inhibitors on late stage (8–16 h) RV replication.
Due to the effect of PGE2 biosynthesis inhibitors during early infection (0 min to 30 min) and in concurrence with data from Rossen et al. (2004), which show that the inhibitors are most potent when added at time point zero, we investigated RV attachment and internalisation in the presence of PGE2 biosynthesis inhibitors and GLA supplementation. We show that the treatment of MA104 cells with inhibitors of PGE2 significantly decreases the amount of RV that is internalised. The effect of early and non-specific inhibition of PGE2 indicates a role for PGE2 during the early phase of SA11 infection. In addition, the significant difference (p < 0.05) in viral yield with cells treated with celecoxib and SC560 possibly indicates a more pronounced role for induced PGE2 (via COX-2), consistent with data from Rossen et al. (2004). While the addition of exogenous PGE2 restored the levels of RV that is internalised, supplementation with GLA only partially restored internalisation. In addition, the supplementation of MA104 cells with GLA does not significantly affect RV attachment, which is in concurrence with Superti et al. (1995) that showed the effect of fatty acid supplementation on viral replication did not affect attachment.
Conclusion
We show that RV can modulate host lipids to the benefit of its replication cycle. The supplementation of MA104 cells with GLA increases the production of PGE2, which in turn enhances RV attachment and internalisation. Exactly how PGE2 affects these early steps in RV replication remains unknown. It is possible that PGE2 promotes Ca2+-mediated epithelial barrier disruption (Martién-Venegas et al., 2006; Rodríguez-Lagunas et al., 2010) or that PGE2 creates a pro-inflammatory environment that benefits viral replication (Sander et al., 2017). Interestingly, Cheng et al. (2015) showed that the internalisation of bovine ephemeral fever virus (BEFV) through clathrin-mediated endocytosis required activation of several pathways, including COX-2-mediated PGE2/Prostaglandin receptors receptor signalling. They showed that BEFV activates the Src-JNK-AP1 and PI3K-Akt-NF-κB signalling pathways, which in turn modulates COX-2 expression and PGE2 production. The binding of PGE2 to G-protein-coupled E-(EP) prostanoid receptors stimulated Src-JNK-AP1 and PI3K-Akt-NF-κB signalling, promoting viral entry. In addition, Kaposi’s sarcoma-associated herpesvirus, human immunodeficiency virus and human T-lymphotropic virus type 1 have all been shown to utilise PGE2/EP receptor-mediated signalling (Dumais et al., 1998; Moriuchi et al., 2001; Paul et al., 2013). Although no direct evidence links RV and PGE2/EP signalling, it is known that RV activates both the JNK-AP1 and PI3K-Akt signalling pathways (Holloway and Coulson, 2006; Soliman et al., 2018). The phosphorylated pPI3K, pAkt and pERK interact with V-ATPase, increasing the proton gradient within endosomes resulting in their acidification and release of RV into the cytoplasm. Furthermore, Holloway and Coulson (2006) showed that the activation of JNK and p38 leads to AP-1-driven transcriptional responses, which can influence RV mRNA levels and replication. It should be noted that the activation of JNK was only observed at 2 and 6 h post-infection in Caco-2 and MA104 cells, respectively. It could thus be possible that the increase in PGE2, during RV infection as observed in this study and others, enhances the internalisation of SA11 by clathrin-mediated endocytosis, as several RV strains use clathrin-mediated endocytosis for entry into host cells (Díaz-Salinas et al., 2013; Arias and López, 2021).
This study highlights the importance of lipid modulation during RV infections and indicates the role that biologically important lipid metabolites can play in viral infections, while also identifying possible anti-viral targets.
Data Availability Statement
The raw data supporting the conclusions of this article will be made available by the authors, without undue reservation.
Author Contributions
WS, CP, and HO: conceptualisation. WS, GK, and AH: methodology, investigation and data curation. WS: writing-original draft preparation. CP, HO, WS, GK, and AH: writing—review and editing. CP and HO: funding acquisition. All authors contributed to the article and approved the submitted version.
Funding
The study was supported by the Poliomyelitis Research Foundation (PRF; 19/17) and the Deutsche Forschungsgemeinschaft (DFG; JO369/5-1) to HO and the National Research Foundation (NRF; 115566) to CP. WS is supported by scholarships from the NRF and PRF.
Conflict of Interest
The authors declare that the research was conducted in the absence of any commercial or financial relationships that could be construed as a potential conflict of interest.
Publisher’s Note
All claims expressed in this article are solely those of the authors and do not necessarily represent those of their affiliated organizations, or those of the publisher, the editors and the reviewers. Any product that may be evaluated in this article, or claim that may be made by its manufacturer, is not guaranteed or endorsed by the publisher.
Acknowledgments
We thank the Microscopy Unit at the University of the Free State for technical support of the CLSM studies, M Nyaga (UFS-NGS Unit) for the use of the Rotorgene Q and M Meiring and WJ Janse Van Rensburg at the Department of Haematology and Cell Biology (UFS) for the use of the BD Accuri C6 Plus. Discussions with Thandoh Gasa were particularly appreciated. Antisera against NSP2 and rotavirus double-layered particles were generously provided by AC Potgieter, Deltamune, South Africa. The authors also thank FH O’Neill for critical reading of the manuscript.
Supplementary Material
The Supplementary Material for this article can be found online at: https://www.frontiersin.org/articles/10.3389/fphys.2022.805565/full#supplementary-material
Supplementary Figure S1 | Cellular toxicity of the inhibitors and DMSO was evaluated with the XTT assay. MA104 cells (4 × 10⁴ cells/ml) were seeded into 96-well plates and allowed to grow to 100% confluence. The inhibitors were added 1 h prior to infection and subsequently every 4 h till the completion of the experiment. (A) All inhibitors were added to MA104 cells containing a final concentration of 1% DMSO to ensure the vehicle had no detrimental effect on the cells. Results indicate that 1% decreases cell viability to approximately 92 ± 3%. (B) Data obtained from the toxicity assays. Concentrations to be used for the different inhibitors were determined as follows: indomethacin 25 μM (84% ± 0.19), celecoxib 5 μM (85% ± 0.85), SC-560 2.5 μM (83% ± 1.5) and CAY10502 25 nM (93% ± 2.8).
Supplementary Figure S2 | Mass spectra showing the five transitions (Multiple reaction monitoring) for each of the samples. Only one transition of PGE2 is present in the mock infections at (A) 2 h and (B) 4 h. All five the transitions of PGE2 are present in cells infected at a MOI 0.1 (C,D) and 1 (E,F) at 2 h (C,E) and 4 h (D,F) post-infection, respectively. Furthermore, all five the transitions of PGE2 are present in cells infected at a MOI of 10 t (G) 2 h and (H) 4 h post-infection. Due to very low signal to noise ratios, the LC-MS/MS data were only used to verify the presence of PGE2. Peaks show the relevant transitions 351.17 > 315.2; 351.17 > 271.2; 351.17 > 333.3; 351.17 > 189.0; and 351.17 > 235.1. Prostaglandin E2 (PGE2).
References
Accioly, M. T., Pacheco, P., Maya-Monteiro, C. M., Carrossini, N., Robbs, B. K., Oliveira, S. S., et al. (2008). Lipid bodies are reservoirs of Cyclooxygenase-2 and sites of prostaglandin-E2 synthesis in colon cancer cells. Cancer Res. 68, 1732–1740. doi: 10.1158/0008-5472.CAN-07-1999
Arias, C. F., and López, S. (2021). Rotavirus cell entry: not so simple after all. Curr. Opin. Virol. 48, 42–48. doi: 10.1016/j.coviro.2021.03.011
Arnold, M., Patton, J. T., and McDonald, S. M. (2009). Culturing, storage, and quantification of rotaviruses. Curr. Protoc. Microbiol. Chapter 15:Unit 15C.3. doi: 10.1002/9780471729259.mc15c03s15
Bandeira-Melo, C., Weller, P. F., and Bozza, P. T. (2011). EicosaCell–an immunofluorescent-based assay to localize newly synthesized eicosanoid lipid mediators at intracellular sites. Methods Mol. Biol. 689, 163–181. doi: 10.1007/978-1-60761-950-5_10
Bartz, R., Li, W.-H., Venables, B., Zehmer, J. K., Roth, M. R., Welti, R., et al. (2007). Lipidomics reveals that adiposomes store ether lipids and mediate phospholipid traffic. J. Lipid Res. 48, 837–847. doi: 10.1194/jlr.M600413-JLR200
Berenbaum, F. (2000). Proinflammatory cytokines, prostaglandins, and the chondrocyte: mechanisms of intracellular activation. Joint Bone Spine 67, 561–564. doi: 10.1016/S1297-319X(00)00212-8
Bossio, D. A., and Scow, K. M. (1998). Impacts of carbon and flooding on soil microbial communities: phospholipid fatty acid profiles and substrate utilization patterns. Microb. Ecol. 35, 265–278. doi: 10.1007/s002489900082
Bozza, P. T., Bakker-Abreu, I., Navarro-Xavier, R. A., and Bandeira-Melo, C. (2011). Lipid body function in eicosanoid synthesis: an update. Prostaglandins Leukot. Essent. Fat. Acids 85, 205–213. doi: 10.1016/j.plefa.2011.04.020
Brink, J. T. R., Fourie, R., Sebolai, O., Albertyn, J., and Pohl, C. (2021). The role of lipid droplets in microbial pathogenesis. J. Med. Microbiol. 70. doi: 10.1099/jmm.0.001383
Caoa, H., Xiaob, L., Park, G., Wang, X., Azimb, A. C., Christman, J. W., et al. (2008). An improved LC-MS-MS method for the quantification of prostaglandins E2 and D2 production in biological fluids. Anal. Biochem. 372, 41–51. doi: 10.1016/j.ab.2007.08.041
Carreño-Torres, J. J., Gutiérrez, M., Arias, C. F., López, S., and Isa, P. (2010). Characterization of viroplasm formation during the early stages of rotavirus infection. Virol. J. 7:350. doi: 10.1186/1743-422X-7-350
Cheng, C. Y., Huang, W. R., Chi, P. I., Chiu, H. C., and Liu, H. J. (2015). Cell entry of bovine ephemeral fever virus requires activation of Src-JNK-AP1 and PI3K-Akt-NF-κB pathways as well as cox-2-mediated PGE2/EP receptor signalling to enhance clathrin-mediated virus endocytosis. Cell. Microbiol. 17, 967–987. doi: 10.1111/cmi.12414
Cheung, W., Gill, M., Esposito, A., Kaminski, C. F., Courousse, N., Chwetzoff, S., et al. (2010). Rotaviruses associate with cellular lipid droplet components to replicate in viroplasms, and compounds disrupting or blocking lipid droplets inhibit viroplasm formation and viral replication. J. Virol. 84, 6782–6798. doi: 10.1128/JVI.01757-09
Contin, R., Arnoldi, F., Campagna, M., and Burrone, O. R. (2010). Rotavirus NSP5 orchestrates recruitment of viroplasmic proteins. J. Gen. Virol. 91, 1782–1793. doi: 10.1099/vir.0.019133-0
Crawford, S. E., and Desselberger, U. (2016). Lipid droplets form complexes with viroplasms and are crucial for rotavirus replication. Curr. Opin. Virol. 19, 11–15. doi: 10.1016/j.coviro.2016.05.008
Díaz-Salinas, M. A., Romero, P., Espinosa, R., Hoshino, Y., López, S., and Arias, C. F. (2013). The spike protein VP4 defines the endocytic pathway used by rotavirus to enter MA104 cells. J. Virol. 87, 1658–1663. doi: 10.1128/JVI.02086-12
Dumais, N., Barbeau, B., Olivier, M., and Tremblay, M. J. (1998). Prostaglandin E2 up-regulates HIV-1 long terminal repeat-driven gene activity in T cells via NF-κB-dependent and -independent signaling pathways. J. Biol. Chem. 273, 27306–27314. doi: 10.1074/jbc.273.42.27306
Estes, M. K., and Greenberg, H. B. (2013). “Rotaviruses,” in Fields in Virology. eds. D. M. Knipe and P. M. Howley (Philadelphia: Lippincott Williams & Wilkins), 1347–1401.
Exner, T., Beretta, C. A., Gao, Q., Afting, C., Romero-Brey, I., Bartenschlager, R., et al. (2019). Lipid droplet quantification based on iterative image processing. J. Lipid Res. 60, 1333–1344. doi: 10.1194/jlr.D092841
Folch, J., Lees, M., and Sloane Stanley, G. H. (1957). A simple method for the isolation and purification of total lipides from animal tissues. J. Biol. Chem. 226, 497–509. doi: 10.1016/S0021-9258(18)64849-5
Funk, C. D. (2001). Prostaglandins and leukotrienes: advances in eicosanoid biology. Science 294, 1871–1875. doi: 10.1126/science.294.5548.1871
Gaunt, E. R., Cheung, W., Richards, J. E., Lever, A., and Desselberger, U. (2013). Inhibition of rotavirus replication by downregulation of fatty acid synthesis. J. Gen. Virol. 94, 1310–1317. doi: 10.1099/vir.0.050146-0
Godfrey, O., Zhang, W., Amponsem-Boateng, C., Bonney Oppong, T., Zhao, Q., and Li, D. (2020). Evidence of rotavirus vaccine impact in sub-Saharan Africa: Systematic review and meta-analysis. PLoS One. 15:e0232113. doi: 10.1371/journal.pone.0232113
Hagbom, M., Sharma, S., Lundgren, O., and Svensson, L. (2012). Towards a human rotavirus disease model. Curr. Opin. Virol. 2, 408–418. doi: 10.1016/j.coviro.2012.05.006
Heaton, N. S., and Randall, G. (2011). Multifaceted roles for lipids in viral infection. Trends Microbiol. 19, 368–375. doi: 10.1016/j.tim.2011.03.007
Holloway, G., and Coulson, B. S. (2006). Rotavirus activates JNK and p38 signaling pathways in intestinal cells, leading to AP-1-driven transcriptional responses and enhanced virus replication. J. Virol. 80, 10624–10633. doi: 10.1128/JVI.00390-06
Jackson, C. L., Walch, L., and Verbavatz, J.-M. (2016). Lipids and their trafficking: an integral part of cellular organization. Dev. Cell 39, 139–153. doi: 10.1016/j.devcel.2016.09.030
Kaplan, L., Weiss, J., and Elsbach, P. (1978). Low concentrations of indomethacin inhibit phospholipase A2 of rabbit polymorphonuclear leukocytes. Proc. Natl. Acad. Sci. U. S. A. 75, 2955–2958. doi: 10.1073/pnas.75.6.2955
Kim, Y., George, D., Prior, A. M., Prasain, K., Hao, S., Le, D. D., et al. (2012). Novel triacsin C analogs as potential antivirals against rotavirus infections. Eur. J. Med. Chem. 50, 311–318. doi: 10.1016/j.ejmech.2012.02.010
Kudo, I., and Murakami, M. (2002). Phospholipase A2 enzymes. Prostaglandins Other Lipid Mediat. 68–69, 3–58. doi: 10.1016/S0090-6980(02)00020-5
Lagarde, M., Bernoud-Hubac, N., Calzada, C., Véricel, E., and Guichardant, M. (2013). Lipidomics of essential fatty acids and oxygenated metabolites. Mol. Nutr. Food Res. 57, 1347–1358. doi: 10.1002/mnfr.201200828
Ludwig, J., Bovens, S., Brauch, C., Elfringhoff, A. S., and Lehr, M. (2006). Design and synthesis of 1-indol-1-yl-propan-2-ones as inhibitors of human cytosolic phospholipase A2α. J. Med. Chem. 49, 2611–2620. doi: 10.1021/JM051243A/SUPPL_FILE/JM051243ASI20060301_113316.PDF
Martién-Venegas, R., Roig-Peérez, S., Ferrer, R., and Moreno, J. J. (2006). Arachidonic acid cascade and epithelial barrier function during Caco-2 cell differentiation. J. Lipid Res. 47, 1416–1423. doi: 10.1194/jlr.M500564-JLR200
Mitchell, J. A., Akarasereenont, P., Thiemermann, C., Flower, R. J., and Vane, J. R. (1993). Selectivity of nonsteroidal antiinflammatory drugs as inhibitors of constitutive and inducible cyclooxygenase. Proc. Natl. Acad. Sci. U. S. A. 90, 11693–11697. doi: 10.1073/pnas.90.24.11693
Mlera, L., O’Neill, H. G., Jere, K. C., and van Dijk, A. (2013). Whole-genome consensus sequence analysis of a South African rotavirus SA11 sample reveals a mixed infection with two close derivatives of the SA11-H96 strain. Arch. Virol. 158, 1021–1030. doi: 10.1007/s00705-012-1559-5
Monson, E. A., Trenerry, A. M., Laws, J. L., Mackenzie, J. M., and Helbig, K. J. (2021). Lipid droplets and lipid mediators in viral infection and immunity. FEMS Microbiol. Rev. 45, 1–20. doi: 10.1093/femsre/fuaa066
Moriuchi, M., Inoue, H., and Moriuchi, H. (2001). Reciprocal interactions between human T-Lymphotropic virus type 1 and prostaglandins: implications for viral transmission. J. Virol. 75, 192–198. doi: 10.1128/JVI.75.1.192-198.2001
Papa, G., Borodavka, A., and Desselberger, U. (2021). Viroplasms: assembly and functions of rotavirus replication factories. Viruses 13:1349. doi: 10.3390/v13071349
Park, J. Y., Pillinger, M. H., and Abramson, S. B. (2006). Prostaglandin E2 synthesis and secretion: the role of PGE2 synthases. Clin. Immunol. 119, 229–240. doi: 10.1016/j.clim.2006.01.016
Paul, A. G., Chandran, B., and Sharma-Walia, N. (2013). Cyclooxygenase-2-prostaglandin e2-eicosanoid receptor inflammatory axis: a key player in Kaposi’s sarcoma-associated herpes virus associated malignancies. Transl. Res. 162, 77–92. doi: 10.1016/j.trsl.2013.03.004
Phipps, R. P., Stein, S. H., and Roper, R. L. (1991). A new view of prostaglandin E regulation of the immune response. Immunol. Today 12, 349–352. doi: 10.1016/0167-5699(91)90064-Z
Pohl, M. O., and Stertz, S. (2015). Measuring attachment and internalization of influenza A virus in A549 cells by flow cytometry. J. Vis. Exp. 53372:e53372. doi: 10.3791/53372
Reed, L. J., and Muench, H. (1938). A simple method of estimating fifty per cent endpoints. Am. J. Hyg. 27, 493–497. doi: 10.1093/oxfordjournals.aje.a118408
Ricciotti, E., and FitzGerald, G. A. (2011). Prostaglandins and inflammation. Arterioscler. Thromb. Vasc. Biol. 31, 986–1000. doi: 10.1161/ATVBAHA.110.207449
Rodríguez-Lagunas, M. J., Martín-Venegas, R., Moreno, J. J., and Ferrer, R. (2010). PGE 2 promotes Ca 2+ −mediated epithelial barrier disruption through EP 1 and EP 4 receptors in Caco-2 cell monolayers. Am. J. Physiol. Cell Physiol. 299, C324–C334. doi: 10.1152/ajpcell.00397.2009
Rossen, J. W. A., Bouma, J., Raatgeep, R. H. C., Büller, H. A., and Einerhand, A. W. C. (2004). Inhibition of cyclooxygenase activity reduces rotavirus infection at a postbinding step. J. Virol. 78, 9721–9730. doi: 10.1128/JVI.78.18.9721-9730.2004
Sander, W. J., O’Neill, H. G., and Pohl, C. H. (2017). Prostaglandin E2 as a modulator of viral infections. Front. Physiol. 8:89. doi: 10.3389/fphys.2017.00089
Schneider, C. A., Rasband, W. S., and Eliceiri, K. W. (2012). NIH image to ImageJ: 25 years of image analysis. Nat. Methods 9, 671–675. doi: 10.1038/nmeth.2089
Schönthal, A. H. (2007). Direct non-cyclooxygenase-2 targets of celecoxib and their potential relevance for cancer therapy. Br. J. Cancer 97, 1465–1468. doi: 10.1038/sj.bjc.6604049
Smith, C. J., Zhang, Y., Koboldt, C. M., Muhammad, J., Zweifel, B. S., Shaffer, A., et al. (1998). Pharmacological analysis of cyclooxygenase-1 in inflammation. Proc. Natl. Acad. Sci. U. S. A. 95, 13313–13318. doi: 10.1073/pnas.95.22.13313
Soliman, M., Seo, J.-Y., Kim, D.-S., Kim, J.-Y., Park, J.-G., Alfajaro, M. M., et al. (2018). Activation of PI3K, Akt, and ERK during early rotavirus infection leads to V-ATPase-dependent endosomal acidification required for uncoating. PLoS Pathog. 14:e1006820. doi: 10.1371/journal.ppat.1006820
Steer, S. A., and Corbett, J. A. (2003). The role and regulation of COX-2 during viral infection. Viral Immunol. 16, 447–460. doi: 10.1089/088282403771926283
Superti, F., Marziano, M. L., Donelli, G., Marchetti, M., and Seganti, L. (1995). Enhancement of rotavirus infectivity by saturated fatty acids. Comp. Immunol. Microbiol. Infect. Dis. 18, 129–135. doi: 10.1016/0147-9571(95)98854-B
Tanaka, T., Morishige, J. I., Takimoto, T., Takai, Y., and Satouchi, K. (2001). Metabolic characterization of sciadonic acid (5c,11c,14c-eicosatrienoic acid) as an effective substitute for arachidonate of phosphatidylinositol. Eur. J. Biochem. 268, 4928–4939. doi: 10.1046/j.0014-2956.2001.02423.x
Uddin, M. J., Rao, P. N. P., and Knaus, E. E. (2003). Design and synthesis of novel celecoxib analogues as selective cyclooxygenase-2 (COX-2) inhibitors: replacement of the sulfonamide pharmacophore by a sulfonylazide bioisostere. Bioorg. Med. Chem. 11, 5273–5280. doi: 10.1016/j.bmc.2003.07.005
Walther, T. C., Chung, J., and Farese, R. V. (2017). Lipid droplet biogenesis. Annu. Rev. Cell Dev. Biol. 33, 491–510. doi: 10.1146/annurev-cellbio-100616-060608
Yamashiro, Y., Shimizu, T., Oguchi, T., and Sato, M. (1989). Prostaglandins in the plasma and stool of children with rotavirus gastroenteritis. J. Pediatr. Gastroenterol. Nutr. 9, 322–327. doi: 10.1097/00005176-198910000-00010
Keywords: rotavirus, viroplasm, prostaglandin E2, fatty acid supplementation, internalisation, attachment, lipid droplets
Citation: Sander WJ, Kemp G, Hugo A, Pohl CH and O’Neill HG (2022) Rotavirus-Mediated Prostaglandin E2 Production in MA104 Cells Promotes Virus Attachment and Internalisation, Resulting in an Increased Viral Load. Front. Physiol. 13:805565. doi: 10.3389/fphys.2022.805565
Edited by:
Luigi Iuliano, Sapienza University of Rome, ItalyReviewed by:
Scott Matthew Laster, North Carolina State University, United StatesIrene Meester, University of Monterrey, Mexico
Copyright © 2022 Sander, Kemp, Hugo, Pohl and O’Neill. This is an open-access article distributed under the terms of the Creative Commons Attribution License (CC BY). The use, distribution or reproduction in other forums is permitted, provided the original author(s) and the copyright owner(s) are credited and that the original publication in this journal is cited, in accordance with accepted academic practice. No use, distribution or reproduction is permitted which does not comply with these terms.
*Correspondence: Hester G. O’Neill, oneillhg@ufs.ac.za