
94% of researchers rate our articles as excellent or good
Learn more about the work of our research integrity team to safeguard the quality of each article we publish.
Find out more
ORIGINAL RESEARCH article
Front. Physiol., 09 January 2023
Sec. Computational Physiology and Medicine
Volume 13 - 2022 | https://doi.org/10.3389/fphys.2022.1037417
 Byeong J. Chun1*Surya P. Aryal2Peter Varughese1
 Bin Sun1
 Joshua A. Bruno3Chris I. Richards2
 Adam D. Bachstetter4
 Peter M. Kekenes-Huskey1*
Adenosine triphosphate (ATP) and its metabolites drive microglia migration and cytokine production by activating P2X- and P2Y- class purinergic receptors. Purinergic receptor activation gives rise to diverse intracellular calcium (Ca2+ signals, or waveforms, that differ in amplitude, duration, and frequency. Whether and how these characteristics of diverse waveforms influence microglia function is not well-established. We developed a computational model trained with data from published primary murine microglia studies. We simulate how purinoreceptors influence Ca2+ signaling and migration, as well as, how purinoreceptor expression modifies these processes. Our simulation confirmed that P2 receptors encode the amplitude and duration of the ATP-induced Ca2+ waveforms. Our simulations also implicate CD39, an ectonucleotidase that rapidly degrades ATP, as a regulator of purinergic receptor-induced Ca2+ responses. Namely, it was necessary to account for CD39 metabolism of ATP to align the model’s predicted purinoreceptor responses with published experimental data. In addition, our modeling results indicate that small Ca2+ transients accompany migration, while large and sustained transients are needed for cytokine responses. Lastly, as a proof-of-principal, we predict Ca2+ transients and cell membrane displacements in a BV2 microglia cell line using published P2 receptor mRNA data to illustrate how our computer model may be extrapolated to other microglia subtypes. These findings provide important insights into how differences in purinergic receptor expression influence microglial responses to ATP.
Microglia are the macrophages of the central nervous system (CNS). They contribute to homeostatic and innate immune responses when subject to a spectrum of molecular stimuli, including those associated with infection and cellular damage (Nayak et al., 2014). Microglia respond to these stimuli by migrating, undergoing changes in protein expression, secreting cytokines and chemokines to engage the adaptive immune response, and phagocytosing foreign bodies (Nayak et al., 2014). Many details of these complex signaling pathways controlling microglial responses to such cues are beginning to emerge, including those mediated by ATP and its derivatives (Kigerl et al., 2014).
Extracellular ATP invokes Ca2+ fluctuations in many cells. These fluctuations are frequently and interchangeably referred to as ‘transients’ or ‘waveforms’ in the literature. In other cell types, the waveform of an induced Ca2+ signal, that is, its duration, amplitude, and frequency, has been shown to selectively control intracellular processes including phosphorylation, gene transcription and mechanical responses (Clapham, 2007). In microglia, Ca2+ waveforms are known to trigger cytokine and migration responses (Hide et al., 2000; Ohsawa et al., 2007; Ikeda et al., 2013), as well as a broad set of microglial signaling pathways (Kettenmann et al., 2011; Noda et al., 2012). Despite these observations, it has yet to be determined if the dynamic properties of Ca2+ waveforms in microglia exhibit similar selective control of physiological functions as observed in other cell types.
ATP-dependent responses in microglia are mediated by purinergic (P2) receptors. P2 receptors are broadly categorized into two classes: ionotropic (P2X) and metabotropic (P2Y) receptors. Ionotropic P2X receptors are non-selective cation channels widely expressed in cells throughout the CNS including microglia. Of these, P2X7 and P2X4 tend to be the most highly-expressed P2X-class receptors in microglia (Kettenmann et al., 2011; Asatryan et al., 2018). In our previous work (Chun et al., 2019), we developed a computational model demonstrating that P2X activation promotes the production of a pro-inflammatory cytokine, TNFα. However, microglia also express P2Y receptors that comprise G protein coupled receptors (GPCR) that can mediate pathways including ER Ca2+ release (Kettenmann et al., 2011; Noda et al., 2012). There are several prominent P2Y receptors present in microglia that respond to diverse nucleotides including ATP, adenosine diphosphate (ADP), and uridine triphosphate (UTP). Among these are P2Y2 (ATP/UTP), P2Y6 (UDP), P2Y12, and P2Y13 (ATP/ADP) (Kettenmann et al., 2011; Hickman et al., 2013). In principle, both classes of P2 receptors contribute to ATP-mediated responses in microglia, but their simultaneous contributions have yet to be determined in quantitative detail.
Microglia exhibit membrane displacements, such as extensions and retractions of plasma membrane, in response to ATP and can migrate toward sources of ATP (Orr et al., 2009). Ca2+ transients that coincide with directed migration have been observed in microglia (Ohsawa et al., 2004; Ohsawa et al., 2007; Ikeda et al., 2013; Franco-Bocanegra et al., 2019). Given the diverse Ca2+ waveforms induced by P2 activation, there is an intriguing possibility that microglia adopt unique cell responses to different waveforms that could select for migration versus inflammatory behaviors. However, it remains to be determined if variable Ca2+ waveforms are just a consequence of ATP stimulation or if they selectively influence cell functions.
Ca2+ waveforms and the capacity for cell migration in response to ATP are dependent on P2 expression and activity (Ferreira and Schlichter, 2013; Langfelder et al., 2015). P2 subtype expression can vary considerably among microglial subpopulations and activation states (Bianco et al., 2005; Crain and Watters, 2015; He et al., 2018). As an example, resting, in vivo microglia are characterized by having high P2Y12 expression and comparatively low expression of P2X4 and P2X7 (Crain et al., 2009; Kettenmann et al., 2011; Gomez Morillas et al., 2021), whereas classically activated microglia upregulate P2X4 and downregulate P2Y12 (Gomez Morillas et al., 2021). This motivated our hypothesis that P2X and P2Y co-expression in microglia subpopulations enable the cells to encode unique Ca2+ waveforms that prime membrane displacement versus inflammatory responses (Figure 1). This intuitive hypothesis is complicated by observations that ectonucleotidases, which degrade nucleotides like ATP, help determine the pool of ATP available (Sandefur et al., 2017; Rahmaninejad et al., 2020) to stimulate purinoreceptors.
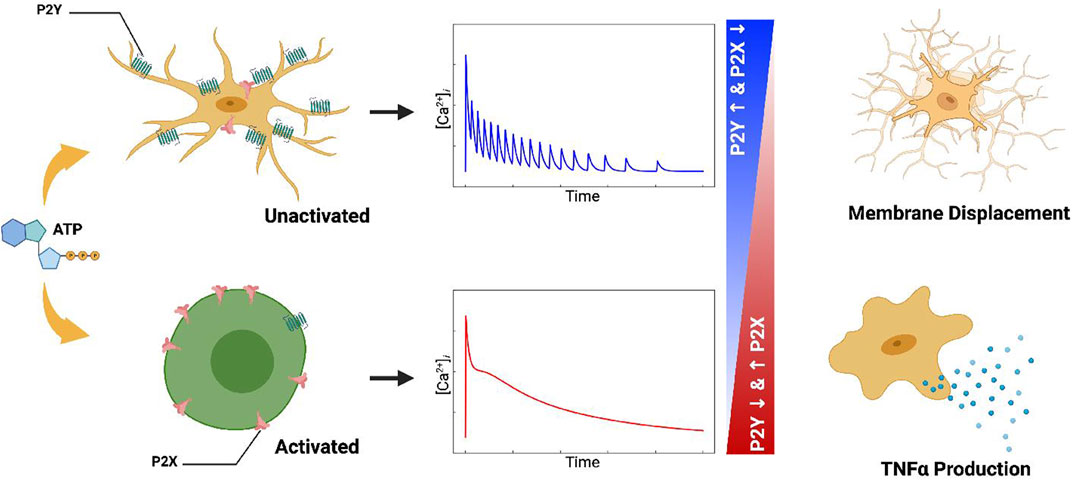
FIGURE 1. Table of Contents Graphic. Schematic of the computational model for ATP triggered P2Y and P2X receptors expressed in microglia (left column). The computational model predicts cellular responses including intracellular Ca2+ signals (middle column), migration, and cytokine production (right column) in response to ATP.
To investigate this hypothesis, we expanded our model of P2X4/P2X7 activation in microglia (Chun et al., 2019) to include contributions from P2Y-class receptors. The extended model includes G-protein mediated Ca2+ signaling and the activation of pathways implicated in microglia migration. This approach complements prior computational studies of Ca2+ responses induced by P2X receptors (Khadra et al., 2012; Chun et al., 2019) and metabotropic receptors that promote intracellular Ca2+ release (Cuthbertson and Chay, 1991; Skupin et al., 2008; Skupin et al., 2010). With this model, we specifically examined how P2X- and P2Y-class purinoreceptors encode ATP-triggered Ca2+ waveforms in microglia, how these waveforms are modulated by the ectonucleotidase CD39, and how these waveforms influence migration and cytokine responses.
We extended the computational model of P2X4-and P2X7-mediated Ca2+ signals and TNFα production described in Chun et al. (2019) to include P2Y-dependent contributions to membrane displacement and cytokine responses (see Figure 2). The original model consisted of differential-equation based descriptions of P2X4 and P2X7 gating (Chun et al., 2019), Ca2+ influx via P2X channels, and the production of TNFα. The aforementioned model has been extended with the addition of pathways including PI3K activation and phosphorylation of Akt to provide a quantitative measure of microglial migration with respect to ATP (Ohsawa et al., 2007). Equations and parameters are provided in the supplement.
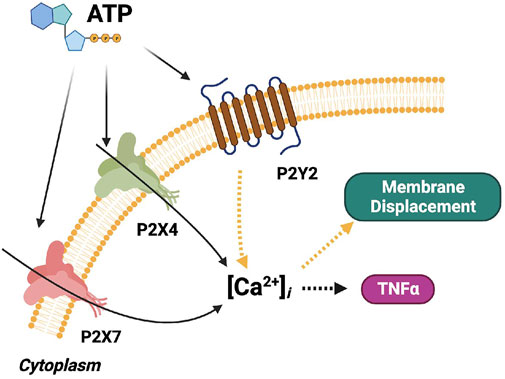
FIGURE 2. Schematic of the computational microglia model, which simulates the ATP-dependent activation of P2X- and P2Y-class receptors. The simulations also account for increases in intracellular Ca2+, cell membrane displacement, and TNFα cytokine production following P2 receptor activation. The pathways modeled in (Chun et al., 2019) for P2X signaling are shown in black. The pathways modeled for P2Y signaling are shown in yellow. Pathways added in this study are shown in orange. The dashed arrows denote multi-step cascades.
The P2X4 and P2X7 models used in this study were implemented as described in Chun et al. (2019), which were originally derived from published models (Yan et al., 2010; Khadra et al., 2012; Toulme and Khakh, 2012). To describe the dynamics of cytosolic Ca2+, we implemented and validated Ca2+ uptake and release from the ER by SERCA and IP3R, respectively. Basal Ca2+ levels are restored by the SERCA pump and the NCX as described in (Chun et al., 2019).
For the metabotropic receptor contributions, we assumed that P2Y2 activation promotes the disassembly of the Gαq subunit, after which PLC-β is activated to promote the generation of IP3 and DAG from PIP2 (Cuthbertson and Chay, 1991; Kettenmann et al., 2011). We described this process using a mathematical model introduced by Cutherbertson and Chay (Cuthbertson and Chay, 1991) for IP3-mediated Ca2+ oscillations in oocytes. The model includes receptors for Gαq protein activation, Gαq-dependent PLC-β activation, PLC-β-dependent IP3 synthesis, and we also assume this P2Y-receptor is activated by ATP. DAG in turn indirectly inhibits G-protein dependent PLC-β activation by catalyzing protein kinase C (PKC) activity. The activation of IP3 receptors by IP3 induces ERCa2+ release. We model this as a deterministic process, for simplicity, although the Ca2+ spiking that results resembles that which is observed experimentally (Skupin et al., 2008). As the cytosolic Ca2+ rises following IP3 receptor opening, DAG and Ca2+ promote PKC-dependent inhibition of PLC-β (Litosch, 2013). We also include the activity of ectonucleoside triphosphate diphosphohydrolase-1, also known as CD39. CD39 is expressed on the surface of microglial plasma-membrane and plays an important role in microglial migration by degrading ATP (Färber et al., 2008). We used the model of CD39-mediated hydrolysis of ATP into ADP and AMP from Kukulski et al to describe this degradation (Kukulski et al., 2005).
Many models for cell migration have been reported in the literature. These include models for actin polymerization (Mogilner and Edelstein-Keshet, 2002; Satulovsky et al., 2008), multi-cellular migration (De Pascalis and Etienne-Manneville, 2017), and tissue-level simulations of tumor growth (Van Liedekerke et al., 2019). For our model, we assumed P2Y12 triggers migration (Ohsawa et al., 2004) through the P2Y12/Akt axis (Irino et al., 2008). P2Y12 is activated by ADP (Haynes et al., 2006), upon which PI3K is agonized (Wu et al., 2007) through Gi/o signaling (Ohsawa et al., 2007). While, P2Y2 has also been shown to contribute to PI3K activation in the central nervous system (Weisman et al., 2012), we assumed for our model that P2Y12 is the predominant driver of PI3K, based on P2Y12−/− data from (Ohsawa et al., 2007) that demonstrate an 80% reduction of migration relative to control. We interpolated data from Ohsawa et al to a distance of 4 µm following 5 minutes of stimulation. The pAkt-dependent migration rate was then fit to yield this short migration distance following integration of the pAkt levels over 5 minutes. We also introduced terms to reflect the Ca2+-dependent activation of CaM, which supports myosin activation via the MLCK pathway per Yao et al. (2013).
With respect to the ER Ca2+ content, we utilized ratiometric data from ATP-treated microglial cells presented by Ikeda et al. (2013) to estimate ER Ca2+ release via IP3R. In that study, the authors obtained a series of Ca2+ transients to infer the distinct contributions made by ionotropic and metabotropic receptors. The authors utilized two ATP concentrations (100 μM and 1 mM) to activate P2X4 versus P2X7 receptors. For model validation, we converted the ratiometric data to concentrations by normalizing the cytosolic fluorescent intensity of resting microglia to 100 nM. We neglect SOCE given that this mechanism of Ca2+ entry occurs well after Ca2+ currents mediated directly by 5–10 min after ATP stimulation (Bianco et al., 2005; Ikeda et al., 2013; Adams et al., 2016; Jiang et al., 2017).
TNFα mRNA production following NFAT activation by Ca2+ was carried out according to Chun et al. (2019). Namely, we assume that Ca2+ mediated CaM/calcineurin activation promotes the translocation of NFAT into nucleus (Cooling et al., 2009), which in turn results in the transcription of TNFα mRNA (Hide et al., 2000).
The resulting system of differential equations were numerically solved and optimized via Python (ver. 3.6) and Gotran (ver. 2020.2.0.), see (Chun et al., 2019) for details. As previously described (Stewart et al., 2018; Chun et al., 2019), the Generalized ODE (ordinary differential equation) Translator was utilized to implement the microglial model. The SciPy function, ODEINT, that employs the LSODA algorithm for stiff ODEs (Petzold, 1983) was used in the numerical integration of the microglia model. A time-step for the 10-min numerical integration was 0.1 m but the data is generally stored every second. These computations generate as output the time-dependent values of model ‘states’, such as intracellular Ca2+ or the open gates of the P2X channels. Model fitting was further tuned and refined by a genetic algorithm we developed (Stewart et al., 2018) to iteratively improve assigned parameters, such as the rate of Ca2+ leak and P2X4/P2X7 conductance. Parameters for the model components are summarized in Sect. S2. Based on these sets of parameters, our model outputs were Ca2+ transients with respect to ATP exposure duration and concentration, as well subsequent changes in other states including PI3K and Akt for which experimental reference data were available. Experimentally-measured outputs, such as Ca2+ transient decay time and amplitude, were used to optimize the model parameters by minimizing the error between model predicted outputs and experiment. In order to compare the Ca2+ transient data from Ikeda et al., we repeated the moving average and the variance.
All code written and simulation input files in support of this publication are publicly available at https://github.com/huskeypm/pkh-lab-analyses/tree/master/2021-P2Y-microglia. Generated data are available upon request.
For live cell Ca2+ imaging, 96 well plates were used for BV2 cell culture. Cells were plated in a density of 5,000 per well 2 days prior to imaging. On the day of Ca2+ imaging, the cells were incubated at 37°C with 5% CO2 with 1 μg/ml Fluo-4 AM (Thermo Fisher Scientific) in Leibovitz’s L-15 medium for 45 min. Fluo-4 was used to measure the intracellular Ca2+ concentration due to its lower binding affinity relative to indicators like fluo-8 (a.k.a. Fluo-2 medium affinity) (Hagen et al., 2012). This allows for measurements of large Ca2+ fluctuations with lower saturation and higher temporal resolution (Lock et al., 2015). Excess Fluo-4 AM was washed by Leibovitz’s L-15 Medium and again incubated in Leibovitz’s L-15 Medium for 30 min. A custom-built, wide-field, epifluorescence microscope having a ×10 objective with 488 nm laser was used for taking time lapse images. 20-min time lapse movies at 2 s intervals were taken for different concentrations of ATP (Thermo Fisher Scientific) within the first 10 min before adding ATP and the remainder after adding ATP.
For data in Figure 7, Ca2+ measurements were conducted at 0.5 Hz. For each ATP dose, approximately 48 cells were selected to calculate the Ca2+ transients (as indicated by pixel intensity). For each cell, the ATP-induced Ca2+ transient was normalized with respect to the control stage; namely, the average pixel intensity of the control stage was subtracted from the trace of the entire time course.
The recorded images via the aforementioned Ca2+ imaging protocol were processed via custom python routines. The TIF file from the experiment was processed as a 3D matrix with a specific shape defined by (T,M,N) where T denotes the time-index, M × N was the image dimensionality (in the unit of pixels). The pixel intensity (gray-scale) was stored in 16-bit color depth. As the first step, the cell detection protocol identified cells from the image. Specifically, the intensity at each pixel of the image was summed up along the time-index to get a total image with shape (M × N). The total image was then subject to a log transformation and normalization. The histogram of pixel intensities of the normalized image was plotted to help identify a custom thresholding value. Parameters used for acquisition of these signals are embedded in the source code provided with this project. After determining the thresholding value, the normalized total image was converted into a binary image with intensities greater than the thresholding value identified as cell bodies with the rest as background. The detected cells in the binary image satisfying the aforementioned condition were segmented and labeled. Using this information, the original TIF gray-scale image (dark-field image) was utilized to record the change in the pixel intensity at each cell location, the average trace of which later represented the ATP-mediated Ca2+ transient of each cell.
We subsequently analyzed the Ca2+ transients before and after addition of different concentrations of ATP by taking time lapse images using widefield excitation. To normalize the data, we first calculated the average Ca2+ signal or fluorescence intensity in the control phase, the first 10 min without ATP. We then identified Ca2+ transients by dividing the entire time trace by the average fluorescence intensity. This was used to identify changes in the fluorescence signal.
Using the bright-field data collected for ATP treated BV2 cells, we selected cells that exhibited displacements within the first 20 frames directly after ATP treatment, which corresponds to 600 s in total. To measure displacements, we manually selected reference points within a given BV2 cell process at the initial time point and its approximate position at the final (10th) frame, from which a vector was defined. The resolution of the brightfield data was approximately 1.6 µm/pixel, therefore the length in pixels of the displacement vector was converted into micrometers.
We developed a computer model of metabotropic (P2Y-class) and ionotropic (P2X-class) purinergic receptors to simulate Ca2+ signaling in microglia (Figure 2). These Ca2+ signals are induced by extracellular ATP and its metabolites, such as ADP, binding to P2 receptors (Kettenmann et al., 2011; Noda et al., 2012). We therefore expanded a published model of P2X receptor activation (Chun et al., 2019) to include P2Y contributions in order to investigate how both purinoreceptor classes influence intracellular Ca2+ transients. We first implemented and validated a model for G-protein mediated IP3 generation and IP3 receptor-mediated ER Ca2+ release contributed by Cuthbertson and Chay (1991) that we adapted to reflect P2Y-mediated Ca2+ transients (Figure 3). We then validated predicted Ca2+ waveforms generated by both P2X- and P2Y-class receptors against data collected in primary microglia by Ikeda et al. (2013), which provided the Ca2+ transients in microglia mediated by low and high ATP concentrations (100 µM and 1 mM, respectively. See Supplementary Figure S1; Figure 4). To align our simulation predictions with experiment, we additionally implemented a quantitative model of ATP degradation by the CD39 ectonucleotidase.
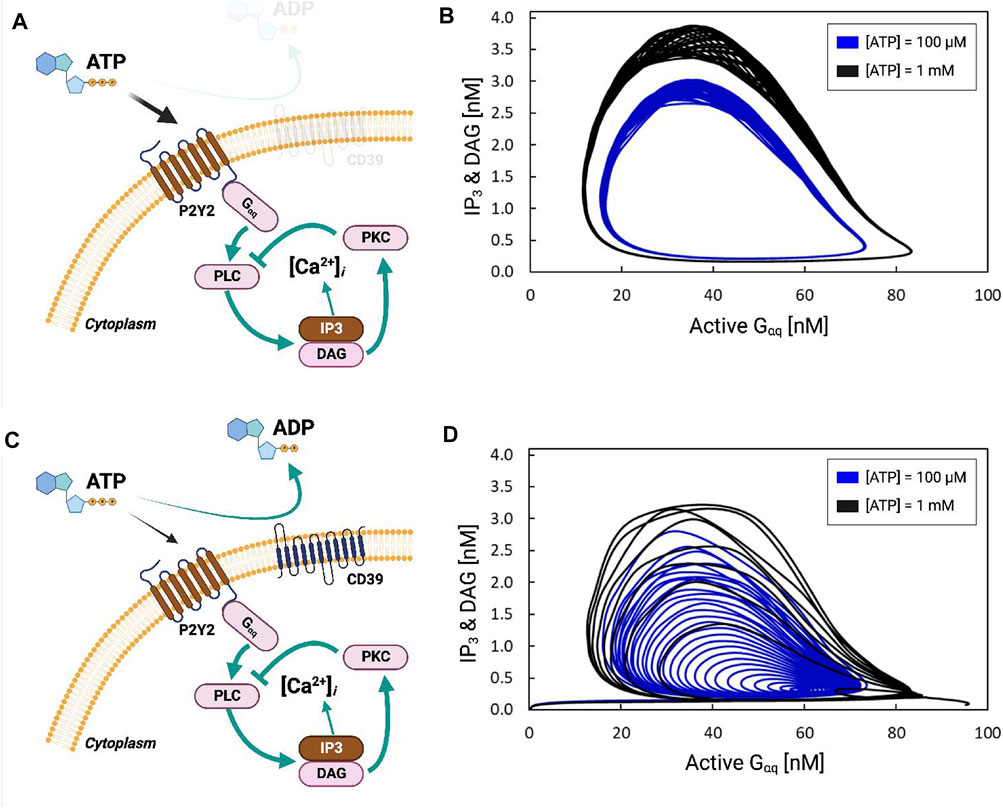
FIGURE 3. (A) Schematic of P2Y2-dependent activation of IP3 production via Gαq. (B) IP3 and DAG concentration [nM] as a function of activated Gαq [nM] in response to 100 µM (black) and 1 mM (blue) ATP. The cyclic nature reflects that the concentrations are oscillatory. (C,D) are equivalent to (A,B), except that the simulation includes the hydrolysis of ATP by the ectonucleotidase CD39.
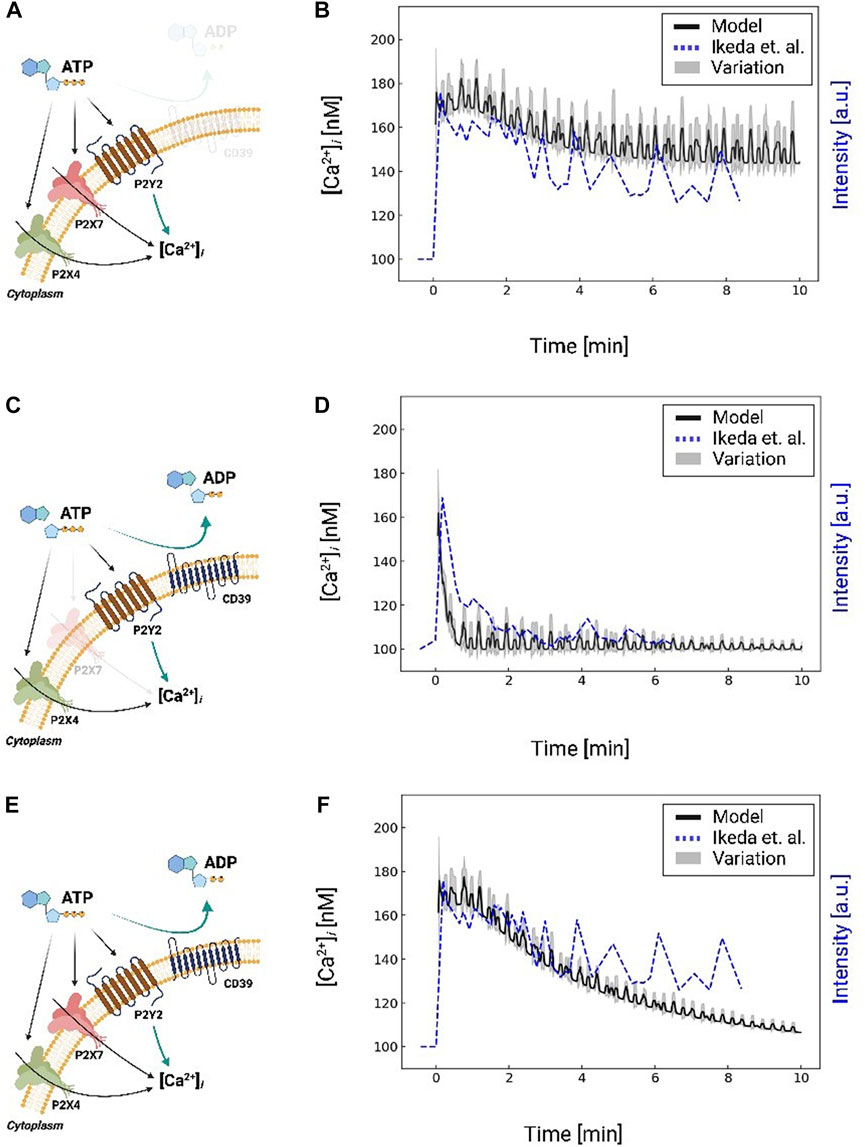
FIGURE 4. Schematic A for Ca2+ waveforms generated in a control system comprising P2X4, P2X7, and P2Y2 in response to 1 mM ATP for 10 min, but excluding CD39 nucleotidase activity. Schematic (A) is analogous to Schematic (C), but includes CD39 nucleotidase degradation of ATP and excludes P2X7. Schematic C is analogous to Schematic E, but includes P2X7. Schematic (E) for Ca2+ waveforms generated in a control system comprising P2X4, P2X7, and P2Y2 and includes CD39 nucleotidase activity. Schematic (B, D, and F) comparison of predicted (black: moving average with a window size of 8) and are reported along the left y-axis. The experimentally-measured (Ikeda et al. (2013), dashed blue) Ca2+ transients are plotted against the right y-axis, corresponding to the schematic (A, C, and E), respectively. Results excluding P2X7 and CD39 are shown in Supplementary Figure S2.
P2Y-driven IP3 signaling begins with the activation of Gαq-protein, which stimulates Phospholipase C (PLC) to produce Inositol trisphosphate (IP3) and Diacylglycerol (DAG) from PIP2 (Figure 3A). This is followed by ER Ca2+ release via IP3-stimulated IP3Rs. Negative-feedback arises in this system as DAG produced by PLC-β activates PKC, which inhibits PLC-β. In Figure 3B, we demonstrate that the activation of P2Y by ATP and subsequently Gαq results in periodic fluctuations in DAG and IP3 concentrations. ATP concentrations of 100 μM and 1 mM were chosen for the simulations to be consistent with Ca2+ transient data reported in Ikeda et al. (2013). This is evident as stationary cycles in Figures 3A, B, where increases in active Gαq were accompanied by increases in IP3 and DAG; these increases continued until active Gαq was nearly saturated at 80 [a.u], whereafter IP3 and DAG rapidly decayed to zero as active Gαq was depleted. The stable oscillation shown in Figure 3B therefore resulted in periodic fluctuations of the Ca2+ concentration shown in Supplementary Figure S2B. Larger oscillations in Gαq activation and IP3 production were evident with 1 mM ATP relative to 100 µM. In contrast, including ATP hydrolysis via CD39 resulted in attenuated Gαq and IP3/DAG oscillations evidenced by cycles of decreasing size (see Figures 3C, D).
Stable IP3 oscillations are reported in many cell types and are a prototypical example of negative-feedback circuits (Tyson, 2002; Kekenes-Huskey et al., 2015). Interestingly, microglia exhibit both oscillatory and aperiodic Ca2+ transients, which suggests that the underlying IP3 synthesis is not exclusively periodic. Oscillations in feedback biochemical circuits are determined by the kinetics of the underlying enzymes, therefore non-oscillatory IP3 signals are theoretically possible and would manifest as single-peak Ca2+ waveforms (Ikeda et al., 2013). We demonstrate in Supplementary Figure S3 how variations in the parameters underlying P2Y-frequency dependent Gαq activation can yield stable oscillations versus aperiodic behavior. Namely, by reducing the input parameter kg,cc that controls the rate of Gαq activation, the system reverts to non-oscillatory behavior. Similar effects can be shown by varying other parameters describing the Gαq negative-feedback circuit, which suggests that the activity of proteins comprising the Gαq/IP3 signaling pathway determine whether IP3 and thereby Ca2+ are oscillatory versus non-oscillatory.
IP3 invokes intracellular Ca2+ release from the endoplasmic reticulum via IP3 receptors. We therefore fit the model’s predicted IP3-induced Ca2+ transients to reproduce experimental data collected by Ikeda et al. (2013). Namely, we fit the initial peak amplitude ([Ca2+]i = 180 nM) to match the Ikeda et al data in MG5 microglial cells treated with 1 mM ATP (Ikeda et al., 2013), for which P2X7 was knocked-out to isolate the contributions of P2Y12 and P2X4 (see Supplementary Figure S2). We reflected this condition in our overall Ca2+ signaling model by zeroing the P2X7 currents. In Figure 4B, we compare our predictions of IP3-mediated Ca2+ release following a 10-min 1 mM ATP treatment (black) relative to the experimentally-measured transients from Ikeda et al (dashed blue). After this initial peak, our model predicts an oscillatory Ca2+ waveform that is complemented by decreases in ER Ca2+ owing to IP3 receptor activation (Supplementary Figure S4). The predicted Ca2+ waveform resembles the oscillations observed by Ikeda et al; however, our oscillations do not decay with time.
While a variety of mechanisms could be attributed to this discrepancy, such as the desensitization of P2Y receptors to ATP (Jacobson et al., 2006), we speculated that the availability of ATP for triggering P2Y was the prominent source of error. Extracellular ATP is rapidly degraded into ADP and AMP by ectonucleotidases (Kukulski et al., 2005), of which CD39 is the primary isoform in microglia that degrades ATP (Färber et al., 2008). To represent this contribution, we implemented a mathematical model from (Kukulski et al., 2005) to simulate CD39-catalyzed hydrolysis of ATP into ADP and AMP. Our implementation is validated against experimental data in Supplementary Figure S5, for which nucleotide concentrations were measured in COS-7 cells over a 1-h time interval (Kukulski et al., 2005). Importantly, these data demonstrate that the ATP pool was depleted within minutes; this depletion was accompanied by a transient ADP pool that was maximal at t = 4 min and subsequently decayed to zero. After including ectonucleotidase contributions in our microglia model, the predicted cytosolic Ca2+ transients decayed in a manner consistent with experimentally measured data (Figure 4D) without additional fitting. Hence, our simulations indicate that the ectonucleotidase CD39 plays a prominent role in shaping the Ca2+ waveform by controlling the nucleotide pool available to purinoreceptors.
After validating our model of P2Y-induced Ca2+ dynamics, we restored P2X7 receptor contributions and compared model predictions against analogous experiments in Figure 4F. We again simulated the system subjected to 1 mM ATP for 10 minutes with and without ectonucleotidase activity (shown in Figures 4C,D; Supplementary Figure S2 respectively). In contrast to the P2X7 −/− data, we observed a modestly higher peak Ca2+ transient amplitude that was followed by a prolonged plateau as would be expected from P2X7 currents (Egan and Khakh, 2004). Predicted Ca2+ oscillations decayed toward resting Ca2+ levels after approximately 10 minutes, albeit at a faster rate than observed experimentally. We report similar findings upon 100 µM ATP treatment in Fig. S1, which is sufficient to activate P2X4 (Jacobson et al., 2006), but not P2X7. Both the predicted and experimentally measured transients have an initial spike that rapidly decays. The data from Ikeda et al show a slower spike in Ca2+ than our prediction. Altogether, our data suggest that a diverse ensemble of Ca2+ waveforms are invoked by controlling P2 receptor activation and nucleotide availability.
We next examined how P2Y activation and P2Y-mediated Ca2+ waveforms control cell migration and displacement (see Figure 5). P2Y12 activation is essential for chemotactic migration and rapid membrane displacements in ATP-stimulated microglia (Ohsawa et al., 2004; Ohsawa et al., 2007; Irino et al., 2008; Kettenmann et al., 2011). P2Y12 receptors primarily activate the G-protein family Gi/o. and thereby promote Akt phosphorylation indirectly via PI3K to yield pAkt, which in turn activates pathways underlying cell migration in microglia.
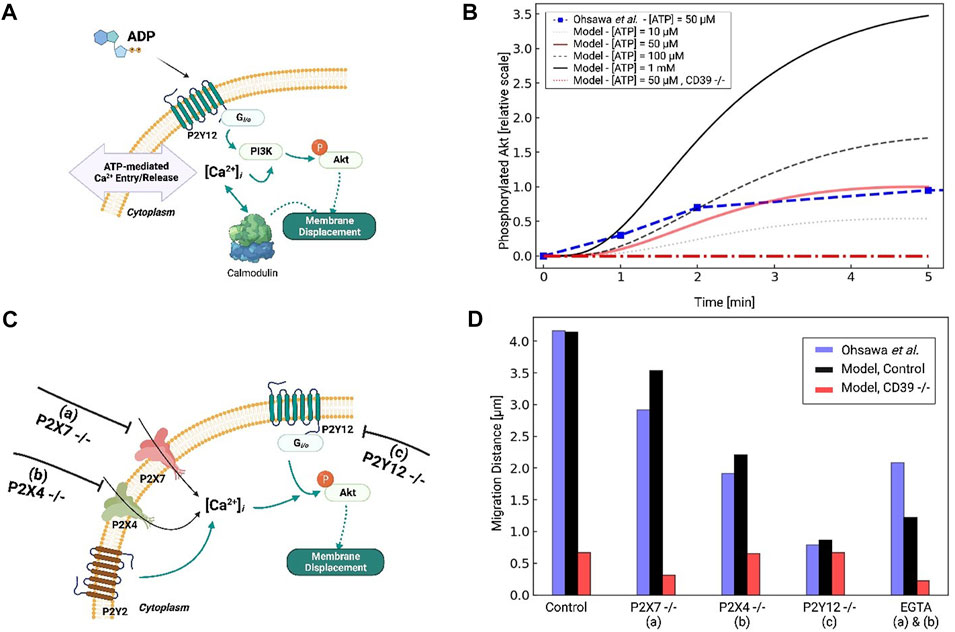
FIGURE 5. (A) Schematic of Akt phosphorylation via P2Y12- and P2Y-mediated Ca2+ signaling pathways in response to ATP. (B) Predicted pAkt level as a function of time in response to 50µM to 1 mM ATP applied for 5 min. Experimental data for 50 µM ATP from Ohsawa et al. (2004) are presented in red. (C) Schematic of P2Y12- and Ca-mediated migration in response to ATP, assuming control, P2X7 −/− (A), P2X4 −/− (B) and P2Y12 −/− (C) conditions. (D) Predicted migration distances (black) versus experimental measurements by Ohsawa et al under control and a-c conditions.
We first fitted our pAkt responses under 50 µM ATP treatment to reproduce data from Ohsawa et al in neonatal Wistar rat microglia. Since their data were obtained by Western blot, we normalized pAkt levels relative to the maximum recorded in their experiments for our model. The resulting fit is shown in Figure 5B, which indicates maximal pAkt levels were obtained at about 4 min and were in close agreement with the experiment. P2Y12 activation was maximal at this time given that its primary agonist, ADP, is maximal at 4 min due to ectonucleotidase activity (see Supplementary Figure S5). We also predict that Akt phosphorylation increased with increasing ATP concentration, as 100 μM and 1 mM ATP treatments resulted in 50% and 300% increases in pAkt relative to 50 µM.
The phosphorylation of Akt has been shown to depend on extracellular Ca2+. This is supported by evidence suggesting that the inhibition of P2X receptors (PPADS and TNP-ATP for P2X7 and P2X4, respectively) and removal of extracellular Ca2+ via excess EGTA all reduce pAkt levels (Ohsawa et al., 2004; Ohsawa et al., 2007; Irino et al., 2008). We therefore modified our computational model to include Ca2+-dependent PI3K/pAkt activation, as a step toward investigating the extent to which purinoreceptor-encoded Ca2+ waveforms influence Akt activation and subsequent migration (Divolis et al., 2016). To determine the Ca2+ dependence of PI3K activation, we referred to data from Ohsawa et al. (2004) that reported Akt phosphorylation following P2Y12, P2X7, or P2X4 inhibition. Under P2Y12 inhibition, they observed a 90% reduction in pAkt upon treatment of 50 µM ATP for 5 min relative to WT. We attributed the remaining 10% of the pAkt phosphorylation to Ca2+ influx from the P2X receptors. This was motivated by our observations that 1) P2X4 in particular generated prominent Ca2+ transients with micromolar ATP treatments (Ohsawa et al., 2007) and 2) that EGTA treatment nullified P2X-mediated Ca2+ transients and significantly reduced PI3K activation (Ohsawa et al., 2007). Indeed, we predict in Supplementary Figure S6B that EGTA treatment reduced pAkt by 75% normally conducted by P2X receptors.
We next examined the effects of P2X4 and P2X7 inhibition on PI3K activation, and subsequently, pAkt. Without additional refitting, our model predicted 40% and 15% reductions in pAkt levels solely from P2X4 and P2X7 inhibition, respectively. Our result for P2X4 was in close agreement with Ohsawa (see Fig. S6A and B). These substantial reductions upon nullifying P2X4 contributions therefore implicate this ionotropic receptor in phosphorylating Akt. We additionally verified that P2Y12 −/− all but eliminates Akt phosphorylation. Lastly, we predict that blunted ectonucleotidase hydrolase function enhances pAkt phosphorylation, which suggests that prolonged Ca2+ waveforms further promote Akt activation (Ohsawa et al., 2004) (shown in Figure 5B).
P2Y12, PI3K, Akt, and extracellular Ca2+ control microglia migration behavior (Ohsawa et al., 2004; Ohsawa et al., 2007). This is in part supported by data from Ohsawa et al demonstrating microglia with inhibited PI3K exhibit negligible migration when treated with ATP (Ohsawa et al., 2004). We therefore assumed microglia migration rates were proportional to pAkt levels in accordance with data from Ohsawa et al. (2004). Those data suggested that ATP-treated microglia migrate distances of approximately 48 microns following 1 hour of 50 µM treatment. We tested our fitted model by reporting migration distances upon inhibition of P2X4, P2X7, and P2Y12 (see Figure 5C). Without additional fitting, our simulated data nearly reproduced the 75% reduction in migration following P2Y12 −/− that was reported by Ohsawa et al owing to reduced pAkt. An intermediate reduction in migration distance following P2X4 inhibition was also comparable to data from Ohsawa et al (Figure 5D). Our model additionally predicts that reducing ectonucleotidase activity decreases migration, which is consistent with experimental data for CD39 −/− microglia (Färber et al., 2008). This is because ATP cannot be degraded into ADP, which is necessary for P2Y12 activation. Importantly, these simulated data confirm that P2Y12 inhibition, which was expected to all but eliminate Akt phosphorylation, dramatically reduced, but did not entirely eliminate migration. Together with the reductions in migration following P2X inhibition, these data implicate a role of extracellular Ca2+ in mediating Akt activation and migration.
Our data thus far indicate that microglia have robust Ca2+ responses to P2 receptor activation that influence migration. We previously showed in (Chun et al., 2019) that cytokine synthesis and release in microglia were driven by intracellular Ca2+ signaling. This raised the question as to how ATP-induced Ca2+ waveforms determined migration versus inflammatory cytokine responses in microglia. To answer this question, we also predicted migration distances as a function of Ca2+ waveform amplitude and oscillation frequency when subject to 200 µM ATP for 5 min in Figure 6. 200 µM ATP was chosen to afford better control in modulating the frequency and amplitude of the Ca2+ waveforms. The amplitudes and frequencies were controlled by changing the IP3 pathway parameter kg,cc. As a measure of cytokine responses, we report predicted TNFα released levels, using our validated model from (Chun et al., 2019). For reference, the dashed box indicates baseline migration and TNFα responses for the model when subject to 200 µM ATP. Per (Hide et al., 2000), secreted TNFα was undetectable under 1 h and reached a maximum concentration (425 pg/106 cells) for 3 mM ATP after 6 h. Our model predictions indicate that both migration and TNFα increase with increasing Ca2+ waveform frequency and amplitude (Figure 6). Although TNFα responses were predicted to increase at a greater rate than migration for increasing Ca2+ waveform frequency and amplitude, we anticipate produced TNFα would nonetheless be undetectable at 5 min. This is based on observations by Hide et al that minimal TNFα (10 pg/106 cells) was measured at 1 h, even with ATP treatments exceeding 1 mM (3 mM). Importantly, our model demonstrates that 1) both migration and TNFα production were positively correlated with the frequency and amplitude of the Ca2+ waveform and 2) migration could be triggered without significant TNFα responses when the Ca2+ waveforms were of short duration, low amplitude and low frequency.
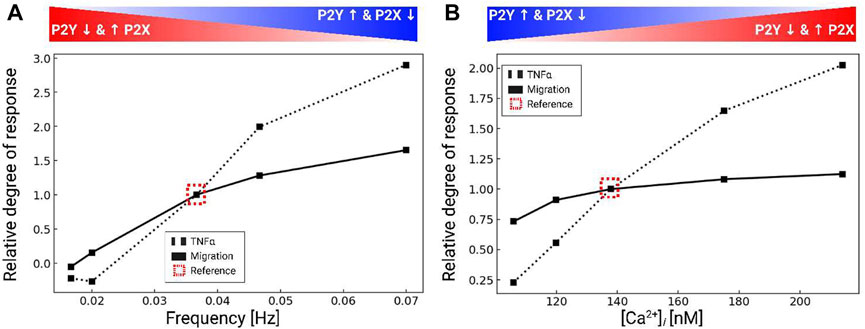
FIGURE 6. Predicted TNFα production (black dashed) and migration (black solid), normalized to control conditions (dashed box) in response to variations of the intracellular Ca2+ waveform frequency (A) and amplitude (B). All calculations were performed using 200 µM ATP and the data were collected over 5 min after ATP addition.
Microglia and immortalized microglia cell lines assume diverse phenotypes that are accompanied by differences in purinoreceptor expression (Bianco et al., 2005; Crain and Watters, 2015; He et al., 2018). As a proof-of-principle, we tested relative to the primary microglia used as a basis for our model how changes in purinoreceptor expression exhibited in the BV2 microglia cell line could influence their ATP-triggered Ca2+ waveforms and Ca2+-dependent functions. This cell line was chosen, given that these cells are easier to culture and characterize compared to primary cells. Although mRNA expression levels do not necessarily directly correlate with protein expression (Erb and Notredame, 2016), as a first approximation we proportionately rescaled the purinergic receptor responses in our model according to the relative change in mRNA expression (see Table 1). We adjusted P2 contributions in our model in accordance with mRNA data sets published for P2X4, P2X7, P2Y2 and P2Y12 (see Figure 7) in primary relative to BV2 microglial cells (He et al., 2018). Those data reflect 5-fold and 2-fold reductions in P2X4 and P2X7 mRNA relative to primary cells, no change in P2Y2, and a near complete elimination of P2Y12 mRNA.
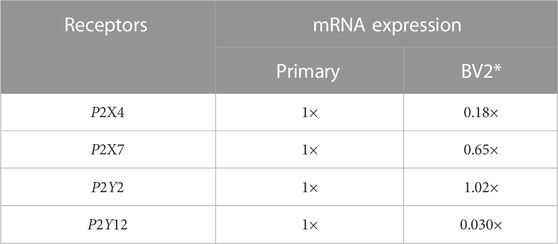
TABLE 1. Relative expression of P2 receptors in acutely isolated, primary cultured microglia, and BV2 cells in relative scale. Reported receptor mRNA expression is normalized to the expression level (mRNA count) found in primary cultured microglia and are incorporated in our model as scaling factors for receptor concentration (ρP2X4, ρP2X7, ρP2Y2, and ρP2Y12). *The mRNA expression was acquired from the comparison between cultured mouse microglia and BV2 cells (He et al., 2018).
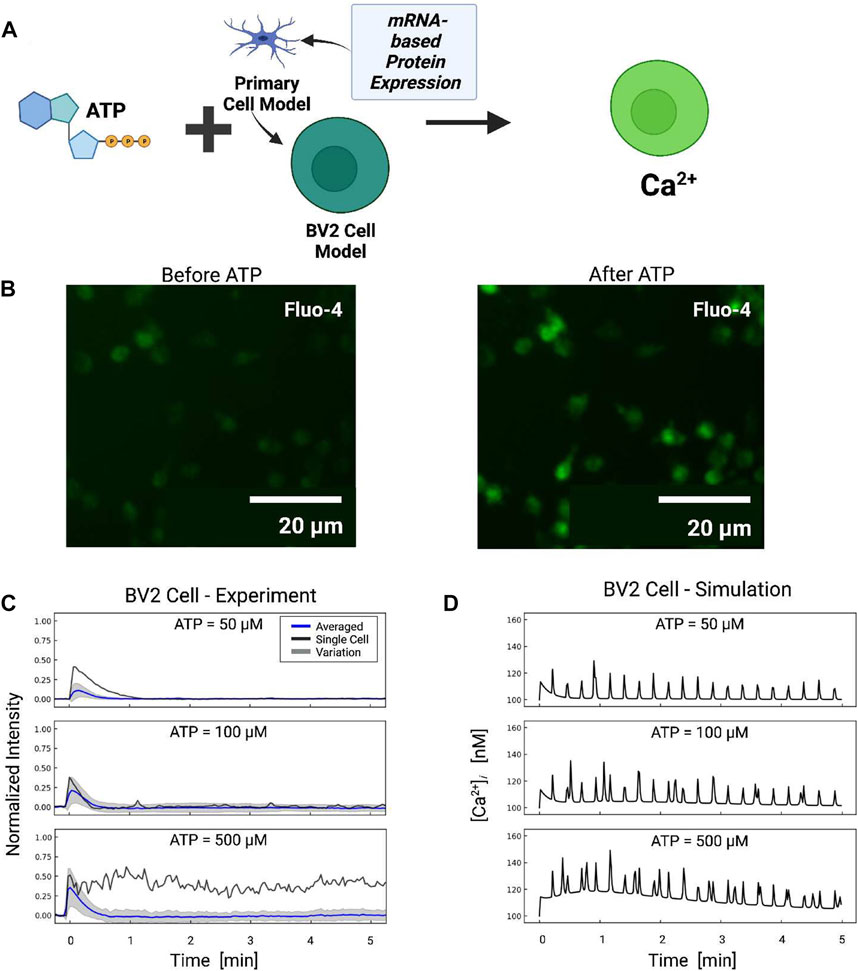
FIGURE 7. (A) Schematic of ATP-induced Ca2+ transients in BV2 cell simulations assuming P2 expression levels inferred from BV2 cell mRNA (He et al., 2018). (B) Ca2+ transients measured in BV2 microglia before and after ATP treatment. (C) Experimentally measured (blue) and predicted (red) Ca2+ transients from BV2 microglia. The shaded area represents the variation in signals measured in all cells. Oscillatory calcium signals were observed and a representative example of which is reported for each ATP dose (black). Transients recorded in each cell are reported in Fig. S7. (D) Predicted transients in primary microglia for comparison.
Based on the adjusted P2 responses, and without any additional fitting, we predicted Ca2+ transients in response to 50–500 µM ATP treatment applied for 10 min (Figure 7). The model demonstrated that the reduced P2X expression implied for BV2 cells resulted in moderately smaller Ca2+ transients relative to primary cells. The largest reductions were predicted at 50 and 100 μM, which was consistent with the preferential activation of P2X4 with micromolar ATP and the channel’s five-fold reduction in mRNA versus primary microglia. In contrast, modest reductions of 15% in Ca2+ transients after 20 s were predicted at 500 μM, which was inline with the P2X7 channel’s 35% reduction in P2X7 mRNA expression. Oscillations stemming from P2Y2 activation were predicted in the BV2 line and commensurate with those from primary cells.
To validate these model predictions, we measured Ca2+ transients in cultured BV2 cells. Because we did not have calibrated BV2 Ca2+ data, we assumed the peak Ca2+ amplitudes at 50 µM were approximately 112 nM in amplitude to be consistent with the 82% reduction P2X4 mRNA. We report in Figure 7 the average Ca2+ transients (blue) for the BV cells, while the cell-to-cell variance is represented by gray shaded regions. We found that the initial phase (
We last predicted BV2 migration upon 5 min ATP treatment, based on the assumptions of reduced P2X and P2Y12 expression (see Figure 8). In accordance with the reduced P2Y12 mRNA measured in BV2 cells, across all ATP concentrations we predicted a nearly 70% reduction in migration relative to primary cells. This reduction was consistent with the P2Y12 −/− data reported by Ohsawa et al that demonstrated reduced, but not entirely eliminated, migration in primary microglia. The predicted distances monotonically increased with higher concentrations of applied ATP, which was consistent with the Ca2+ dependency in migration exemplified in Figure 6.
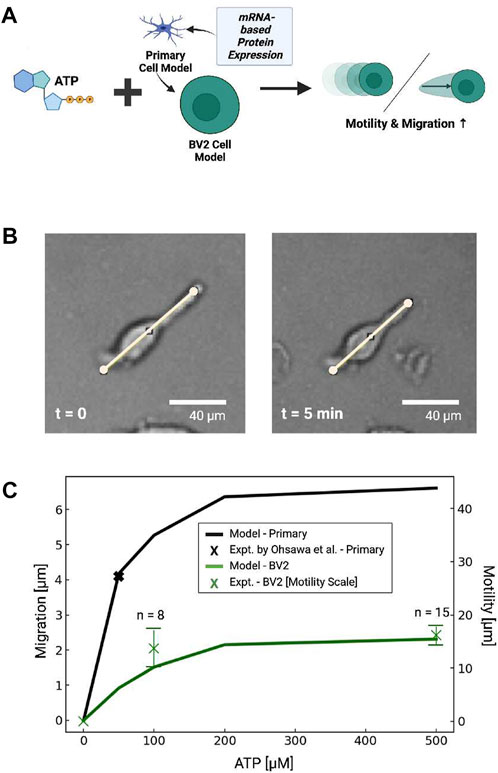
FIGURE 8. (A) Schematic of predicted migration or displacement in primary microglial cells or cells with P2 expression estimated from BV2 cell mRNA (He et al., 2018). (B) Bright field image demonstrating ATP-dependent displacement of microglial cell membrane (100 µM ATP at 5 min) (C) Predicted (lines) migration or displacement distance following 5 min ATP treatment (0–500 µM) in primary microglia (blue) and BV2 cells (green). Experimental data in primary cells from Ohsawa et al. (2004) and measured in BV2 cells are shown by black and green X’s, respectively, where the bars represent standard error.
To validate these predictions, we examined subsets of BV2 cells that exhibited linear extensions of their membrane akin to the cellular processes evident in branched microglia (Figure 8B). We found that these cells rapidly contracted upon ATP treatment, as exemplified in Figure 8, but otherwise we did not observe appreciable directed migration over the data collection interval. We therefore defined this movement as the displacement of plasma membrane following ATP treatment. To assess ATP-dose dependencies for these responses, we measured the displacement of these extensions along manually-defined vectors. We report in Figure 8C that maximum displacement distance of 1.6 × 101µm was evident in response to 500 µm ATP, indicating the displacements increased with increasing ATP. Further, the dose-dependent displacement rates were consistent with the migration distances we predicted for BV2 cells in Figure 8. Although these displacements were only reflected in a minority of the imaged cells, we found that morphological changes, surface ruffling and minor displacements of the cell somas were evident in a larger number of cells by visual inspection. These effects were more prominent for ATP-treated cells than those not treated with ATP (ATP = 0 µM).
In this study we used computational modeling to investigate how P2X and P2Y receptors collectively regulate Ca2+ signaling and migration in microglia in response to ATP. This investigation extended a computational model of ionotropic P2X receptor activation (Chun et al., 2019) to incorporate contributions from metabotropic P2Y receptors. A schematic of the resulting model is shown in Figure 9. With this model, we:
1. Determined the extent to which P2 receptor activation in microglia shaped the waveforms of intracellular Ca2+ signals
2. Assessed the effects of P2Y12 activation on the PI3K/Akt axis that drives microglia migration.
3. nvestigated the extent to which mRNA data from BV2 microglia could be used to predict ATP-dependent responses in other microglia cell types.
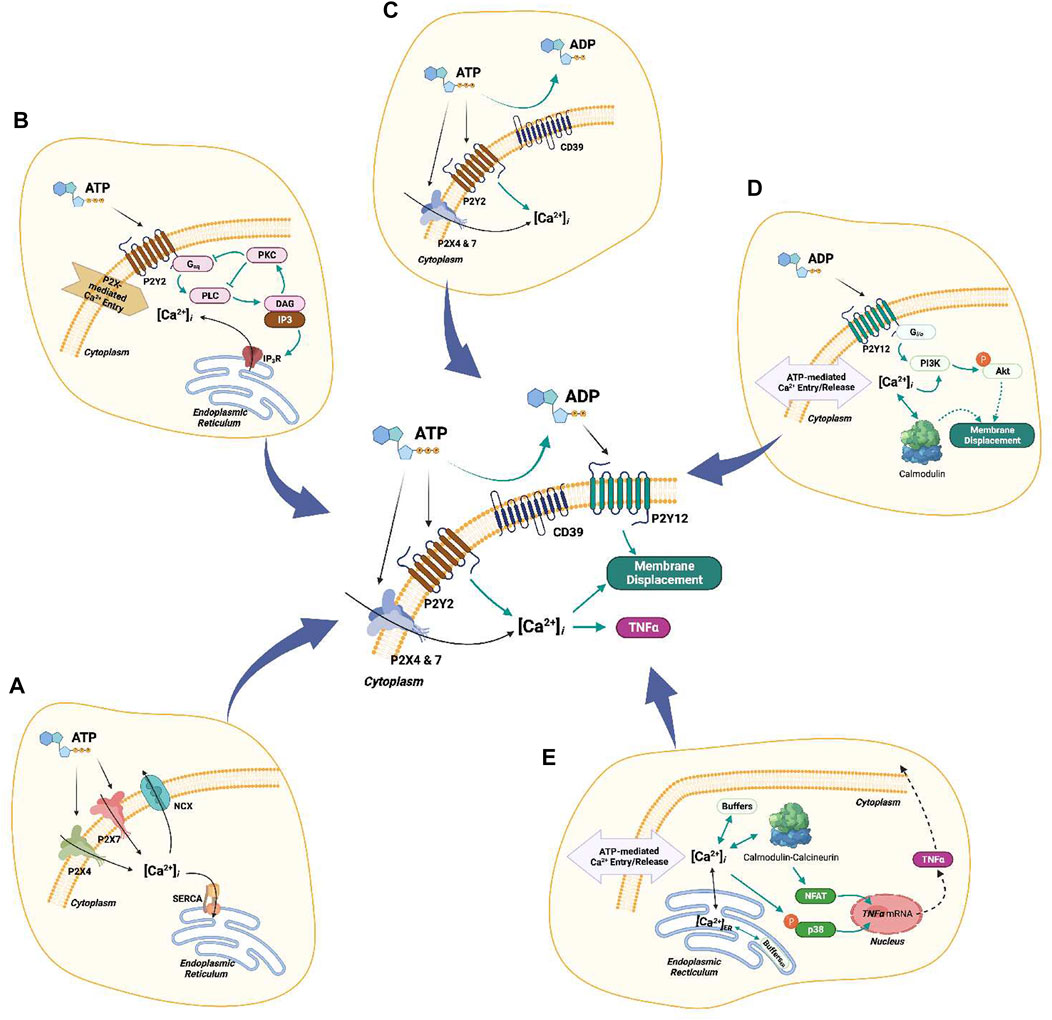
FIGURE 9. Complete schematic of the computational model. (A) P2X4/7-mediated Ca2+ entry. (B) P2Y2-mediated Ca2+ transients. (C) Hydrolysis of ATP by ENTs (CD39). (D) P2Y12-mediated cell migration. (E) Ca2+-dependent downstream cascades associated with TNFα production.
Our first goal was to determine the extent to which highly-expressed P2 receptors in microglia shaped the waveform of intracellular Ca2+ signals in response to ATP. Indeed, our model indicated that metabotropic P2Y receptors contribute significantly to ATP-induced Ca2+ signals in microglia. Since in vivo microglia typically express high levels of P2Y receptors (Crain et al., 2009), this further suggests that ER Ca2+ release may play a more significant role in tissue microglia than would be observed in ex vivo cultured microglia that are more commonly studied. Further, unlike the P2X receptors that generally present high-amplitude, single-peak Ca2+ waveforms, we show that P2Y receptors can adopt oscillatory or transient, single-peak, Ca2+ fluctuations (shown in Fig. S3). Given that sustained increases in basal intracellular Ca2+ levels are associated with pathological states (Hoffmann et al., 2003; Tvrdik and Kalani, 2017) and spontaneous oscillations are typical of homeostatic cells (Hoffmann et al., 2003; Kettenmann et al., 2011), the balance of P2X versus P2Y contributions may be indication of the cell phenotype (Figure 10). Additionally, the ability for P2Y to encode diverse oscillatory and nonoscillatory signals could serve as a mechanism for controlling Ca2+-dependent functions in microglia. Our speculation is consistent with findings in other Eukaryotic cells that the dynamic profiles of Ca2+ waveforms tune cellular outcomes (Smedler and Uhlén, 1840). As examples, oscillatory Ca2+ waves in oocytes are observed during fertilization, while the timing of Ca2+ pulses in cardiac myocytes can selectively activate rapid CaMKII- versus slow NFAT-mediated gene responses (Zhang et al., 2007).
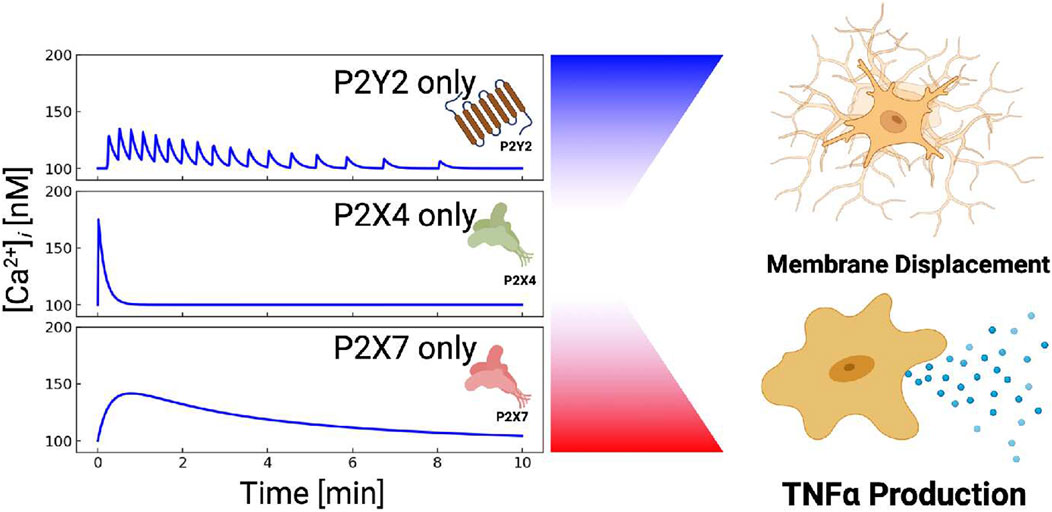
FIGURE 10. P2X and P2Y receptors can be combined to control different cellular outcomes. P2X4-induced Ca2+ entry manifests a sharp but brief rise in cytosolic Ca2+. P2X7-mediated Ca2+ entry results in blunt and prolonged Ca2+ elevations. P2Y-class receptors (mainly P2Y2) yield oscillatory Ca2+ transients, while P2Y12 (not shown) promotes membrane displacement.
Although we did not investigate subcellular Ca2+ dynamics in microglia, the spatial distribution of Ca2+ transients is likely as important as their temporal character. To our knowledge, investigations of subcellular Ca2+ dynamics in microglia are fewer in number compared to other cell types, including muscle cells (Hake et al., 2012). Nonetheless, a recent example with ATP-treated microglial revealed spatially heterogeneous Ca2+ profiles (Venkateswarlu et al., 2020). This heterogeneity could result either directly from non-uniform distributions of ionotropic receptors conducting Ca2+, or from second messengers like IP3 that trigger localized ER Ca2+ release. Future experiments that characterize localized Ca2+ transients in microglia will be necessary to assess their functional significance relative to more uniform global signals.
Our simulations indicate that the activity of proteins belonging to the Gαq/IP3 pathway determine whether P2Y receptors generate single, long duration peaks or oscillations. P2Y receptors are GPCRs, of which P2Y1, P2Y2, P2Y4, P2Y6, and P2Y11 promote IP3-dependent ER Ca2+ release via activating Gαq proteins (Kettenmann et al., 2011). This pathway includes PKC-dependent negative-feedback inhibition of PLCβ (Litosch, 2013), which gives rise to stable IP3 oscillations and periodic intracellular Ca2+ release (Skupin et al., 2008). Negative feedback inhibition is a property of classical biochemical oscillators, for which the enzyme reaction rates determine the periodicity and decay of products like IP3 (Tyson, 2002), Although these oscillations may be stochastic, deterministic representations (Sneyd et al., 1995; Tyson, 2002) amenable to ordinary differential equation modeling are commonly used, given their ability to approximate the amplitude and peak-to-peak intervals of experimentally-measured Ca2+ release events (Cao et al., 2014). Since these parameters represent the activity of proteins composing the IP3 synthesis pathways, waveforms exhibited in microglia are expected to be inherently sensitive to factors such as protein expression and co-localization (Kekenes-Huskey et al., 2015).
Our simulations strongly implicate the role of ectonucleotidase activity in controlling the responsiveness of microglia to extracellular ATP and related nucleotides. We demonstrate that neglecting ectonucleotidase activity in our model yielded sustained Ca2+ oscillations that were inconsistent with measurements in microglia and specifically the data collected by Ikeda et al. (2013) for MG5 microglial cells. Although we assume that CD39-dependent degradation of ATP contributes to the decay of the P2X-driven Ca2+ transients with time, a similar response may also result from P2X receptor desensitization (Koshimizu et al., 2000) or changes in trafficking (Robinson and Murrell-Lagnado, 2013). We believe our assumption of CD39 degradation is reasonable, given that a related hematopoietic cell type exhibited pronounced Ca2+ transients mediated by P2X7 only when CD39 was inhibited by the nonhydrolyzable βγMeATP. In other words, blockade of nucleotidase activity increased the ATP available to stimulate the purinoreceptors. This therefore suggests that ectonucleotidase activity helps determine the duration of ATP-mediated Ca2+ waveforms in microglia and ultimately cellular responses like migration (via ADP) and cytokine production. The ectonucleotidases CD39 and CD73 are the most highly expressed nucleotidases in microglia (Matyash et al., 2017). CD39 rapidly hydrolyzes ATP and ADP into AMP, which curtails Ca2+ waveforms within minutes of ATP treatment in our simulations. While our model of CD39 activity was parameterized to fit data from Robson et al. (2006), more detailed models such as from Sandefur et al. (2017) could give additional insights into how other expressed ectonucleotidases influence microglial responses to ATP. As an example, augmenting the CD39 model with contributions from the CD73 ectonucleotidase isoform (Zimmermann, 1992), which metabolizes AMP into adenosine, will help determine which adenine metabolites predominate at the cell surface (Rahmaninejad et al., 2020), as well as the receptors they stimulate.
Interestingly, it is increasingly recognized that extensions of the microglia plasma membrane exhibit physical contacts with neural synapses (Schafer et al., 2012), which may be implicated in how microglia prune neural synapses (Stogsdill and Eroglu, 2017). ATP can be intermittently released in these junctions (Robson et al., 2006; Harris et al., 2012), therefore we expect that the timescale and amplitude of those release events, as well as the rate by which ATP is metabolized, will control how microglia respond to these intercellular signals to fulfill their homeostatic functions. Here, spatially-explicit models of nucleotidases (Rahmaninejad et al., 2020) that predict local ATP pools between interfaced cells could be important. Such a model could help determine how microglial responses in multi-cellular assemblies such as neural synapses differ from in vitro preparations. It is important to recognize that for Ca2+ responses in cultured or immortalized microglia, doses of 50–100 µM ATP are commonly used (Hide et al., 2000; Barberà-Cremades et al., 2012). In contrast, extracellular ATP concentrations in the brain are on the order of 5–10 nanomolar (Faroqi et al., 2021) under physiological conditions, though insults including moderate traumatic brain injury and ischemia can elevate ATP two- to 4-fold (Melani et al., 2017; Peng et al., 2019; Moro et al., 2021). To reconcile these disparate concentrations, micro-domains formed between ATP-releasing and ATP-sensing cells may locally increase concentrations (Rahmaninejad et al., 2020), similar to locally defined intracellular Na+ and Ca2+ domains (Shigetomi et al., 2010; Aronsen et al., 2013; Peglow et al., 2013).
Our study contributes a quantitative model linking P2Y12 activation to the PI3K and Akt axis essential for microglia migration (Ohsawa et al., 2004; Ohsawa et al., 2007; Irino et al., 2008). Unlike the metabotropic P2Y receptors implicated in intracellular Ca2+ signals, P2Y12 activates Gi/o, which stimulates PI3K and ultimately phosphorylation of Akt (Ohsawa et al., 2004). Our model reproduces the rate of PI3K-dependent Akt phosphorylation in addition to migration distances inferred from Ohsawa et al. (2004). Interestingly, both our model and data from (Ohsawa et al., 2004) suggest that Akt phosphorylation is slow and reaches its maximum about 3 minutes after ATP treatment. This contrasts with the rapid onset of migration observed by others (Dou et al., 2012; Etienne et al., 2019). For instance, supplemental movies from Dou et al. (2012) indicate that microglia migrate almost immediately in response to ATP and approach a rate of [1.7 μm/s] within 10 min of 1 mM ATP. Similar findings for microglia in tissue slices were also reported (Etienne et al., 2019). Hence, either low levels of phosphorylated Akt are sufficient for invoking migration at early time points, or alternatively, P2Y12- or pAkt-independent mechanisms mediate the rapid onset of migration. In support of the latter speculation, our model and experiments from Ohsawa et al. (2004) demonstrate that P2Y12 −/− dramatically reduces, but does not entirely eliminate, migration.
In this regard our model was constructed to reflect the Ca2+-dependence of microglial migration, given observations suggesting that 1) P2Y12 silenced microglia migrate and 2) extracellular Ca2+ significantly enhances migration by promoting Akt phosphorylation (Ohsawa et al., 2004; Ohsawa et al., 2007). As such, our simulation recapitulates data indicating that migration is significantly reduced when P2X contributions are neglected (Ohsawa et al., 2004; Ohsawa et al., 2007). This finding suggests that there are ATP-triggered, Ca2+-dependent migration mechanisms (Ohsawa et al., 2004; Ohsawa et al., 2007; Irino et al., 2008) that could be sensitive to rapid Ca2+ signals, such as those exhibited by P2X4. These mechanisms could include Ca2+-dependent recruitment of PI3K to the plasma membrane (Ohsawa et al., 2004), activation of the Ca2+-binding protein Iba (Ito et al., 2001), regulation of cytoskeletal proteins (Li et al., 2009), and regulation of myosin by the CaM-dependent myosin light-chain kinase (Shimizu et al., 2006). To our knowledge, the rates of these mechanisms have not been examined in microglia, which precluded us from explicitly representing these processes in our model. Nonetheless it is plausible that P2X receptors trigger Ca2+-dependent migration machinery that initiate migration, after which the more gradual activation of the PI3K/Akt axis via P2Y12 sustains migration over longer time intervals. Along these lines, low-amplitude Ca2+ oscillations from metabotropic P2Y receptors likely enhance migration, which is consistent with the requirement of IP3-induced Ca2+ release for P2Y12-driven chemotaxis (Kettenmann et al., 2011). Clearly, ATP-induced migration in microglia is exceedingly complex (reviewed in (Stephens et al., 2008; Cianciulli et al., 2020)) and warrants further investigation to unravel the intricate relationships between Ca2+ dynamics and migration.
Our simulations implicate Ca2+ signaling in promoting migration as well as TNFα synthesis. This raises the question as to whether ATP can stimulate microglia displacement associated with homeostatic functions, such as supporting neuron development and transmission (Schafer et al., 2012), without driving inflammatory cytokine responses. It is apparent from our simulations that a key distinction between these cellular responses is the duration of the intracellular Ca2+ waveform. Namely, our simulations show that sub-micromolar ATP treatments yield short-lived Ca2+ waveforms (
Our model suggests that the expression levels of P2 receptors enable microglia to regulate migration and pro-inflammatory responses to ATP (Lively and Schlichter, 2013). This occurs in part through modulating intracellular Ca2+ dynamics. Since P2X and P2Y receptors exhibit unique and diverse Ca2+ waveforms (Egan and Khakh, 2004), we hypothesized that phenotype-specific differences in P2 receptor expression in microglia influence both 1) Ca2+ responses and 2) migration. We investigated this hypothesis by adapting P2 expression levels in the model based on published BV2 cell mRNA data. Model predictions of ATP-stimulated Ca2+ waveforms and migration were compared against experiments with BV2 cells.
The mRNA data used for our model (He et al., 2018) showed that primary cells and BV2 microglia had similar numbers of P2X7 and P2Y2 transcripts, but BV2 cells had fewer P2X4 mRNA transcripts. For simplicity, we assumed that the purinergic receptor activity in our model correlated with mRNA expression. Based on our assumptions the model predicted Ca2+ waveforms in BV2 cells that were qualitatively similar to those simulated for primary cells. In contrast, P2Y12 mRNA transcripts were reduced 30-fold in BV2 cells relative to primary cells (He et al., 2018). Accordingly, our model predicted diminished migration in BV2 cells. We did not observe directed migration in our BV2 cell assays, which is consistent with other reports that confirm negligible or very slow migration responses to chemotactic stimuli (Gyoneva et al., 2009; He et al., 2018; Franco-Bocanegra et al., 2019) Nonetheless, we observed that the BV2 cells exhibited minor membrane movements like ruffling and displacement in response to ATP. The displacements increased in an ATP-dose dependent manner consistent with our model predictions for migration. While data quantifying receptor expression and membrane localization is ultimately needed to better infer receptor activity, our simulations suggest predicting cell function from transcriptomic or proteomics data could become feasible. It should generally be noted that qPCR and Western blot data are obtained from a large ensemble of cells, whereas the Ca2+ and membrane displacements we report were measured on a single cell basis. Therefore, we would expect to see greater variability in the behavior of single cells than might be inferred from qPCR alone. Along these lines, in principle, mRNA data from in situ microglia could be used to predict the phenotype of tissue microglia. Such mRNA data are available for acutely isolated microglia prior to culturing (Crain et al., 2009) in order to facilitate comparisons of in situ-like microglia with primaries. Nonetheless, the tissue environment also contains a variety of molecular factors that will undoubtedly affect microglial phenotypes beyond protein expression alone.
There are several model limitations that can guide refinement in subsequent studies. A prominent limitation is that many of the underlying biological processes linking ATP binding to migration and cytokine responses are not completely resolved. Of those we considered in our model, the kinetics of those processes have not been determined in primary microglia in sufficient detail. The Ca2+ responses induced by the purinoreceptors are perhaps the best characterized of these processes, as time-dependent fluorescence data were available. Other processes though were heavily reliant on western blotting and microscopy, which are qualitative in nature and based on pooled cells. Although we limit the scope of our study to the purinoreceptors that respond to ATP and ADP, nucleotidases degrade these nucleotides into adenosine that could activate adenosine receptors in microglia (Merighi et al., 2017; Borea et al., 2018). The activation of the adenosine receptor A2aR, for instance, has been shown to contribute to neuroinflammation (Colella et al., 2018).
We also assumed that the biochemical pathways are spatially homogeneous within the cell for the simplicity of modeling and parameterization. Nonetheless, a number of proteins have precise subcellular localization or undergo changes in a localization about activation, such as P2X4 (Toulme and Khakh, 2012) and NFAT (Bazzazi et al., 2015). Accounting for these changes could impact their ability to promote gene transcription versus migration responses.
It was evident from our measurements of ATP-induced Ca2+ waveforms that cell-to-cell variation in responses was substantial. Namely, many of the individual cells presented traces that strongly deviated from the mean (see Figure 7). Our model aims to qualitatively capture calcium transients following ATP stimulation. Data from Ikeda et al. represents the ensemble average over many cells, therefore, exact (quantitative) matches are generally not feasible owing to the stochastic nature of Ca2+ transients. However, our data captures the qualitative trends of elevated Ca2+ immediately after ATP addition that dissipates with time. Our modeling approach relies on deterministic equations, which are most appropriate for describing the average behavior of a large ensemble of cells. This approach is valid, given that many of the experimental data used to train our approach were from western blots and mRNA quantification, which generally use large pools of cells. Stochastic models such as that from Skupin et al. (2008); Skupin et al. (2010); Cao et al. (2013) could be used in complement to our model to investigate how cell-to-cell variations in gene expression or protein activity could impact ATP-induced Ca2+ waveforms. At the very least, the cell-to-cell variability underscores a need for single-cell characterization of cell genotypes and phenotypes, as well as sensitivity analyses such as in Figure 6 to better characterize Ca2+ waveforms and their effects in diverse microglial cell populations. Metabotropic purinoreceptors in principle can also stimulate the production of cyclic AMP (cAMP). We did not investigate dependencies of migration or TNFα production on cAMP production in principle P2Y11 activation promotes Gs signaling, which would result in cAMP production (Erb and Weisman, 2012). However, P2Y11 receptors do not appear to be significantly expressed in murine primary and BV-2 microglia (Brautigam et al., 2005). Despite this, it has been reported that TNFα production reduces cAMP (Patrizio, 2004), cAMP signaling can inhibit microglia migration (Umpierre and Wu, 2021), and that P2Y12 activation blocks cAMP synthesis via Gi (Tozaki-Saitoh et al., 2017). Future investigations of other GPCRs that utilize Gs signaling would be helpful to better understand how other messengers, such as cAMP, contribute to migration and cytokine production.
Our model could be improved by accounting for K+-dependent signaling. There are a multitude of mechanisms by which changes in intracellular K+ and membrane potential could influence microglial signal transduction, such as by enhancing the electromotive force for Ca2+ entry, or by influencing the activity of the sodium/K+ ATPase. Reflecting these contributions may provide more complete descriptions of K+ mechanisms mediating inflammation (Stebbing et al., 2015) and migration (Swiatkowski et al., 2016). For instance, P2Y12-dependent activation of K+ channel dynamics is believed to contribute to migration (Kettenmann et al., 2011). This is supported by studies suggesting that P2Y12-activation induces substantial outward current associated with K+ channel activity (Swiatkowski et al., 2016; Fan et al., 2017). It is further understood that K+ efflux constitutes an important stage of priming the microglial inflammasome, which is necessary for maturating pro-inflammatory cytokines such as IL-1β (Xu et al., 2020). Along these lines, it is increasingly recognized that P2X7 and P2X4 conduct K+ countercurrent when activated (Yaron et al., 2015; Nguyen et al., 2020); moreover, changes in K+-channel expression upon microglial activation may contribute to these responses (Nguyen et al., 2017).
While we modeled the PI3K/pAkt axis, RAGE/RhoA/ROCK are also involved in mediating chemotaxis (Tatsumi et al., 2015; Zhang et al., 2019). For instance, it was shown that inhibition of ROCK via H-1152 reduced p38 phosphorylation and membrane ruffling following ATP-dependent P2Y12/13 activation (Tatsumi et al., 2015). Inhibition of MLCK, Rac1 and p38 also results in the attenuation of migration in primary cultured murine microglia (Miller and Stella, 2009). p38 is also known to be Ca2+ sensitive (Trang et al., 2009), which again introduces another potential pathway sensitive to Ca2+ waveform characteristics. Related to this, CaM dependent contributions to migration are also important. O’Brien et al found that active CaM was involved in chemotaxis by monitoring the activity of its phosphodiesterase (PDE1) target (O’Brien et al., 2020). Similarly, Yao et al demonstrated the involvement of CaM in migration via CaM-dependent MLCK (Yao et al., 2013). P2Y2 -mediated epidermal growth factor receptor (EGFR) is also an established pathway contributing to cell migration and cytokine production (Li et al., 2015). Altogether, the dependencies of cell migration on diverse signaling pathways suggest microglia are highly adaptive to a variety of extracellular stimuli to promote migration responses. Hence, resolving these inter-dependencies will warrant additional studies and their dependencies on Ca2+ to delineate microglial migration responses specific to ATP.
ATP-induced Ca2+ waveforms in microglia have diverse properties, such as amplitude, duration and oscillatory behavior. These properties depend on which P2 receptor types are activated, in addition to ectonucleotidase activity. In this study, we developed a computational model to predict how P2 receptors and ectonucleotidase hydrolases control Ca2+ waveforms in microglia that in turn influence microglia migration and cytokine production. With this model, we examine the propensity for these diverse Ca2+ waveforms to drive these canonical microglial responses to ATP.
We interpret these results in light of our previously published microglia model for probing P2X contributions to TNFα mRNA synthesis as a model for pro-inflammatory cytokine responses to ATP (Chun et al., 2019). In that study, we demonstrated that Ca2+ waveforms generated by P2X activation are typically high-amplitude and of finite duration. With the addition of P2Y, we predict a wider diversity of Ca2+ waveforms that can include stable and damped oscillations of low amplitude and frequency. Interestingly, our modeling results highlight a complementary role of ectonucleotidase activity, namely CD39, in controlling the ATP pool available to trigger such responses, by hydrolyzing ATP and ADP into AMP. This finding is particularly important since CD39 and its complementary CD73 ectonucleotidase, which hydrolyzes AMP, undergo significant expression changes when microglia are activated (Jakovljevic et al., 2019).
Our simulations indicate that the distinct Ca2+ waveforms shaped by P2 receptors and CD39 selectivity control downfield signaling pathways. We investigated this selective control by simulating migration versus cytokine production responses as a function of the Ca2+ waveforms generated by P2 receptors. Our model indicates that short-duration, oscillatory Ca2+ transients induced by P2Y receptors and P2X4 with micromolar ATP are sufficient to promote migration responses without significantly inducing TNFα production. On the other hand, millimolar ATP concentrations that activate P2X7 supported sustained cytosolic Ca2+ levels that could trigger TNFα release. In a similar vein, we can expect responses would vary with the types or combinations of nucleotides used to stimulate purinoreceptors. We demonstrate this as a proof-of-principle for UTP in Supplementary Figure S9. In this case, UTP selectively activates P2Y2 receptors (Sophocleous et al., 2020) and P2Y6 receptors (Jiang et al., 2017), while ionotropic P2 receptors are unresponsive to UTP (Visentin et al., 1999; Kanellopoulos et al., 2021). This resulted in moderate Ca2+ transients with spikes from IP3R activation, but lacked the high-amplitude fluctuations associated with P2X receptors; we anticipate that such transients would not be expected to induce significant TNFα production. Overall, these findings illustrate how microglia orchestrate complex cytokine and migration functions in response to ATP as well as other damage associated with molecular patterns like UTP (Cieślak et al., 2011).
The concerted roles of P2X, P2Y, and ectonucleotidase proteins in mediating cellular responses to ATP further suggest how changes in gene expression shape microglia responses to stimuli. For instance, higher P2Y12 expression in resting relative to pro-inflammatory microglia likely favor migration responses to ATP in the former. Similarly, elevated P2X4 and P2X7 expression in pro-inflammatory microglia sensitize cytokine responses to ATP. These differences in microglia responses following changes in gene expression underscore the need for models to account for changes in protein activity.
Robust characterization of detailed signaling networks in diverse microglia phenotypes remains a significant challenge. This is especially challenging for tissue resident microglia that are difficult to experimentally manipulate in situ. For this reason, we tested if our model could leverage mRNA transcript data from the BV2 microglial cell line to approximate changes in P2 receptor activity. Using those mRNA data, we found that the model predicted Ca2+ waveforms and migration responses to ATP that were reasonably consistent with experiments we conducted using the BV2 microglia cell line. This raises the possibility that coupling models trained from cultured primary or immortalized cells in vitro with transcriptomic and proteomic data could enable predictions of cellular responses from in vivo or disease-associated microglia, for which extensive functional testing is not feasible. Related to this, since dysfunctional microglial responses are associated with neurological disorders including chronic pain, Alzheimer’s Disease and Parkinson’s Diseases (GBD 2017 US Neurological Disorders Collaborators, 2021), our computational model may be an invaluable tool to probe mechanisms underlying these diseases. Toward this end, future experiments could investigate model predictions, such as assessing how partial CD39-inhibition influences microglia migration and cytokine production. Similarly, quantitative experimental characterization of other microglial processes dependent on Akt and Ca2+ could be helpful, such as cytoskeletal rearrangement (Nishimoto et al., 2021), phagocytosis (Olmedillas Del Moral et al., 2019), and autophagy (Jiang et al., 2019; Desale et al., 2021).
The data analyzed in this study was obtained from https://github.com/huskeypm/pkh-lab-analyses/tree/master/2021-P2Y-microglia. Requests to access these datasets should be directed to the corresponding authors.
BC: Main author. Designed the experiment, finalized the hypotheses, and constructed the mathematical model to test the hypotheses. SA: Co-author. Performed the experiment to provide the supporting evidence and data to conclude the computational model. PV: Finalized the revision and submission. BS: Implemented the image processing script JB: Performed the analysis CR: Oversaw and supervised the experiment AB: Advisory position for the project PK-H: Oversaw and supervised the project.
Research reported in this publication was supported by the Maximizing Investigators’ Research Award (MIRA) (R35) from the National Institute of General Medical Sciences (NIGMS) of the National Institutes of Health (NIH) under grant number R35GM124977 (PK-H), as well as under award numbers R21AG066865 and R01NS103785 (AB). CIR was supported under PCRTF 1000200168. This work used the Extreme Science and Engineering Discovery Environment (XSEDE) (Olmedillas Del Moral et al., 2019), which is supported by National Science Foundation grant number ACI-1548562. All the figures are processed or adapted from BioRender.com.
The authors declare that the research was conducted in the absence of any commercial or financial relationships that could be construed as a potential conflict of interest.
All claims expressed in this article are solely those of the authors and do not necessarily represent those of their affiliated organizations, or those of the publisher, the editors and the reviewers. Any product that may be evaluated in this article, or claim that may be made by its manufacturer, is not guaranteed or endorsed by the publisher.
The Supplementary Material for this article can be found online at: https://www.frontiersin.org/articles/10.3389/fphys.2022.1037417/full#supplementary-material
Adams D. J., Friedrich O., Murphy R. M., Kuenzel K., Gilbert D. F., Zacharewicz E., et al. (2016). Store-operated ca2+ entry (soce) and purinergic receptor-mediated ca2+ homeostasis in murine bv2 microglia cells: Early cellular responses to atp-mediated microglia activation. Front. Mol. Neurosci. 9, 1–15. doi:10.3389/fnmol.2016.00111
Aronsen J. M., Swift F., Sejersted O. M. (2013). Cardiac sodium transport and excitation–contraction coupling. J. Mol. Cell. Cardiol. 61, 11–19. doi:10.1016/j.yjmcc.2013.06.003
Asatryan L., Ostrovskaya O., Lieu D., Davies D. L. (2018). Ethanol differentially modulates p2x4 and p2x7 receptor activity and function in bv2 microglial cells. Neuropharmacology 128, 11–21. doi:10.1016/j.neuropharm.2017.09.030
Barberà-Cremades M., Baroja-Mazo A., Gomez A. I., Machado F., Di Virgilio F., Pelegrín P. (2012). P2x7 receptor-stimulation causes fever via pge2 and il-1β release. FASEB J. 26 (7), 2951–2962. doi:10.1096/fj.12-205765
Barbera-Cremades M., Gomez A. I., Baroja-Mazo A., Martinez-Alarcon L., Martinez C. M., de Torre-Minguela C., et al. (2017). P2X7 receptor induces tumor necrosis factor-α converting enzyme activation and release to boost TNF-α production. Front. Immunol. 8, 862. doi:10.3389/fimmu.2017.00862
Bazzazi H., Sang L., Dick I. E., Joshi-Mukherjee R., Yang W., Yue D. T. (2015). Novel fluorescence resonance energy transfer-based reporter reveals differential calcineurin activation in neonatal and adult cardiomyocytes. J. Physiology 593, 3865–3884. doi:10.1113/JP270510
Bianco F., Fumagalli M., Pravettoni E., D’Ambrosi N., Volonte C., Matteoli M., et al. (2005). Pathophysiological roles of extracellular nucleotides in glial cells: Differential expression of purinergic receptors in resting and activated microglia. Brain Res. Rev. 48, 144–156. Glial-Neuron Crosstalk in Neuroinflammation, Neurodegeneration and Neuroprotection. doi:10.1016/j.brainresrev.2004.12.004
Borea A., P., Gessi S., Merighi S., Vincenzi F., Varani K. (2018). Pharmacology of adenosine receptors: The state of the art. Physiol. Rev. 98, 1591–1625. doi:10.1152/physrev.00049.2017
Brautigam V. M., Frasier C., Nikodemova M., Watters J. J. (2005). Purinergic receptor modulation of bv-2 microglial cell activity: Potential involvement of p38 map kinase and creb. J. Neuroimmunol. 166, 113–125. doi:10.1016/j.jneuroim.2005.05.012
Cao P., Donovan G., Falcke M., Sneyd J. (2013). A stochastic model of calcium puffs based on single-channel data. Biophysical J. 105, 1133–1142. doi:10.1016/j.bpj.2013.07.034
Cao P., Tan X., Donovan G., Sanderson M. J., Sneyd J. (2014). A deterministic model predicts the properties of stochastic calcium oscillations in airway smooth muscle cells. PLoS Comput. Biol. 10, e1003783. doi:10.1371/journal.pcbi.1003783
Chessell I. P., Michel A. D., Humphrey P. P. A. (1997). Properties of the pore-forming P2X7 purinoceptor in mouse NTW8 microglial cells. Br. J. Pharmacol. 121, 1429–1437. doi:10.1038/sj.bjp.0701278
Chun B. J., Stewart B. D., Vaughan D. D., Bachstetter A. D., Kekenes-Huskey P. M. (2019). Simulation of p2x-mediated calcium signalling in microglia. J. Physiology 597 (3), 799–818. doi:10.1113/JP277377
Cianciulli A., Porro C., Calvello R., Trotta T., Lofrumento D. D., Panaro M. A. (2020). Microglia mediated neuroinflammation: Focus on pi3k modulation. Biomolecules 10, 137. doi:10.3390/biom10010137
Cieślak M., Kukulski F., Komoszyński M. (2011). Emerging role of extracellular nucleotides and adenosine in multiple sclerosis. Purinergic Signal. 7, 393–402. doi:10.1007/s11302-011-9250-y
Colella M., Zinni M., Pansiot J., Cassanello M., Mairesse J., Ramenghi L., et al. (2018). Modulation of microglial activation by adenosine a2a receptor in animal models of perinatal brain injury. Front. neurology 9, 605. doi:10.3389/fneur.2018.00605
Cooling M. T., Hunter P., Crampin E. J. (2009). Sensitivity of NFAT cycling to cytosolic calcium concentration: Implications for hypertrophic signals in cardiac myocytes. Biophysical J. 96, 2095–2104. doi:10.1016/j.bpj.2008.11.064
Crain J. M., Nikodemova M., Watters J. J. (2009). Expression of p2 nucleotide receptors varies with age and sex in murine brain microglia. J. neuroinflammation 6, 24. doi:10.1186/1742-2094-6-24
Crain J. M., Watters J. J. (2015). Microglial p2 purinergic receptor and immunomodulatory gene transcripts vary by region, sex and age in the healthy mouse cns. Transcr. open access 3, 124. doi:10.4172/2329-8936.1000124
Cuthbertson K., Chay T. (1991). Modelling receptor-controlled intracellular calcium oscillators. Cell. calcium 12, 97–109. doi:10.1016/0143-4160(91)90012-4
De Pascalis C., Etienne-Manneville S. (2017). Single and collective cell migration: The mechanics of adhesions. Mol. Biol. Cell. 28, 1833–1846. doi:10.1091/mbc.E17-03-0134
De Young G. W., Keizer J. (1992). A single-pool inositol 1, 4, 5-trisphosphate-receptor-based model for agonist-stimulated oscillations in ca2+ concentration. Proc. Natl. Acad. Sci. 89, 9895–9899. doi:10.1073/pnas.89.20.9895
Desale S. E., Chidambaram H., Chinnathambi S. (2021). G-protein coupled receptor, pi3k and rho signaling pathways regulate the cascades of tau and amyloid-β in alzheimer’s disease. Mol. Biomed. 2, 1–18. doi:10.1186/s43556-021-00036-1
Divolis G., Mavroeidi P., Mavrofrydi O., Papazafiri P. (2016). Differential effects of calcium on PI3K-Akt and HIF-1α survival pathways. Cell. Biol. Toxicol. 32 (5), 437–449. doi:10.1007/s10565-016-9345-x
Dou Y., Wu H.-j., Li H.-q., Qin S., Wang Y.-e., Li J., et al. (2012). Microglial migration mediated by atp-induced atp release from lysosomes. Cell. Res. 22, 1022–1033. doi:10.1038/cr.2012.10
Egan T. M., Khakh B. S. (2004). Contribution of calcium ions to p2x channel responses. J. Neurosci. 24, 3413–3420. doi:10.1523/JNEUROSCI.5429-03.2004
Erb I., Notredame C. (2016). How should we measure proportionality on relative gene expression data? Theory Biosci. 135, 21–36. doi:10.1007/s12064-015-0220-8
Erb L., Weisman G. A. (2012). Coupling of p2y receptors to g proteins and other signaling pathways. Wiley Interdiscip. Rev. 1, 789–803. doi:10.1002/wmts.62
Etienne F., Mastrolia V., Maroteaux L., Girault J.-A., Gervasi N., Roumier A. (2019). Two-photon imaging of microglial processes’ attraction toward atp or serotonin in acute brain slices. JoVE J. Vis. Exp. 143, e58788. doi:10.3791/58788
Fan Y., Xie L., Chung C. Y. (2017). Signaling pathways controlling microglia chemotaxis. Mol. cells 40, 163–168. doi:10.14348/molcells.2017.0011
Färber K., Markworth S., Pannasch U., Nolte C., Prinz V., Kronenberg G., et al. (2008). The ectonucleotidase cd39/entpdase1 modulates purinergic-mediated microglial migration. Glia 56 (3), 331–341. doi:10.1002/glia.20606
Faroqi A. H., Lim M. J., Kee E. C., Lee J. H., Burgess J. D., Chen R., et al. (2021). In vivo detection of extracellular adenosine triphosphate in a mouse model of traumatic brain injury. J. neurotrauma 38 (5), 655–664. doi:10.1089/neu.2020.7226
Ferreira R., Schlichter L. C. (2013). Selective activation of kca31 and crac channels by p2y2 receptors promotes ca2+ signaling, store refilling and migration of rat microglial cells. PLOS ONE 8, e62345. doi:10.1371/journal.pone.0062345
Franco-Bocanegra D. K., McAuley C., Nicoll J. A., Boche D. (2019). Molecular mechanisms of microglial motility: Changes in ageing and alzheimer’s disease. Cells 8, 639. doi:10.3390/cells8060639
Garcia-Guzman M., Soto F., Gomez-Hernandez J. M., Lund P. E., Stuehmer W. (1997). Characterization of recombinant human P2X4 receptor reveals pharmacological differences to the rat homologue. Mol. Pharmacol. 51, 109–118. doi:10.1124/mol.51.1.109
GBD 2017 US Neurological Disorders Collaborators (2021). Burden of neurological disorders across the us from 1990-2017: A global burden of disease study. JAMA Neurol. 78 (2), 165–176. doi:10.1001/jamaneurol.2020.4152
Gomez Morillas A., Besson V. C., Lerouet D. (2021). Microglia and neuroinflammation: What place for p2ry12? Int. J. Mol. Sci. 22, 1636. doi:10.3390/ijms22041636
Gyoneva S., Orr A. G., Traynelis S. F. (2009). Differential regulation of microglial motility by atp/adp and adenosine. Park. Relat. Disord. 15, S195–S199. Proceedings of WFN XVIII World Congress on Parkinson’s Disease and Related Disorders. doi:10.1016/S1353-8020(09)70813-2–
Hagen B. M., Boyman L., Kao J. P. Y., Lederer W. J. (2012). A comparative assessment of fluo ca2+ indicators in rat ventricular myocytes. Cell. calcium 52, 170–181. doi:10.1016/j.ceca.2012.05.010
Hake J., Edwards A., Yu Z., Kekenes-Huskey P., Michailova A., Mccammon J., et al. (2012). Modelling cardiac calcium sparks in a three-dimensional reconstruction of a calcium release unit. J. Physiology 590, 4403–4422. doi:10.1113/jphysiol.2012.227926
Harris J. J., Jolivet R., Attwell D. (2012). Synaptic energy use and supply. Neuron 75 (5), 762–777. doi:10.1016/j.neuron.2012.08.019
Haynes S. E., Hollopeter G., Yang G., Kurpius D., Dailey M. E., Gan W.-B., et al. (2006). The p2y 12 receptor regulates microglial activation by extracellular nucleotides. Nat. Neurosci. 9, 1512–1519. doi:10.1038/nn1805
He Y., Yao X., Taylor N., Bai Y., Lovenberg T., Bhattacharya A. (2018). Rna sequencing analysis reveals quiescent microglia isolation methods from postnatal mouse brains and limitations of bv2 cells. J. neuroinflammation 15, 1–13. doi:10.1186/s12974-018-1195-4
Heineke J., Molkentin J. D. (2006). Regulation of cardiac hypertrophy by intracellular signalling pathways. Nat. Rev. Mol. Cell. Biol. 7, 589–600. doi:10.1038/nrm1983
Hickman S. E., Kingery N. D., Ohsumi T. K., Borowsky M. L., Wang L.-c., Means T. K., et al. (2013). The microglial sensome revealed by direct rna sequencing. Nat. Neurosci. 16, 1896–1905. doi:10.1038/nn.3554
Hide I., Tanaka M., Inoue A., Nakajima K., Kohsaka S., Inoue K., et al. (2000). Extracellular ATP triggers tumor necrosis factor-alpha release from rat microglia. J. Neurochem. 75 (3), 965–972. doi:10.1046/j.1471-4159.2000.0750965.x
Hoffmann A., Kann O., Ohlemeyer C., Hanisch U.-K., Kettenmann H. (2003). Elevation of basal intracellular calcium as a central element in the activation of brain macrophages (microglia): Suppression of receptor-evoked calcium signaling and control of release function. official J. Soc. Neurosci. 23, 4410–4419. doi:10.1523/JNEUROSCI.23-11-04410.2003
Ikeda M., Tsuno S., Sugiyama T., Hashimoto A., Yamoto K., Takeuchi K., et al. (2013). Ca(2+) spiking activity caused by the activation of store-operated Ca(2+) channels mediates TNF-α release from microglial cells under chronic purinergic stimulation. Biochim. Biophys. Acta. 1833, 2573–2585. doi:10.1016/j.bbamcr.2013.06.022
Irino Y., Nakamura Y., Inoue K., Kohsaka S., Ohsawa K. (2008). Akt activation is involved in p2y12 receptor-mediated chemotaxis of microglia. J. Neurosci. Res. 86, 1511–1519. doi:10.1002/jnr.21610
Ito D., Tanaka K., Suzuki S., Dembo T., Fukuuchi Y. (2001). Enhanced expression of Iba1, ionized calcium-binding adapter molecule 1, after transient focal cerebral ischemia in rat brain. Stroke 32, 1208–1215. doi:10.1161/01.str.32.5.1208
Jacobson K. A., Costanzi S., Joshi B. V., Besada P., Shin D. H., Ko H., et al. (2006). “Agonists and antagonists for p2 receptors,” in Novartis foundation symposium (Hoboken, NJ: Wiley Online Library), 276, 58.
Jakovljevic M., Lavrnja I., Bozic I., Milosevic A., Bjelobaba I., Savic D., et al. (2019). Induction of ntpdase1/cd39 by reactive microglia and macrophages is associated with the functional state during eae. Front. Neurosci. 13, 410. doi:10.3389/fnins.2019.00410
Jiang G. M., Tan Y., Wang H., Peng L., Chen H. T., Meng X. J., et al. (2019). The relationship between autophagy and the immune system and its applications for tumor immunotherapy. Mol. cancer 18, 17. doi:10.1186/s12943-019-0944-z
Jiang P., Xing F., Guo B., Yang J., Li Z., Wei W., et al. (2017). Nucleotide transmitters atp and adp mediate intercellular calcium wave communication via p2y12/13 receptors among bv-2 microglia. PLOS ONE 12, e0183114. doi:10.1371/journal.pone.0183114
Kanellopoulos J., Almeida-da Silva C., Rüütel Boudinot S., Ojcius D. (2021). Structural and functional features of the p2x4 receptor: An immunological perspective. Front. Immunol. 12, 645834. doi:10.3389/fimmu.2021.645834
Kekenes-Huskey P. M., Eun C., McCammon J. A. (2015). Enzyme localization, crowding, and buffers collectively modulate diffusion-influenced signal transduction: Insights from continuum diffusion modeling. J. Chem. Phys. 143, 094103. doi:10.1063/1.4929528
Kettenmann H., Hanisch U.-K., Noda M., Verkhratsky A. (2011). Physiology of microglia. Physiol. Rev. 91, 461–553. doi:10.1152/physrev.00011.2010
Khadra A., Yan Z., Coddou C., Tomic M., Sherman A., Stojilkovic S. S. (2012). Gating properties of the P2X2a and P2X2b receptor channels: Experiments and mathematical modeling. J. general physiology 139, 333–348. doi:10.1085/jgp.201110716
Kigerl K. A., de Rivero Vaccari J. P., Dietrich W. D., Popovich P. G., Keane R. W. (2014). Pattern recognition receptors and central nervous system repair. Exp. Neurol. 258, 5–16. doi:10.1016/j.expneurol.2014.01.001
Koshimizu T. A., Van Goor F., Tomic M., Wong A. O., Tanoue A., Tsujimoto G., et al. (2000). Characterization of calcium signaling by purinergic receptor-channels expressed in excitable cells. Mol. Pharmacol. 58 (5), 936–945. doi:10.1124/mol.58.5.936
Kukulski F., Levesque S., Lavoie E., Lecka J., Bigonnesse F., Knowles A., et al. (2005). Comparative hydrolysis of p2 receptor agonists by ntpdases 1, 2, 3 and 8. Purinergic Signal. 1, 193–204. doi:10.1007/s11302-005-6217-x
Langfelder A., Okonji E., Deca D., Wei W., Glitsch M. (2015). Extracellular acidosis impairs p2y receptor-mediated ca(2+) signalling and migration of microglia. Cell. calcium 57, 247–256. doi:10.1016/j.ceca.2015.01.004
Li S., Wang Q., Wang Y., Chen X., Wang Z. (2009). PLC-gamma1 and Rac1 coregulate EGF-induced cytoskeleton remodeling and cell migration. Mol. Endocrinol. 23, 901–913. doi:10.1210/me.2008-0368
Li W.-H., Qiu Y., Zhang H.-Q., Tian X.-X., Fang W.-G. (2015). P2y2 receptor and egfr cooperate to promote prostate cancer cell invasion via erk1/2 pathway. PLoS One 10, e0133165. doi:10.1371/journal.pone.0133165
Litosch I. G. (2013). Protein co-signaling and challenges for translational research. Transl. Neurosci. 4, 66–73. doi:10.2478/s13380-013-0102-9
Lively S., Schlichter L. C. (2013). The microglial activation state regulates migration and roles of matrix-dissolving enzymes for invasion. J. neuroinflammation 10, 1–14. doi:10.1186/1742-2094-10-75
Lock J. T., Parker I., Smith I. F. (2015). A comparison of fluorescent Ca²⁺ indicators for imaging local Ca²⁺ signals in cultured cells. Cell. Calcium 58, 638–648. doi:10.1016/j.ceca.2015.10.003
Matyash M., Zabiegalov O., Wendt S., Matyash V., Kettenmann H. (2017). The adenosine generating enzymes cd39/cd73 control microglial processes ramification in the mouse brain. PLoS One 12, e0175012. doi:10.1371/journal.pone.0175012
Melani A., Turchi D., Vannucchi M., Cipriani S., Gianfriddo M., Pedata F. (2017). Atp extracellular concentrations are increased in the rat striatum during in vivo ischemia. Neurochem. Int. 47 (6), 442–448. doi:10.1016/j.neuint.2005.05.014
Merighi S., Bencivenni S., Vincenzi F., Varani K., Borea P. A., Gessi S. (2017). A2b adenosine receptors stimulate il-6 production in primary murine microglia through p38 mapk kinase pathway. Pharmacol. Res. 117, 9–19. doi:10.1016/j.phrs.2016.11.024
Miller A. M., Stella N. (2009). Microglial cell migration stimulated by atp and c5a involve distinct molecular mechanisms: Quantification of migration by a novel near-infrared method. Glia 57, 875–883. doi:10.1002/glia.20813
Mogilner A., Edelstein-Keshet L. (2002). Regulation of actin dynamics in rapidly moving cells: A quantitative analysis. Biophysical J. 83 (3), 1237–1258. doi:10.1016/S0006-3495(02)73897-6
Moro N., Ghavim S., Sutton R. (2021). Massive efflux of adenosine triphosphate into the extracellular space immediately after experimental traumatic brain injury. Exp. Ther. Med. 21, 575. doi:10.3892/etm.2021.10007
Nagamoto-Combs K., Combs C. K. (2010). Microglial phenotype is regulated by activity of the transcription factor, NFAT (nuclear factor of activated T cells). J. Neurosci. 30, 9641–9646. doi:10.1523/JNEUROSCI.0828-10.2010
Nayak D., Roth T. L., McGavern D. B. (2014). Microglia development and function. Annu. Rev. Immunol. 32, 367–402. doi:10.1146/annurev-immunol-032713-120240
Nguyen H. M., Blomster L. V., Christophersen P., Wulff H. (2017). Potassium channel expression and function in microglia: Plasticity and possible species variations. Channels 11 (4), 305–315. doi:10.1080/19336950.2017.1300738
Nguyen H. M., di Lucente J., Chen Y.-J., Cui Y., Ibrahim R. H., Pennington M. W., et al. (2020). Biophysical basis for kv1 3 regulation of membrane potential changes induced by p2x4-mediated calcium entry in microglia. Glia 68, 2377–2394. doi:10.1002/glia.23847
Nishimoto R., Derouiche S., Eto K., Deveci A., Kashio M., Kimori Y., et al. (2021). Thermosensitive trpv4 channels mediate temperature-dependent microglia movement. Proc. Natl. Acad. Sci. U. S. A. 118, e2012894118. doi:10.1073/pnas.2012894118
Noda M., Verkhratsky A. (2012). “Physiology of microglia,” in Neuroglia. Editors B. Kettenmann, and B. R. Ransom 3 ed. (Oxford, United Kingdom: Oxford University Press), 223–237.
O’Brien J. J., O’Callaghan J. P., Miller D. B., Chalgeri S., Wennogle L. P., Davis R. E., et al. (2020). Inhibition of calcium-calmodulin-dependent phosphodiesterase (pde1) suppresses inflammatory responses. Mol. Cell. Neurosci. 102, 103449. doi:10.1016/j.mcn.2019.103449
Ohsawa K., Imai Y., Sasaki Y., Kohsaka S. (2004). Microglia/macrophage-specific protein Iba1 binds to fimbrin and enhances its actin-bundling activity. J. Neurochem. 88 (4), 844–856. doi:10.1046/j.1471-4159.2003.02213.x
Ohsawa K., Irino Y., Nakamura Y., Akazawa C., Inoue K., Kohsaka S. (2007). Involvement of p2x4 and p2y12 receptors in atp-induced microglial chemotaxis. Glia 55, 604–616. doi:10.1002/glia.20489
Olmedillas Del Moral M., Asavapanumas N., Uzcátegui N. L., Garaschuk O. (2019). Healthy brain aging modifies microglial calcium signaling in vivo. Int. J. Mol. Sci. 3, 589–139. doi:10.3390/ijms20030589
Orr A. G., Orr A. L., Li X.-J., Gross R. E., Traynelis S. F. (2009). Adenosine a(2a) receptor mediates microglial process retraction. Nat. Neurosci. 12 (7), 872–878. doi:10.1038/nn.2341
Patrizio M. (2004). Tumor necrosis factor reduces camp production in rat microglia. Glia 48 (3), 241–249. doi:10.1002/glia.20074
Peglow M., Niemeyer B. A., Hoth M., Rieger H. (2013). Interplay of channels, pumps and organelle location in calcium microdomain formation. New J. Phys. 15, 055022. doi:10.1088/1367-2630/15/5/055022
Peng J., Liu Y., Umpierre A. D., Xie M., Tian D. S., Richardson J. R., et al. (2019). Microglial p2y12 receptor regulates ventral hippocampal ca1 neuronal excitability and innate fear in mice. Mol. Brain 12, 71. doi:10.1186/s13041-019-0492-x
Petzold L. (1983). Automatic selection of methods for solving stiff and nonstiff systems of ordinary differential equations. SIAM J. Sci. Stat. Comput. 4 (1), 136–148. doi:10.1137/0904010
Rahmaninejad H., Pace T., Bhatt S., Sun B., Kekenes-Huskey P. (2020). Co-localization and confinement of ecto-nucleotidases modulate extracellular adenosine nucleotide distributions. PLoS Comput. Biol. 16, e1007903. doi:10.1371/journal.pcbi.1007903
Robinson L. E., Murrell-Lagnado R. D. (2013). The trafficking and targeting of p2x receptors. Front. Cell. Neurosci. 7, 233. doi:10.3389/fncel.2013.00233
Robson S. C., Sevigny J., Zimmermann H. (2006). The e-ntpdase family of ectonucleotidases: Structure function relationships and pathophysiological significance. Purinergic Signal. 2, 409–430. doi:10.1007/s11302-006-9003-5
Sandefur C. I., Boucher R. C., Elston T. C. (2017). Mathematical model reveals role of nucleotide signaling in airway surface liquid homeostasis and its dysregulation in cystic fibrosis. Proc. Natl. Acad. Sci. 114, E7272–E7281. doi:10.1073/pnas.1617383114
Satulovsky J., Lui R., Wang Y.-l. (2008). Exploring the control circuit of cell migration by mathematical modeling. Biophysical J. 94 (9), 3671–3683. doi:10.1529/biophysj.107.117002
Schafer D. P., Lehrman E. K., Kautzman A. G., Koyama R., Mardinly A. R., Yamasaki R., et al. (2012). Microglia sculpt postnatal neural circuits in an activity and complement-dependent manner. Neuron 74, 691–705. doi:10.1016/j.neuron.2012.03.026
Shannon T. R., Wang F., Puglisi J., Weber C., Bers D. M. (2004). A mathematical treatment of integrated Ca dynamics within the ventricular myocyte. Biophysical J. 87 (5), 3351–3371. doi:10.1529/biophysj.104.047449
Shigetomi E., Kracun S., Sofroniew M. V., Khakh B. S. (2010). A genetically targeted optical sensor to monitor calcium signals in astrocyte processes. Nat. Neurosci. 13, 759–766. doi:10.1038/nn.2557
Shimizu S., Yoshida T., Wakamori M., Ishii M., Okada T., Takahashi M., et al. (2006). Ca2+–calmodulin-dependent myosin light chain kinase is essential for activation of trpc5 channels expressed in hek293 cells. J. physiology 570, 219–235. doi:10.1113/jphysiol.2005.097998
Skupin A., Kettenmann H., Falcke M. (2010). Calcium signals driven by single channel noise. PLOS Comput. Biol. 6, 1000870. doi:10.1371/journal.pcbi.1000870
Skupin A., Kettenmann H., Winkler U., Wartenberg M., Sauer H., Tovey S. C., et al. (2008). How does intracellular Ca2+ oscillate: By chance or by the clock? Biophysical J. 94 (6), 2404–2411. doi:10.1529/biophysj.107.119495
Smedler E., Uhlén P. (1840). Frequency decoding of calcium oscillations. Biochimica Biophysica Acta (BBA) - General Subj. 3 (2014), 964–969. doi:10.1016/j.bbagen.2013.11.015
Sneyd J., Keizer J., Sanderson M. J. (1995). Mechanisms of calcium oscillations and waves: A quantitative analysis. FASEB J. 9, 1463–1472. doi:10.1096/fasebj.9.14.7589988
Sophocleous A., R., Miles A., N., Ooi L., Sluyter R. (2020). P2y2 and p2x4 receptors mediate ca2+ mobilization in dh82 canine macrophage cells. Int. J. Mol. Sci. 21, 8572. doi:10.3390/ijms21228572
Stebbing M. J., Cottee J. M., Rana I. (2015). The role of ion channels in microglial activation and Proliferation - A complex interplay between ligand-gated ion channels, K(+) channels, and intracellular Ca(2). Front. Immunol. 6, 497. doi:10.3389/fimmu.2015.00497
Stephens L., Milne L., Hawkins P. (2008). Moving towards a better understanding of chemotaxis. Curr. Biol. 18, R485–R494. doi:10.1016/j.cub.2008.04.048
Stewart B. D., Scott C. E., McCoy T. P., Yin G., Despa F., Despa S., et al. (2018). Computational modeling of amylin-induced calcium dysregulation in rat ventricular cardiomyocytes. Cell. Calcium 71, 65–74. doi:10.1016/j.ceca.2017.11.006
Stogsdill J. A., Eroglu C. (2017). The interplay between neurons and glia in synapse development and plasticity. Curr. Opin. Neurobiol. 42, 1–8. doi:10.1016/j.conb.2016.09.016
Swiatkowski P., Murugan M., Eyo U., Wang Y., Rangaraju S., Oh S., et al. (2016). Activation of microglial p2y12 receptor is required for outward potassium currents in response to neuronal injury. Neuroscience 318, 22–33. doi:10.1016/j.neuroscience.2016.01.008
Tatsumi E., Yamanaka H., Kobayashi K., Yagi H., Sakagami M., Noguchi K. (2015). Rhoa/rock pathway mediates p38 mapk activation and morphological changes downstream of p2y12/13 receptors in spinal microglia in neuropathic pain. Glia 63 (2), 216–228. doi:10.1002/glia.22745
Toulme E., Khakh B. S. (2012). Imaging P2X4 receptor lateral mobility in microglia: Regulation by calcium and p38 MAPK. J. Biol. Chem. 287, 14734–14748. doi:10.1074/jbc.M111.329334
Towns J., Cockerill T., Dahan M., Foster I., Gaither K., Grimshaw A., et al. (2014). XSEDE: Accelerating scientific Discovery. Comput. Sci. Eng. 16, 62–74. doi:10.1109/mcse.2014.80
Tozaki-Saitoh H., Miyata H., Yamashita T., Matsushita K., Tsuda M., Inoue K. (2017). P2Y12 receptors in primary microglia activate nuclear factor of activated T-cell signaling to induce C-C chemokine 3 expression. J. Neurochem. 141, 100–110. doi:10.1111/jnc.13968
Trang T., Beggs S., Wan X., Salter M. W. (2009). P2X4-Receptor-Mediated synthesis and release of brain-derived neurotrophic factor in microglia is dependent on calcium and p38-mitogen-activated protein kinase activation. J. Neurosci. 29, 3518–3528. doi:10.1523/JNEUROSCI.5714-08.2009
Tvrdik P., Kalani M. Y. S. (2017). In vivo imaging of microglial calcium signaling in brain inflammation and injury. Int. J. Mol. Sci. 18, 2366. doi:10.3390/ijms18112366
Tyson J. J. (2002). Biochemical oscillations. Comput. Cell. Biol. 20, 230–260. doi:10.1007/978-0-387-22459-6_9
Umpierre A. D., Bystrom L. L., Ying Y., Liu Y. U., Worrell G., Wu L.-J. (2020). Microglial calcium signaling is attuned to neuronal activity in awake mice. Elife 9, e56502. doi:10.7554/eLife.56502
Umpierre A. D., Wu L.-J. (2021). How microglia sense and regulate neuronal activity. Glia 69 (2021), 1637–1653. doi:10.1002/glia.23961
Van Liedekerke P., Neitsch J., Johann T., Alessandri K., Nassoy P., Drasdo D. (2019). Quantitative cell-based model predicts mechanical stress response of growing tumor spheroids over various growth conditions and cell lines. PLoS Comput. Biol. 15, e1006273. doi:10.1371/journal.pcbi.1006273
Venkateswarlu K., Suman G., Dhyani V., Swain S., Giri L., Samavedi S. (2020). Three-dimensional imaging and quantification of real-time cytosolic calcium oscillations in microglial cells cultured on electrospun matrices using laser scanning confocal microscopy. Biotechnol. Bioeng. 117 (10), 3108–3123. doi:10.1002/bit.27465
Visentin S., Renzi M., Frank C., Greco A., Levi G. (1999). Two different ionotropic receptors are activated by atp in rat microglia. J. Physiology 3 (3), 723–736. doi:10.1111/j.1469-7793.1999.0723n.x
Weisman G. A., Camden J. M., Peterson T. S., Ajit D., Woods L. T., Erb L. (2012). P2 receptors for extracellular nucleotides in the central nervous system: Role of P2X7 and P2Y₂ receptor interactions in neuroinflammation. Mol. Neurobiol. 46, 96–113. doi:10.1007/s12035-012-8263-z
Wu L. J., Vadakkan K. I., Zhuo M. (2007). Atp-induced chemotaxis of microglial processes requires p2y receptor-activated initiation of outward potassium currents. Glia 55, 810–821. doi:10.1002/glia.20500
Xu Z., Chen Z.-M., Wu X., Zhang L., Cao Y., Zhou P. (2020). Distinct molecular mechanisms underlying potassium efflux for nlrp3 inflammasome activation. Front. Immunol. 11, 609441. doi:10.3389/fimmu.2020.609441
Yan Z., Khadra A., Li S., Tomic M., Sherman A., Stojilkovic S. S. (2010). Experimental characterization and mathematical modeling of P2X7 receptor channel gating. J. Neurosci. 30, 14213–14224. doi:10.1523/JNEUROSCI.2390-10.2010
Yao H., Duan M., Yang L., Buch S. (2013). Nonmuscle myosin light-chain kinase mediates microglial migration induced by hiv tat: Involvement of β1 integrins. FASEB J. 27 (4), 1532–1548. doi:10.1096/fj.12-219600
Yaron J., Gangaraju S., Rao M., Kong X., Zhang L., Su F., et al. (2015). K+ regulates ca 2+ to drive inflammasome signaling: Dynamic visualization of ion flux in live cells. Cell. death Dis. 6, e1954. doi:10.1038/cddis.2015.277
Young P., Ferguson C., Bañuelos S., Gautel M. (1998). Molecular structure of the sarcomeric Z-disk: Two types of titin interactions lead to an asymmetrical sorting of α-actinin. EMBO J. 17 (6), 1614–1624. doi:10.1093/emboj/17.6.1614
Zawadzka M., Dabrowski M., Gozdz A., Szadujkis B., Sliwa M., Lipko M., et al. (2012). Early steps of microglial activation are directly affected by neuroprotectant FK506 in both in vitro inflammation and in rat model of stroke. J. Mol. Med. 90, 1459–1471. doi:10.1007/s00109-012-0925-9
Zhang S., Jin G., Zhang X.-S., Chen L. (2007). Discovering functions and revealing mechanisms at molecular level from biological networks. Proteomics 7, 2856–2869. doi:10.1002/pmic.200700095
Zhang X., Ye P., Wang D., Liu Y., Cao L., Wang Y., et al. (2019). Involvement of RhoA/ROCK signaling in aβ-induced chemotaxis, cytotoxicity and inflammatory response of microglial BV2 cells. Cell. Mol. Neurobiol. 39 (5), 637–650. doi:10.1007/s10571-019-00668-6
Keywords: cells-monocytes/macrophages, processes-cell activation, processes-chemotaxis, processes-inflammation, processes-signal transduction, calcium
Citation: Chun BJ, Aryal SP, Varughese P, Sun B, Bruno JA, Richards CI, Bachstetter AD and Kekenes-Huskey PM (2023) Purinoreceptors and ectonucleotidases control ATP-induced calcium waveforms and calcium-dependent responses in microglia: Roles of P2 receptors and CD39 in ATP-stimulated microglia. Front. Physiol. 13:1037417. doi: 10.3389/fphys.2022.1037417
Received: 05 September 2022; Accepted: 12 December 2022;
Published: 09 January 2023.
Edited by:
Vijay Rajagopal, The University of Melbourne, AustraliaReviewed by:
Martin Thunemann, Boston University, United StatesCopyright © 2023 Chun, Aryal, Varughese, Sun, Bruno, Richards, Bachstetter and Kekenes-Huskey. This is an open-access article distributed under the terms of the Creative Commons Attribution License (CC BY). The use, distribution or reproduction in other forums is permitted, provided the original author(s) and the copyright owner(s) are credited and that the original publication in this journal is cited, in accordance with accepted academic practice. No use, distribution or reproduction is permitted which does not comply with these terms.
*Correspondence: Byeong J. Chun, YmNodW5AbHVjLmVkdQ==; Peter M. Kekenes-Huskey, aHVza2V5cG1AZ21haWwuY29t
Disclaimer: All claims expressed in this article are solely those of the authors and do not necessarily represent those of their affiliated organizations, or those of the publisher, the editors and the reviewers. Any product that may be evaluated in this article or claim that may be made by its manufacturer is not guaranteed or endorsed by the publisher.
Research integrity at Frontiers
Learn more about the work of our research integrity team to safeguard the quality of each article we publish.