 Diogo Luís Marques1*
 Henrique Pereira Neiva1,2
 Daniel Almeida Marinho1,2
 Ivan Miguel Pires3
 Célia Nunes4,5
 Mário Cardoso Marques1,2*
- 1Department of Sport Sciences, University of Beira Interior, Covilhã, Portugal
- 2Research Center in Sports Sciences, Health Sciences and Human Development (CIDESD), Covilhã, Portugal
- 3Instituto de Telecomunicações, Universidade da Beira Interior, Covilhã, Portugal
- 4Department of Mathematics, University of Beira Interior, Covilhã, Portugal
- 5Centre of Mathematics and Applications, University of Beira Interior, Covilhã, Portugal
Identifying the relative loads (%1RM) that maximize power output (Pmax-load) in resistance exercises can help design interventions to optimize muscle power in older adults. Moreover, examining the maximal mean power (MPmax) and peak power (PPmax) values (Watts) would allow an understanding of their differences and associations with functionality markers in older adults. Therefore, this research aimed to 1) analyze the load-mean and peak power relationships in the leg press and chest press in older adults, 2) examine the differences between mean Pmax-load (MPmax-load) and peak Pmax-load (PPmax-load) within resistance exercises, 3) identify the differences between resistance exercises in MPmax-load and PPmax-load, and 4) explore the associations between MPmax and PPmax in the leg press and chest press with functional capacity indicators. Thirty-two older adults (79.3 ± 7.3 years) performed the following tests: medicine ball throw (MBT), five-repetition sit-to-stand (STS), 10-m walking (10 W), and a progressive loading test in the leg press and chest press. Quadratic regressions analyzed 1) the load-mean and peak power relationships and identified the MPmax-load, MPmax, PPmax-load, and PPmax in both exercises, 2) the associations between MPmax and PPmax in the chest press with MBT, and 3) the associations between MPmax and PPmax in the leg press with STSpower and 10Wvelocity. In the leg press, the MPmax-load was ∼66% 1RM, and the PPmax-load was ∼62% 1RM, both for women and men (p > 0.05). In the chest press, the MPmax-load was ∼62% 1RM, and the PPmax-load was ∼56% 1RM, both for women and men (p > 0.05). There were differences between MPmax-load and PPmax-load within exercises (p < 0.01) and differences between exercises in MPmax-load and PPmax-load (p < 0.01). The MPmax and PPmax in the chest press explained ∼48% and ∼52% of the MBT-1 kg and MBT-3 kg variance, respectively. In the leg press, the MPmax and PPmax explained ∼59% of STSpower variance; however, both variables could not explain the 10Wvelocity performance (r2 ∼ 0.02). This study shows that the Pmax-load is similar between sexes, is resistance exercise-specific, and varies within exercises depending on the mechanical power variable used in older adults. Furthermore, this research demonstrates the influence of the MBT as an upper-limb power marker in older adults.
1 Introduction
As people age, a sharp decrease in muscle power (i.e., the product of force and velocity) contributes to the loss of functional independence and increases the risk of falls and death in older adults (Reid and Fielding, 2012; Byrne et al., 2016; McKinnon et al., 2017). Therefore, measuring muscle power levels is essential for detecting early signs of mobility disability and designing preventive strategies, such as resistance training (Alcazar et al., 2018a; Beaudart et al., 2019). According to several studies, the spectrum of relative loads (% of one-repetition maximum [1RM]) that maximize power output (Pmax-load) in older people differs between resistance exercises (Potiaumpai et al., 2016; Strand et al., 2019). For example, the Pmax-load range in the leg press is around 50%–70% 1RM, and in the chest press, between 40%–60% 1RM (de Vos et al., 2005; Potiaumpai et al., 2016; Ni and Signorile, 2017; Strand et al., 2019). Interestingly, a study that modeled the load-peak power relationship in participants aged ∼69 years did not observe differences between older women and men in the Pmax-load in several resistance machines (Strand et al., 2019). According to the authors, the faster muscle power losses in older male adults than female counterparts might contribute to a convergence in muscle power production with age (Strand et al., 2019). Nevertheless, more research on older adults of similar or older ages is needed to corroborate or refute these observations.
Most studies with older people that modeled the load-power relationship in resistance exercises have primarily prioritized the analysis of the peak power variable (de Vos et al., 2005; Potiaumpai et al., 2016; Ni and Signorile, 2017). However, according to several authors, researchers should also consider mean power values when testing muscle power due to their measurement reliability and potential association with functional capacity in older adults (Alcazar et al., 2017; 2018a). Furthermore, it is essential to understand the differences between mechanical power variables when modeling the Pmax-load for training prescription purposes. For example, regarding this matter, previous research with young trained adults observed that the Pmax-load is exercise-specific and differs according to the mechanical power variable measured (Pallarés et al., 2014; Sánchez-Medina et al., 2014; Soriano et al., 2015, 2017; Martínez-Cava et al., 2019). These differences indicate that it is essential to define beforehand what mechanical power variable will be measured and monitored during the training program (considering the features of the linear encoder) to avoid erroneous decisions regarding training prescription. Nevertheless, to our knowledge, no known studies compared the differences in the Pmax-load using the mean power (MPmax-load) and peak power (PPmax-load) values in lower and upper-limb resistance exercises in older people. Therefore, to improve the design of resistance training interventions, future research with older people must model the load-mean and peak power relationships in resistance exercises and examine eventual differences between MPmax-load and PPmax-load in the same exercise and the differences in MPmax-load and PPmax-load between resistance exercises.
In addition to analyzing the load-mean and peak power relationships to examine the pattern of mechanical power across a broad range of relative loads, it is also essential to examine the association between the maximal mean power (MPmax) and peak power (PPmax) values (Watts, W) with markers of functional capacity in older people. For example, several authors observed that the PPmax in the leg press and knee extension could explain 38% of the variance in the short physical performance battery test (i.e., balance, walk, and chair stand tests) in mobility-limited older adults aged 65 years or over (Bean et al., 2002). On the other hand, research with community-dwelling older people aged 70 years or over observed that leg press mean values could explain more of the short physical performance battery test variance than peak values (34% vs. 15%, respectively) (Alcazar et al., 2017). Nevertheless, research is scarce comparing the associations between MPmax and PPmax in the leg press with lower-limb functional capacity field tests, including chair stand and walking performance, meaning that this topic needs further investigation. Furthermore, to our knowledge, research is scarce regarding the associations between MPmax and PPmax in upper-limb resistance exercises, such as the chest press, with upper-limb functional capacity markers.
As suggested by some researchers, evaluating upper-limb muscle power can provide essential information regarding the functionality of older people due to its impact on performing the activities of daily living, such as standing up from a chair with the help of the arms and lifting and carrying groceries (Metter et al., 1997; Macaluso and De Vito, 2004; Candow and Chilibeck, 2005; Harris et al., 2011). In this matter, research with community-dwelling older adults aged ∼72 years found associations between the peak force applied during a modified push-up (knees on the ground) and the medicine ball throw (MBT) with 1.5 kg (r = 0.64) and 3 kg (r = 0.61) (Harris et al., 2011). Nevertheless, since the authors did not report the associations between MPmax and PPmax produced during the modified push-up with MBT, this analysis still needs to be conducted. In addition, selecting a resistance exercise performed in a seated position, such as the chest press, might be more representative of MBT performance than push-ups. Nevertheless, to our knowledge, no studies have yet assessed the association between MPmax and PPmax in the seated chest press with MBT performance in older people, representing a gap in the literature. Therefore, analyzing these relationships will allow an understanding of the applicability of the MBT as a functional field test to evaluate upper-limb muscle power in older adults.
Given the above considerations, the current research aimed to 1) analyze the load-mean and peak power relationships in the leg press and chest press in older women and men, 2) examine the differences between MPmax-load and PPmax-load within resistance exercises, 3) identify the differences between resistance exercises in MPmax-load and PPmax-load, and 4) explore the associations between MPmax and PPmax in the leg press and chest press with functional capacity indicators. We hypothesized that the Pmax-load in the leg press and chest press would be similar between older women and men (Strand et al., 2019). In addition, we hypothesized that the MPmax-load and PPmax-load would differ within and between resistance exercises (Pallarés et al., 2014; Sánchez-Medina et al., 2014; Martínez-Cava et al., 2019). Finally, we hypothesized that the MPmax and PPmax in the chest press would explain the MBT performance variance, while the MPmax and PPmax in the leg press would explain the performance variability in functional field tests for the lower limbs, including standing up from a chair and short-distance walking.
2 Materials and Methods
2.1 Study design
In this cross-sectional study, the participants went to a fitness health club for three consecutive weeks to perform two weekly sessions, separated by 48 h of rest. We dedicated the first 2 weeks to familiarization and anthropometric measures. During this period, we emphasized the proper execution technique of each exercise and movement velocity. Afterward, in the first session of the third week, the participants performed the following tests: MBT with 1 kg (MBT-1 kg) and 3 kg (MBT-3 kg), 10-m walking speed (10W), and five-repetition sit-to-stand (STS). After 48 h of rest, the participants performed a second session constituted by a progressive loading test in the leg press and chest press. An experienced researcher involved in the study and two certified senior fitness coaches supervised the procedures to guarantee safety and proper supervision during each exercise. In addition, verbal encouragement was provided during each exercise to motivate the participants to give a maximal effort. Figure 1 illustrates the study design.
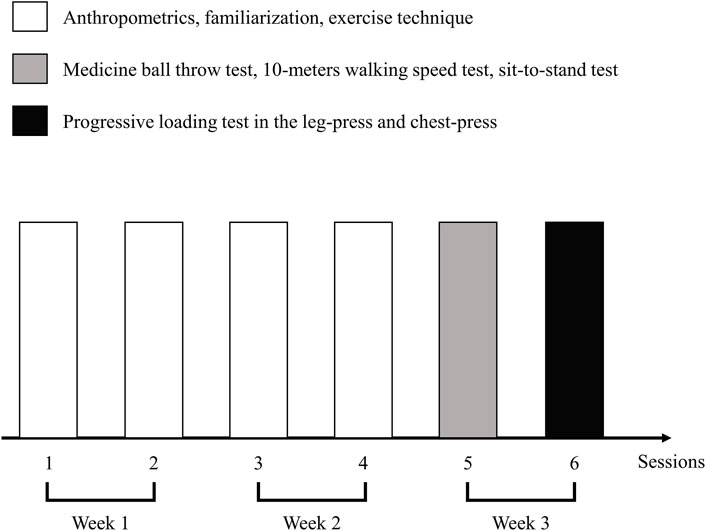
FIGURE 1. Illustration of the study design.
2.2 Participants
We estimated a sample size of twenty-three participants to achieve a power of 80%, considering an alpha level of 0.05, two predictor variables (MPmax and PPmax), and an r2 of 0.38 based on the relationship between leg power and the short physical performance battery reported by Bean et al. (2002) (G*Power v3.1). Therefore, thirty-two older adults from residential care facilities and day centers were recruited to participate in this study (Table 1). We included male and female participants aged 65 years or more, able to walk and stand up from a chair independently, and willing to participate in the study. We excluded participants if they had physical dependency (Barthel Index score <60), cognitive decline (Mini-Mental State Examination [MMSE] cut-off scores: no years of schooling, <15 points; 1–11 years of school, <22 points; and >11 years of school, <27 points (Mendes et al., 2017)), musculoskeletal injuries in the previous 3 months, and terminal illness. The clinicians of the centers conducted the initial screening tests, including the Barthel Index and MMSE. According to the clinicians, all participants had no records of risk factors (e.g., uncontrolled hypertension and arrhythmia) that could prevent them from performing the exercises included in the study. Furthermore, all participants were classified as sedentary since they had no records of participating in regular physical exercise programs in the last 3 months. All participants were informed of the study procedures and signed written informed consent. The Ethical Committee of the University of Beira Interior approved this study (CE-UBI-Pj-2019-019).
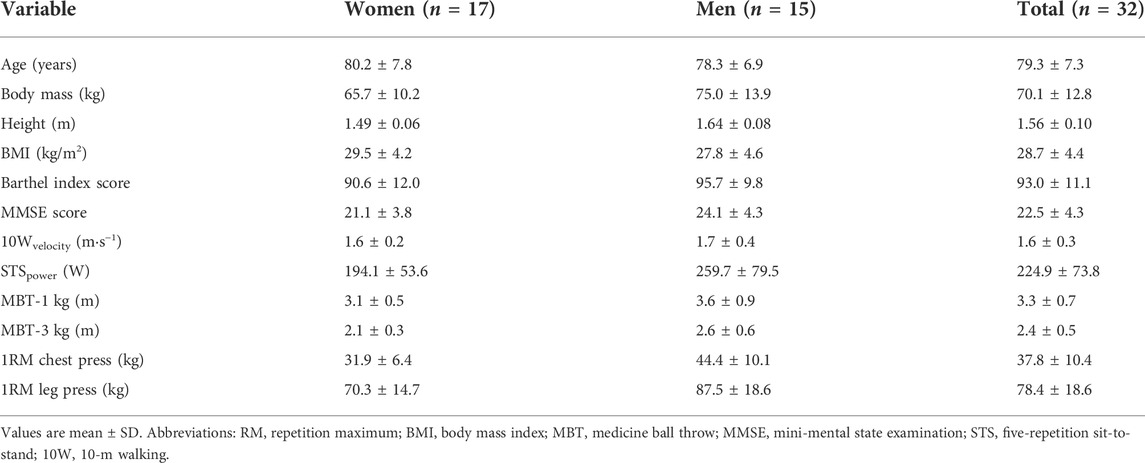
TABLE 1. Participants’ characteristics.
2.3 Measurements
2.3.1 Seated medicine ball throw
The participants held the ball on their chest and threw it as far as possible while seated on a chair (0.49 m) (Marques et al., 2020). They performed three trials with 1 and 3 kg balls, interspersed with 1-min rest. We measured the distance (m) from the chest to where the balls landed using a tape measure and analyzed the best attempts.
2.3.2 Ten-meters walking speed
The participants walked 10-m linearly at the maximal intended velocity on an indoor wooden track (Pereira et al., 2012). They performed three trials, separated by 3 min of rest. We measured the time (s) using photoelectric cells (Race Time Kit 2, Microgate, Italy) and estimated the mean velocity (10-m divided by time; 10Wvelocity, in m·s−1) of the best trial.
2.3.3 Five-repetition sit-to-stand
The participants stood up and sat down on a chair (0.49 m) with their arms crossed over the chest five times (Alcazar et al., 2018b). They performed two trials, separated by 2-min rest. We measured the time (s) using a stopwatch (Casio HS-3V-1R, Japan) and estimated the STS mean power (STSpower, in W) using a validated equation (Alcazar et al., 2018a), and selected the best attempt.
2.3.4 Progressive loading test in the leg press and chest press
In the leg press (Leg press G3, Matrix, United States), the participants were seated on the bench with their hands on the side handles. They placed their feet on the platform shoulder-width apart, knees at 90°, and back in contact with the seat. In the chest press (Chest press G3, Matrix, United States), the participants were seated on the bench with the handgrips at mid-chest, shoulders abducted, elbows flexed at 90°, and handles grabbed with a full grip. The leg press warm-up consisted of seven repetitions with 20.5 kg plus five repetitions with 29.5 kg, while the chest press warm-up consisted of seven repetitions with 5.7 kg plus five repetitions with 10.2 kg. The initial weight was 29.5 and 10.2 kg in the leg press and chest press, respectively. We increased the weight by 10 kg in the leg press and 5 kg in the chest press until the participants achieved the 1RM. If they could not perform one correct repetition, we decreased the weight by 1–5 kg. The participants performed the repetitions at the maximal intended velocity, and we asked them to perform three repetitions whenever possible to guarantee proper data collection. The inter-set rest was 3 min for three repetitions and 5 min for two repetitions (Marques et al., 2021). Using the procedures described elsewhere (Marques et al., 2020), we coupled a linear velocity transducer (T-Force System, Ergotech, Spain) to the leg press and chest press machines to calculate each repetition’s mean and peak power. We selected the maximal mean and peak power values attained with each weight for analysis. The set’s average number was 6.4 ± 1.7 and 6.7 ± 1.5 in the leg press and chest press, respectively.
2.4 Statistical analysis
We examined the assumption of normality of the data using the Kolmogorov-Smirnov test. We used standard statistical methods to calculate means, standard deviations (SD), 95% confidence intervals (CI), Pearson correlation coefficients (r), the adjusted coefficient of determination (r2), and the standard error of the estimate (SEE). Quadratic regressions analyzed 1) the load-mean and peak power relationships in the leg press and chest press and identified the MPmax-load (% 1RM), MPmax (W), PPmax-load (% 1RM), and PPmax (W) in the leg press and chest press in women and men, 2) the associations between MPmax and PPmax in the chest press with MBT-1 kg and MBT-3 kg, and 3) the associations between MPmax and PPmax in the leg press with 10Wvelocity and STSpower. We used quadratic regressions to analyze the associations between MPmax and PPmax with functional capacity markers due to the curvilinear relationship between muscle power and functional capacity (Bean et al., 2002; Cuoco et al., 2004; Marsh et al., 2006; Byrne et al., 2016). Independent samples t-test analyzed 1) the differences between sexes in absolute mean and peak power values (W) in the leg press and chest press for each relative load, including the MPmax-load and PPmax-load, and 2) the differences between sexes in MPmax-load and PPmax-load in the leg press and chest press. A repeated-measures ANOVA with post hoc Bonferroni tests analyzed the differences between MPmax/PPmax in the leg press and chest press with absolute power values (W) at different relative loads in men and women. Paired samples t-test analyzed 1) the differences between MPmax-load and PPmax-load within resistance exercises, and 2) the differences between resistance exercises in MPmax-load and PPmax-load. We performed the statistical analyses in Microsoft Office Excel® (Microsoft Inc., Redmond, WA, United States) and SPSS v27 (SPSS Inc., United States) and set the significance level at p < 0.05. We designed the figures in GraphPad Prism v7 (GraphPad Inc., San Diego, CA, United States).
3 Results
3.1 Load-mean and peak power relationships in the leg press in women and men
Figure 2 shows the load-mean and peak power relationships in the leg press in older women and men. Men presented higher absolute peak power values than women at 35%–95% 1RM (Figure 2A) and higher absolute mean power values at 30%–100% 1RM (Figure 2B). The PPmax-load in the leg press did not differ between men and women (p = 0.59). In men, the PPmax was not different from peak power values associated with loads at 60%–65% 1RM (p > 0.05), while in women, the PPmax was not different from peak power values associated with loads at 60%–70% 1RM (p > 0.05) (Figure 2A). The MPmax-load in the leg press did not differ between men and women (p = 0.62). In men, the MPmax was not different from mean power values associated with loads at 60%–70% 1RM (p > 0.05), while in women, the MPmax was not different from mean power values associated with loads at 65%–70% 1RM (p > 0.05) (Figure 2B).
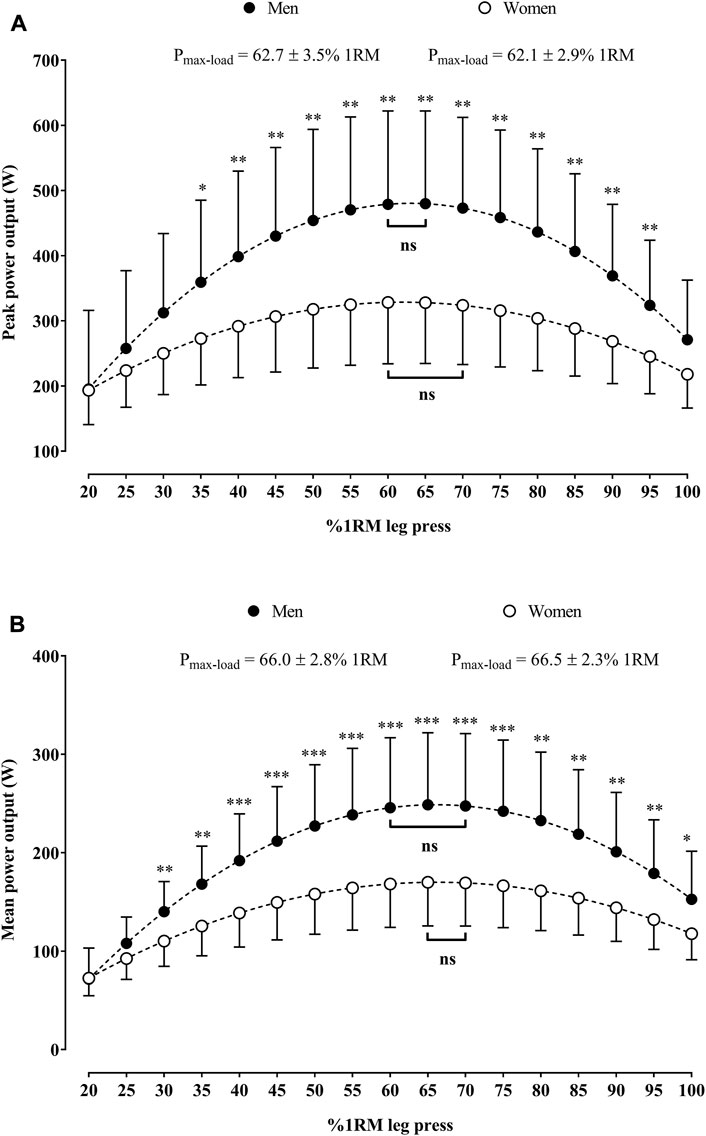
FIGURE 2. Load-peak (A) and mean power (B) relationships in the leg press for older women and men. *p < 0.05, **p < 0.01, and ***p < 0.001 indicate significant differences between sexes in the absolute mean or peak power against the same relative load. Square brackets indicate the range of relative loads at which the power output was not statistically different (ns) than the Pmax-load. Abbreviation: Pmax-load, relative load that maximizes the power output; RM, repetition maximum.
3.2 Load-mean and peak power relationships in the chest press in women and men
Figure 3 shows the load-mean and peak power relationships in the chest press in older women and men. Men presented higher absolute peak and mean power values than women at 20%–100% 1RM (Figures 3A,B, respectively). The PPmax-load in the chest press did not differ between men and women (p = 0.09). In men, the PPmax was not different from peak power values associated with loads at 40%–65% 1RM (p > 0.05), while in women, the PPmax was not different from peak power values associated with loads at 55%–60% 1RM (p > 0.05) (Figure 3A). The MPmax-load in the chest press did not differ between men and women (p = 0.41). In men, the MPmax was not different from mean power values associated with loads at 55%–65% 1RM (p > 0.05), while in women, the MPmax was not different from mean power values associated with loads at 55%–60% 1RM (p > 0.05) (Figure 3B).
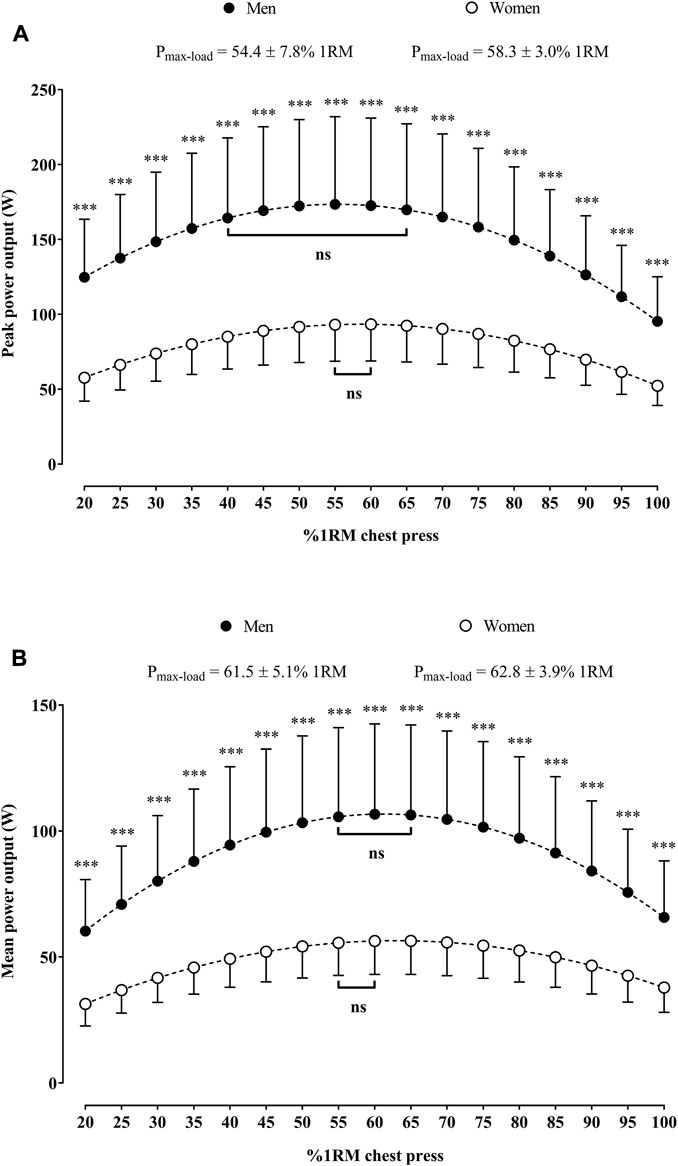
FIGURE 3. Load-peak (A) and mean power (B) relationships in the chest press for older women and men. *p < 0.05, **p < 0.01, and ***p < 0.001 indicate significant differences between sexes in the absolute mean or peak power against the same relative load. Square brackets indicate the range of relative loads at which the power output was not statistically different (ns) than the Pmax-load. Abbreviation: Pmax-load, relative load that maximizes the power output; RM, repetition maximum.
3.3 Differences between leg press vs. chest press in mean Pmax-load and peak Pmax-load
Table 2 shows differences between the leg press vs. chest press in PPmax-load for men and women (p < 0.01). In addition, there were differences between the leg press vs. chest press in MPmax-load for men and women (p < 0.01).
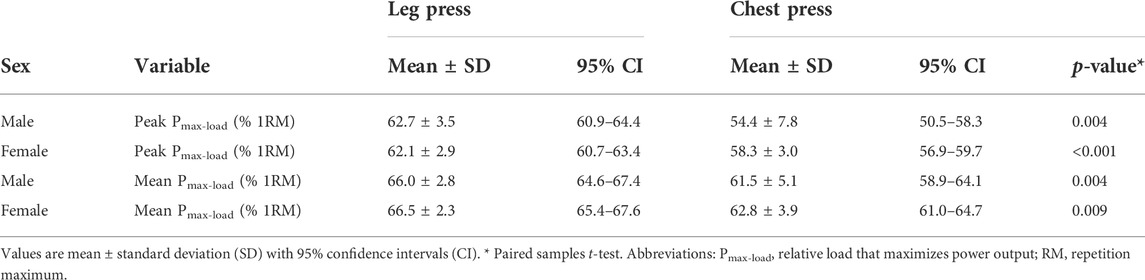
TABLE 2. Differences between leg press vs. chest press using the peak Pmax-load and mean Pmax-load in both sexes.
3.4 Differences between mean Pmax-load vs. peak Pmax-load within resistance exercises
Table 3 shows differences between PPmax-load vs. MPmax-load in the leg press for men and women (p < 0.01). In addition, there were differences between PPmax-load vs. MPmax-load in the chest press for men and women (p < 0.001).
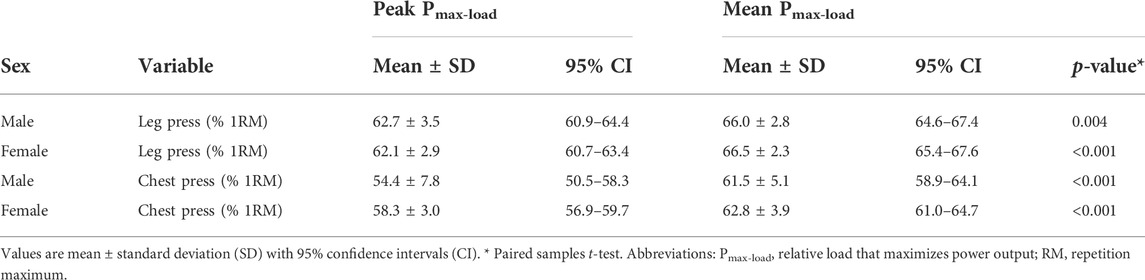
TABLE 3. Differences between peak Pmax-load vs. mean Pmax-load in the leg press and chest press in both sexes.
3.5 Associations between maximal mean power and peak power in the leg press and chest press with functional capacity markers
Figure 4A indicates that the PPmax in the chest press explained 48% of MBT-1 kg variance, while Figure 4B shows that the MPmax in the chest press explained 48% of MBT-1 kg variance. In addition, Figure 4C reveals that the PPmax in the chest press explained 52% of MBT-3 kg variance, while Figure 4D shows that the MPmax in the chest press explained 53% of MBT-3 kg variance.
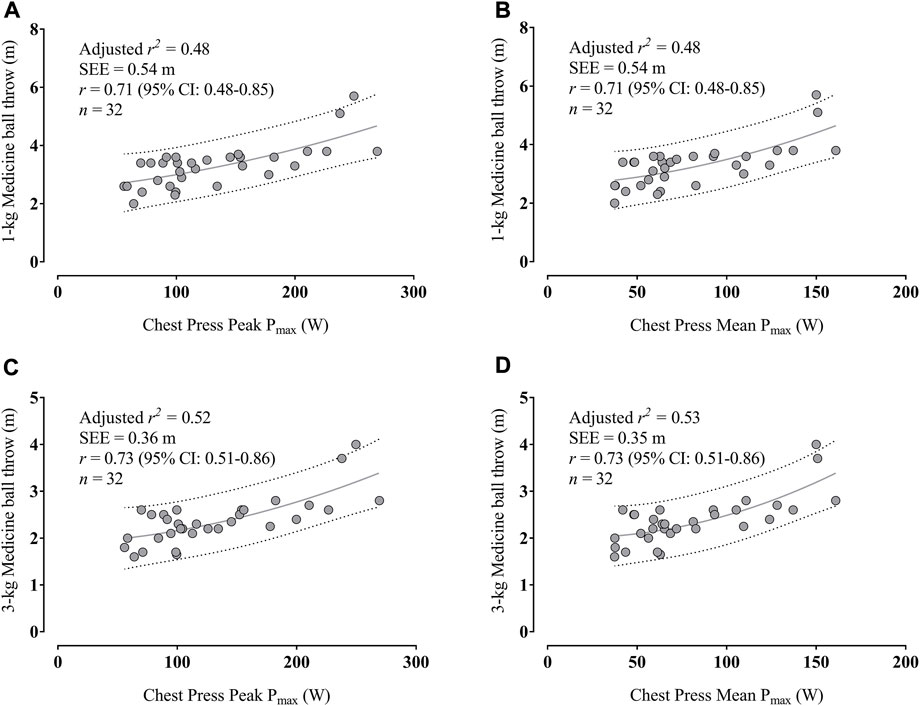
FIGURE 4. Associations between maximal peak power (A) and mean power output (B) in the chest press with 1-kg medicine ball throw and between peak power (C) and mean power output (D) with 3-kg medicine ball throw; Dotted lines indicate the prediction intervals. Abbreviation: CI, confidence interval; Pmax, maximal power output; SEE, standard error of the estimate.
Figure 5A indicates that the PPmax in the leg press explained 61% of STSpower variance, while Figure 5B shows that the MPmax in the leg press explained 58% of STSpower variance. In addition, Figure 5C reveals that the PPmax in the leg press only explained 2% of 10Wvelocity variance, while Figure 5D shows that the MPmax in the leg press only explained 1% of 10Wvelocity variance.
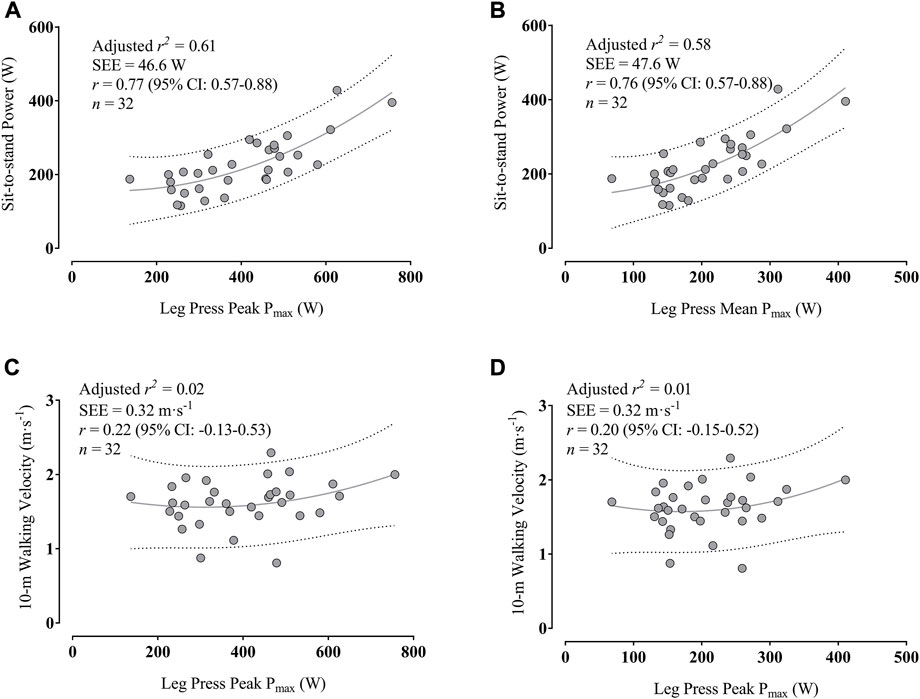
FIGURE 5. Associations between maximal peak power (A) and mean power output (B) in the leg press with sit-to-stand power and between peak power (C) and mean power output (D) with 10-m walking velocity; Dotted lines indicate the prediction intervals. Abbreviation: CI, confidence interval; Pmax, maximal power output; SEE, standard error of the estimate.
4 Discussion
4.1 Main findings
The current study aimed to 1) analyze the load-mean and peak power relationships in the leg press and chest press in older women and men, 2) examine the differences between MPmax-load and PPmax-load within resistance exercises, 3) identify the differences between resistance exercises in MPmax-load and PPmax-load, and 4) explore the associations between MPmax and PPmax in the leg press and chest press with functional capacity indicators. The main findings of the current study were: 1) the MPmax-load and PPmax-load in the leg press and chest press are similar between older women and men, 2) the MPmax-load and PPmax-load differ between resistance exercises, meaning that they are exercise-specific, 3) the Pmax-load varies in the same resistance exercise depending on the mechanical power variable chosen to measure, 4) the MPmax and PPmax in the chest press similarly explain the variability in MBT-1 kg and MBT-3 kg performance, and 5) the MPmax and PPmax in the leg press similarly explain the STSpower variance; however both mechanical variables could not explain the variability in 10Wvelocity performance.
4.2 Load-mean and peak power relationships in the leg press and chest press in older women and men
The results of this study showed that the MPmax-load and PPmax-load in the leg press and chest press did not differ between older women and men, which agrees with previous findings, particularly for the peak power values (Strand et al., 2019). This convergence in muscle power production between sexes might be related to the more significant and faster age-related losses of muscle power in men than women during aging (Edwén et al., 2014; Strand et al., 2019). The results also showed that the load-power relationship in older adults is resistance exercise-specific, thus corroborating the results of previous observations (Strand et al., 2019). For example, the PPmax-load in the leg press and chest press was around 60% and 55% 1RM, respectively, which agrees with previous findings (de Vos et al., 2008; Potiaumpai et al., 2016; Strand et al., 2019). On the other hand, the MPmax-load in the leg press and chest press was unknown until the completion of our study. Compared to PPmax-load, the MPmax-load in the leg press and chest press increased to around 66% and 62% 1RM, respectively. Despite its novelty in older populations, these data also indicate that the Pmax-load differs between mechanical power variables in older adults, as observed in young adults (Pallarés et al., 2014; Sánchez-Medina et al., 2014; Martínez-Cava et al., 2019). Although most studies with older adults analyzed the Pmax-load using the peak power variable (de Vos et al., 2005; Potiaumpai et al., 2016; Ni and Signorile, 2017; Strand et al., 2019), several authors observed higher reliability using mean values than peak values when conducting a progressive loading test in the leg press with this population (Alcazar et al., 2017). However, since no study had yet presented data concerning the MPmax-load in resistance exercises, these results present preliminary evidence for clinicians and researchers who want to collect mean power values to estimate the Pmax-load. In addition, these results also alert the importance of defining the mechanical power variable beforehand to be monitored during the intervention to avoid misinterpreting information during its course.
The current research also demonstrated that the Pmax-load range in the leg press (∼60%–70% 1RM) and chest press (∼40%–65% 1RM) was narrower than those observed for younger populations when using, for example, the squat or bench press exercises (∼30%–70% 1RM) (Soriano et al., 2015; Soriano et al.,2017). These differences might be attributed to the progressive reduction in size and number of fast-twitch muscle fibers in the lower and upper limbs with aging, which negatively affects the elbow and knee extensor’s power capacity (Metter et al., 1997; Candow and Chilibeck, 2005; Korff et al., 2014). In addition, as observed in our data, the Pmax-load range in the leg press was narrower than the chest press, which might be associated with the higher muscle power production losses in the lower limbs than in the upper limbs during aging (Macaluso and De Vito, 2004; Candow and Chilibeck, 2005). According to the literature, a significant reduction in physical activity with age and greater use of the upper limbs than the lower limbs to perform the activities of daily living (e.g., using arms to help to stand up from a chair) might contribute to higher decreases in lower limb’s power than upper limb’s power (Macaluso and De Vito, 2004; Candow and Chilibeck, 2005). Therefore, these results suggest a broad spectrum of relative loads to maximize the upper-limb muscle power and a narrow range of relative loads to maximize the lower-limb muscle power in older adults. Nevertheless, future research should analyze if training only with the Pmax-load improves older adults’ muscle power to a greater extent than a broader range of relative loads.
4.3 Associations between maximal mean and peak power values in the leg press and chest press with functional capacity markers
The regression analysis showed that the MPmax and PPmax in the chest press could similarly explain the MBT-1 kg and MBT-3 kg performance. These data reinforce the influence of the MBT as an indicator of muscle power and functionality in older adults (Harris et al., 2011). Furthermore, although the relationship between the chest press power and functional capacity in older adults is scarce, earlier findings demonstrated a correlation between the chest press peak power and self-reported functional status (lower scores representing better functional status) (r = −0.35) in older women (Foldvari et al., 2000). Consequently, considering the associations between chest press muscle power with MBT, it can be suggested that the MBT seems an essential indicator of the capacity to perform the activities of daily living independently in older adults, such as lifting and carrying groceries and boxes, opening jars, rising from a chair with the help of the arms, and even catching oneself to prevent a fall (Adams et al., 2001; Candow and Chilibeck, 2005; Harris et al., 2011). Based on this information, clinicians, sport-related professionals, and researchers can administer the MBT test to analyze the upper-limb muscle power capacity and derive information regarding the functional ability of older adults.
As for the regression analysis in the lower limbs, the MPmax and PPmax in the leg press could similarly explain the variability in the STSpower performance. These results reinforce the substantial impact of lower-limb muscle power on explaining the variability during sit-to-stand transitions in older adults (Byrne et al., 2016). However, neither MPmax nor PPmax in the leg press could explain the variance in 10Wvelocity performance. These results were surprising and unexpected since previous research found that leg press power could explain the variance in walking speed performance in older adults (Bean et al., 2002; Puthoff and Nielsen, 2007). Nevertheless, it is essential to note that the latter investigations that assessed the relationships between leg power and walking performance were conducted with mobility-limited older adults, unlike our study. Therefore, the impaired physical condition might have influenced the relationship between lower-limb muscle power with walking performance. Interestingly, research with community-dwelling older adults with similar maximal walking velocity values as our participants (1.6–2.0 m s−1) found that hip and ankle muscle strength were better predictors of maximal walking speed than leg strength (Uematsu et al., 2014; Muehlbauer et al., 2018). Therefore, it is essential to consider that hip and ankle strength might better account for the variance in walking performance than leg strength in older adults without mobility impairments (Muehlbauer et al., 2018). Nevertheless, future large-scale research is necessary to determine the influence of leg, hip, and ankle power and strength on maximal walking performance in older adults with and without mobility limitations.
Of note, the range of r2 values observed in our study is in line with previous research (Byrne et al., 2016), which indicates that a large part of the variance in functional capacity is to be explained by other outcomes (Puthoff and Nielsen, 2007). For example, aerobic endurance, balance, flexibility, agility, and even the fear of falling might explain the variance in functional capacity in older adults (Puthoff and Nielsen, 2007). Therefore, future research should examine, along with lower and upper-limb muscle power, what physiological and psychological indices play a significant role in explaining the variability in functional capacity in older adults.
4.4 Study limitations and future research
The current study presents several limitations that we need to address. Firstly, a cross-sectional design does not allow us to establish causal relationships between muscle power with functional capacity in the tested population. In this perspective, future longitudinal studies with older adults should examine the effects of resistance training on muscle power and functional capacity and determine their relationships to support causal links. Secondly, although the sample size calculation determined that twenty-three participants were needed to obtain a statistical power of 80%, the actual number of participants is insufficient to generalize the results to other older adults. In addition, considering that our participants were functionally independent, caution should be taken when generalizing these results to mobility-limited older adults. Finally, including physiological and psychological outcomes would be helpful to examine if, along with lower and upper-limb muscle power measures, they could increase the capacity to explain the remaining part of the variance in functional capacity in older adults. Therefore, future research should consider the limitations mentioned above and conduct large-scale, longitudinal, and experimental studies to examine the physiological and psychological mechanisms that better explain the variability in functional capacity in older adults.
5 Conclusion
This study showed that the Pmax-load in the leg press and chest press are similar between older women and men. Nevertheless, the Pmax-load is exercise-specific and varies according to the mechanical power variable chosen for analysis. Therefore, from an applied perspective, this information can be helpful for clinicians, sport-related professionals, and researchers to design experimental interventions oriented to optimizing lower and upper-limb muscle power and functional capacity in older adults. In addition, the current research demonstrated the influence of the MBT exercise as a functional capacity field test for assessing upper-limb muscle power in older adults.
Data availability statement
The raw data supporting the conclusion of this article will be made available by the authors, without undue reservation.
Ethics statement
The studies involving human participants were reviewed and approved by CE-UBI-Pj-2019-019. The patients/participants provided their written informed consent to participate in this study.
Author contributions
DLM, HN, and MM conceptualized the study. DLM administered the project. DLM and CN analyzed the data. DLM, HN, DAM, IP, CN, and MM drafted and edited the manuscript. All authors read and approved the final manuscript.
Funding
The Portuguese Foundation for Science and Technology (FCT), IP, funded this research with grant number SFRH/BD/147608/2019 and project number UIDB/04045/2020. This work was also funded by FCT/MEC through national funds and, when applicable, co-funded by the FEDER-PT2020 partnership agreement under the project UIDB/50008/2020.
Acknowledgments
We gratefully thank the care staff of the Santa Casa da Misericórdia do Fundão and all the participants involved in this study.
Conflict of interest
The authors declare that the research was conducted in the absence of any commercial or financial relationships that could be construed as a potential conflict of interest.
Publisher’s note
All claims expressed in this article are solely those of the authors and do not necessarily represent those of their affiliated organizations, or those of the publisher, the editors and the reviewers. Any product that may be evaluated in this article, or claim that may be made by its manufacturer, is not guaranteed or endorsed by the publisher.
References
Adams K. J., Swank A. M., Berning J. M., Sevene-adams P. G., Barnard K. L., Shimp-bowerman J. (2001). Progressive strength training in sedentary, older African American women. Med. Sci. Sports Exerc. 33, 1567–1576. doi:10.1097/00005768-200109000-00021
Alcazar J., Guadalupe-Grau A., García-García F. J., Ara I., Alegre L. M. (2018a). Skeletal muscle power measurement in older people: A systematic review of testing protocols and adverse events. J. Gerontol. Ser. A Biol. Sci. Med. Sci. 73, 914–924. doi:10.1093/gerona/glx216
Alcazar J., Losa-Reyna J., Rodriguez-Lopez C., Alfaro-Acha A., Rodriguez-Mañas L., Ara I., et al. (2018b). The sit-to-stand muscle power test: An easy, inexpensive and portable procedure to assess muscle power in older people. Exp. Gerontol. 112, 38–43. doi:10.1016/j.exger.2018.08.006
Alcazar J., Rodriguez-Lopez C., Ara I., Alfaro-Acha A., Mañas-Bote A., Guadalupe-Grau A., et al. (2017). The force-velocity relationship in older people: Reliability and validity of a systematic procedure. Int. J. Sports Med. 38, 1097–1104. doi:10.1055/s-0043-119880
Beaudart C., Rolland Y., Cruz-Jentoft A. J., Bauer J. M., Sieber C., Cooper C., et al. (2019). Assessment of muscle function and physical performance in daily clinical practice. Calcif. Tissue Int. 105, 1–14. doi:10.1007/s00223-019-00545-w
Byrne C., Faure C., Keene D. J., Lamb S. E. (2016). Ageing, muscle power and physical function: A systematic review and implications for pragmatic training interventions. Sports Med. 46, 1311–1332. doi:10.1007/s40279-016-0489-x
Candow D. G., Chilibeck P. D. (2005). Differences in size, strength, and power of upper and lower body muscle groups in young and older men. Journals Gerontology Ser. A Biol. Sci. Med. Sci. 60, 148–156. doi:10.1093/gerona/60.2.148
Cuoco A., Callahan D. M., Sayers S., Frontera W. R., Bean J., Fielding R. A. (2004). Impact of muscle power and force on gait speed in disabled older men and women. Journals Gerontology Ser. A Biol. Sci. Med. Sci. 59, 1200–1206. doi:10.1093/gerona/59.11.1200
de Vos N. J., Singh N. A., Ross D. A., Stavrinos T. M., Orr R., Fiatarone Singh M. A. F. (2005). Optimal load for increasing muscle power during explosive resistance training in older adults. Journals Gerontology Ser. A Biol. Sci. Med. Sci. 60, 638–647. doi:10.1093/gerona/60.5.638
de Vos N. J., Singh N. A., Ross D. A., Stavrinos T. M., Orr R., Singh M. A. F. (2008). Effect of power-training intensity on the contribution of force and velocity to peak power in older adults. J. Aging Phys. Act. 16, 393–407. doi:10.1123/japa.16.4.393
Edwén C. E., Thorlund J. B., Magnusson S. P., Slinde F., Svantesson U., Hulthén L., et al. (2014). Stretch-shortening cycle muscle power in women and men aged 18-81 years: Influence of age and gender. Scand. J. Med. Sci. Sports 24, 717–726. doi:10.1111/sms.12066
Foldvari M., Clark M., Laviolette L. C., Bernstein M. A., Kaliton D., Castaneda C., et al. (2000). Association of muscle power with functional status in community-dwelling elderly women. Journals Gerontology Ser. A Biol. Sci. Med. Sci. 55, M192–M199. doi:10.1093/gerona/55.4.M192
Harris C., Wattles A. P., DeBeliso M., Sevene-Adams P. G., Berning J. M., Adams K. J. (2011). The seated medicine ball throw as a test of upper body power in older adults. J. Strength Cond. Res. 25, 2344–2348. doi:10.1519/JSC.0b013e3181ecd27b
Korff T., Newstead A. H., van Zandwijk R. van, Jensen J. L. (2014). Age- and activity-related differences in the mechanisms underlying maximal power production in young and older adults. J. Appl. Biomech. 30, 12–20. doi:10.1123/jab.2013-0037
Macaluso A., De Vito G. (2004). Muscle strength, power and adaptations to resistance training in older people. Eur. J. Appl. Physiol. 91, 450–472. doi:10.1007/s00421-003-0991-3
Marques D. L., Neiva H. P., Marinho D. A., Marques M. C. (2020). Novel resistance training approach to monitoring the volume in older adults: The role of movement velocity. Ijerph 17, 7557. doi:10.3390/ijerph17207557
Marques D. L., Neiva H. P., Marinho D. A., Nunes C., Marques M. C. (2021). Load-velocity relationship in the horizontal leg-press exercise in older women and men. Exp. Gerontol. 151, 111391. doi:10.1016/j.exger.2021.111391
Marsh A. P., Miller M. E., Saikin A. M., Rejeski W. J., Hu N., Lauretani F., et al. (2006). Lower extremity strength and power are associated with 400-meter walk time in older adults: The InCHIANTI study. Journals Gerontology Ser. A Biol. Sci. Med. Sci. 61, 1186–1193. doi:10.1093/gerona/61.11.1186
Martínez-Cava A., Morán-Navarro R., Sánchez-Medina L., González-Badillo J. J., Pallarés J. G. (2019). Velocity- and power-load relationships in the half, parallel and full back squat. J. Sports Sci. 37, 1088–1096. doi:10.1080/02640414.2018.1544187
McKinnon N. B., Connelly D. M., Rice C. L., Hunter S. W., Doherty T. J. (2017). Neuromuscular contributions to the age-related reduction in muscle power: Mechanisms and potential role of high velocity power training. Ageing Res. Rev. 35, 147–154. doi:10.1016/j.arr.2016.09.003
Md J. F., Kiely D. K., Herman S., Leveille S. G., Mizer K., Frontera W. R., et al. (2002). The relationship between leg power and physical performance in mobility-limited older people. J. Am. Geriatrics Soc. 50, 461–467. doi:10.1046/j.1532-5415.2002.50111.x
Mendes J., Amaral T. F., Borges N., Santos A., Padrão P., Moreira P., et al. (2017). Handgrip strength values of Portuguese older adults: A population based study. BMC Geriatr. 17, 191. doi:10.1186/s12877-017-0590-5
Metter E. J., Conwit R., Tobin J., Fozard J. L. (1997). Age-associated loss of power and strength in the upper extremities in women and men. Journals Gerontology Ser. A Biol. Sci. Med. Sci. 52A, B267–B276. doi:10.1093/gerona/52A.5.B267
Muehlbauer T., Granacher U., Borde R., Hortobágyi T. (2018). Non-discriminant relationships between leg muscle strength, mass and gait performance in healthy young and old adults. Gerontology 64, 11–18. doi:10.1159/000480150
Ni M., Signorile J. F. (2017). High-speed resistance training modifies load-velocity and load-power relationships in Parkinson's disease. J. Strength Cond. Res. 31, 2866–2875. doi:10.1519/JSC.0000000000001730
Pallarés J. G., Sánchez-Medina L., Pérez C. E., De La Cruz-Sánchez E., Mora-Rodriguez R. (2014). Imposing a pause between the eccentric and concentric phases increases the reliability of isoinertial strength assessments. J. Sports Sci. 32, 1165–1175. doi:10.1080/02640414.2014.889844
Pereira A., Izquierdo M., Silva A. J., Costa A. M., Bastos E., González-Badillo J. J., et al. (2012). Effects of high-speed power training on functional capacity and muscle performance in older women. Exp. Gerontol. 47, 250–255. doi:10.1016/j.exger.2011.12.010
Potiaumpai M., Gandia K., Rautray A., Prendergast T., Signorile J. F. (2016). Optimal loads for power differ by exercise in older adults. J. Strength Cond. Res. 30, 2703–2712. doi:10.1519/JSC.0000000000001549
Puthoff M. L., Nielsen D. H. (2007). Relationships among impairments in lower-extremity strength and power, functional limitations, and disability in older adults. Phys. Ther. 87, 1334–1347. doi:10.2522/ptj.20060176
Reid K. F., Fielding R. A. (2012). Skeletal muscle power. Exerc. Sport Sci. Rev. 40, 4–12. doi:10.1097/JES.0b013e31823b5f13
Sánchez-Medina L., González-Badillo J. J., Pérez C. E., Pallarés J. G. (2014). Velocity- and power-load relationships of the bench pull vs. bench press exercises. Int. J. Sports Med. 35, 209–216. doi:10.1055/s-0033-1351252
Soriano M. A., Jiménez-Reyes P., Rhea M. R., Marín P. J. (2015). The optimal load for maximal power production during lower-body resistance exercises: A meta-analysis. Sports Med. 45, 1191–1205. doi:10.1007/s40279-015-0341-8
Soriano M. A., Suchomel T. J., Marín P. J. (2017). The optimal load for maximal power production during upper-body resistance exercises: A meta-analysis. Sports Med. 47, 757–768. doi:10.1007/s40279-016-0626-6
Strand K. L., Lucchi L., Copo T. G., Cherup N. P., Signorile J. F. (2019). Optimal loads for power in older men and women using plate-loaded resistance machines. Exp. Gerontol. 124, 110638. doi:10.1016/j.exger.2019.110638
Keywords: muscle power, functional performance, medicine ball throw, chair stand, walking velocity, regression analysis, aging
Citation: Marques DL, Neiva HP, Marinho DA, Pires IM, Nunes C and Marques MC (2022) Load-power relationship in older adults: The influence of maximal mean and peak power values and their associations with lower and upper-limb functional capacity. Front. Physiol. 13:1007772. doi: 10.3389/fphys.2022.1007772
Received: 30 July 2022; Accepted: 09 September 2022;
Published: 23 September 2022.
Edited by:
Rodrigo Ramirez-Campillo, Andres Bello University, ChileReviewed by:
Nicole Fritz, Universidad de Los Lagos, ChileAlex Ojeda-Aravena, Pontificia Universidad Católica de Valparaíso, Chile
Copyright © 2022 Marques, Neiva, Marinho, Pires, Nunes and Marques. This is an open-access article distributed under the terms of the Creative Commons Attribution License (CC BY). The use, distribution or reproduction in other forums is permitted, provided the original author(s) and the copyright owner(s) are credited and that the original publication in this journal is cited, in accordance with accepted academic practice. No use, distribution or reproduction is permitted which does not comply with these terms.
*Correspondence: Diogo Luís Marques, ZGlvZ29sdWlzLnNlcXVlaXJhQGdtYWlsLmNvbQ==; Mário Cardoso Marques, bWFyaW9tYXJxdWVzQG1hcmlvbWFycXVlcy5jb20=