
95% of researchers rate our articles as excellent or good
Learn more about the work of our research integrity team to safeguard the quality of each article we publish.
Find out more
HYPOTHESIS AND THEORY article
Front. Physiol. , 28 September 2021
Sec. Environmental, Aviation and Space Physiology
Volume 12 - 2021 | https://doi.org/10.3389/fphys.2021.733305
This article is part of the Research Topic Physiological Performance Curves across Phylogenetic and Functional Boundaries: When are they useful? View all 12 articles
 Frank Seebacher1*
 Alexander G. Little2
Many ectothermic animals can respond to changes in their environment by altering the sensitivities of physiological rates, given sufficient time to do so. In other words, thermal acclimation and developmental plasticity can shift thermal performance curves so that performance may be completely or partially buffered against the effects of environmental temperature changes. Plastic responses can thereby increase the resilience to temperature change. However, there may be pronounced differences between individuals in their capacity for plasticity, and these differences are not necessarily reflected in population means. In a bet-hedging strategy, only a subsection of the population may persist under environmental conditions that favour either plasticity or fixed phenotypes. Thus, experimental approaches that measure means across individuals can not necessarily predict population responses to temperature change. Here, we collated published data of 608 mosquitofish (Gambusia holbrooki) each acclimated twice, to a cool and a warm temperature in random order, to model how diversity in individual capacity for plasticity can affect populations under different temperature regimes. The persistence of both plastic and fixed phenotypes indicates that on average, neither phenotype is selectively more advantageous. Fish with low acclimation capacity had greater maximal swimming performance in warm conditions, but their performance decreased to a greater extent with decreasing temperature in variable environments. In contrast, the performance of fish with high acclimation capacity decreased to a lesser extent with a decrease in temperature. Hence, even though fish with low acclimation capacity had greater maximal performance, high acclimation capacity may be advantageous when ecologically relevant behaviour requires submaximal locomotor performance. Trade-offs, developmental effects and the advantages of plastic phenotypes together are likely to explain the observed population variation.
Temperature is one of the most relevant physical state variables in biology because physiological rates and hence fitness are influenced by the thermal environment (Tattersall et al., 2012). High temperatures, in particular, cause damage to proteins and membranes and can thereby disrupt fundamental processes such as movement, growth and reproduction (Tattersall et al., 2012). Variation in the thermal environment can be a strong predictor of individual fitness and population persistence (Kingsolver and Buckley, 2017). In the current era of global warming, understanding thermal effects on organisms has assumed a new urgency because of their potential role in determining the success and biogeography of populations and species (Sinclair et al., 2016; Woods et al., 2018).
At a reductionist level, living organisms are comprised of networks of interacting biochemical pathways (Costanzo et al., 2021). Thermodynamics dictates that the rate of biochemical reactions depends on the temperature of the system. The thermal sensitivity of higher organismal traits such as locomotor performance or metabolic rate is then determined by the thermodynamics of flux through underlying biochemical pathways. Hence, each physiological rate has a characteristic temperature response, which is captured by ‘thermal performance curves’ (TPC; Huey and Kingsolver, 1989).
A TPC describes the change in a physiological rate across a range of acutely changing temperatures. The shape of TPCs is characteristically in the form of an inverted ‘U’, where rates increase with an increase in temperature until a maximum is reached beyond which rates decline with further temperature increases (Huey and Kingsolver, 1989; McKenzie et al., 2021; Figure 1). The decrease in rates at lower temperatures is caused by thermodynamic constraints in Gibb’s free energy, while the decline in rates at high temperatures results from a loss of the quaternary or tertiary structures of enzymes and damage to membranes (DeLong et al., 2017).
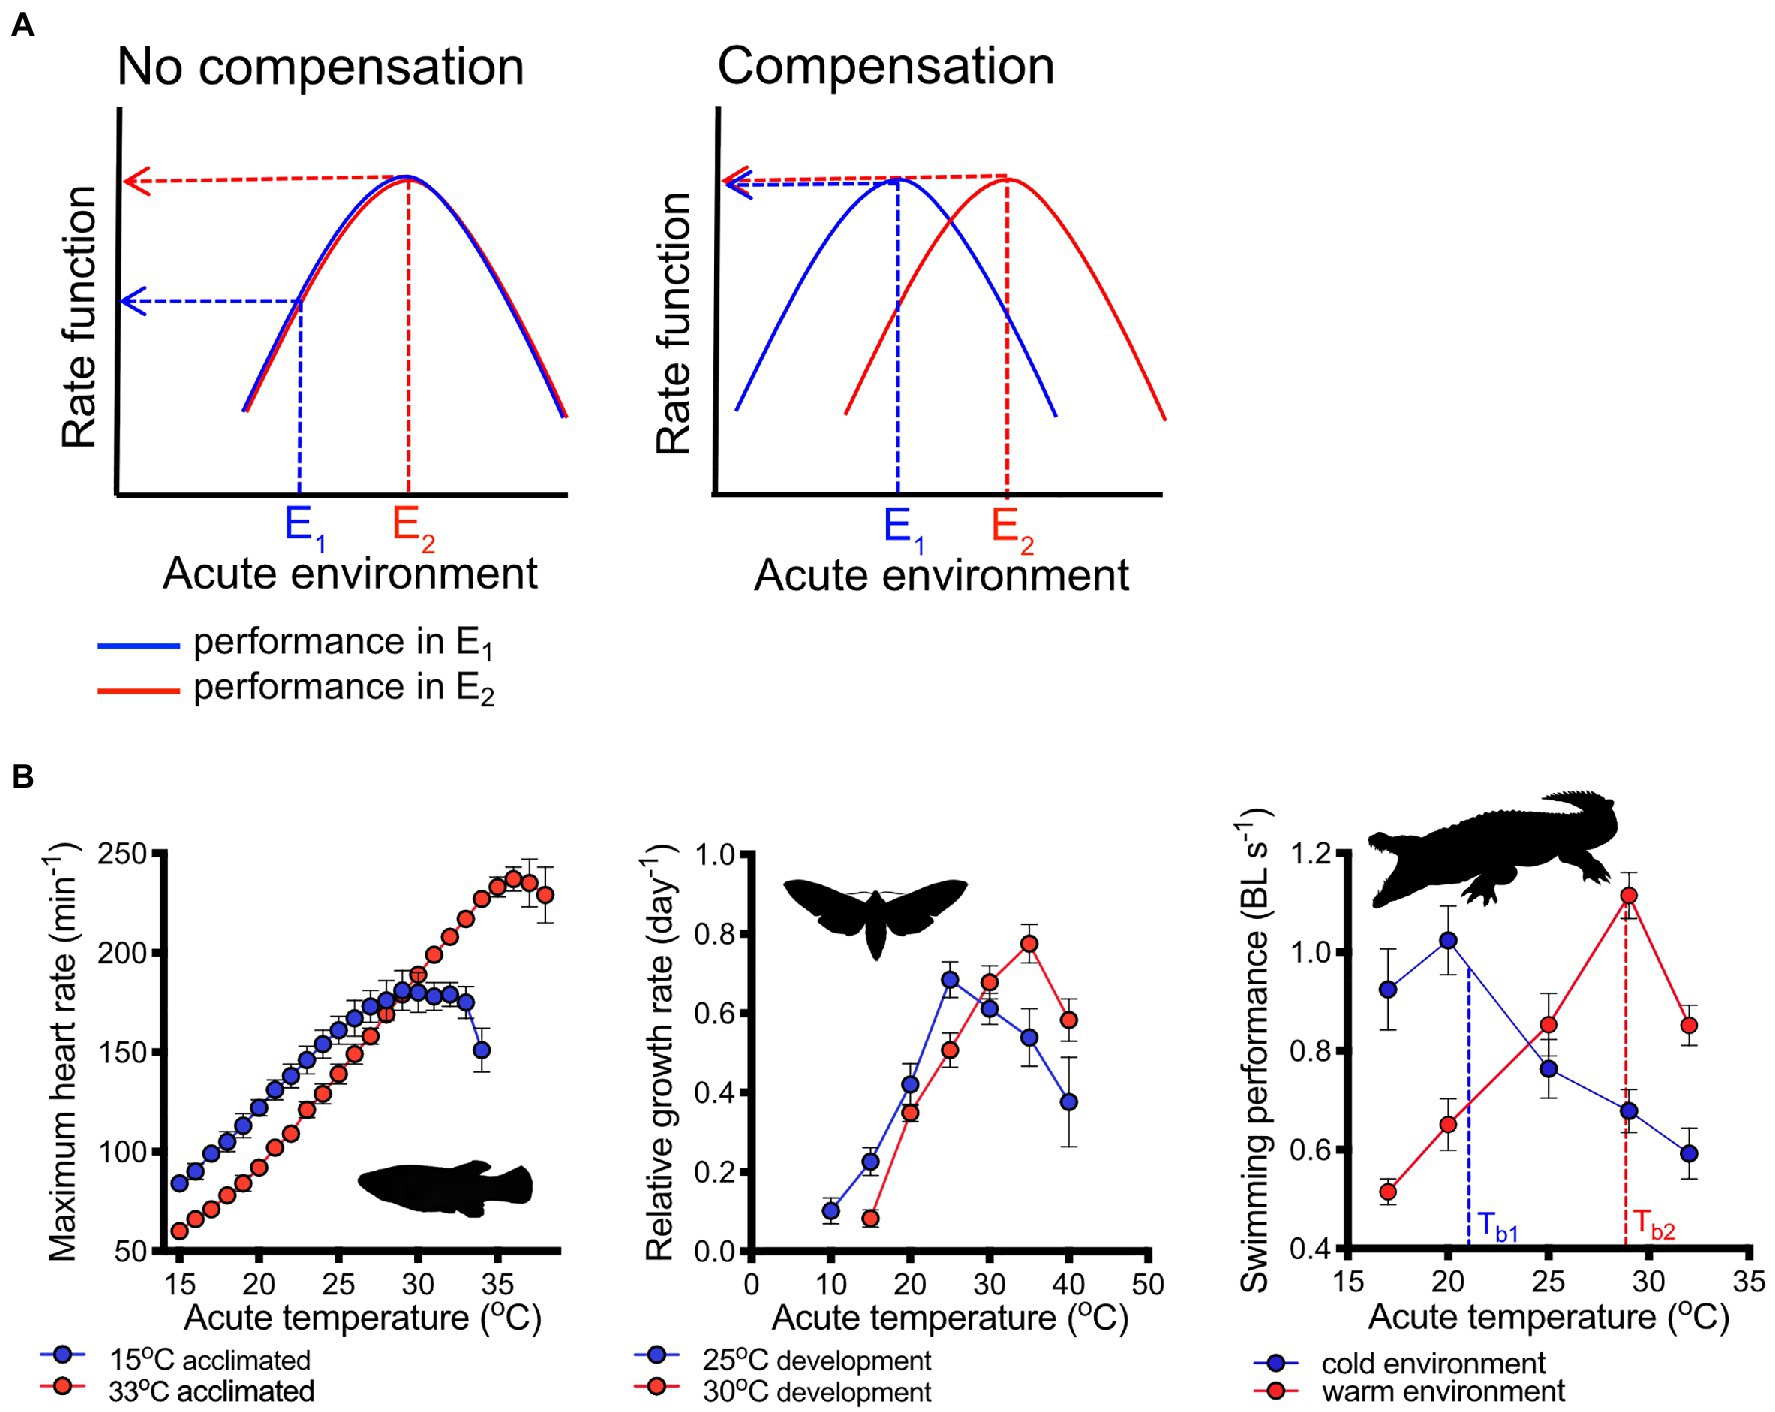
Figure 1. Plasticity of thermal performance curves. Ideally, plasticity can shift performance curves so that physiological rate functions are perfectly buffered from changes in the thermal environment. The case of perfect compensation is shown (A, right panel) schematically as a right shift of the thermal performance curve (blue line=performance in cool environment, E1; red line=performance in warm environment, E2). Lack of compensation (left panel) would result in a substantial decrement in performance as temperatures decrease. Examples (B) of shifts in performance curves demonstrating different degrees of compensation: heart rate in killifish [Fundulus heteroclitus; redrawn from Safi et al. (2019), left panel] and growth rates in moth (Maduca sexta) larvae [central panel, redrawn from Kingsolver et al. (2020)] compensate partially for different acclimation or developmental temperatures, respectively. Thermal performance curves of swimming in crocodiles (Crocodylus porosus, right panel) thermoregulating in simulated winter (cool) and summer (warm) environments shifted horizontally so that swimming performance remained nearly constant at the different regulated body temperatures [Tb1 and Tb2 in cool and warm environments, respectively; redrawn from Glanville and Seebacher (2006)]. Means ± s.e. are shown in (B), and images are from PhyloPic (http://phylopic.org/).
However, TPCs are not fixed within individuals over time (Sinclair et al., 2016) or consistent among individuals within populations or species (Careau et al., 2014; Seebacher et al., 2015). Long-term exposure to different temperature regimes within or across generations can shift the TPC of individuals. Hence, transgenerational, developmental or reversible plasticity can result in changes in the maximum, mode and breadth of TPCs (Schulte et al., 2011; LeRoy et al., 2017). These epigenetic effects are at least partly regulated by DNA methylation and histone acetylation (Simmonds and Seebacher, 2017; Loughland et al., 2021). Plasticity can be beneficial if performance is optimised at the acute thermal environment experienced by individuals. However, there is a potential cost to plasticity if the temperature range at which performance maxima occur mismatches the prevailing thermal conditions in the environment (Bateson et al., 2014).
Importantly, TPCs and their plasticity also vary between individuals within populations (Seebacher et al., 2015). A potential ramification of this individual variation is that means of thermal performance across samples of individuals do not necessarily represent the population as a whole. Instead, population responses may be determined by a bet-hedging strategy (Haaland et al., 2020). In a bet-hedging scenario, populations comprise individuals with high capacity for acclimation that can fully compensate for an environmental change given sufficient time to acclimate and individuals with low acclimation capacity that cannot compensate physiological rates at all. We found this to be the case in mosquitofish (Gambusia holbrooki; Seebacher et al., 2015; Loughland and Seebacher, 2020). It is possible that variation in the plasticity of TPCs may disadvantage some individuals under particular conditions, but promote population resilience as a result of the increased diversity of phenotypes (Schindler et al., 2015). Our aim was to explore these relationships to document variation in the plasticity of TPCs between individuals and to test how this variation may affect population responses. In mosquitofish, we also observed a trade-off between the capacity for acclimation and performance under warm conditions (Seebacher et al., 2015). Hence, here, we model how differences in the plasticity of TPCs together with this trade-off affect population performance in different thermal environments.
We collated a large data set from previously published studies on swimming performance of mosquitofish (608 individuals), in which each individual was acclimated twice to determine the capacity for reversible plasticity (Seebacher et al., 2015; Loughland and Seebacher, 2020). We subsampled this data set to characterise the effects of variation in individual phenotypes on population responses. This data set is unique because data from double-acclimated animals that permit calculation of individual plasticity are rare and because the large number of samples available makes our modelling approach possible; to the best of our knowledge, similar data sets do not exist for other species. However, we acknowledge that data from a single species may lack generality, and our results represent a proof of concept but do not necessarily apply to all ectotherms. Our aims were (a) to characterise the variation in plasticity of TPCs between individuals within populations and (b) to determine the extent to which sample means drawn from population mask individual variation. Finally, (c) we modelled the extent to which variation in capacity for plasticity between individuals influences population responses to environmental temperature variation.
We re-analysed three different data sets on thermal acclimation of swimming performance (critical sustained swimming speed, Ucrit) in mosquitofish (Gambusia holbrooki; Seebacher et al., 2015; Loughland and Seebacher, 2020). In each data set, individual fish were acclimated twice, to a cool (18 or 20°C) and to a warm (28°C) temperature in random order; acclimation temperatures corresponded to spring and summer temperatures at the capture site (Seebacher et al., 2014). All fish were sourced from the same wild population (Manly Dam, Australia 33°78′S; 151°26′E) and were acclimated for 3–4weeks to the different temperatures. After acclimation, Ucrit of each fish was measured at different acute test temperatures. Experimental fish were of mixed sex (184 females, 424 males) and were sexually immature at the start of acclimation treatments. Fish were separated from each other during acclimation treatments to ensure that females were not pregnant at the time of Ucrit measurements.
In the first data set (data set 1), n=48 wild-caught fish were each acclimated to 20 and 28°C in random order, and after each acclimation treatment, Ucrit was measured at 20, 28 and 32°C acute test temperatures in each fish (Seebacher et al., 2015). In the second data set (data set 2), Ucrit of 416 double-acclimated (to 18 and 28°C), wild-caught fish was measured only at the acute test temperature that coincided with acclimation temperatures (Loughland and Seebacher, 2020). The third data set (data set 3) from the same publication (Loughland and Seebacher, 2020) was collected from third- or fourth-generation offspring (total n=144 fish) bred in outdoor mesocosms from parents collected at the study site. Each of these fish was acclimated to 20 and 28°C, and Ucrit of each fish was measured at 20 and 28°C acute test temperatures after each acclimation treatment.
Double acclimation permitted calculation of an index of acclimation capacity for each fish (Seebacher et al., 2015):
Our purpose here was to mimic typical approaches in the literature to assess acclimation of populations to test whether subsampling of populations can reflect true variation and responses of the population. Hence, we randomly subsampled the combined data sets 1 and 3 (n=192 fish, see Supplementary Material for R code) to draw 10 samples of eight replicates each for warm- and cold-acclimated fish. Each of these 10 data sets mimics a fairly typical experiment in the literature, for example as in our study on mosquitofish where we compared acclimation in spring- and summer-caught fish (Seebacher et al., 2014).
We analysed each data set with a permutational analysis [in the R package lmPerm (Wheeler and Torchiano, 2016)] with acclimation temperature and acute test temperature as independent factors. Permutational analyses do not make assumptions about underlying data distributions but use the data per se to infer significant differences (Drummond and Vowler, 2012). Hence, values of p in permutational analyses are not associated with any particular distribution, and there are no test statistics (such as F or t; Ludbrook and Dudley, 1998). The value of p in permutational tests has the practical meaning of denoting the number of randomised permuted data sets for which the treatment effects were as or more extreme than the observed experimental data divided by the total number of permutations.
Our aim here was to model how populations comprised of individuals with different acclimation capacities respond to different environmental conditions. We modelled different phenotypic compositions of populations by selecting subpopulations from the complete data set (data sets 1, 2 and 3 combined; n=608 fish), which were the top 10% of fish with the highest acclimation capacity (high), the bottom 10% with the lowest acclimation capacity (low) and the central 10% (centre); each of these subpopulations was comprised of 61 fish.
From the P20 and P28 values of each fish, we determined the slope of change in Ucrit between these temperatures to estimate Ucrit at intermediate temperatures assuming that acclimation has taken place. We simulated environmental conditions within the measured range (20–28°C) by either assuming constant conditions of 20 or 28°C or letting temperatures vary between 20 and 28°C. To model variable temperatures, we assumed sinusoidal temperature variation with a mean of 24°C and an amplitude of 4°C. We randomised the phase of the sinusoidal temperature fluctuation 100 times for each fish and recalculated Ucrit (from the slope between P20 and P28) each time. We thereby ‘exposed’ each fish to the complete temperature variation. From the simulated data set, we calculated mean Ucrit and 95% confidence intervals for each subpopulation (using n=61 for CI calculations to represent the number of fish in the simulation rather than the number of simulated values).
Mean values for each subpopulation may mask the underlying distributions of Ucrit, which may be important for ecological responses. For each subpopulation (low, centre, high acclimation capacity), we therefore modelled Ucrit distributions in the variable environment (as determined above) as the per cent of Ucrit values that fell above a given fraction of maximum speed. The low acclimation capacity subpopulation had the highest maximum Ucrit, which we used as maximum Ucrit in all simulations. However, rather than using the single highest Ucrit value, which is not representative of most fish, we defined the 90th percentile of the low acclimation capacity subpopulation as the maximum Ucrit. We then determined the percentage of Ucrit values that fell above a given fraction of this maximum Ucrit for each subpopulation, which we defined as ‘achievable’ Ucrit. See Supplementary Material for R code.
Thermal performance curves varied considerably between individuals (Figure 2). In both cold- and warm-acclimated fish from data set 1 (Figure 2A), Ucrit tended to increase from 20 to 28°C and decrease at 32°C. However, this pattern was not consistent among individuals, and frequently Ucrit increased between 28 and 32°C. In fish from data sets 1 and 3 (n=192; Figure 2B), Ucrit mostly increased between 20 and 28°C at both acclimation temperatures, but there was considerable variation in thermal sensitivity (i.e. Q10 values). Similarly, responses to acclimation differed considerably between individuals (Figure 2C). At both 20 and 28°C test temperatures, acclimation to 28°C led to either increased or decreased performance in different individuals (data from data sets 1 and 3).
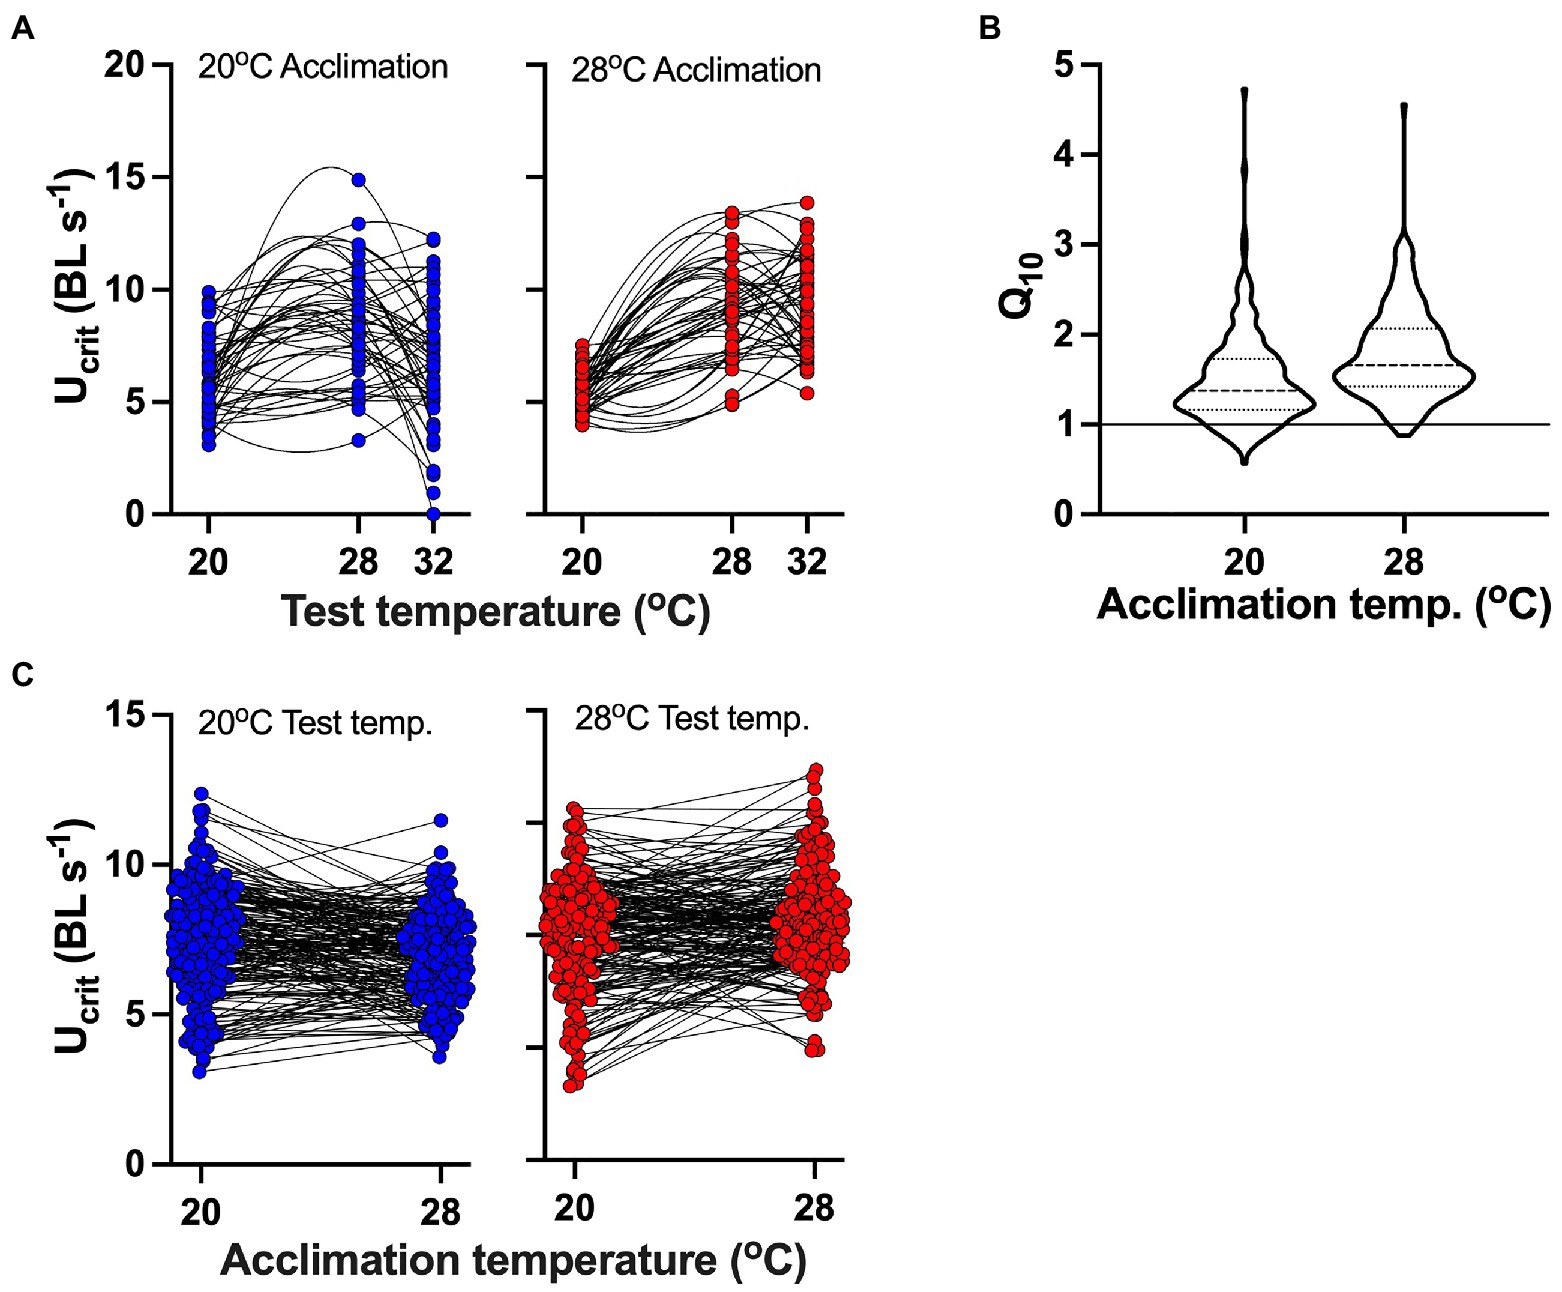
Figure 2. Variation in individual responses to different acclimation and test temperatures. (A) Nonlinear performance (quadratic fit) curves for a subset (N=48; data set 1) of fish for which we recorded swimming performance at three test temperatures; blue symbols indicate acclimation to 20°C, and red symbols indicate acclimation to 28°C. (B) Violin plot of thermal sensitivity (Q10 values between 20 and 28°C acute test temperatures) of individuals (from data sets 1 and 3; n=192 fish) shows considerable variation among individuals acclimated to 20 and 28°C. Thick broken line in violin plots shows mean, and thin broken lines show 95% confidence intervals; the solid line in the plot indicated Q10=1, below which Ucrit decreased with increasing test temperature. (C) Change in performance across acute test temperatures following acclimation to different temperatures. Thin black lines connect datapoints taken from the same individual. Note the pronounced differences in the directions of change in response to different acute test and acclimation temperatures. (B,C) are plots of the same data.
Similar to the patterns of thermal sensitivity described above, there was pronounced variation in acclimation capacity within the total population (data sets 1–3, n=608 fish; Figure 3). Fish phenotypes ranged from having the capacity to fully compensate (and even overcompensate) for the 8–10°C temperature difference following acclimation, to having no capacity for acclimation at all so that Ucrit changed passively (thermodynamically) with an acute change in temperature. Interestingly, there was a trade-off in capacity for acclimation with performance at warm conditions (P28): P28 decreased significantly (regression: Y=12.15−3.39x; R2=0.22, p<0.0001) as P20 increased (Y=3.97+4.67x; R2=0.54, p<0.0001) with increasing acclimation capacity. Across both acclimation treatments, mean performance of fish increased slightly but significantly with increasing acclimation capacity (Y=8.06+0.68x, R2=0.014, p=0.0032; Figure 3). However, the persistence of both plastic and fixed phenotypes in the population indicates that on average, plasticity is not necessarily advantageous over fixed phenotypes, but also that plasticity does not carry a cost that would select against it.
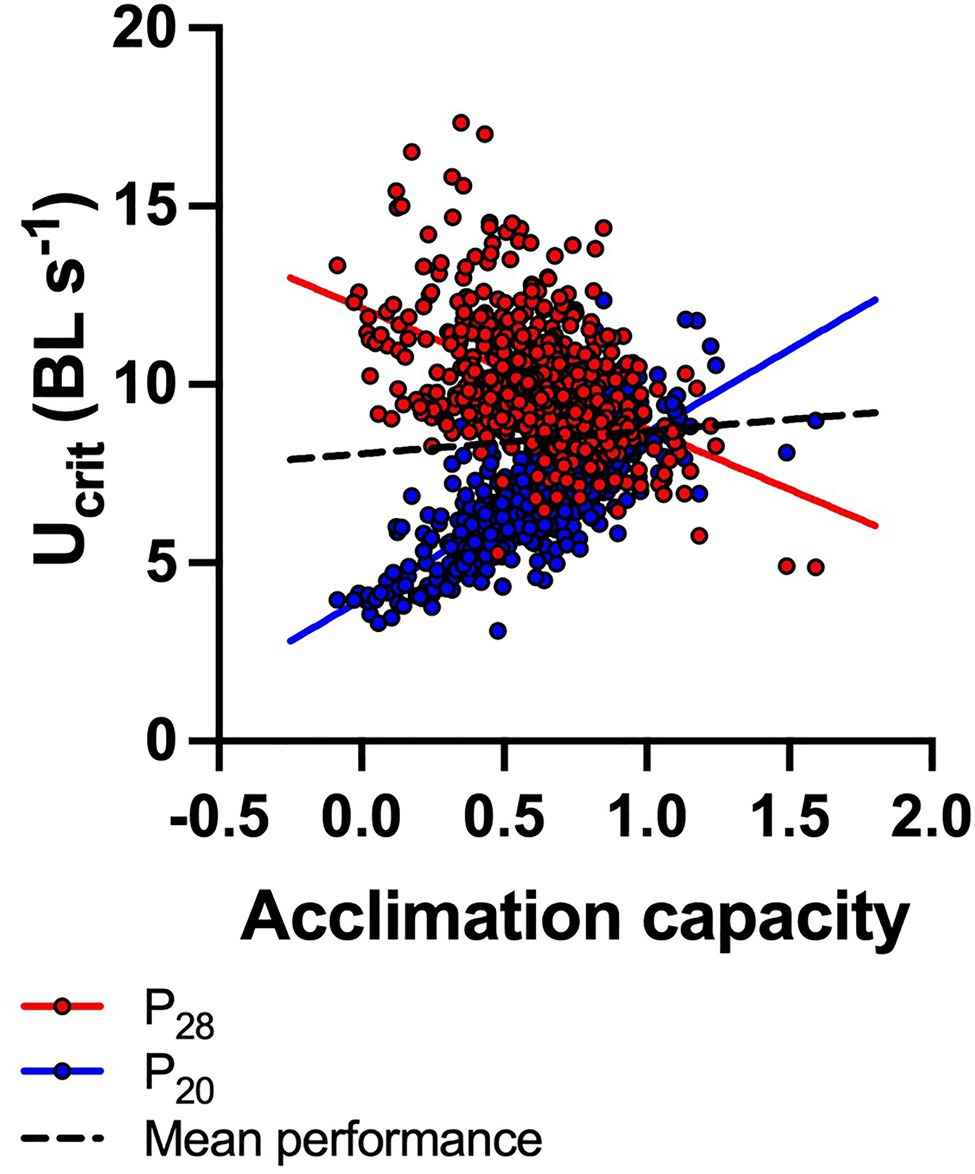
Figure 3. Trade-off between capacity for acclimation and swimming performance (Ucrit) under warm conditions. Acclimation capacity is shown as a dimensionless index (see main text) that indicates the capacity for reversible acclimation (1=perfect compensation; >1=cold-acclimated fish perform better; <1=warm-acclimated fish perform better). Performance at 28°C test temperature of fish acclimated to 28°C (P28, red circles) decreased as acclimation capacity increased, while P20 (Ucrit of 20°C acclimated fish measured at 20°C test temperature) increased. Across both acclimation treatments, mean performance increased slightly with increasing acclimation capacity (broken black line). N=608 fish (both P20 and P28 are plotted for each fish), and significant regression lines are shown (P20: Y=3.97+4.67x; R2=0.54, p<0.0001; P28: Y=12.15−3.39x; R2=0.22, p<0.0001; mean performance: Y=8.06+0.68x, R2=0.014, p=0.0032).
Increased variation of phenotypes can render the populations as a whole more resilient to change if different phenotypes are advantageous under different environmental conditions (Schindler et al., 2015; Blondel et al., 2021). Plasticity is advantageous by buffering performance under cooler conditions, such as in winter, while fixed phenotypes perform better at high temperatures during summer. This evolutionary bet-hedging can increase population persistence (Schindler et al., 2015). Mechanistically, it is an interesting question of what mediates the observed variation between individuals. Reactive oxygen species (ROS) and heat shock proteins can be induced by acute heat or cold exposure (Liu et al., 2018). Cold acclimation also increased ROS production in mosquitofish (Loughland and Seebacher, 2020) and grass snakes (Bury et al., 2018), and salmon acclimated to 20°C had greater rates of oxidative phosphorylation but reduced ROS production compared to 12°C acclimated fish (Gerber et al., 2020). Mosquitofish with high acclimation capacity also have greater antioxidant capacities (Loughland and Seebacher, 2020). Increased ROS as a result of reduced antioxidant capacity can decrease swimming performance (Ghanizadeh-Kazerouni et al., 2016) and may at least partly explain the observed patterns in our study. Alternatively, the dynamics of signalling pathways, from endocrine (e.g. thyroid hormone) to epigenetic (e.g. histone acetylation and DNA methylation), may differ between individuals and thereby cause individual variation (Simmonds and Seebacher, 2017; Little, 2021; Loughland et al., 2021).
Acclimation did not have a significant main effect in any of the ten random samples (all p>0.3), but test temperature was significant in all samples, and on average, Ucrit increased with increasing test temperature (all p<0.003; Figure 4A). There was a significant interaction between test and acclimation temperatures in samples 1 and 7 (p<0.05) and at a one-tailed significance level in sample 3 (p=0.083); the interaction was not significant in any of the other samples (all p>0.24). Knowing the true acclimation capacity of individual fish showed that means mask the variation in acclimation capacity between individuals, and in many samples, individual acclimation capacity ranged from close to no capacity for acclimation (values→0) to perfect compensation for the acclimation temperature difference between treatments (values→1; Figure 4B).
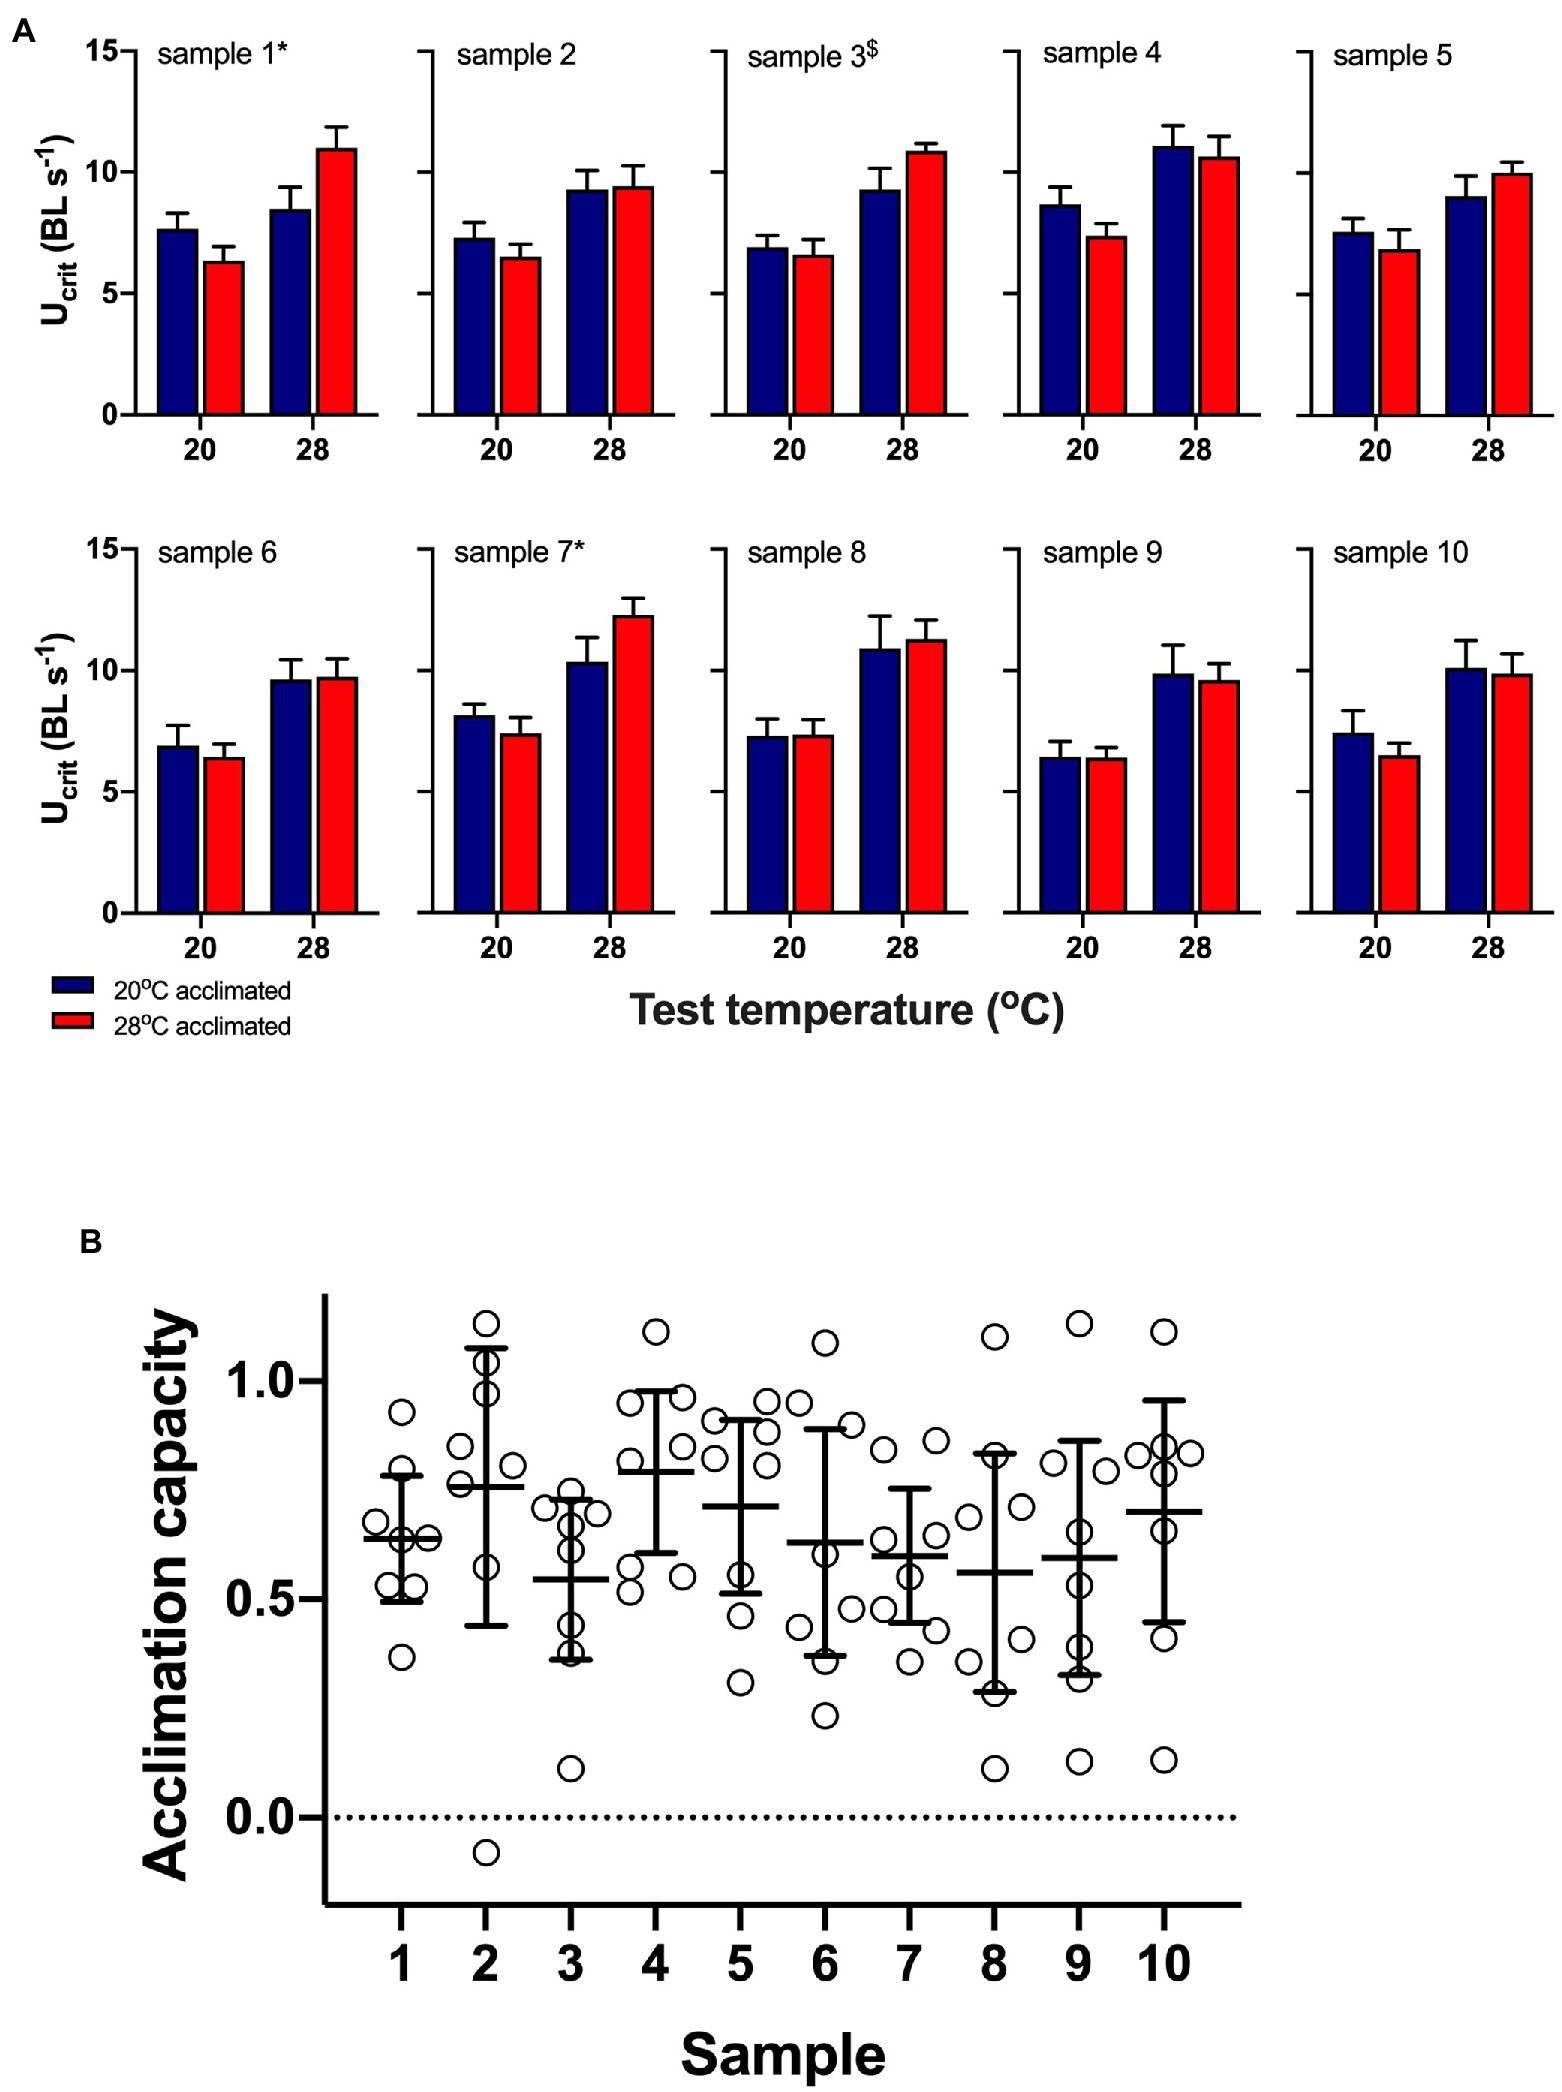
Figure 4. Data from ten random samples of eight fish from the pool of 192 fish (data sets 1 and 3). (A) mean (± s.e.) data from the ten samples showing swimming performance (Ucrit) of 20°C (blue bars) and 28°C (red bars) acclimated fish measured at 20 and 28°C acute test temperatures. Two-factor permutational analyses showed that acclimation did not have a significant main effect in any sample, but test temperature was significant in all samples. There was a significant interaction between test and acclimation temperatures in samples 1 and 7 (p=0.013 and p=0.044, respectively, indicated by *; sample 3: p=0.083 indicated by $). (B) Means (± s.e.) mask the variation in acclimation capacity between individuals, and in most samples, individual acclimation capacity ranged from close to no capacity for acclimation (values→0) to perfect compensation for the acclimation temperature difference between treatments (values→1).
The relatively small sample size simulated here can lead to fundamentally different conclusions about the population as a whole: in most cases, the data showed that there was no acclimation response, but three samples indicated that there was. These results serve as a cautionary note to avoid undersampling of populations and presenting means in the absence of individual values. However, even if larger samples were collected, sample means would mask the underlying variation and obscure the bet-hedging dynamics discussed above. Experimental approaches that compare individuals from different acclimation treatments may not be sufficient to test for costs or trade-offs associated with plasticity, which would require knowledge of within-individual acclimation capacities. Understanding individual variation in acclimation capacity would be necessary to predict how populations can respond to climate variability, where diversity of phenotypes may be important to increase resilience. Sample means can show population trends across time or contexts.
Our simulations showed that in the fluctuating environment, the average Ucrit was similar in all three subpopulations, indicating that capacity for acclimation did not affect mean performance under these circumstances (Figure 5). However, performance in the stable cool environment decreased in the centre and low acclimation subpopulations, but it increased in the stable warm environment in those subpopulations. In contrast, Ucrit of fish with high acclimation capacity did not vary significantly (95% CI) between either the stable or the fluctuating environments.
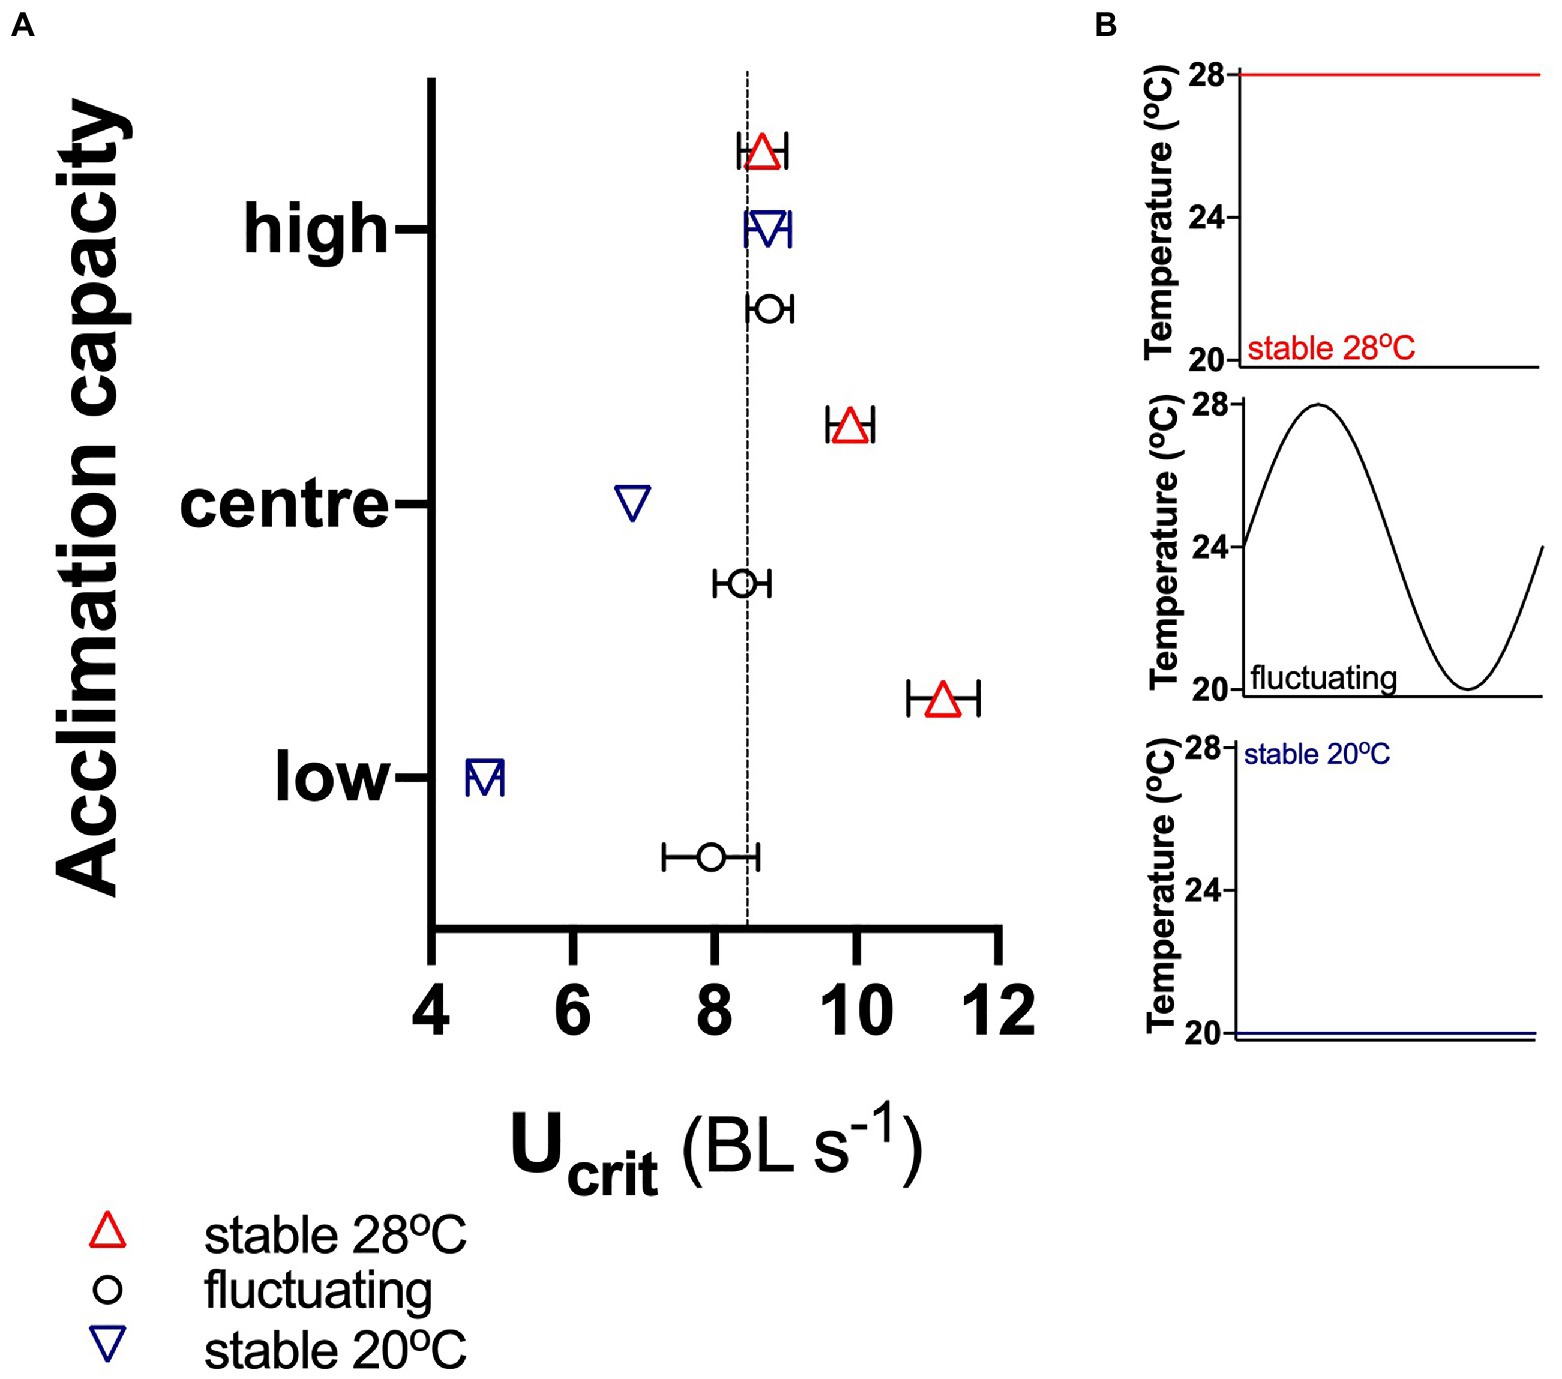
Figure 5. Simulated responses to environmental change. (A) Ucrit of fish with high acclimation capacity (top 10% of the total population of 608 fish), with low acclimation capacity (bottom 10%) and of the central 10% of the total population in different environments: stable at 20 and 28°C and fluctuating between 20 and 28°C (B). Means ± 95% confidence intervals are shown, and the dotted horizontal line in (A) indicates the mean of the total population of 608 fish in the fluctuating environment.
The achievable Ucrit in a variable environment was defined as the per cent of Ucrit (= achievable Ucrit) that was greater than a given fraction of the maximal (90th percentile) Ucrit. In other words, the achievable Ucrit is synonymous with the per cent of time fish could swim faster than a given fraction of maximum in an environment that varied over time (Figure 6). Fish with low acclimation capacity had the highest maximum Ucrit (90th percentile=11.7 body lengths s−1), but in a variable environment, their achievable Ucrit declined rapidly. This result is not surprising because in fish with low acclimation capacity, Ucrit changes thermodynamically in proportion with the acute temperature change. In contrast, fish with central or high acclimation capacity compensated at least partially (centre) for the decline in environmental temperatures. Hence, even though these groups had lower maximum Ucrit (90th percentile: 10.3 and 10.4 BL s−1, respectively), their achievable Ucrit was higher than in the low acclimation subpopulation below approximately 0.8 of maximal Ucrit. The high acclimation capacity subpopulation had the highest achievable Ucrit (Figure 6).
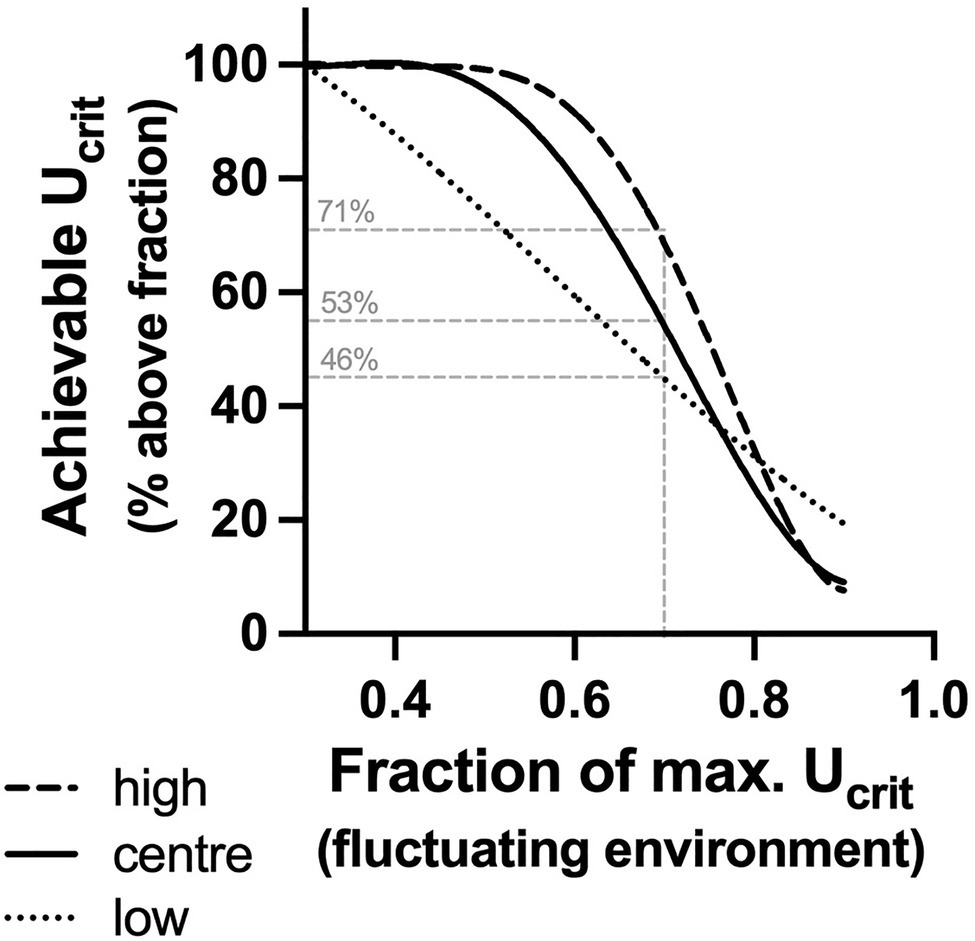
Figure 6. Achievable Ucrit in a variable environment. Per cent of Ucrit (= achievable Ucrit) in each subpopulation that was greater than a given fraction of the maximal (90th percentile) Ucrit of the low acclimation capacity subpopulation. Fish with low acclimation capacity (low, fine broken line) had the highest maximum Ucrit (90th percentile=11.7 BL s−1), but in a variable environment (20–28°C fluctuations), the achievable Ucrit declined rapidly. In contrast, fish with central or high acclimation capacity [centre (solid line) and high (broken line), respectively] had lower maximum Ucrit (90th percentile: 10.3 and 10.4 BL s−1, respectively), but their achievable Ucrit was higher below approximately 0.8 of maximal Ucrit. The thin grey lines indicate a hypothetical scenario, where escape from a predator requires performance that is at least 0.7 of maximal Ucrit. Fish with high acclimation capacity would achieve this 71% of the time, while fish with low acclimation capacity would achieve this only relatively rarely (46%) with centre fish in between (53%).
These nonlinear distributions of achievable Ucrit could present a selective advantage for plastic phenotypes if the ecological outcomes of movement are maximised at a lower than maximal speed. Animals rarely move at their maximum speed, and the functional outcomes of responses such as escaping a predator may be optimised at fractions of maximal speed (Wilson et al., 2015). Success in escaping from a predator may be highest at a submaximal speed because at maximal speeds, precision of movement, information processing and endurance decline, while energetic costs increase (Wilson et al., 2015; Wynn et al., 2015). Conversely, speeds below a given threshold may simply be too slow for the prey to escape (Husak and Fox, 2006). Hypothetically, if it is assumed that a fraction of 0.7 maximal Ucrit is necessary for escape from predators (Husak and Fox, 2006), the different distributions of achievable Ucrit in our subpopulations will influence the success of escaping. Only 46% of Ucrit values in the low acclimation capacity subpopulation fall above 0.7 maximal speed, while 71% of Ucrit values were above 0.7 of maximal speed in the high acclimation capacity subpopulation. Hence, fish with high acclimation capacity would be vulnerable around 30% of the time, while those with low acclimation capacity would be vulnerable more than half the time. This hypothetical example demonstrates that the buffering of Ucrit for low temperatures may translate to a selective advantage across acclimation conditions.
Predictably variable environments are often thought to produce plastic phenotypes. Conversely, plasticity is thought to be selected against in stable environments, which implies that there is a cost of plasticity (DeWitt and Scheiner, 2004; Angilletta, 2009; Auld et al., 2010). Hence, the expectation is that depending on environmental context, populations – or even species – are comprised of either plastic or fixed phenotypes. We show that this is not the case, at least for mosquitofish. The trade-off between plasticity and maximal performance could be interpreted as a cost of plasticity because highly plastic individuals have lower maximal performance. However, animals rarely perform at maximal capacities under natural circumstances, and we show that plastic individuals have an advantage if the outcomes of fitness-related activities such as predator escape are optimised at submaximal performance levels.
Nonetheless, fixed phenotypes persist in the population, so that the advantages of plasticity are not sufficient to replace fixed phenotypes. It is possible that the greater performance of fixed individuals at warm temperatures may be advantageous during summer, when mean lake temperatures increase substantially and there are frequent heat waves. The capacity for plasticity may be outstripped by the degree of temperature rise during these times so that there is higher mortality of plastic phenotypes. Additionally, developmental temperatures can influence phenotypes, and cold conditions during early development produce more plastic individuals, and warm conditions produce individuals that perform better at warm temperatures (Seebacher et al., 2014; Loughland et al., 2021). In a short-lived species like mosquitofish, births at different times of year – and therefore at different temperatures – may suffice to balance population phenotypes. Trade-offs, developmental effects and the advantages of plastic phenotypes together are likely to explain the observed population variation. Note also that different traits within organisms can differ in the plasticity of their performance curves, which adds an additional layer of complexity and trade-offs (Wilson et al., 2002; Bozinovic et al., 2020). The contention that variable environments produce plasticity is likely to be too simplistic, because it does not capture the dynamics of natural populations.
Publicly available data sets were analysed in this study. These data can be found here: Electronic supplementary material for: Seebacher et al., 2015. Dryad Digital Repository: https://doi.org/10.5061/dryad.v6wwpzgs2
FS and AL conceived the ideas and edited the manuscript. FS analysed the data and wrote the manuscript. All authors contributed to the article and approved the submitted version.
The research was funded by Australian Research Council Discovery grant DP190101168 to FS and AL.
The authors declare that the research was conducted in the absence of any commercial or financial relationships that could be construed as a potential conflict of interest.
All claims expressed in this article are solely those of the authors and do not necessarily represent those of their affiliated organizations, or those of the publisher, the editors and the reviewers. Any product that may be evaluated in this article, or claim that may be made by its manufacturer, is not guaranteed or endorsed by the publisher.
We thank Alexander Rubin for help with R code.
The Supplementary Material for this article can be found online at: https://www.frontiersin.org/articles/10.3389/fphys.2021.733305/full#supplementary-material
Auld, J. R., Agrawal, A. A., and Relyea, R. A. (2010). Re-evaluating the costs and limits of adaptive phenotypic plasticity. Proc. R. Soc. B 277, 503–511. doi: 10.1098/rspb.2009.1355
Bateson, P., Gluckman, P., and Hanson, M. (2014). The biology of developmental plasticity and the predictive adaptive response hypothesis. J. Physiol. 592, 2357–2368. doi: 10.1113/jphysiol.2014.271460
Blondel, L., Paterson, I. G., Bentzen, P., and Hendry, A. P. (2021). Resistance and resilience of genetic and phenotypic diversity to “black swan” flood events: A retrospective analysis with historical samples of guppies. Mol. Ecol. 30, 1017–1028. doi: 10.1111/mec.15782
Bozinovic, F., Cavieres, G., Martel, S. I., Alruiz, J. M., Molina, A. N., Roschzttardtz, H., et al. (2020). Thermal effects vary predictably across levels of organization: empirical results and theoretical basis. Proc. R. Soc. B 287:20202508. doi: 10.1098/rspb.2020.2508
Bury, S., Cichoń, M., Bauchinger, U., and Sadowska, E. T. (2018). High oxidative stress despite low energy metabolism and vice versa: Insights through temperature acclimation in an ectotherm. J. Therm. Biol. 78, 36–41. doi: 10.1016/j.jtherbio.2018.08.003
Careau, V., Biro, P. A., Bonneaud, C., Fokam, E. B., and Herrel, A. (2014). Individual variation in thermal performance curves: swimming burst speed and jumping endurance in wild-caught tropical clawed frogs. Oecologia 175, 471–480. doi: 10.1007/s00442-014-2925-7
Costanzo, M., Hou, J., Messier, V., Nelson, J., Rahman, M., VanderSluis, B., et al. (2021). Environmental robustness of the global yeast genetic interaction network. Science 372:eabf8424. doi: 10.1126/science.abf8424
DeLong, J. P., Gibert, J. P., Luhring, T. M., Bachman, G., Reed, B., Neyer, A., et al. (2017). The combined effects of reactant kinetics and enzyme stability explain the temperature dependence of metabolic rates. Ecol. Evol. 7, 3940–3950. doi: 10.1002/ece3.2955
DeWitt, T., and Scheiner, S. (2004). Phenotypic Plasticity: Functional and Conceptual Approaches. UK: Oxford University Press.
Drummond, G. B., and Vowler, S. L. (2012). Different tests for a difference: how do we do research? J. Physiol. 590, 235–238. doi: 10.1113/jphysiol.2011.225235
Gerber, L., Clow, K. A., Mark, F. C., and Gamperl, A. K. (2020). Improved mitochondrial function in salmon (Salmo salar) following high temperature acclimation suggests that there are cracks in the proverbial ‘ceiling’. Sci. Rep. 10:21636. doi: 10.1038/s41598-020-78519-4
Ghanizadeh-Kazerouni, E. G., Franklin, C. E., and Seebacher, F. (2016). UV-B exposure reduces locomotor performance by impairing muscle function but not mitochondrial ATP production. J. Exp. Biol. 219, 96–102. doi: 10.1242/jeb.131615
Glanville, E. J., and Seebacher, F. (2006). Compensation for environmental change by complementary shifts of thermal sensitivity and thermoregulatory behaviour in an ectotherm. J. Exp. Biol. 209, 4869–4877.
Haaland, T. R., Wright, J., and Ratikainen, I. I. (2020). Generalists versus specialists in fluctuating environments: a bet-hedging perspective. Oikos 129, 879–890. doi: 10.1111/oik.07109
Huey, R. B., and Kingsolver, J. G. (1989). Evolution of thermal sensitivity of ectotherm performance. Trends Ecol. Evol. 4, 131–135. doi: 10.1016/0169-5347(89)90211-5
Husak, J. F., and Fox, S. F. (2006). Field use of maximal sprint speed by collared lizards (Crotaphytus collaris): compensation and sexual selection. Evolution 60, 1888–1895. doi: 10.1111/j.0014-3820.2006.tb00532.x
Kingsolver, J. G., and Buckley, L. B. (2017). Quantifying thermal extremes and biological variation to predict evolutionary responses to changing climate. Philos. Trans. R. Soc. B 372:20160147. doi: 10.1098/rstb.2016.0147
Kingsolver, J. G., Moore, M. E., Hill, C. A., and Augustine, K. E. (2020). Growth, stress, and acclimation responses to fluctuating temperatures in field and domesticated populations of Manduca sexta. Ecol. Evol. 10, 13980–13989.
LeRoy, A., Loughland, I., and Seebacher, F. (2017). Differential effects of developmental thermal plasticity across three generations of guppies (Poecilia reticulata): canalization and anticipatory matching. Sci. Rep. 7:4313. doi: 10.1038/s41598-017-03300-z
Little, A. G. (2021). Thyroid hormone regulation of thermal acclimation in ectotherms: Physiological mechanisms and ecoevolutionary implications. Mol. Cell. Endocrinol. 530:111285. doi: 10.1016/j.mce.2021.111285
Liu, Z.-P., Gu, W.-B., Tu, D.-D., Zhu, Q.-H., Zhou, Y.-L., Wang, C., et al. (2018). Effects of both cold and heat stress on the liver of the giant spiny frog (Quasipaa spinosa): stress response and histological changes. J. Exp. Biol. 221:jeb186379. doi: 10.1242/jeb.186379
Loughland, I., Little, A. G., and Seebacher, F. (2021). DNA methyltransferase 3a mediates developmental thermal plasticity. BMC Biol. 19:11. doi: 10.1186/s12915-020-00942-w
Loughland, I., and Seebacher, F. (2020). Differences in oxidative status explain variation in thermal acclimation capacity between individual mosquitofish (Gambusia holbrooki). Funct. Ecol. 34, 1380–1390. doi: 10.1111/1365-2435.13563
Ludbrook, J., and Dudley, H. (1998). Why permutation tests are superior to t and F tests in biomedical research. Am. Stat. 52, 127–132.
McKenzie, D. J., Zhang, Y., Eliason, E. J., Schulte, P. M., Claireaux, G., Blasco, F. R., et al. (2021). Intraspecific variation in tolerance of warming in fishes. J. Fish Biol. 98, 1536–1555. doi: 10.1111/jfb.14620
Safi, H., Zhang, Y., Schulte, P. M., and Farrell, A. P. (2019). GThe effect of cute warming and thermal acclimation on maximum heart rates of the common killifish Fundulus heteroclitus. J. Fish Biol. 95, 1441–1446.
Schindler, D. E., Armstrong, J. B., and Reed, T. E. (2015). The portfolio concept in ecology and evolution. Front. Ecol. Environ. 13, 257–263. doi: 10.1890/140275
Schulte, P. M., Healy, T. M., and Fangue, N. A. (2011). Thermal performance curves, phenotypic plasticity, and the time scales of temperature exposure. Integr. Comp. Biol. 51, 691–702. doi: 10.1093/icb/icr097
Seebacher, F., Beaman, J. E., and Little, A. G. (2014). Regulation of thermal acclimation varies between generations of the short-lived mosquitofish that developed in different environmental conditions. Funct. Ecol. 28, 137–148. doi: 10.1111/1365-2435.12156
Seebacher, F., Ducret, V., Little, A. G., and Adriaenssens, B. (2015). Generalist–specialist trade-off during thermal acclimation. R. Soc. Open Sci. 2:140251. doi: 10.1098/rsos.140251
Simmonds, A. I. M., and Seebacher, F. (2017). Histone deacetylase activity modulates exercise-induced skeletal muscle plasticity in zebrafish (Danio rerio). Am. J. Physiol. Regul. Integr. Comp. Physiol. 313, R35–R43. doi: 10.1152/ajpregu.00378.2016
Sinclair, B. J., Vasseur, D., Marshall, K. E., Sewell, M. A., Levesque, D. L., Willett, C. S., et al. (2016). Can we predict ectotherm responses to climate change using thermal performance curves and body temperatures? Ecol. Lett. 19, 1372–1385. doi: 10.1111/ele.12686
Tattersall, G. J., Sinclair, B. J., Withers, P. C., FIields, P. A., Seebacher, F., Cooper, C. E., et al. (2012). Coping with thermal challenges: physiological adaptations to environmental temperatures. Compr. Physiol. 2, 2151–2202. doi: 10.1002/cphy.c110055
Wheeler, R. E., and Torchiano, M. (2016). Permutation tests for linear models in R. R Package Version 2.1.0.
Wilson, R. S., Husak, J. F., Halsey, L. G., and Clemente, C. J. (2015). Predicting the movement speeds of animals in natural environments. Integr. Comp. Biol. 55, 1125–1141. doi: 10.1093/icb/icv106
Wilson, R., James, R. S., and Damme, R. V. (2002). Trade-offs between speed and endurance in the frog Xenopus laevis: a multi-level approach. J. Exp. Biol. 205, 1145–1152. doi: 10.1242/jeb.205.8.1145
Woods, H. A., Kingsolver, J. G., Fey, S. B., and Vasseur, D. A. (2018). Uncertainty in geographical estimates of performance and fitness. Methods Ecol. Evol. 9, 1996–2008. doi: 10.1111/2041-210X.13035
Keywords: bet-hedging, plasticity, swimming performance, acclimation, environmental variation
Citation: Seebacher F and Little AG (2021) Plasticity of Performance Curves in Ectotherms: Individual Variation Modulates Population Responses to Environmental Change. Front. Physiol. 12:733305. doi: 10.3389/fphys.2021.733305
Edited by:
Jörn Rittweger, Helmholtz Association of German Research Centers (HZ), GermanyReviewed by:
Jonas Böcker, Helmholtz Association of German Research Centers (HZ), GermanyCopyright © 2021 Seebacher and Little. This is an open-access article distributed under the terms of the Creative Commons Attribution License (CC BY). The use, distribution or reproduction in other forums is permitted, provided the original author(s) and the copyright owner(s) are credited and that the original publication in this journal is cited, in accordance with accepted academic practice. No use, distribution or reproduction is permitted which does not comply with these terms.
*Correspondence: Frank Seebacher, ZnJhbmsuc2VlYmFjaGVyQHN5ZG5leS5lZHUuYXU=
Disclaimer: All claims expressed in this article are solely those of the authors and do not necessarily represent those of their affiliated organizations, or those of the publisher, the editors and the reviewers. Any product that may be evaluated in this article or claim that may be made by its manufacturer is not guaranteed or endorsed by the publisher.
Research integrity at Frontiers
Learn more about the work of our research integrity team to safeguard the quality of each article we publish.