 Li-Da Chen1†
 Zhi-Wei Huang
94% of researchers rate our articles as excellent or good
Learn more about the work of our research integrity team to safeguard the quality of each article we publish.
Find out more
ORIGINAL RESEARCH article
Front. Physiol., 08 July 2021
Sec. Metabolic Physiology
Volume 12 - 2021 | https://doi.org/10.3389/fphys.2021.701035
Obstructive sleep apnea (OSA) has been demonstrated to be associated with liver injury. Nevertheless, the mechanisms linking the two disorders remain largely unexplored to date. Based on UHPLC/Q-TOF MS platform, the present study aimed to study the hepatic metabolomic profiling in a chronic intermittent hypoxia (CIH) mouse model to identify altered metabolites and related metabolic pathways. C57BL/6 Mice (n = 12 each group) were exposed to intermittent hypoxia or control conditions (room air) for 12 weeks. At the end of the exposure, liver enzymes and histological changes were assessed. Untargeted metabolomics approach by UHPLC/Q-TOF MS and orthogonal partial least squares-discriminant analysis (OPLS-DA) were applied to screen altered metabolites in mice liver. Bioinformatics analyses were applied to identify the related metabolic pathways. CIH treatment caused a remarkable liver injury in mice. A total of 27 differential metabolites in negative ion mode and 44 in positive ion mode were identified between the two groups. These metabolites were correlated to multiple biological and metabolic processes, including various amino acid metabolism, membrane transport, lipid metabolism, carbohydrate metabolism, nucleotide metabolism, ferroptosis, etc. three differential metabolites including glutathione, glutathione disulfide, arachidonic acid (peroxide free) were identified in the ferroptosis pathway. CIH was associated with a significant metabolic profiling change in mice liver. The metabolites in amino acid metabolism, membrane transport, lipid metabolism, carbohydrate metabolism, nucleotide metabolism, and ferroptosis played an important role in CIH-induced liver injury. These findings contribute to a better understanding of the mechanisms linking OSA and liver injury and help identify potential therapeutic targets.
Obstructive sleep apnea (OSA) is a breathing disorder characterized by intermittent nocturnal oxyhemoglobin desaturations and sleep disruption. Obesity, male gender, older age, post-menopausal state, smoking, sedative use, upper airway soft tissue abnormalities, and craniofacial changes are vital risk factors for OSA (Young et al., 2004). It has emerged as a major public health concern due to its high prevalence in mortality and morbidity (Young et al., 1993; Lindberg and Gislason, 2000; Young et al., 2008). The association between OSA and liver diseases has been investigated in previous clinical and animal studies (Savransky et al., 2007a,b; Sundaram et al., 2014). The results suggested that OSA acted as an important risk factor for liver injury, especially non-alcoholic fatty liver disease (NAFLD) (Musso et al., 2012; Mirrakhimov and Polotsky, 2012; Mesarwi et al., 2019).
A meta-analysis including 18 studies with 2183 participants revealed that OSA was correlated to an increased risk of NAFLD, non-alcoholic steatohepatitis, and fibrosis (Musso et al., 2013). Our previous study indicated that OSA severity was associated with elevation of serum aminotransferases and liver steatosis after controlling confounding factors (Chen et al., 2018). A study based on pediatric population suggested that OSA and its related hypoxemia were associated with biochemical and histological measures of NAFLD severity (Sundaram et al., 2014). The mechanisms linking OSA and liver injury have been attributed to different causes, such as oxidative stress, hepatic inflammation, and metabolic disorders (Mirrakhimov and Polotsky, 2012; Paschetta et al., 2015). However, the underlying mechanisms are still being debated.
Metabolomics is a high throughput analytical technique which measures the concentrations of low-molecular-weight metabolites based on either mass spectrometry or nuclear magnetic resonance spectroscopy (Nicholson et al., 1999). Metabolomics provides a unique perspective into biological processes relative to genomics and proteomics as metabolomics identifies what is actually happening in the system (Riekeberg and Powers, 2017). Metabolomics has been widely used to aid in the unraveling of pathophysiological mechanism and identification of potential biomarkers as well as new therapeutic targets for human diseases (Nicholson and Lindon, 2008; Suhre and Gieger, 2012). Ultra-high performance liquid chromatography/quadrupole time-of-flight mass spectrometry (UHPLC/Q-TOF MS) system was widely used because of its better resolution, higher peak capacity and increased sensitivity.
Chronic intermittent hypoxia (CIH) is the primary pathophysiological characteristic of OSA (Dempsey et al., 2010). CIH animal model has been well established and used to study the pathophysiology of OSA. In the present study, we aimed to study the hepatic metabolomic profiling in a CIH mouse model to identify altered metabolites and related metabolic pathways by UHPLC/Q-TOF MS platform. This could provide a new insight into the pathogenesis of OSA-related liver injury.
Twenty-four wild-type 8-week-old C57BL/6 male mice (body weight, 17–19 g) were purchased from Xiamen University Laboratory Animal Center (Xiamen, China). The mice were housed in cages with a 12-h-day/12-h-night cycle and were freely allowed standard chow and water. All the mice were acclimatized for a week and then randomly assigned to two groups (n = 12 each group) using a random number table: CIH and normal control (NC) group. All animal experiments were performed according to the standard ethical guidelines and approved by Xiamen University Animal Care and Use Committee (XMULAC20201002).
Mice in the CIH group were subjected to IH for 12 weeks. The protocol of IH was established according to our previous study (Chen et al., 2020b). The one cycle of IH contained the following elements: oxygen concentration was reduced from 21 to 6% during the first 40 s, stayed at that concentration for 20 s, and then rapidly re-oxygenated to 21% during the subsequent 40 s, stayed at that concentration for another 20s. The mice were exposed to IH for 8 h per day (08:00 a.m. to 04:00 p.m.) during the light phase. NC group mice were kept in room air at the same time. Body weight was monitored weekly for each animal during the whole period of experiment.
Before sacrifice, all mice were fasted for 5 h. At the end of the study period, the mice were euthanized by CO2 inhalation. Blood draw was performed. The blood samples were collected into centrifuge tubes and centrifuged at 3,000 g for 15 min at 4°C to obtain supernatants for analysis. The liver was quickly removed and washed in phosphate buffer saline. The section of the entire median lobe was placed in 10% neutral buffered formalin. Liver samples from the left lateral liver lobe of each animal were immediately snap-frozen in liquid nitrogen for subsequent metabolomics analyses.
Serum aspartate aminotransferase (AST) and alanine aminotransferase (ALT) levels were measured by the standard photometric method using a commercial kit (Jiancheng Bioengineering Institute, Nanjing, China).
The livers were fixed in 10% buffered formalin and then dehydrated in ascending grades alcohol, and embedded in paraffin wax. Then the paraffin embedded samples were serially cut into sections of 5 μm thickness. The liver tissue sections were further hematoxylin dye stained, washed in the running water, then stained with eosin and mounted under coverslips. Histologic examination was performed by a pathologist who was blinded to the group assignment with an Olympus light microscope (Olympus BX50, Tokyo, Japan).
One milliliter of cold extraction solvent methanol/acetonitrile/H2O (2:2:1, v/v/v) was added to 80 mg sample, and they were adequately vortexed. The lysate was homogenized by MP homogenizer (24 × 2, 6.0 M/S, 60 s, twice) and sonicated at 4°C (30 min/once, twice) then centrifuged at 14,000 g for 20 min at 4°C and the supernatant was dried in a vacuum centrifuge at 4°C. For LC-MS analysis, the samples were re-dissolved in 100 μL acetonitrile/water (1:1, v/v) solvent.
Metabolomics analyses were performed on an Agilent 1290 Infinity LC system (Agilent Technologies, Santa-Clara, CA, United States) coupled to an AB SCIEX Triple TOF 6600 System (AB SCIEX, Framingham, MA, United States) with electrospray ionization (ESI) in the negative and positive modes in Applied Protein Technology Co., Ltd. (Shanghai, China). Chromatographic separation was conducted using ACQUITY UPLC BEH Amide 1.7 μm, 2.1 mm × 100 mm column (waters, Ireland). The column temperature was set at 25°C, injection volume was set at 2 μL, and flow rate was set at 0.5 mL/min. The composition of mobile phase was as follows: A = 25 mM ammonium hydroxide and equal amount of ammonium acetate in water, B = acetonitrile. The flow rate was 0.4 ml/min. The process of linear gradient elution was as follows: 0–0.5 min, 95% B; 0.5–7 min, 95% B to 65% B; 7–8 min, 65% B to 40% B; 8–9 min, stabilized at 40% B; 9–9.1 min, 40% B to 95% B; and 9.1–12 min, stabilized at 95%. Samples were put in automatic sampler at 4°C during the experiment. The quality control samples were utilized to assess the system stability and data quality.
The ESI source conditions were set as follows: Ion Source Gas1, 60 psi; Ion Source Gas2, 60 psi; IonSpray Voltage Floating ± 5,500 V; source temperature, 600°C; TOF MS scan m/z range, 60–1,000 Da; product ion scan m/z range, 25–1,000 Da; TOF MS scan accumulation time, 0.20 s/spectra; product ion scan accumulation time, 0.05 s/spectra. Information dependent acquisition was utilized to acquire the MS/MS spectra under high sensitivity model. The parameters were as follow: declustering potential, ± 60 V; exclude isotopes within 4 Da; Collision Energy, 35 ± 15 eV; candidate ions to monitor per cycle, 10.
The raw MS data in Wiff format were converted into. mzXML format by Proteo Wizard MS Converter tool and then processed by R package XCMS. The process included peak alignment, retention time correction, and peak area extraction. For the metabolomics analysis, normalized data were imported into SIMCA-P (version 14.1, Umea, Sweden) and used for multivariate analysis such as orthogonal partial least-squares discriminant analysis (OPLS-DA) and Pareto-scaled principal component analysis (PCA). The model was validated based on R2 and Q2-values and the results of permutation experiments. Q2 represents the prediction performance of the model, and R2 represents the percentage of the variable that the model can interpret in a certain direction. The more Q2 is closer to 1, the better the model. The combination of Student’s t-test (p-value) on the data and statistically significant thresholds of variable importance in the projection (VIP) values obtained from OPLS-DA model was applied to identify the differential metabolites. The p-values less than 0.05 and VIP values larger than 1.0 were regarded as significant. Kyoto Encyclopedia of Genes and Genomes (KEGG) was used to analyze the relevant pathways enriched by metabolites.
Data were presented as means ± standard deviation (SD). Student’s t-test was adopted to assess significant differences between two groups. GraphPad Prism version 8.0 was used for the statistical analysis (GraphPad Software Inc., San Diego, CA, United States). The p-value was considered significant if it is less than 0.05.
As shown in Figure 1A, no significant difference was noted in the baseline body weight between two groups (17.94 ± 0.64 vs. 18.10 ± 0.48 g, p0.05), the body weight of mice was statistically lower in CIH group than that in NC group after 12 weeks of exposure (29.01 ± 0.86 vs. 26.08 ± 0.42 g, p < 0.001). In addition, CIH resulted in significant elevation in both serum ALT (30.34 ± 4.97 vs. 41.30 ± 4.62 U/L, p < 0.001) and AST (45.35 ± 10.18 vs. 65.19 ± 14.62 U/L, p < 0.01) (Figures 1B,C). The liver histology was further evaluated. Hepatic morphology was found to be normal in the NC group with no obvious lobular necrosis or portal inflammation (Figure 1D). The liver tissue of CIH group revealed lobular necrosis and portal inflammation (Figure 1D).
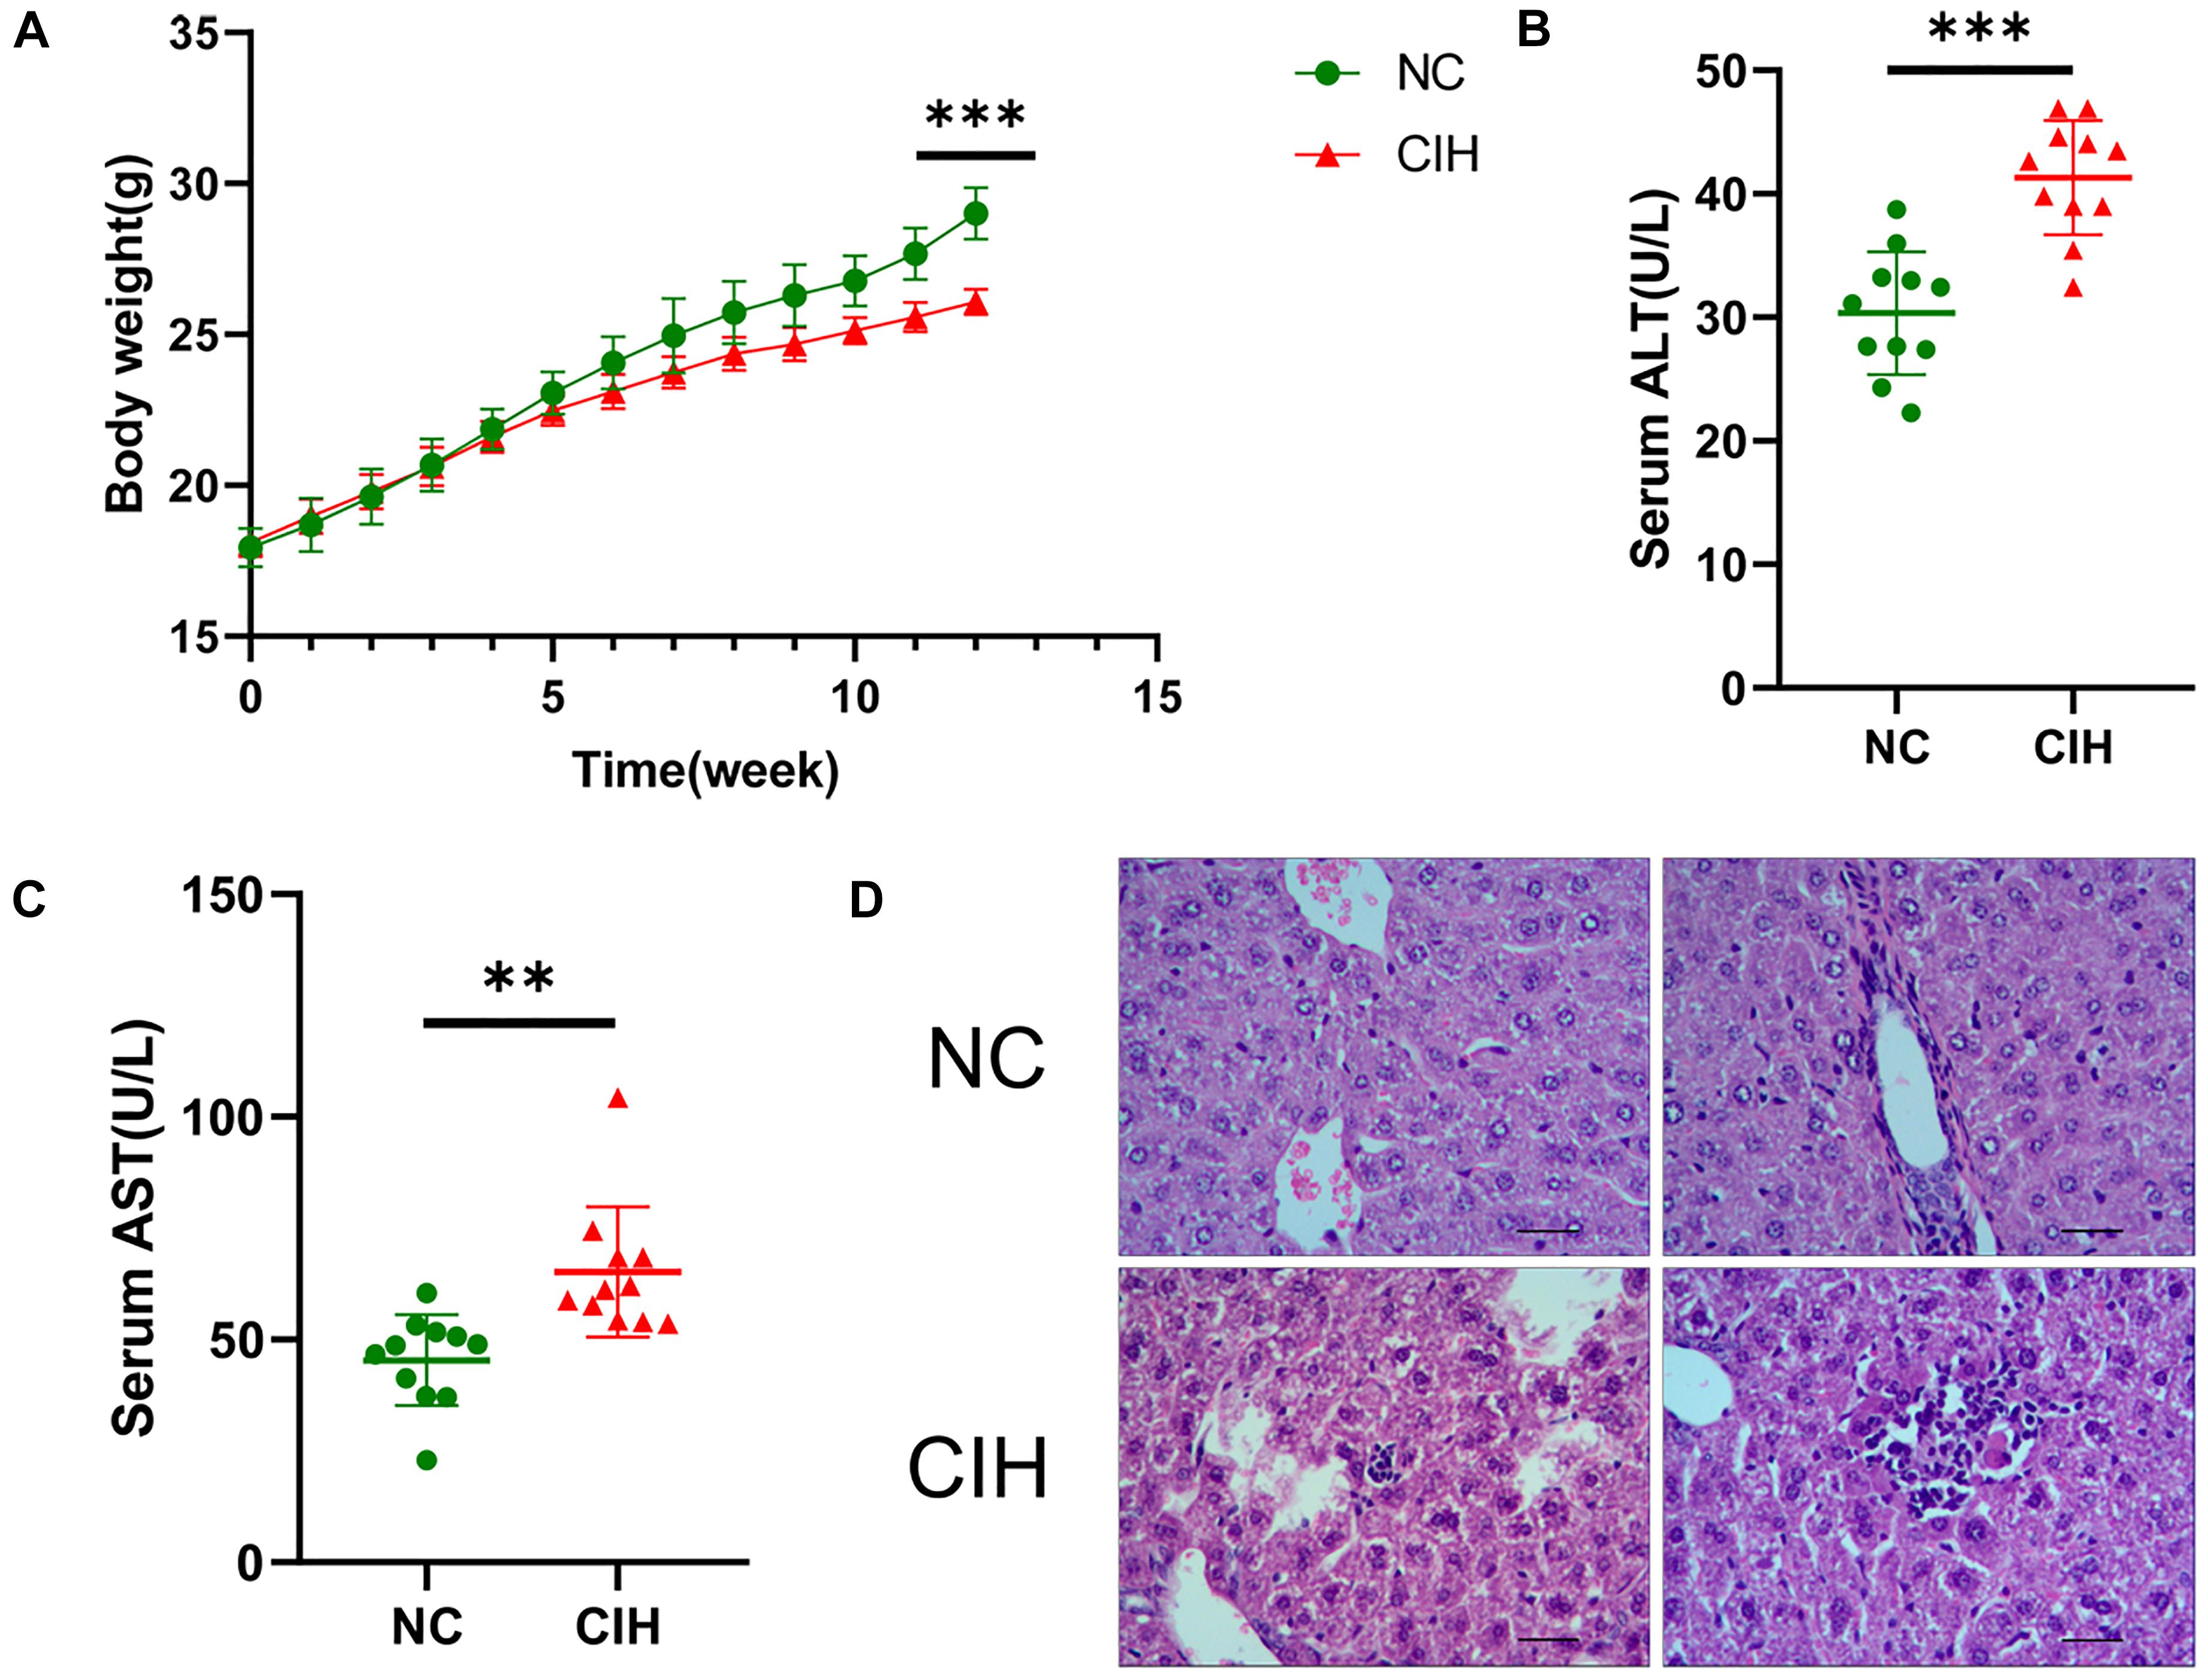
Figure 1. Effect of CIH on body weight, liver enzymes, and liver histology. (A) The body weight of mice in CIH group is significantly lower than that in NC group after 12 weeks of exposure. (B) Both serum ALT and (C) AST levels of mice in CIH group are significantly higher than those in NC group (n = 11 each group). (D) Hepatic morphology was found to be normal in the NC group with no obvious lobular necrosis or portal inflammation (original magnification, isd t; scale bar, 50 ic). The liver tissue of CIH group revealed lobular necrosis and portal inflammation (original magnification, group scale bar, 50 μs). ∗∗p < 0.01; ∗∗∗p < 0.001.
Supplementary Figures 1A,B showed the total ion chromatograms of the quality control sample. It revealed that the variation result from instrumental error was small during the analysis as the retention time and response strength of each chromatographic peak almost overlapped. The Pearson correlation analysis results demonstrated that the repeatability of experiment was good as the correlation coefficients between quality control samples are all above 0.9 (Supplementary Figures 1C,D). There is general consensus that an RSD of the quality control samples < 0.3 is indicative of good reproducibility. More than 80 percent of peaks in this experiment had an RSD < 0.3. This proved that the instrument analysis system was stable (Supplementary Figures 1E,F). In addition, Hotelling’s T2 analysis showed that all the samples in this study were all within the 99% confidence interval, confirming a good repeatability (Supplementary Figures 1G,H). Multivariate control chart showed that the score values of all samples fell within ± 3SD, reflecting that the instrument volatility was mild (Supplementary Figures 1I,J). The above results suggested that the instrument analysis system was stable and the data were reliable.
The comparison between CIH group and NC group was performed based on multivariate statistical analysis including PCA and OPLS-DA techniques to examine clusters for each group. The PCA analysis showed that the metabolomic profiles of CIH mice were distinctly separated from NC mice for both positive (R2X = 0.546, Figure 2A) and negative ion modes (R2X = 0.579; Figure 2B). This suggested that CIH induced significant changes in the biochemical metabolites in mice liver. In addition, the differences between the CIH and NC mice were identified by the supervised OPLS-DA model. Figures 2C,D showed the OPLS-DA scores plot. A clear distinction was noted between CIH and NC mice for both positive (R2X = 0.506, R2Y = 0.99, Q2 = 0.828) and negative ion modes (R2X = 0.614, R2Y = 0.978, Q2 = 0.804). Figures 2E,F presented the permutation test plot. All permutated values were lower than the original values at the right and the line plot intercepted Y-axis below zero, this suggested that the original OPLS-DA model was valid and not over-fitted.
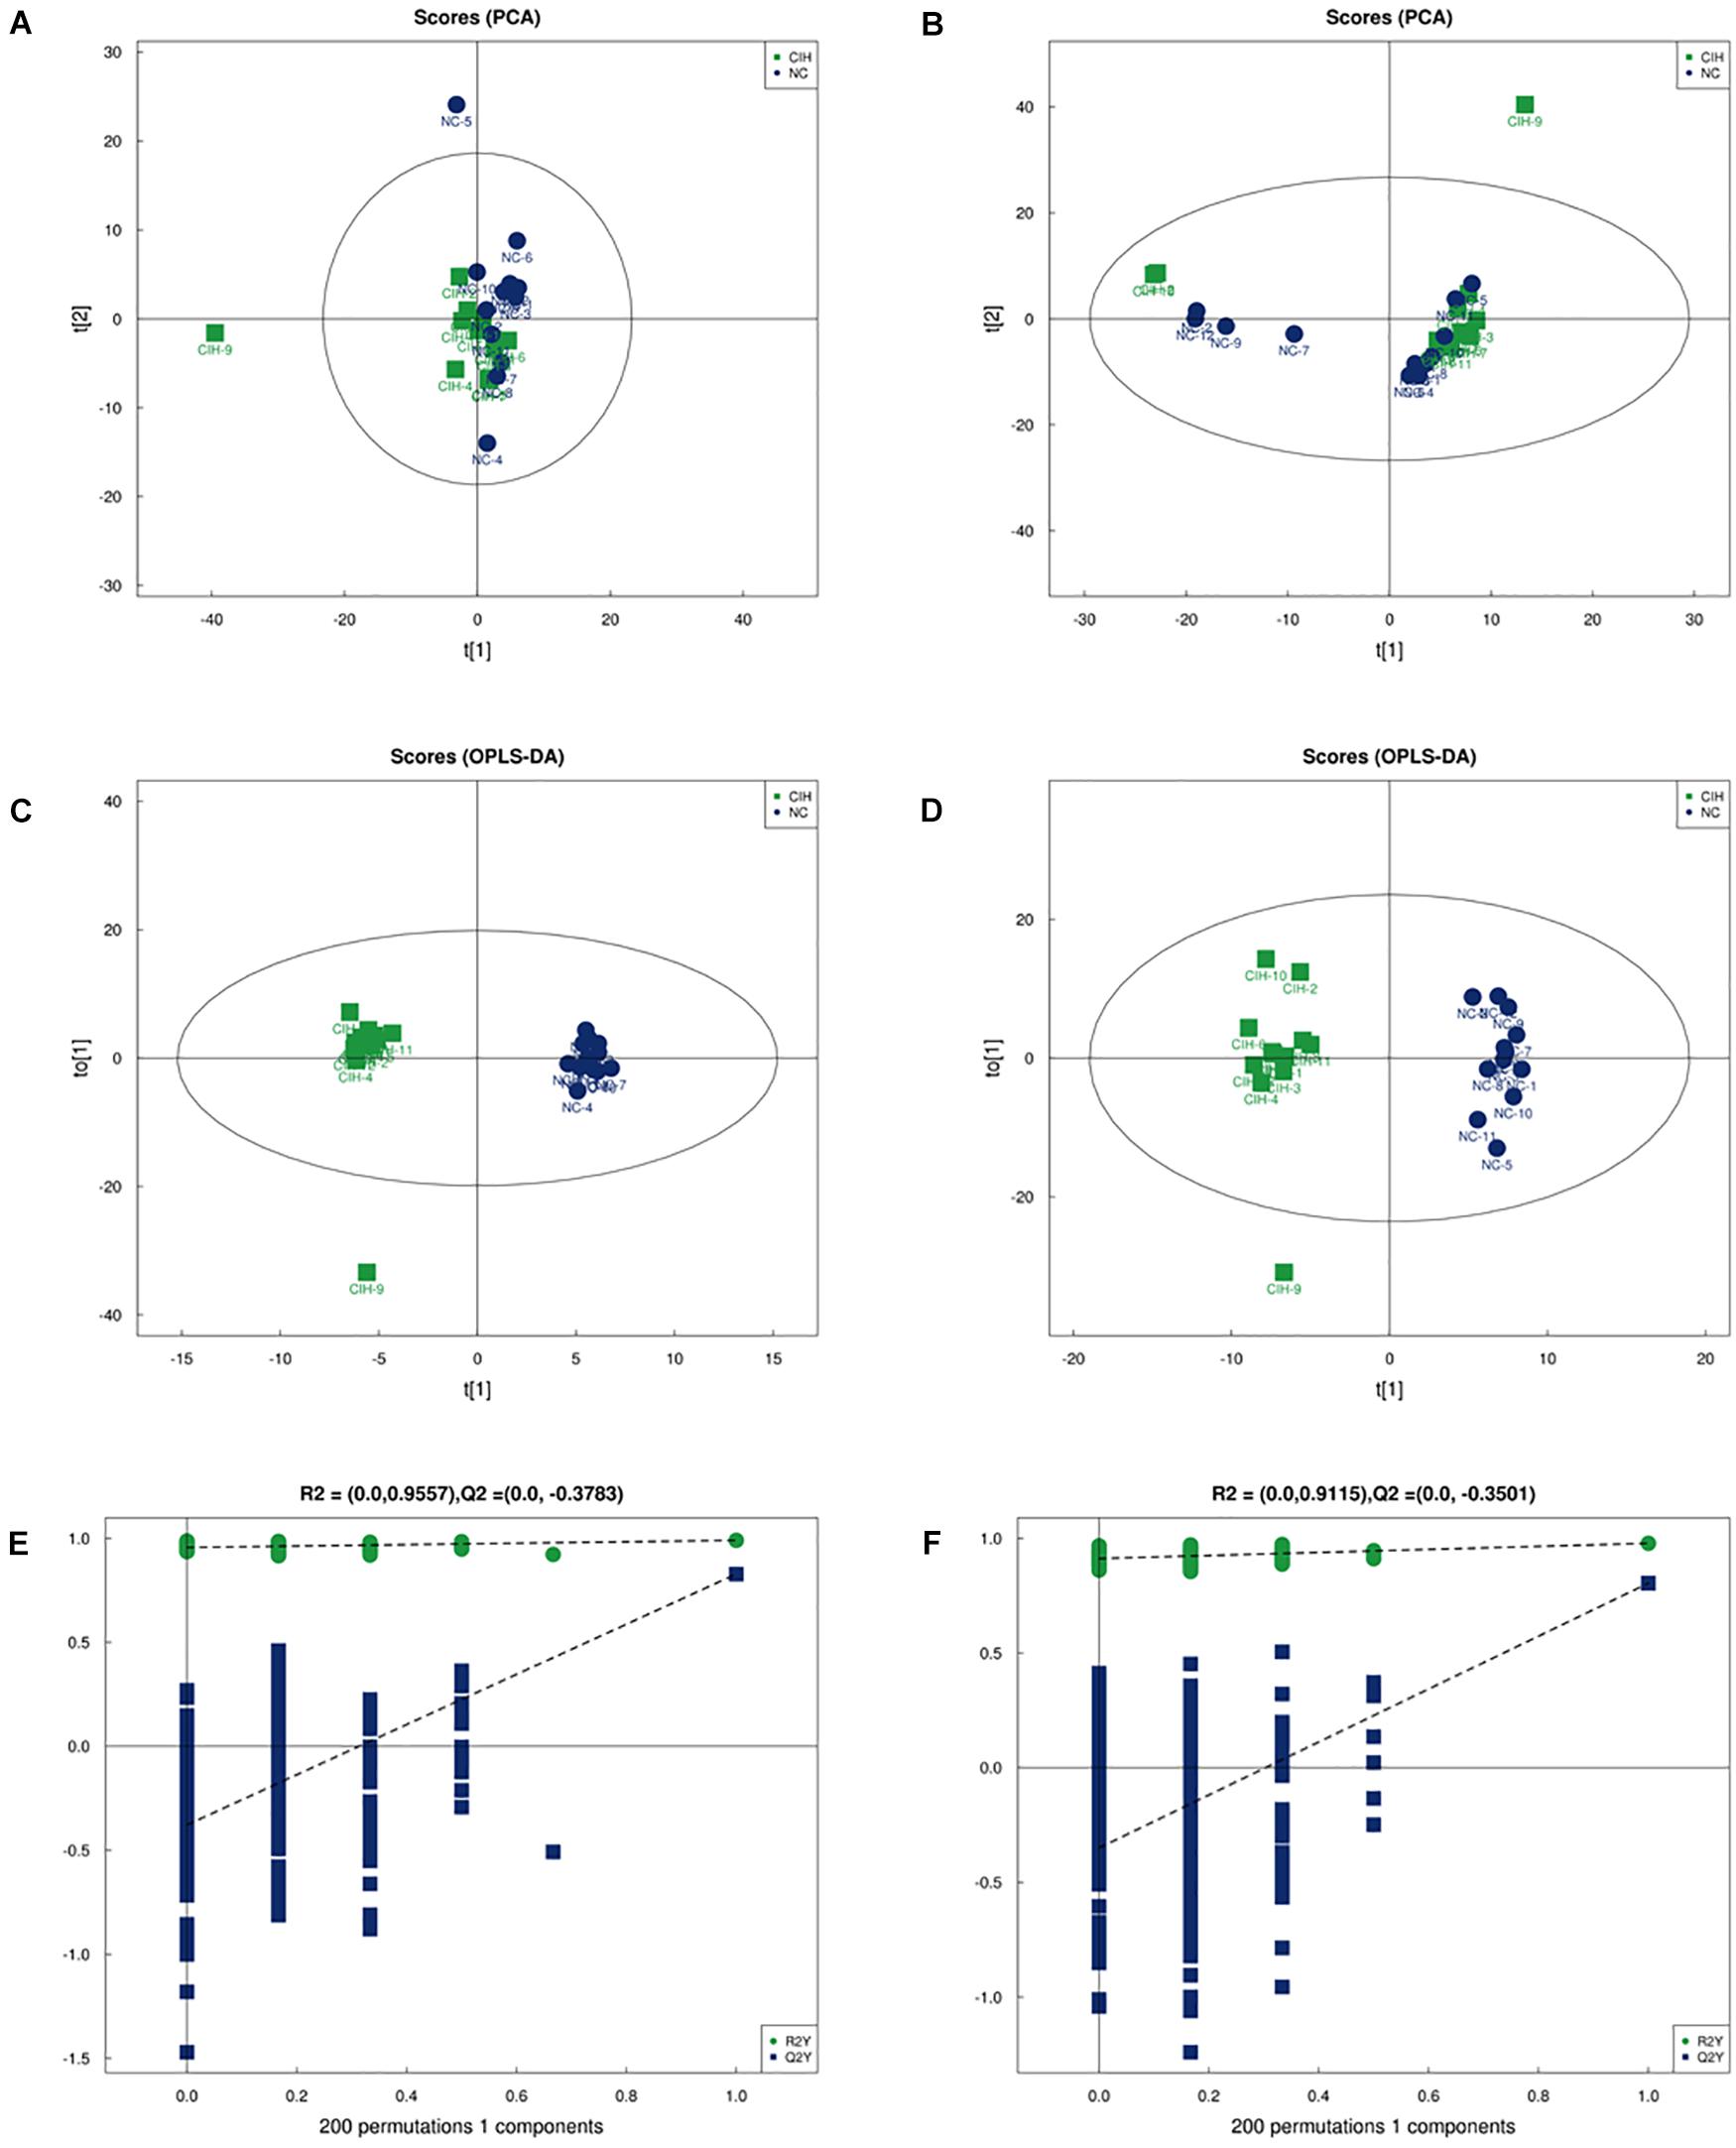
Figure 2. Multivariate analysis of UHPLC-Q-TOF/MS data (A) Score plot of PCA in positive ion mode (R2X = 0.546) and (B) negative ion modes (R2X = 0.579). (C) Score plot of OPLS-DA in positive ion mode (R2X = 0.506, R2Y = 0.99, and Q2 = 0.828) and (D) negative ion mode (R2X = 0.614, R2Y = 0.978, and Q2 = 0.804). (E) Permutation test results of the OPLS-DA model in the positive ion mode and (F) negative ion mode. The Q2-value represents the predictability of the model. The R2Y value represents the goodness of fit of the model. All R2Y and Q2 values to the left are lower than the original points to the right, suggesting that the OPLS-DA model is valid.
The variable VIP generated by OPLS-DA analysis was used to select those metabolites with obvious discrimination potential. The higher VIP score of metabolites means a greater discrimination potential. Based on the criteria of p < 0.05 and VIP > 1, a total of 44 differential metabolites in positive ion mode (Table 1) and 27 in negative ion mode (Table 2) were identified in the mice livers between CIH group and NC group. Volcano plots were drawn according to the p-value (< 0.05) and fold change (> 1.5 or < 0.67) to visualize dysregulated metabolites between the two groups (positive ion mode, Figure 3A; negative ion mode, Figure 3B). As shown in the histogram in Figure 3C, the top 5 upregulated metabolites in positive ion mode were arachidonic acid (peroxide free), ergothioneine, 1-methylhistamine, eicosapentaenoic acid, and methoprene(S); the top five downregulated metabolites in positive ion mode were pro-phe, daidzein, glutathione, 4-guanidinobutyric acid, and cysteinylglycine. As shown in the histogram in Figure 3D, the top 5 upregulated metabolites in negative ion mode were N1-(5-phospho-D-ribosyl)-AMP, stearidonic acid, adenine, myristic acid, and 6-phospho-D-gluconate; the top 5 downregulated metabolites in negative ion mode were glutathione disulfide, indoxyl sulfate, PGF2α, D-ribose 5-phosphate, and 2-hydroxy-3-methylbutyric acid (Figure 3E). The metabolite heatmaps were also performed to analyze the metabolic pattern in different groups. The results were showed in the Figure 4.
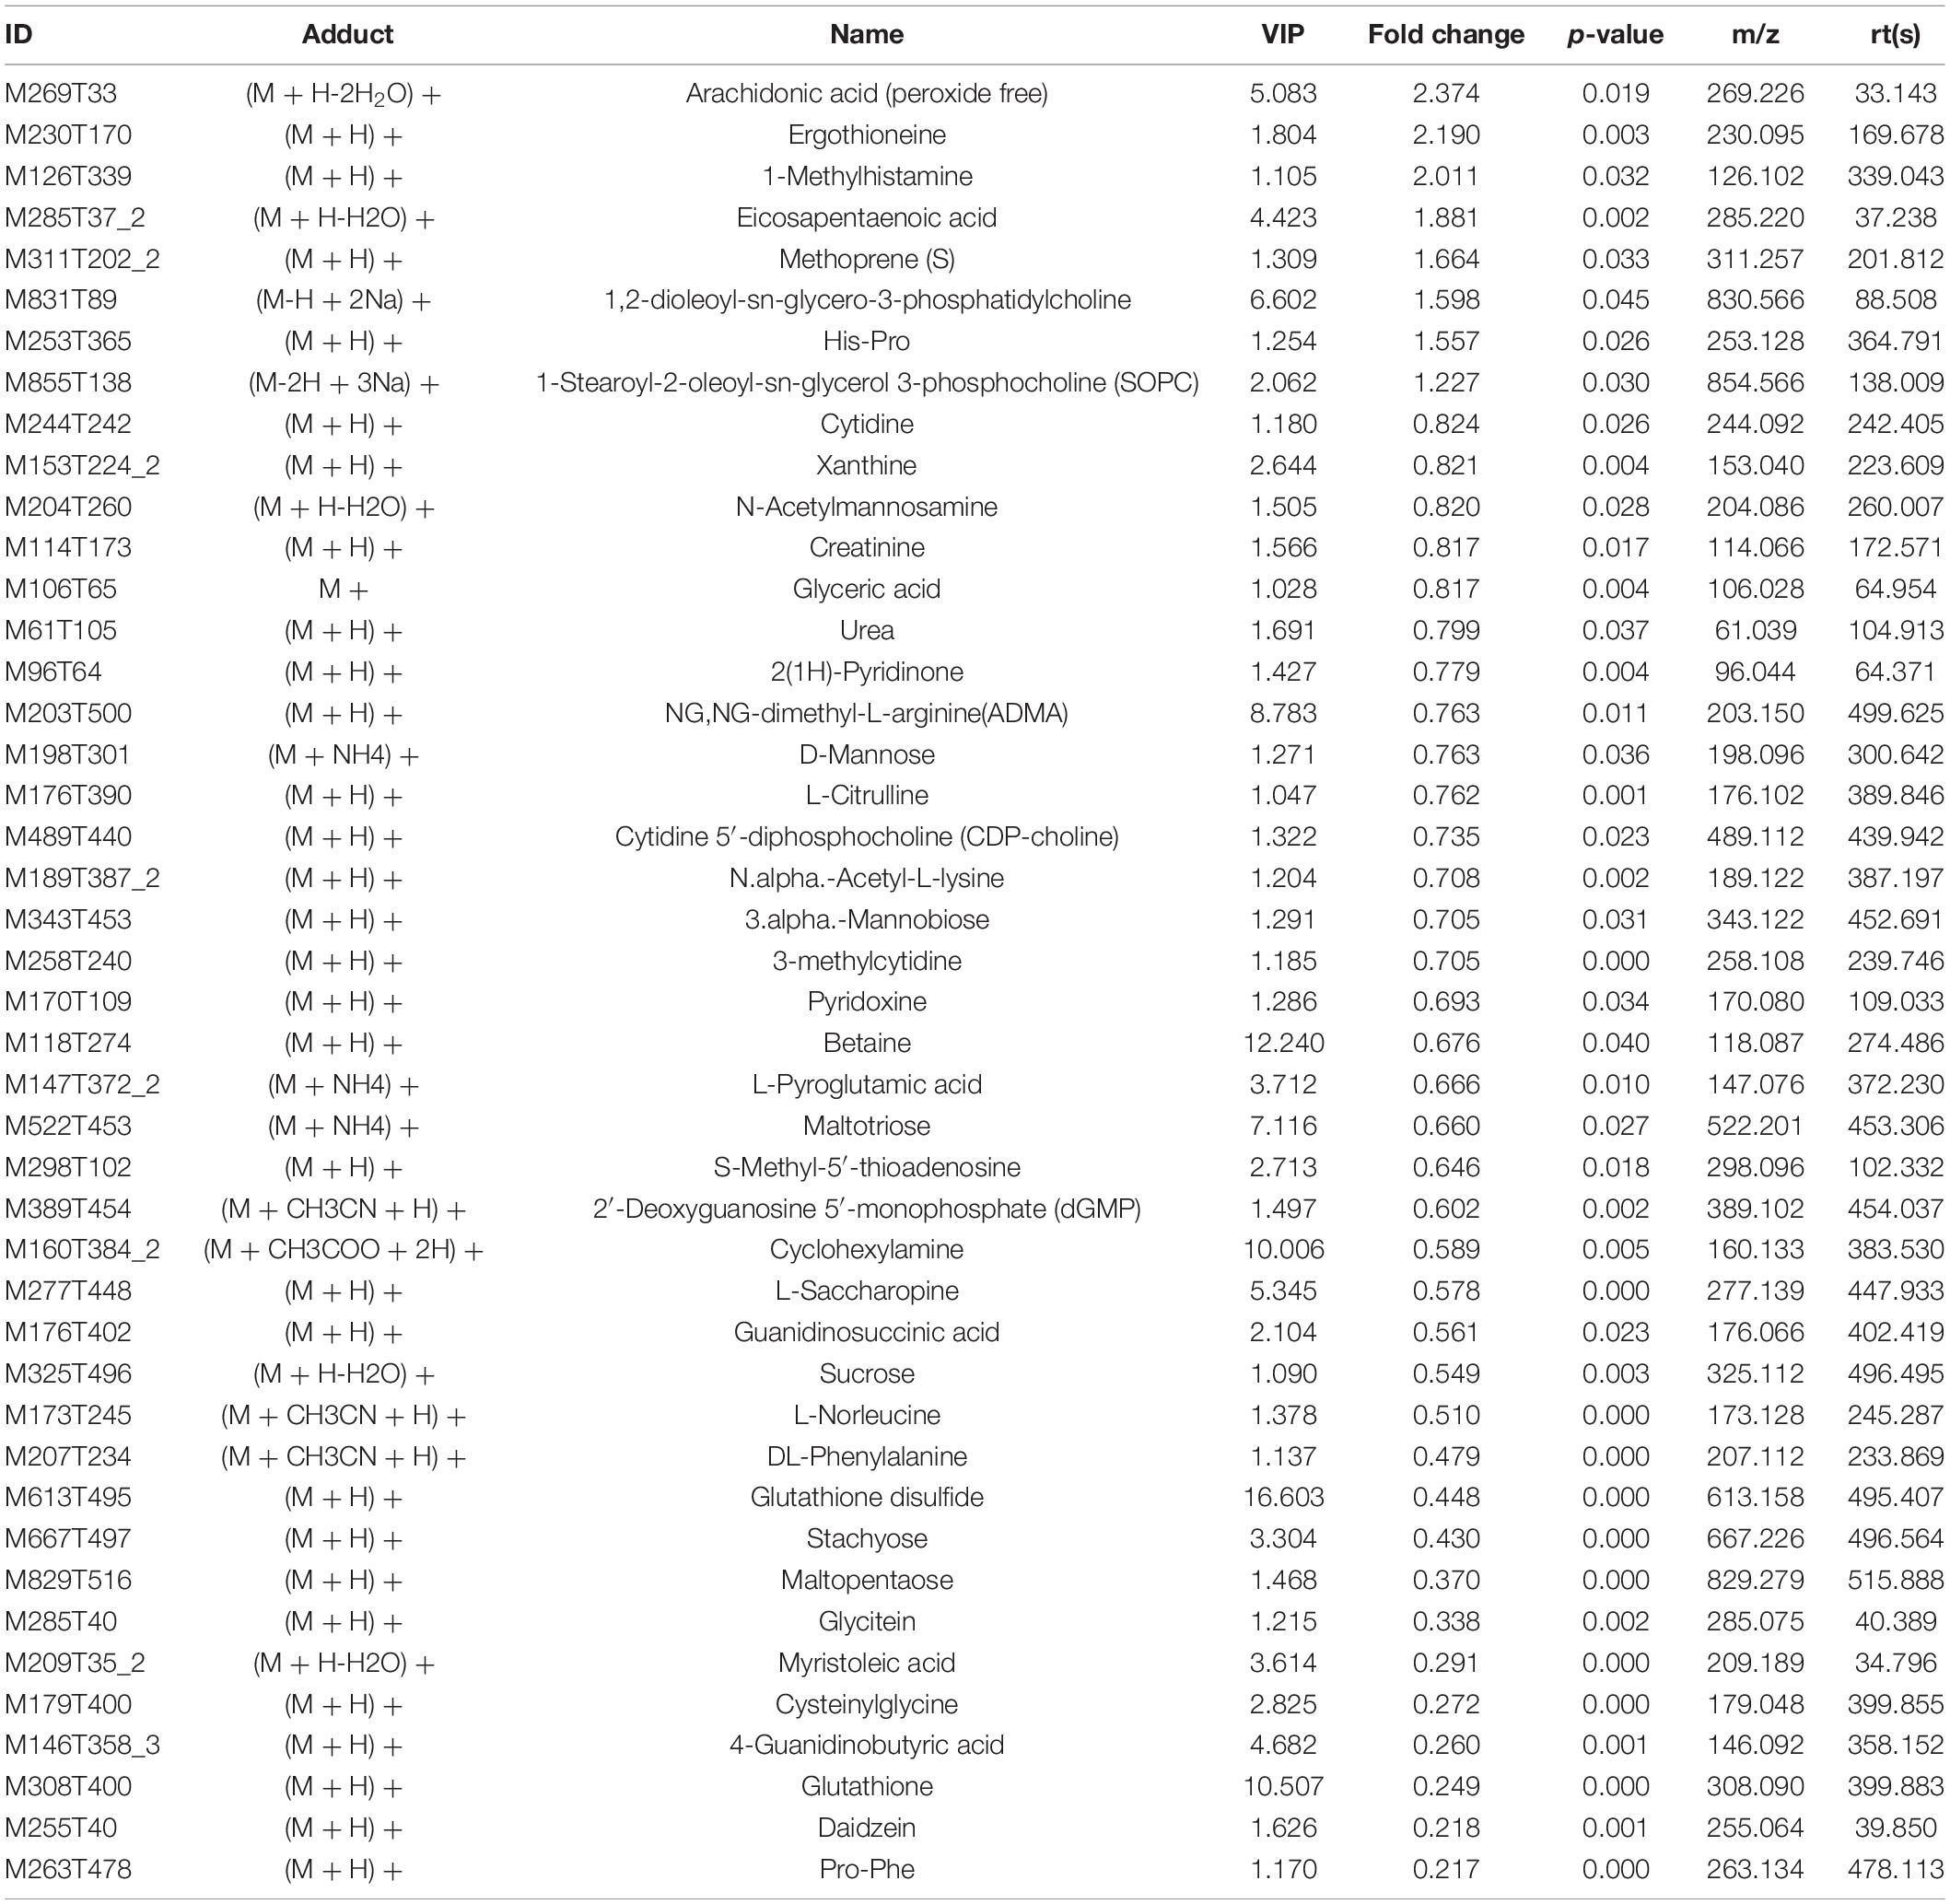
Table 1. The differential metabolites in positive ion mode.
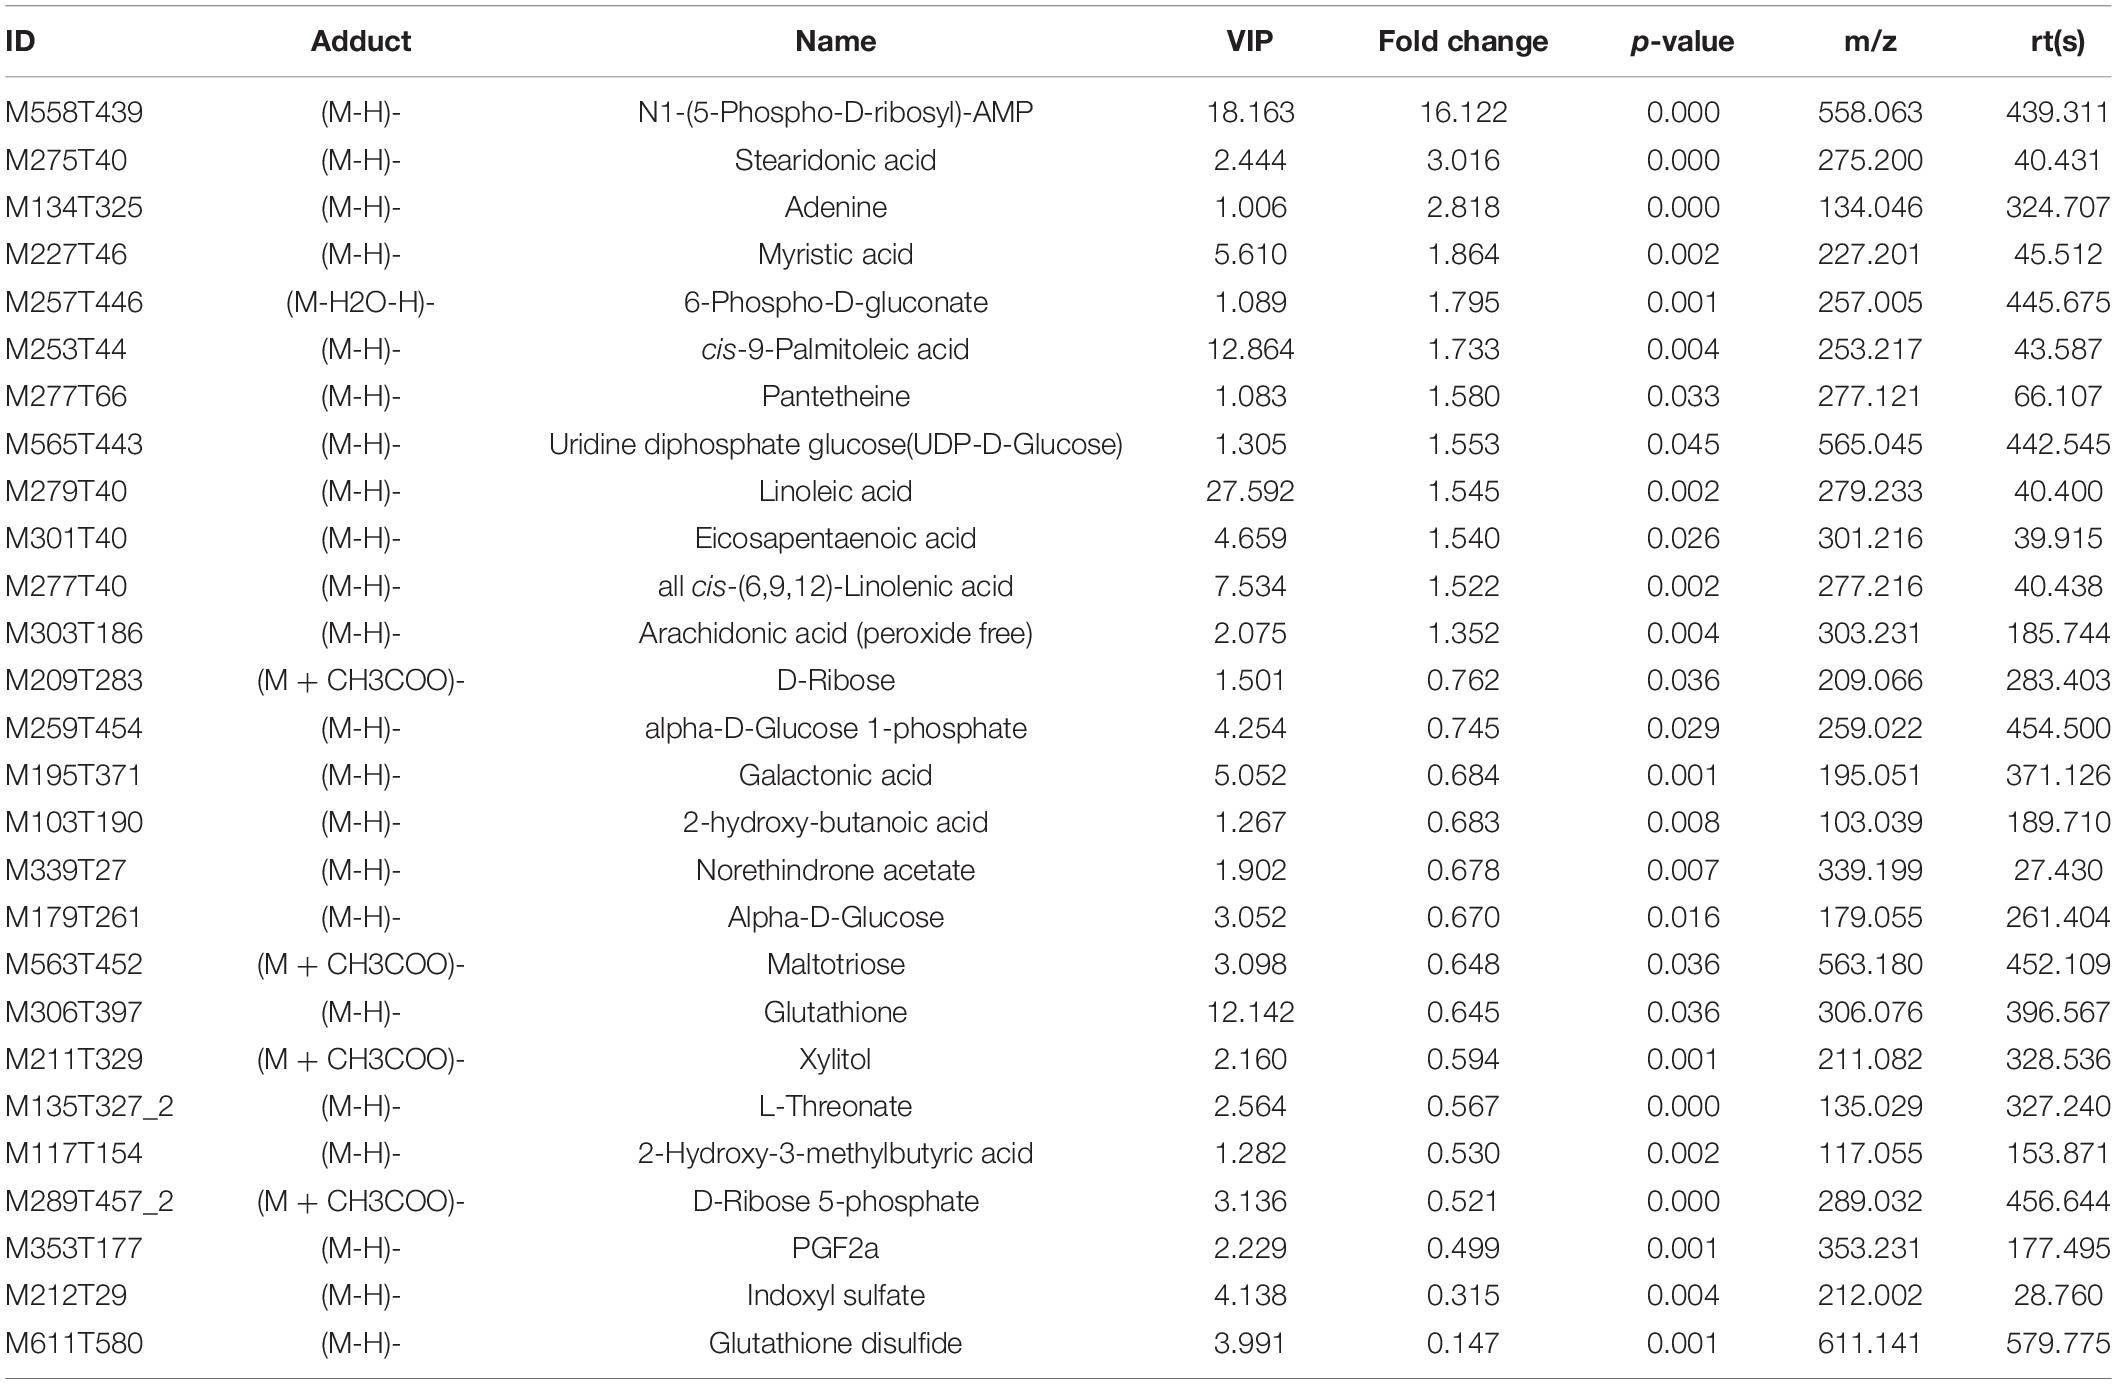
Table 2. The differential metabolites in negative ion mode.
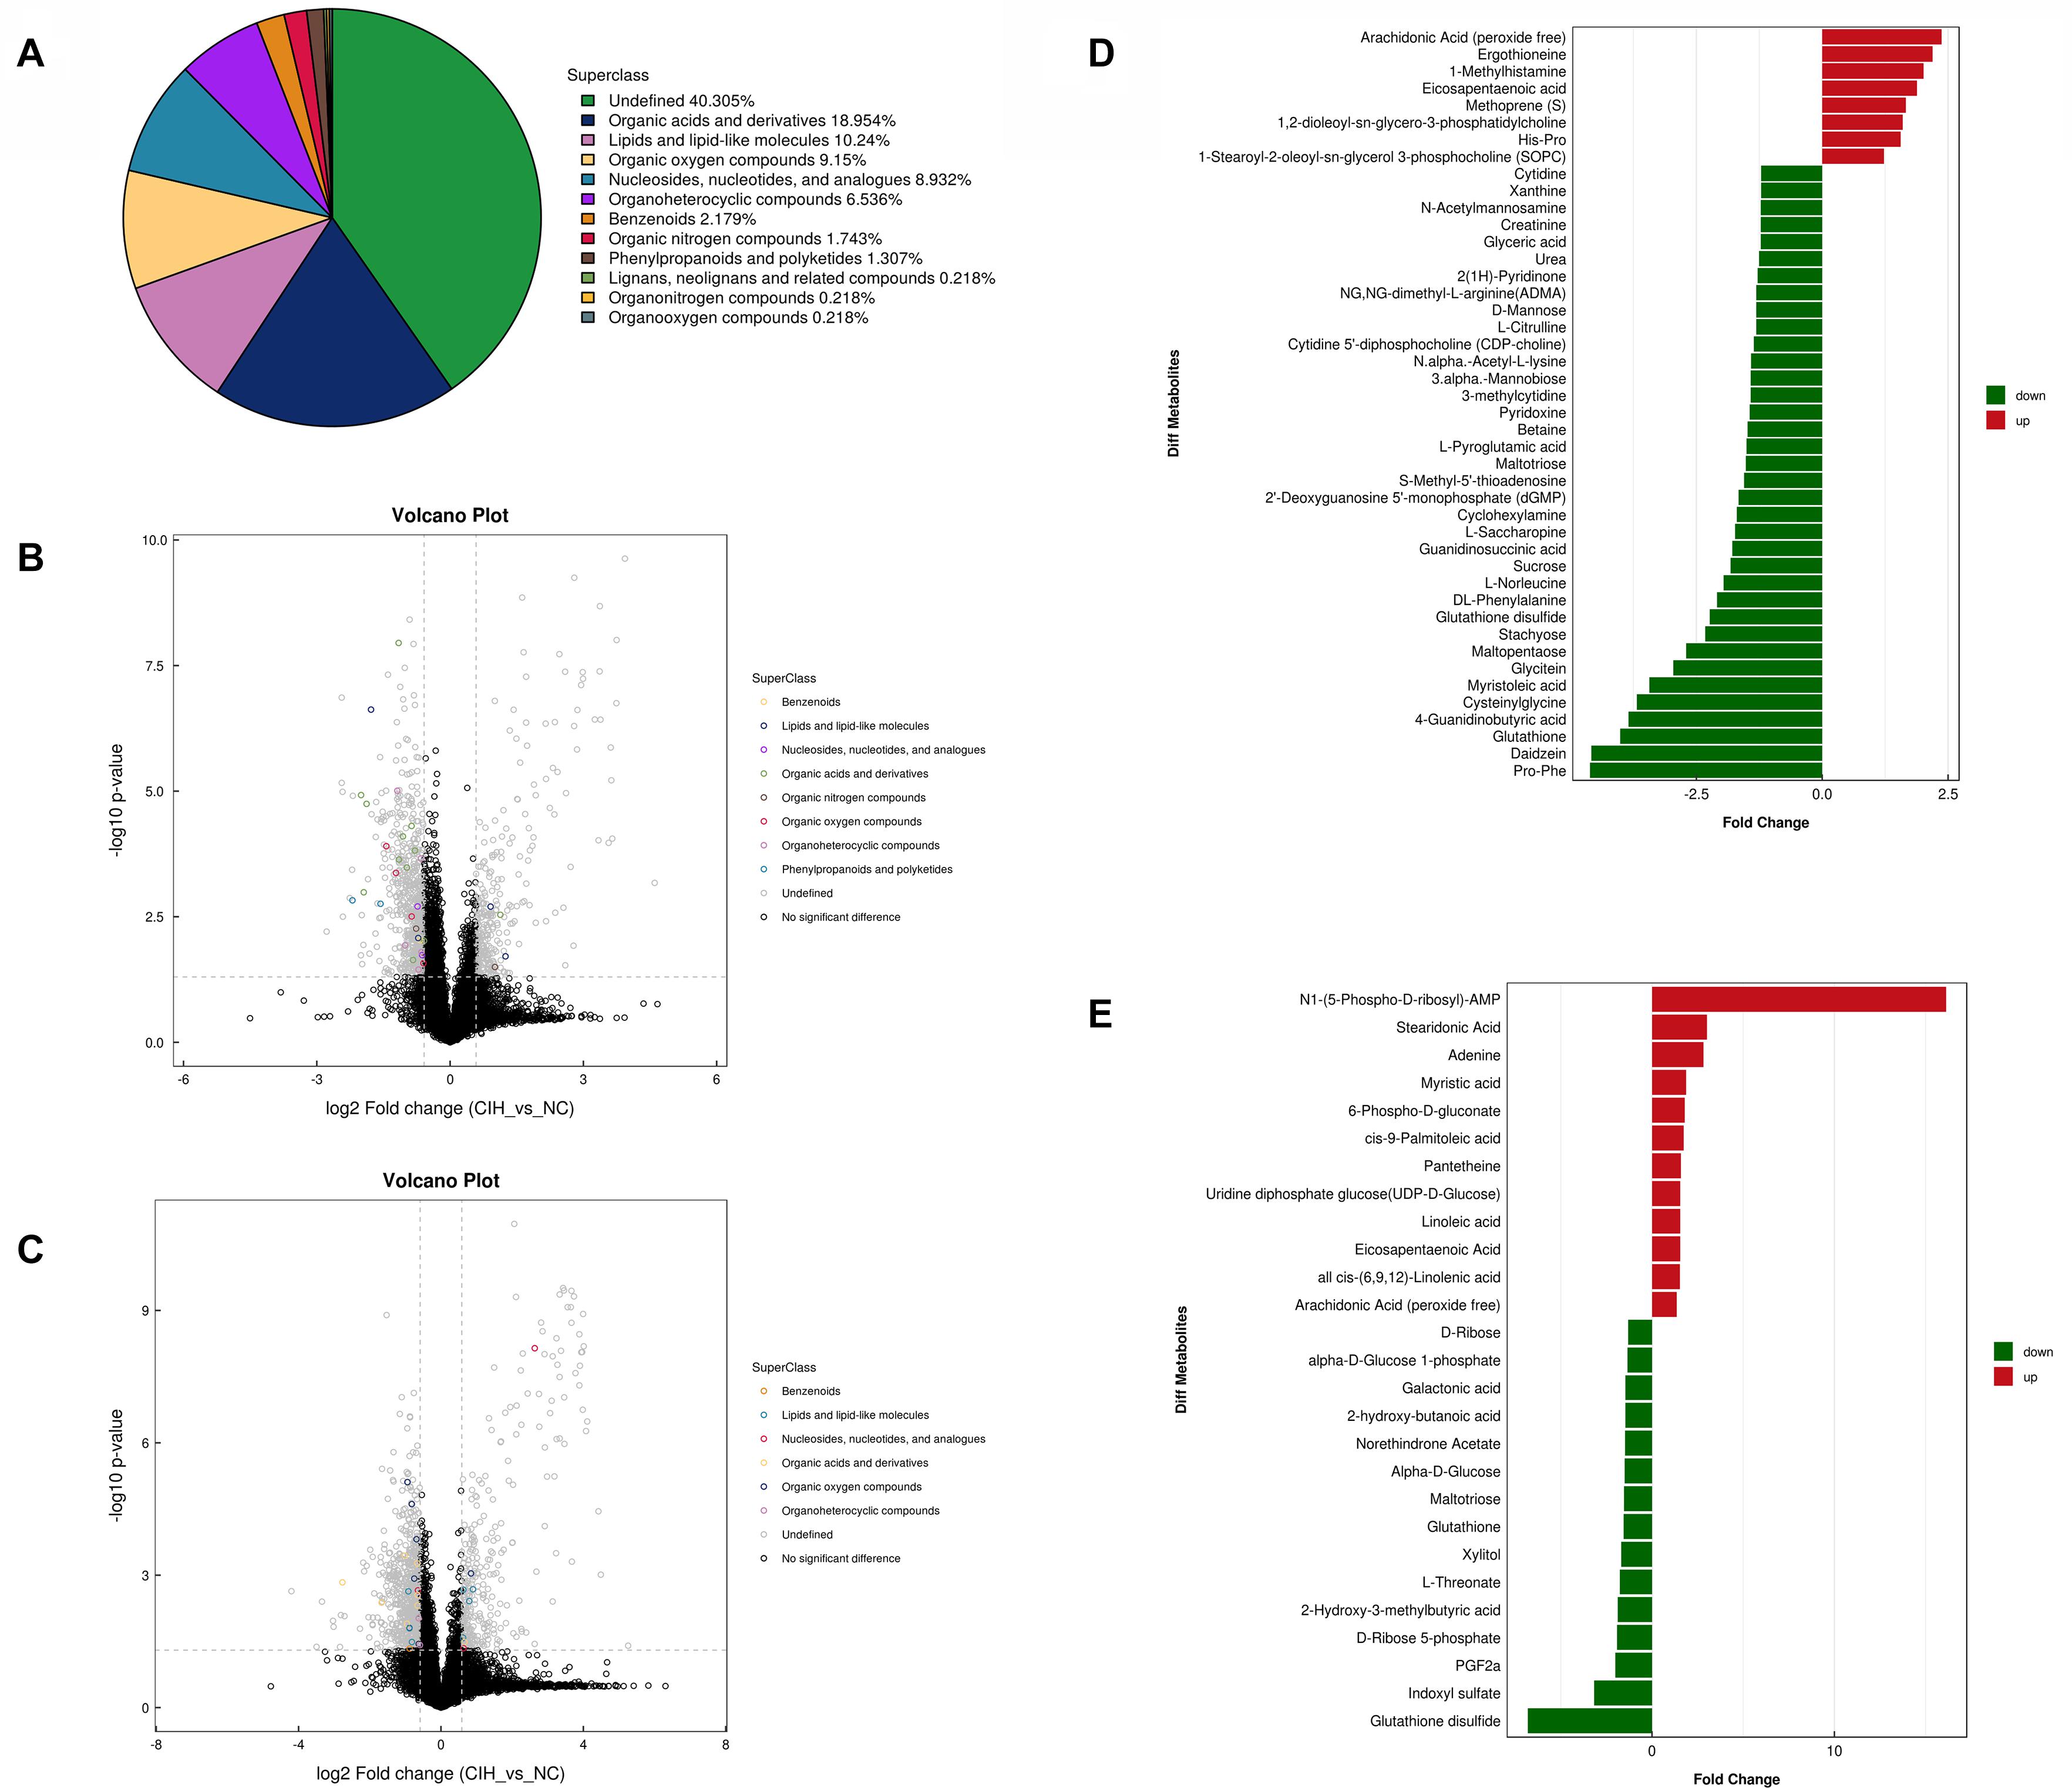
Figure 3. Univariate analysis of UHPLC-Q-TOF/MS data (A) Superclass pie chart of differential metabolites between NC and CIH group. (B) Volcano plot in positive ion mode and (C) negative ion mode. Each point in the volcano plot represents a metabolite. Differentially abundant metabolites of different categories are individually color coded. (D) Histogram of significantly differentially detected metabolites in positive ion mode and (E) negative ion mode. The x-axis shows the fold change; the y-axis corresponds to the differential metabolites. Green and red indicate decreased and increased differential metabolites, respectively.
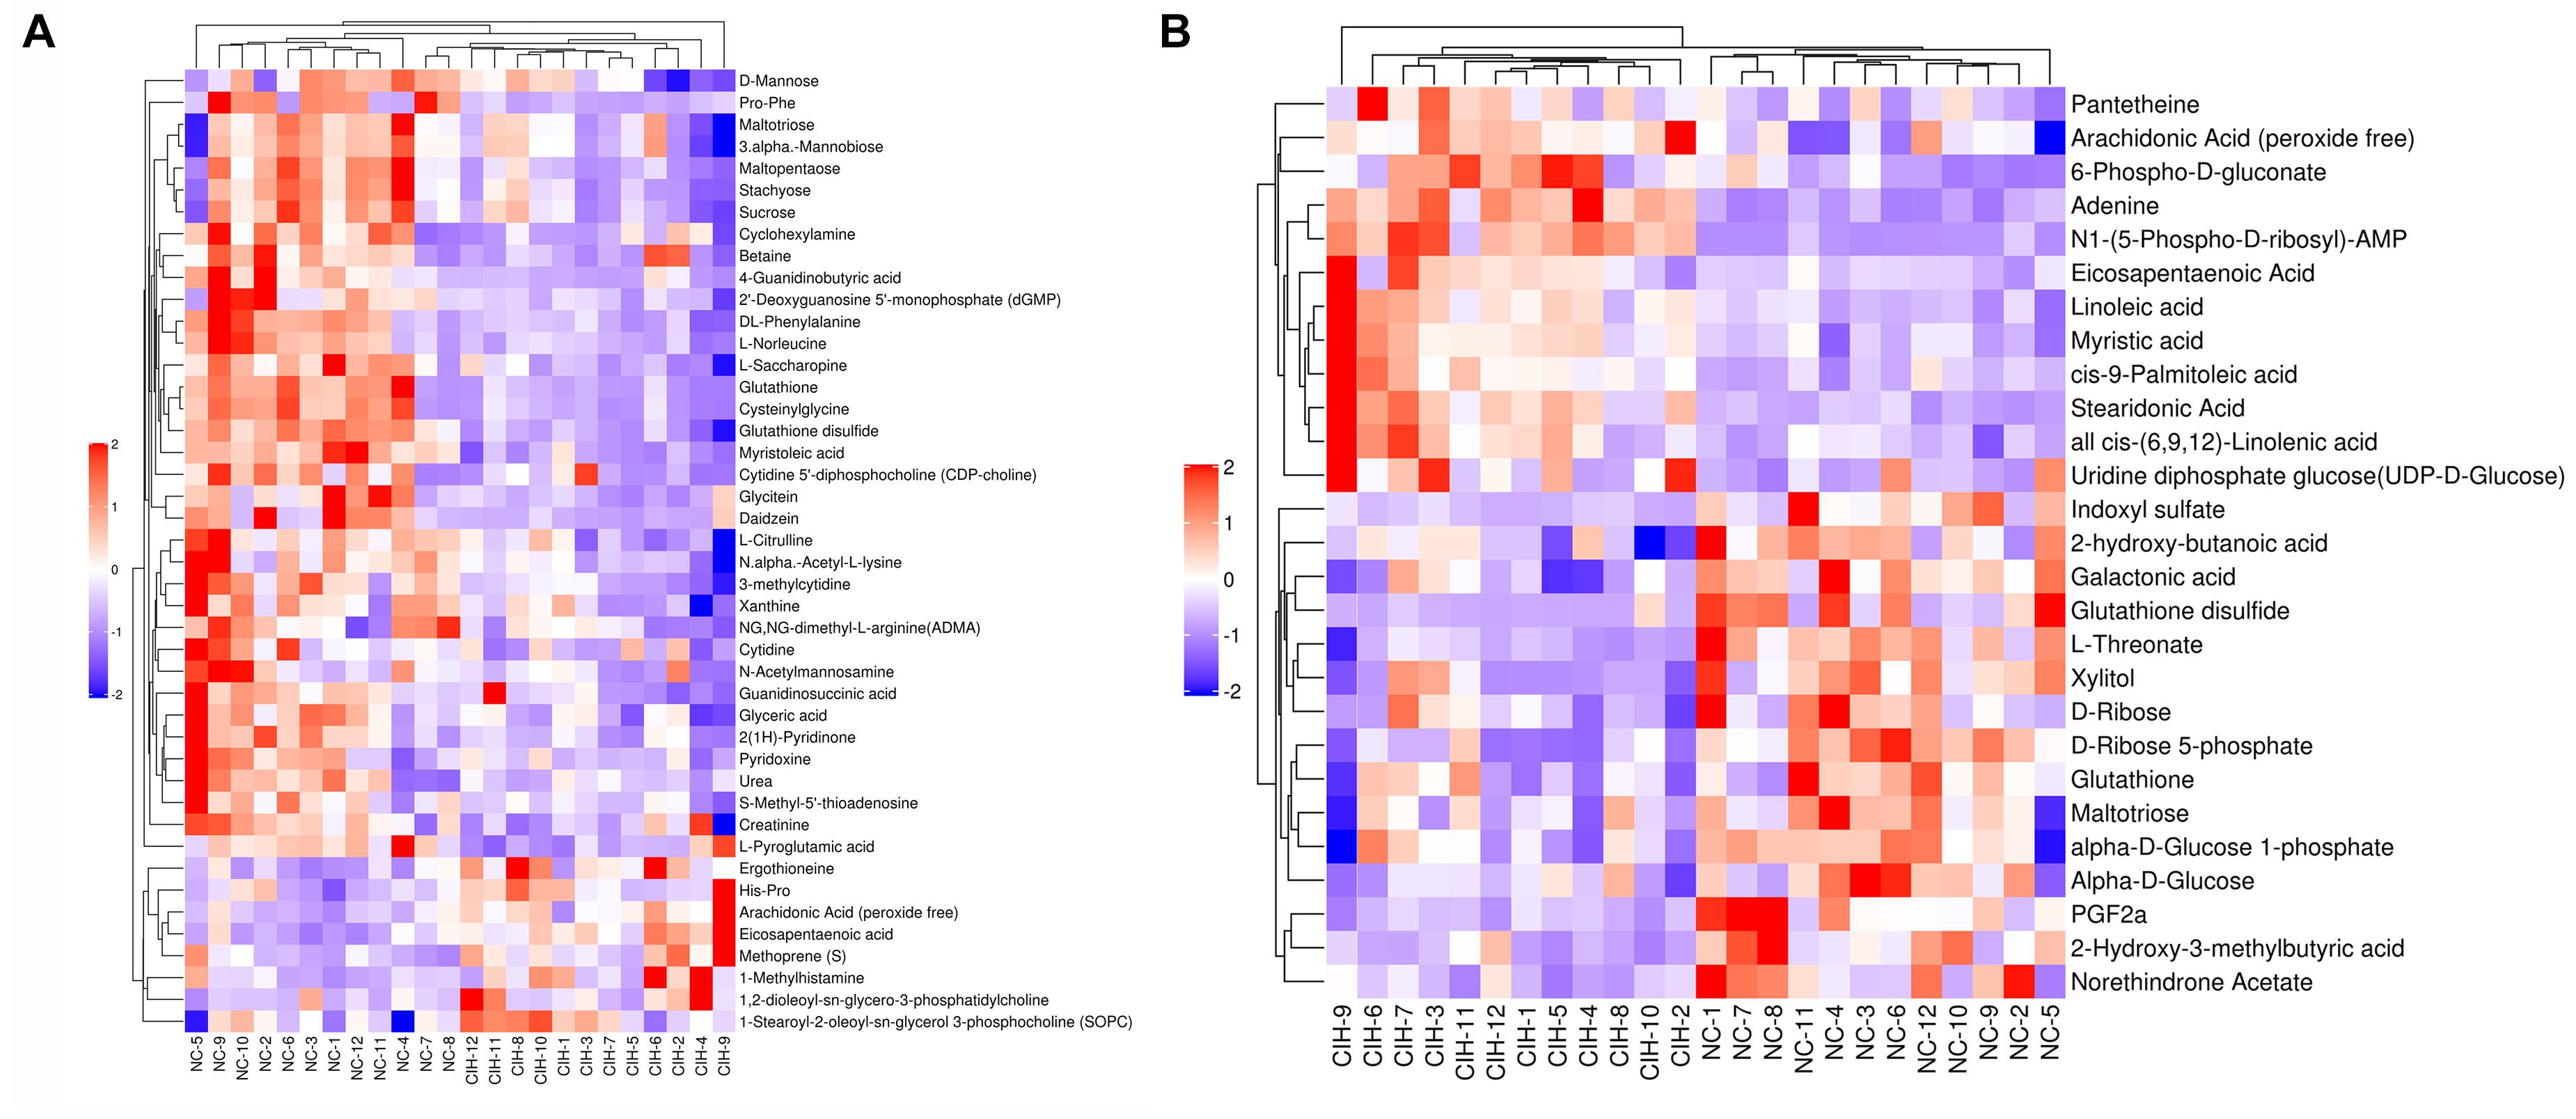
Figure 4. The metabolite heatmaps between NC and control group (A) negative ion mode; (B) positive ion mode.
To further determine which metabolism pathways were affected, we performed pathway analysis based on KEGG using Fisher’s exact test. These identified metabolic pathways were involved in cell growth and death, lipid metabolism, amino acid metabolism, carbohydrate metabolism, membrane transport, nucleotide metabolism, etc. (Figures 5A, B). It was worth noting that the ferrroptosis pathway played a role in the mechanisms of CIH-induced liver injury. Three differential metabolites including glutathione, glutathione disulfide, arachidonic acid (peroxide free) were identified in the ferroptosis pathway. The KEGG map in Figure 6 presented metabolic, signaling, and molecular interaction networks of ferroptosis pathway.
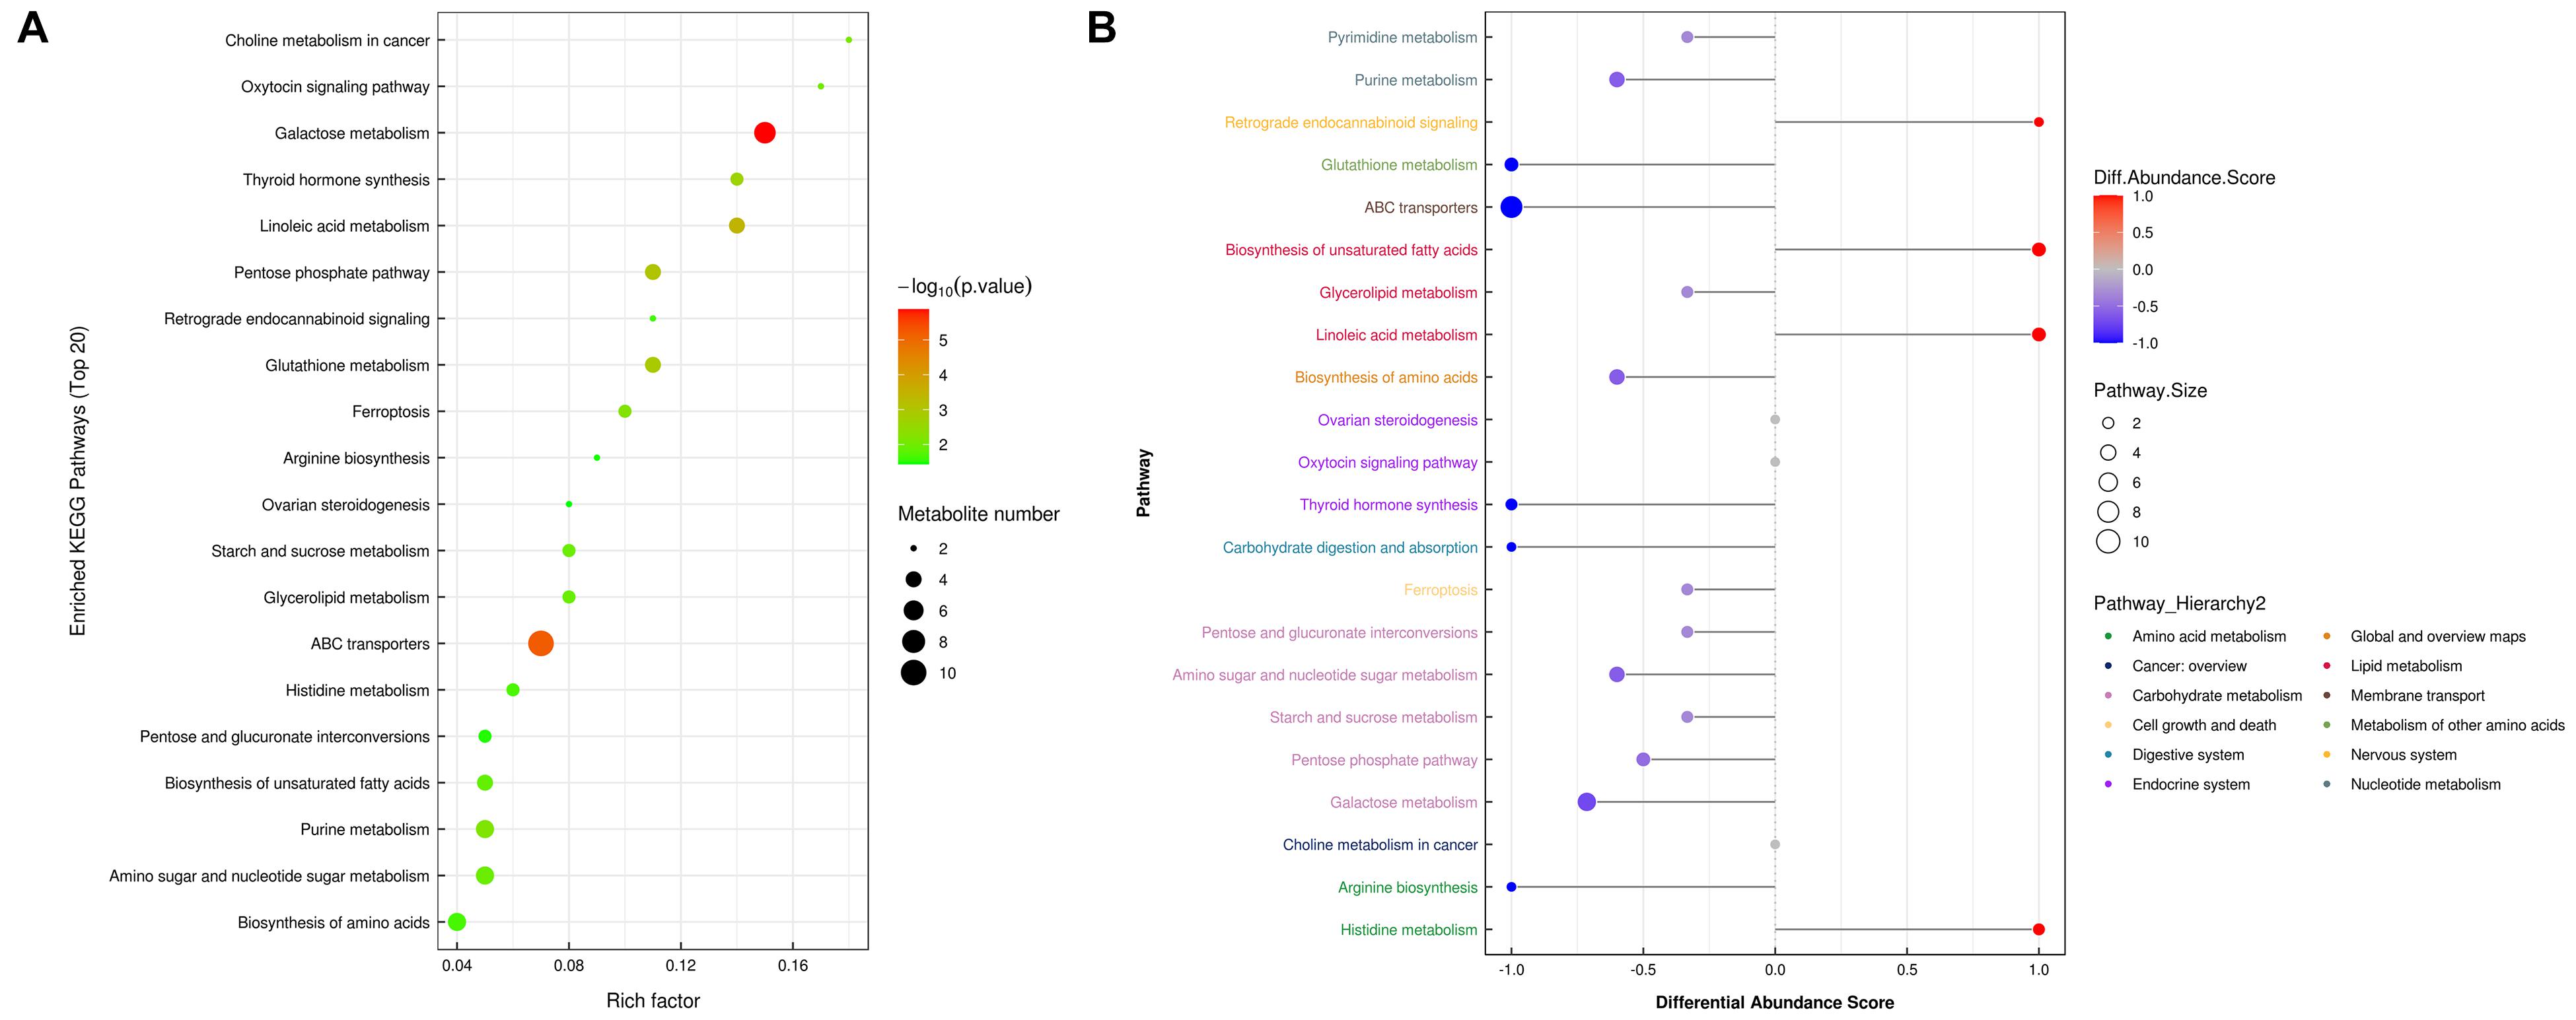
Figure 5. Metabolic pathway analysis. (A) Analyses of KEGG pathway enrichment. The x-axis shows the enrichment factor; the y-axis corresponds to the KEGG pathway. The size of the dot represents the number of metabolites mapped to the reference pathways. The color of the dot represents the p-value. (B) A pathway-based analysis of metabolic changes upon comparing NC with CIH group. The differential abundance score captures the average, gross changes for all metabolites in a pathway. A score of 1 indicates all measured metabolites in the pathway increase, and -1 indicates all measured metabolites in a pathway decrease. The differential color of pathway is mapped into corresponding category of pathway hierarchy.
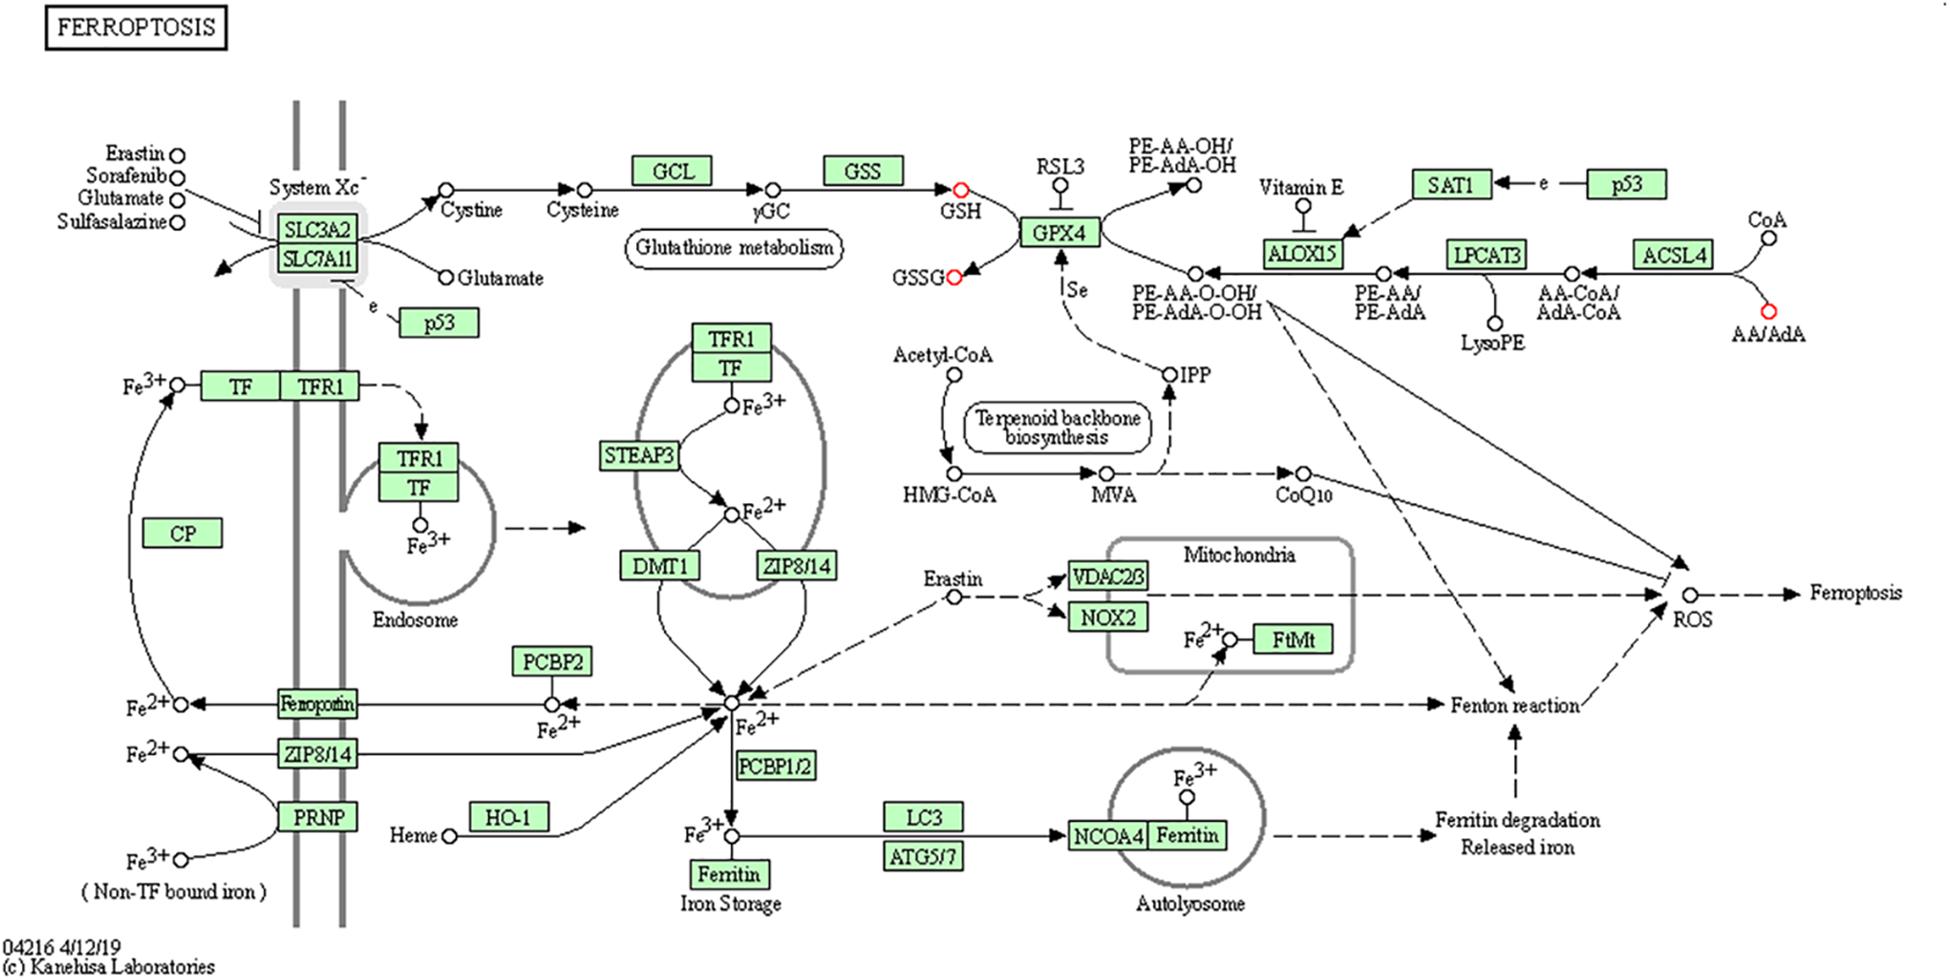
Figure 6. The KEGG map of ferroptosis pathway The KEGG map shows metabolic, signaling, and molecular interaction networks. The red dot represents the differential metabolite.
In this study, we established a CIH mouse model to explore the pathophysiological mechanisms underlying CIH-induced liver injury. A UHPLC-Q-TOF MS/MS-based metabolomics approach was utilized to explore the metabolic signatures of liver in a CIH mouse model. Some differential metabolites with 44 in positive ion mode and 27 in negative ion mode were identified between the two groups. These identified metabolic pathways were involved in various biological and metabolic processes, including various amino acid metabolism, membrane transport, lipid metabolism, carbohydrate metabolism, nucleotide metabolism, etc. The ferrroptosis pathway was also identified to play a role in the mechanisms of CIH-induced liver injury.
The effect of CIH on the liver has been assessed in several previous animal studies. As early as 2007, Savransky et al. (2007b) demonstrated that CIH resulted in liver injury and increased levels of oxidative stress and inflammatory markers in the liver in a CIH animal model. Subsequently, in 2009, the same researchers found that CIH and chronic acetaminophen treatment greatly enhanced hepatic toxicity of chronic acetaminophen administration, resulting in liver injury, liver necrosis, and liver inflammation (Savransky et al., 2009). Another study revealed that CIH combined with high fat condition caused more severe injury to the hepatic histology, liver function, and ultrastructure than those of single high fat condition. With the increase of IH exposure time, the liver injury became more severe (Feng et al., 2011). The metabolic characteristics during CIH-induced liver injury were unknown. Unraveling them is helpful to better understand the pathophysiological mechanisms of OSA-related liver injury.
Metabolomics, as a high throughput analytical method, is effective in identifying alteration of metabolites after occurrence of human diseases. It can provide insight into the metabolic processes and pathogenesis of human diseases from a systematic perspective. A few studies used this approach to study the association between OSA and the change of metabolites (Ferrarini et al., 2013; Xu et al., 2016; Alterki et al., 2020; Humer et al., 2020; Reutrakul et al., 2021). Ferrarini et al. (2013) collected plasma samples of 33 OSA patients and analyzed them with LC-QTOF-MS. They reported that the OSA severity was related to the different patterns of molecules. Another study including obese pregnant women diagnosed with gestational diabetes mellitus reported that the metabolomics profiles in OSA group were similar to non-OSA group. Nevertheless, 12 features, annotated to lysophospholipids, estradiols, and fatty acids, were significantly associated with OSA severity (Ferrarini et al., 2013). As far as we know, there is no study utilized this methodology to explore the pathophysiology of OSA in a CIH animal model.
In this study, the differential metabolites were involved in various amino acid metabolism, membrane transport, lipid metabolism, carbohydrate metabolism, nucleotide metabolism. The results were supported by a previous study (Li et al., 1985). Li et al. (1985) reported that the liver triglyceride and phospholipid content of obese mice in CIH group were statistically higher than those in NC group. Further gene expression analysis demonstrated that CIH could upregulate the pathways of lipid biosynthesis in the liver. Our previous study used Illumina HiSeq 4000 platform to explore the dysregulated genes between CIH and NC rats. The results also suggested that CIH resulted in the change of gene expression profiles, and the dysregulated genes were enriched in the metabolic pathways, carbon metabolism, fatty acid metabolism, etc. (Chen et al., 2020a).
We found that ferroptosis pathway was identified to have role in the mechanisms of CIH-related liver injury in this study. Ferroptosis is a new type of lipid- and iron-dependent regulated cell death caused by glutathione depletion and production of lipid peroxides by lipoxygenase enzymes (Dixon et al., 2012). The role of ferroptosis in CIH-induced liver injury was further supported by our previous study. It showed that CIH treatment resulted in significant ferroptosis in rat liver, evidenced by increase of lipid peroxidation, reduced expression of GPX4, increased expression of ACSL4 (Chen et al., 2020b). Furthermore, accumulating evidence demonstrated that ferroptosis implicated in the pathogenesis of multiple organ injury induced by ischemia/reperfusion injury (Fang et al., 2019; Li et al., 2019), which closely mimics physiology of intermittent hypoxia. Glutathione depletion is one of the important characteristics of the ferroptosis (Stockwell et al., 2017). In this study, three differential metabolites including glutathione, glutathione disulfide, arachidonic acid (peroxide free) were identified in the ferroptosis pathway. Savransky et al. (2009) also demonstrated that CIH combined with acetaminophen treatment group exhibited lower hepatic glutathione than acetaminophen treatment group. Future studies are needed to evaluate whether targeting ferroptosis can alleviate CIH-induced liver injury.
Our study has some strengths warrant further comment. As far as we know, this is the first study utilized metabolomics approach to study the pathophysiology of CIH-induce liver injury. In addition, the quality control analysis indicated that all data were credible. So the differential metabolites can reflect the differences between the two groups objectively.
There are some limitations should be acknowledged. Firstly, the CIH model mimics only one of the major characteristics of OSA. However, other factors associated with OSA such as sleep fragmentation, sympathetic hyperactivity, and hypercapnia might participate in OSA-related liver injury. Secondly, some other metabolites were detected in this study, but remained unidentified at present. Thirdly, metabolic changes were investigated only in liver. The serum sample was not investigated simultaneously. Fourthly, some researchers regard the metabolites as the real end points of gene expression. However, the liver is a highly heterogeneous organ, and the signal pathway involved in the differential metabolites may not represent all metabolic flux variations. Fifthly, there was a significant difference in body weight between NC and CIH group after treatment, which might have impact on liver metabolites. Finally, the dysregulated metabolites identified in this study may contribute to CIH-induced liver injury, but the exact molecular mechanisms still needs further study to make them clear. Other markers of ferroptosis including ROS and the changes of mitochondria determined by transmission electron microscopy were not evaluated in this study.
In conclusion, CIH treatment caused a remarkable liver injury in mice. CIH was associated with a significant metabolic profiling change in mice liver. The dysregulated metabolites were involved in various amino acid metabolism, membrane transport, carbohydrate metabolism, lipid metabolism, nucleotide metabolism, ferroptosis. These findings provided an overall mechanistic view of the metabolic changes during CIH-induced liver injury, which could expand our understanding of the mechanisms of OSA-related liver injury and help identify potential therapeutic targets.
The original contributions presented in the study are included in the article/Supplementary Material, further inquiries can be directed to the corresponding author/s.
The animal study was reviewed and approved by the Xiamen University Animal Care and Use Committee.
L-DC and Z-WH performed most of the experiments with assistance and wrote the manuscript. Y-ZH, J-FH, and Z-PZ contributed to the data analyses. X-JL edited the manuscript. All authors have read and agreed to the published version of the manuscript.
This research was funded by the National Natural Science Foundation of China, grant no. 81900088 and Startup Fund for Scientific Research, Fujian Medical University, China, grant nos. 2018QH1057 and 2020QH1264.
The authors declare that the research was conducted in the absence of any commercial or financial relationships that could be construed as a potential conflict of interest.
The Supplementary Material for this article can be found online at: https://www.frontiersin.org/articles/10.3389/fphys.2021.701035/full#supplementary-material
Supplementary Figure 1 | Quality control of UHPLC-Q-TOF/MS analysis. (A) Total ion chromatograms in positive ion mode and (B) negative ion mode for quality control samples. The retention time and response strength of each chromatographic peak almost overlap. (C) Pearson correlation analysis of quality control samples in positive ion mode and (D) negative ion mode. Correlation coefficients between quality control samples are all above 0.9. (E) RSD of quality samples in positive ion mode and (F) negative ion mode. More than 80% of peaks have an RSD < 0.3. (G) Hotelling’s T2 analyses of all samples in positive ion mode and (H) negative ion mode. All the samples are within the 99% confidence interval. (I) Multivariate control chart analysis of quality control samples in positive ion mode and (J) negative ion mode. The score values of all samples fall within ± 3SD.
ALT, alanine aminotransferase; AST, aspartate aminotransferase; ESI, electrospray ionization; CIH, chronic intermittent hypoxia; HE, hematoxylin–eosin; IH, intermittent hypoxia; KEGG, Kyoto Encyclopedia of Genes and Genomes; NAFLD, non-alcoholic fatty liver disease; NC, normal control; OSA, obstructive sleep apnea; OPLS-DA, orthogonal partial least-squares discriminant analysis; PCA, principal component analysis; SD, standard deviation; UHPLC/Q-TOF MS, ultra-high performance liquid chromatography/quadrupole time-of-flight mass spectrometry; VIP, variable importance for the projection.
Alterki, A., Joseph, S., Thanaraj, T. A., Al-Khairi, I., Cherian, P., Channanath, A., et al. (2020). Targeted metabolomics analysis on obstructive sleep apnea patients after multilevel sleep surgery. Metabolites 10:358. doi: 10.3390/metabo10090358
Chen, L. D., Chen, Q., Lin, X. J., Chen, Q. S., Huang, Y. Z., Wu, R. H., et al. (2020a). Effect of chronic intermittent hypoxia on gene expression profiles of rat liver: a better understanding of OSA-related liver disease. Sleep Breath. 24, 761–770. doi: 10.1007/s11325-019-01987-0
Chen, L. D., Wu, R. H., Huang, Y. Z., Chen, M. X., Zeng, A. M., Zhuo, G. F., et al. (2020b). The role of ferroptosis in chronic intermittent hypoxia-induced liver injury in rats. Sleep Breath. 24, 1767–1773. doi: 10.1007/s11325-020-02091-4
Chen, L. D., Zhang, L. J., Lin, X. J., Qi, J. C., Li, H., Wu, Z., et al. (2018). Association between continuous positive airway pressure and serum aminotransferases in patients with obstructive sleep apnea. Eur. Arch. Otorhinolaryngol. 275, 587–594. doi: 10.1007/s00405-017-4840-0
Dempsey, J. A., Veasey, S. C., Morgan, B. J., and O’Donnell, C. P. (2010). Pathophysiology of sleep apnea. Physiol. Rev. 90, 47–112.
Dixon, S. J., Lemberg, K. M., Lamprecht, M. R., Skouta, R., Zaitsev, E. M., Gleason, C. E., et al. (2012). Ferroptosis: an iron-dependent form of nonapoptotic cell death. Cell 149, 1060–1072. doi: 10.1016/j.cell.2012.03.042
Fang, X., Wang, H., Han, D., Xie, E., Yang, X., Wei, J., et al. (2019). Ferroptosis as a target for protection against cardiomyopathy. Proc. Natl. Acad. Sci. U. S. A. 116, 2672–2680. doi: 10.1073/pnas.1821022116
Feng, S. Z., Tian, J. L., Zhang, Q., Wang, H., Sun, N., Zhang, Y., et al. (2011). An experimental research on chronic intermittent hypoxia leading to liver injury. Sleep Breath. 15, 493–502. doi: 10.1007/s11325-010-0370-3
Ferrarini, A., Ruperez, F. J., Erazo, M., Martinez, M. P., Villar-Alvarez, F., Peces-Barba, G., et al. (2013). Fingerprinting-based metabolomic approach with LC-MS to sleep apnea and hypopnea syndrome: a pilot study. Electrophoresis 34, 2873–2881.
Humer, E., Pieh, C., and Brandmayr, G. (2020). Metabolomics in sleep, insomnia and sleep apnea. Int. J. Mol. Sci. 21:7244. doi: 10.3390/ijms21197244
Li, J., Grigoryev, D. N., Ye, S. Q., Thorne, L., Schwartz, A. R., Smith, P. L., et al. (1985). Chronic intermittent hypoxia upregulates genes of lipid biosynthesis in obese mice. J. Appl. Physiol. 99, 1643–1648. doi: 10.1152/japplphysiol.00522.2005
Li, Y., Feng, D., Wang, Z., Zhao, Y., Sun, R., Tian, D., et al. (2019). Ischemia-induced ACSL4 activation contributes to ferroptosis-mediated tissue injury in intestinal ischemia/reperfusion. Cell Death Differ. 26, 2284–2299. doi: 10.1038/s41418-019-0299-4
Lindberg, E., and Gislason, T. (2000). Epidemiology of sleep-related obstructive breathing. Sleep Med. Rev. 4, 411–433. doi: 10.1053/smrv.2000.0118
Mesarwi, O. A., Loomba, R., and Malhotra, A. (2019). Obstructive sleep apnea, hypoxia, and nonalcoholic fatty liver disease. Am. J. Respir. Crit. Care Med. 199, 830–841. doi: 10.1164/rccm.201806-1109tr
Mirrakhimov, A. E., and Polotsky, V. Y. (2012). Obstructive sleep apnea and non-alcoholic Fatty liver disease: is the liver another target? Front. Neurol. 3:149. doi: 10.3389/fneur.2012.00149
Musso, G., Cassader, M., Olivetti, C., Rosina, F., Carbone, G., and Gambino, R. (2013). Association of obstructive sleep apnoea with the presence and severity of non-alcoholic fatty liver disease. A systematic review and meta-analysis. Obes. Rev. 14, 417–431. doi: 10.1111/obr.12020
Musso, G., Olivetti, C., Cassader, M., and Gambino, R. (2012). Obstructive sleep apnea-hypopnea syndrome and nonalcoholic fatty liver disease: emerging evidence and mechanisms. Semin. Liver Dis. 32, 49–64.
Nicholson, J. K., Lindon, J. C., and Holmes, E. (1999). ‘Metabonomics’: understanding the metabolic responses of living systems to pathophysiological stimuli via multivariate statistical analysis of biological NMR spectroscopic data. Xenobiotica 29, 1181–1189. doi: 10.1080/004982599238047
Paschetta, E., Belci, P., Alisi, A., Liccardo, D., Cutrera, R., Musso, G., et al. (2015). OSAS-related inflammatory mechanisms of liver injury in nonalcoholic fatty liver disease. Mediators Inflamm. 2015:815721.
Reutrakul, S., Chen, H., Chirakalwasan, N., Charoensri, S., Wanitcharoenkul, E., Amnakkittikul, S., et al. (2021). Metabolomic profile associated with obstructive sleep apnoea severity in obese pregnant women with gestational diabetes mellitus: a pilot study. J. Sleep Res. 1:e13327.
Riekeberg, E., and Powers, R. (2017). New frontiers in metabolomics: from measurement to insight. F1000Res. 6:1148. doi: 10.12688/f1000research.11495.1
Savransky, V., Bevans, S., Nanayakkara, A., Li, J., Smith, P. L., Torbenson, M. S., et al. (2007a). Chronic intermittent hypoxia causes hepatitis in a mouse model of diet-induced fatty liver. Am. J. Physiol. Gastrointest. Liver Physiol. 293, G871–G877.
Savransky, V., Nanayakkara, A., Vivero, A., Li, J., Bevans, S., Smith, P. L., et al. (2007b). Chronic intermittent hypoxia predisposes to liver injury. Hepatology 45, 1007–1013. doi: 10.1002/hep.21593
Savransky, V., Reinke, C., Jun, J., Bevans-Fonti, S., Nanayakkara, A., Li, J., et al. (2009). Chronic intermittent hypoxia and acetaminophen induce synergistic liver injury in mice. Exp. Physiol. 94, 228–239. doi: 10.1113/expphysiol.2008.044883
Stockwell, B. R., Friedmann Angeli, J. P., Bayir, H., Bush, A. I., Conrad, M., Dixon, S. J., et al. (2017). Ferroptosis: a regulated cell death nexus linking metabolism, redox biology, and disease. Cell 171, 273–285. doi: 10.1016/j.cell.2017.09.021
Suhre, K., and Gieger, C. (2012). Genetic variation in metabolic phenotypes: study designs and applications. Nat. Rev. Genet. 13, 759–769. doi: 10.1038/nrg3314
Sundaram, S. S., Sokol, R. J., Capocelli, K. E., Pan, Z., Sullivan, J. S., Robbins, K., et al. (2014). Obstructive sleep apnea and hypoxemia are associated with advanced liver histology in pediatric nonalcoholic fatty liver disease. J. Pediatr. 164, 699–706.e1.
Xu, H., Zheng, X., Qian, Y., Guan, J., Yi, H., Zou, J., et al. (2016). Metabolomics profiling for obstructive sleep apnea and simple snorers. Sci. Rep. 6:30958.
Young, T., Finn, L., Peppard, P. E., Szklo-Coxe, M., Austin, D., Nieto, F. J., et al. (2008). Sleep disordered breathing and mortality: eighteen-year follow-up of the Wisconsin sleep cohort. Sleep 31, 1071–1078.
Young, T., Palta, M., Dempsey, J., Skatrud, J., Weber, S., and Badr, S. (1993). The occurrence of sleep-disordered breathing among middle-aged adults. N. Engl. J. Med. 328, 1230–1235. doi: 10.1056/nejm199304293281704
Keywords: liver injury, chronic intermittent hypoxia, obstructive sleep apnea, metabolomics, UHPLC/Q-TOF MS
Citation: Chen L-D, Huang Z-W, Huang Y-Z, Huang J-F, Zhang Z-P and Lin X-J (2021) Untargeted Metabolomic Profiling of Liver in a Chronic Intermittent Hypoxia Mouse Model. Front. Physiol. 12:701035. doi: 10.3389/fphys.2021.701035
Received: 27 April 2021; Accepted: 14 June 2021;
Published: 08 July 2021.
Edited by:
Fernanda Marques da Cunha, Universidade Federal de São Paulo, BrazilReviewed by:
Pamela Aiako Kakimoto, University of São Paulo, BrazilCopyright © 2021 Chen, Huang, Huang, Huang, Zhang and Lin. This is an open-access article distributed under the terms of the Creative Commons Attribution License (CC BY). The use, distribution or reproduction in other forums is permitted, provided the original author(s) and the copyright owner(s) are credited and that the original publication in this journal is cited, in accordance with accepted academic practice. No use, distribution or reproduction is permitted which does not comply with these terms.
*Correspondence: Zhi-Wei Huang, NjU5NTczNzQ3QHFxLmNvbQ==
†These authors have contributed equally to this work
Disclaimer: All claims expressed in this article are solely those of the authors and do not necessarily represent those of their affiliated organizations, or those of the publisher, the editors and the reviewers. Any product that may be evaluated in this article or claim that may be made by its manufacturer is not guaranteed or endorsed by the publisher.
Research integrity at Frontiers
Learn more about the work of our research integrity team to safeguard the quality of each article we publish.