 Yuya Ohhara
 Genki Hoshino1
95% of researchers rate our articles as excellent or good
Learn more about the work of our research integrity team to safeguard the quality of each article we publish.
Find out more
ORIGINAL RESEARCH article
Front. Physiol. , 22 June 2021
Sec. Invertebrate Physiology
Volume 12 - 2021 | https://doi.org/10.3389/fphys.2021.690564
This article is part of the Research Topic Hormone Regulation of Insect Development View all 7 articles
Animals can sense internal nutrients, such as amino acids/proteins, and are able to modify their developmental programs in accordance with their nutrient status. In the fruit fly, Drosophila melanogaster, amino acid/protein is sensed by the fat body, an insect adipose tissue, through a nutrient sensor, target of rapamycin (TOR) complex 1 (TORC1). TORC1 promotes the secretion of various peptide hormones from the fat body in an amino acid/protein-dependent manner. Fat-body-derived peptide hormones stimulate the release of insulin-like peptides, which are essential growth-promoting anabolic hormones, from neuroendocrine cells called insulin-producing cells (IPCs). Although the importance of TORC1 and the fat body-IPC axis has been elucidated, the mechanism by which TORC1 regulates the expression of insulinotropic signal peptides remains unclear. Here, we show that an evolutionarily conserved molecular chaperone, heat shock protein 90 (Hsp90), promotes the expression of insulinotropic signal peptides. Fat-body-selective Hsp90 knockdown caused the transcriptional downregulation of insulinotropic signal peptides. IPC activity and systemic growth were also impaired in fat-body-selective Hsp90 knockdown animals. Furthermore, Hsp90 expression depended on protein/amino acid availability and TORC1 signaling. These results strongly suggest that Hsp90 serves as a nutrient-responsive gene that upregulates the fat body-IPC axis and systemic growth. We propose that Hsp90 is induced in a nutrient-dependent manner to support anabolic metabolism during the juvenile growth period.
Nutrient-dependent anabolic metabolism and growth are fundamental physiological processes in juvenile development. In vertebrates and invertebrates, this process is supported by nutrient-responsive anabolic hormones. Members of the insulin-like peptide (ILP) family, including insulin-like growth factors in vertebrates and ILPs in insects, play an essential role in nutrient-dependent anabolism and systemic growth (Garofalo, 2002; Hietakangas and Cohen, 2009; Tennessen and Thummel, 2011; Okamoto and Yamanaka, 2015). ILPs are secreted from specific endocrine organs to promote various cellular events, including protein synthesis, cell growth, and proliferation. In the fruit fly, Drosophila melanogaster, eight ILPs are encoded in the genome; among them, ILP2, ILP3, and ILP5 are mainly synthesized in the neuroendocrine cells called insulin-producing cells (IPCs) (Ikeya et al., 2002; Okamoto and Yamanaka, 2015). ILPs secreted from IPCs promote insulin signaling in the peripheral organs and induce subsequent anabolic metabolism and growth. ILP production in IPCs is dependent on nutrient status, and the most crucial nutrient cue for ILP production is protein/amino acids. If the amino acid/protein content is low in a culture medium, ILP secretion is blocked, leading to the downregulation of systemic insulin signaling and growth (Géminard et al., 2009; Okamoto and Yamanaka, 2015).
Amino acid/protein availability is mainly sensed by insect adipose tissue, termed “fat body.” The fat body synthesizes triacylglycerol (TAG) which is supplied to other tissues during development and senses amino acids through an evolutionarily conserved nutrient sensor, the target of rapamycin (TOR) (Colombani et al., 2003; Layalle et al., 2008). TOR forms a complex called TOR complex 1 (TORC1), which consists of TOR, a regulatory protein associated with mTOR (Raptor), and lethal with Sec13 protein 8 (Lst8). TORC1 activity is upregulated by amino acids, including leucine and arginine (Saxton and Sabatini, 2017). In the Drosophila fat body, the arginine transporter SlimFast is required for TORC1 activation (Colombani et al., 2003; Layalle et al., 2008). TORC1 activation leads to fat body-derived secretion of peptides, including stunted and growth-blocking peptides (GBP)1 and GBP2, into the hemolymph (Delanoue et al., 2016; Koyama and Mirth, 2016; Meschi et al., 2019). The fat body also secretes a small peptide called CCHamide-2 (CCHa2) in response to glucose and protein feeding (Sano et al., 2015). These insulinotropic signal peptides are received by their receptors expressed in IPCs or IPC-connecting neurons. Stunted and CCHa2 activate their specific receptors expressed in the IPCs to promote ILP release (Sano et al., 2015; Delanoue et al., 2016), whereas GBP1 and GBP2 act on the IPC-connecting neurons to alleviate the inhibition exerted by the IPC-connecting neurons on the IPCs (Meschi et al., 2019). In contrast, under amino acid/protein starvation, the fat body releases a signal peptide called Eiger to limit ILP expression in the IPCs (Agrawal et al., 2016). Although Eiger is the tumor necrosis factor (TNF) superfamily ligand, which was originally identified as a cell-death-inducing signal peptide, fat body-derived Eiger functions as an insulinostatic signal peptide. In brief, downregulation of TORC1 causes transcriptional upregulation of a metalloprotease, TNF-α-converting enzyme (TACE), and TACE cleaves the extracellular domain of Eiger (Agrawal et al., 2016), which then acts on IPCs to suppress ILP production (Agrawal et al., 2016). Furthermore, amino acids are sensed by glial cells, and the downstream cholinergic neurons promote ILP5 gene expression in the IPCs (Okamoto and Nishimura, 2015). Additionally, leucine acts on the IPCs directly through the amino acid transporters Juvenile hormone Inducible-21 and Minidiscs to stimulate ILP secretion (Manière et al., 2016; Ziegler et al., 2018).
Although the importance of TORC1 and downstream insulinotropic/insulinostatic signal peptides has been elucidated, the mechanism by which TORC1 regulates insulinotropic/insulinostatic signal peptide production in the fat body remains unclear. In addition, while the fat body is also known as the center of TAG synthesis and storage, how the fat body coordinately regulates TAG metabolism and insulinotropic/insulinostatic peptide production is unknown. Therefore, identifying these mechanisms is key to a better understanding of juvenile development. Here, we hypothesized that inhibition of these mechanisms in the fat body might cause developmental arrest at the larval stage. To explore the hypothesis, we performed fat-body-selective RNAi screening to select genes that are essential for larval development. Two rounds of RNAi screening narrowed down the list of hits and identified five essential genes. We further investigated the roles of these genes in TAG levels and growth. The genes did not positively regulate TAG levels in the larval stage. However, an evolutionarily conserved chaperone, heat shock protein 90 (Hsp90), was demonstrated to be essential for the progression of larval growth. Our data indicate that adipocyte Hsp90 is required for the upregulation of insulinotropic peptide expression, IPC activation, and systemic growth. Furthermore, Hsp90 expression was dependent on protein/amino acid feeding and TORC1 signaling. The collective data provide a molecular basis for understanding of how the fat body couples nutrient status to insulinotropic endocrine signaling.
The fly stocks used in this study are listed in Supplementary Table 1. Oregon R was used as the wild-type (WT) strain. The RNAi stocks used for RNAi screens are listed in Supplementary Tables 2, 3. Fly stocks were reared on a glucose/cornmeal/yeast medium (1 g glucose, 0.7 g cornmeal, 0.4 g yeast extract, 50 mg agar in 10 mL water) supplemented with 30 μL propionic acid and 35 μL butylparaben (167 mg/mL in 70% ethanol). Flies were maintained at 25°C under a 12-hour light/dark cycle.
A nutrient-rich semi-defined medium, German food, was used for all experiments, except for an RNAi screen. Briefly, 22.5 g German food powder (Genesee Scientific, San Diego, CA, United States, 66-115) was added to 100 mL water, and the mixture was boiled using a microwave. After stirring for 30 min at room temperature (18–25°C), 600 μL propionic acid was added to the mixture to obtain the German food medium.
To investigate the effect of nutrients on gene expression, we used a series of limited culture media, including control, starvation, and protein-deficient media. Supplementary Table 4 shows the nutrient composition of each of these media. The composition was determined by referring to a defined medium (called “Medium C” in the original paper) (Sang, 1956). Ingredients other than vitamin mix and propionic acid were added to water and boiled using a microwave oven. After stirring for 30 min at room temperature, propionic acid and vitamin mix were added to the mixture.
Fat body-selective RNAi screening was performed to identify novel regulators of larval development. In the first RNAi screen, we screened 231 genes that were previously identified as TAG metabolism-related genes (Pospisilik et al., 2010; Supplementary Table 2). The second RNAi screen was performed to confirm whether the developmental defects observed in the first screen were reproducible using 2–3 independent RNAi strains (Supplementary Table 3). In the first and the second RNAi screens, virgins carrying homozygous Cg-Gal4 were crossed with UAS-RNAi males to obtain the offspring in which a target gene was knocked down in the fat body (Cg-Gal4 > UAS-RNAi against gene-of-interest). To obtain control animals (Cg-Gal4 > +), Cg-Gal4 females and w1118 males were crossed. Parent flies were cultured in a plastic vial with a glucose/cornmeal/yeast medium for 2 days, and the developmental phenotypes of their progenies were observed to identify knockdown strains showing developmental arrest.
Parent flies were maintained in plastic bottles (Genesee Scientific, San Diego, CA, United States, 32-310) and allowed to lay eggs for 24 h on grape juice agar plates (2 g agar in 100 mL grape juice, poured into a 4.5 cm × 1.6 cm plastic dish) supplemented with dry yeast powder (Oriental Yeast Co., Ltd., Japan). Newly hatched larvae were transferred to vials containing German food medium. The larvae were cultured at 25°C unless stated otherwise under a 12-hour light/dark cycle for defined times. Nutritional manipulations were performed using a series of nutrient limited culture media (see section “Drosophila Stocks and Medium” and Supplementary Table 4). Larvae cultured on the German food medium were transferred to a non-nutritive starvation medium at 24 h after hatching (hAH). After a further 24 h, the larvae were transferred to a nutrient-enriched control or a protein-deficient medium and cultured for defined times.
To measure body weight, larvae were washed with distilled water, blotted on KimWipes (Crecia, Japan) to remove distilled water, and collected in 1.5 mL plastic tubes before weighing. Larvae were weighed in more than three batches of 10–15 larvae in each experimental group. The body weight of individual larva was then calculated for each batch.
The same egg collection and larval rearing methods were used to analyze the developmental progression. Developmental stages and lethality were scored every 24 h.
To investigate TAG content in knockdown animals, lipid extraction and TAG level measurements were conducted as follows. Ten to 15 frozen larvae collected in 1.5 mL plastic tubes were homogenized in liquid nitrogen using plastic pestles, and 1 mL chloroform-methanol mixture (2:1, v/v) was added to the smashed samples. After overnight incubation at room temperature, the samples were centrifuged for 15 min at 3,800 × g, and the supernatants were collected into fresh tubes. The extracts were dried in a centrifugal evaporator (EYELA, Japan) and re-dissolved in 500 μL phosphate-buffered saline (PBS) with 0.1% (v/v) Tween20. TAG was quantified using the Triglyceride E-test Wako (Fujifilm, Japan, 290-63701) in accordance with the manufacturer’s protocol. TAG levels were normalized to the sample weight. The mean TAG level in the control at 72 hAH was set to 100, and the relative TAG level of each sample was calculated.
Quantitative RT-PCR (qPCR) was performed to measure the expression levels of Hsp90 and growth-regulating genes including insulinotropic/insulinostatic signal peptide-coding genes. Total RNA was extracted from larvae and fat bodies (5–6 pooled fat bodies) using TRIzol (Thermo Fisher Scientific, 15596026) and the RNeasy Micro kit (QIAGEN, 74004), respectively. Reverse transcription was performed using the SuperScript III kit (Thermo Fisher Scientific, 18080051), and the obtained cDNA was used as a template for qPCR using the Quantifast SYBR Green PCR kit (QIAGEN, 204056) and Rotor-Gene Q (QIAGEN). All reactions were performed at 95°C for 10 min, followed by 50 cycles of 95°C for 10 s and 60°C for 30 s. Dissociation curve analysis was applied to all reactions to ensure the presence of a single PCR product. The expression levels of the target genes were calculated using the relative standard curve method. Stock cDNA used for the relative standard curves was synthesized from pooled RNA derived from larvae bred under the same conditions and diluted serially. The expression levels of the target genes were normalized to an endogenous reference gene, ribosomal protein 49 (rp49) (also known as ribosomal protein L32), because rp49 is stably expressed across various nutrient conditions (Ponton et al., 2011). The mean expression level of the control was set to 1. The primer sets used for qPCR are listed in Supplementary Table 5.
Immunostaining was performed to investigate the expression levels of ILP2 and phospho-S6. Larvae were dissected in PBS and fixed for 25 min with 4% paraformaldehyde in 0.1% PBT (0.1% Triton X-100 in PBS). Tissues were washed with 0.1% PBT three times for 10 min each, blocked with 2% goat serum (Sigma-Aldrich, G9023) in 0.1% PBT for 30 min, and then incubated at 4°C overnight with a primary antibody against ILP2 (rabbit IgG, polyclonal) (Okamoto et al., 2012) at a 1:500 dilution or against phospho-S6 (rabbit IgG, polyclonal) (Romero-Pozuelo et al., 2017) at a 1:1,000 dilution in a blocking solution. Tissues were washed with 0.1% PBT three times for 10 min each, and incubated at 4°C overnight with Alexa 488-conjugated goat IgG (Thermo Fisher Scientific, A11081) at 1:1,000 dilution and Hoechst 33342 (Thermo Fisher Scientific, 62249) at 1:1,500 dilution in 0.1% PBT. After washing with 0.1% PBT three times for 10 min each, brains and fat bodies were dissected out and mounted in a mounting medium [2.4 g Mowiol 4-88 (Sigma-Aldrich, 81381), 6 g glycerol, 6 mL distilled water, and 12 mL 0.2 M Tris–Cl (pH 8.5)].
To investigate the expression pattern of Hsp90 protein, expression of GFP-tagged Hsp90 was observed using histochemistry as follows: GFP-tagged Hsp90-expressing larvae cultured on a series of limited culture media were dissected in PBS and fixed for 25 min with 4% paraformaldehyde in 0.01% PBT. Tissues were washed with 0.01% PBT three times for 10 min each, and incubated at 4°C overnight with Hoechst 33342 at 1:1,500 dilution and Alexa 546-conjugated phalloidin (Thermo Fisher Scientific, A22283) at 1:500 dilution in 0.01% PBT. GFP-tagged Hsp90 was detected without signal enhancement by an antibody against GFP. After washing with 0.01% PBT three times for 10 min each, the fat bodies were mounted in the mounting medium.
Images were taken with a Zeiss LSM700, and image analyses were performed using Image J/Fiji software (Schindelin et al., 2009).
Statistical analyses were performed using R software (version 3.6.2)1 (R Core Team, 2019). Data were analyzed using Student’s t-test, Mann–Whitney U-test, Dunnett’s test, Tukey’s test, or Steel’s multiple comparison tests.
A previous study conducted a genome-wide RNAi screen and identified 319 genes whose knockdown caused a decrease or increase in TAG levels in the adult stage (Pospisilik et al., 2010). Among these genes, we focused on 231 genes whose corresponding RNAi stocks were available in NIG Fly Stock Center Japan and whose orthologous genes exist in humans (Figure 1A). To knock down the candidate genes, fat-body-selective Cg-Gal4 was used to overexpress RNAi constructs under the control of the upstream activating sequence (UAS) (Cg-Gal4 > UAS-RNAi against gene-of-interest) (Asha et al., 2003). We found 29 genes whose knockdown caused developmental arrest at the larval stage (Supplementary Table 2 and Figure 1A). After excluding 17 housekeeping genes, including translation initiation complex subunits, amino acid-tRNA ligases, ribosome components and regulators, spliceosome subunits, and proteasome subunits (Supplementary Table 2), the resulting 12 genes were knocked down in the fat body using 2–3 RNAi lines to confirm that the larval-arrest phenotype was reproducible (Figure 1A). We found that the larval-arrest phenotype of CG1965, CG16903, nuclear transport factor-2 (Ntf-2), Hsp90, and opossum (opm) was reproducible in knockdown animals (Supplementary Table 3 and Figure 1A). This indicates that these five genes are required for proper larval development.
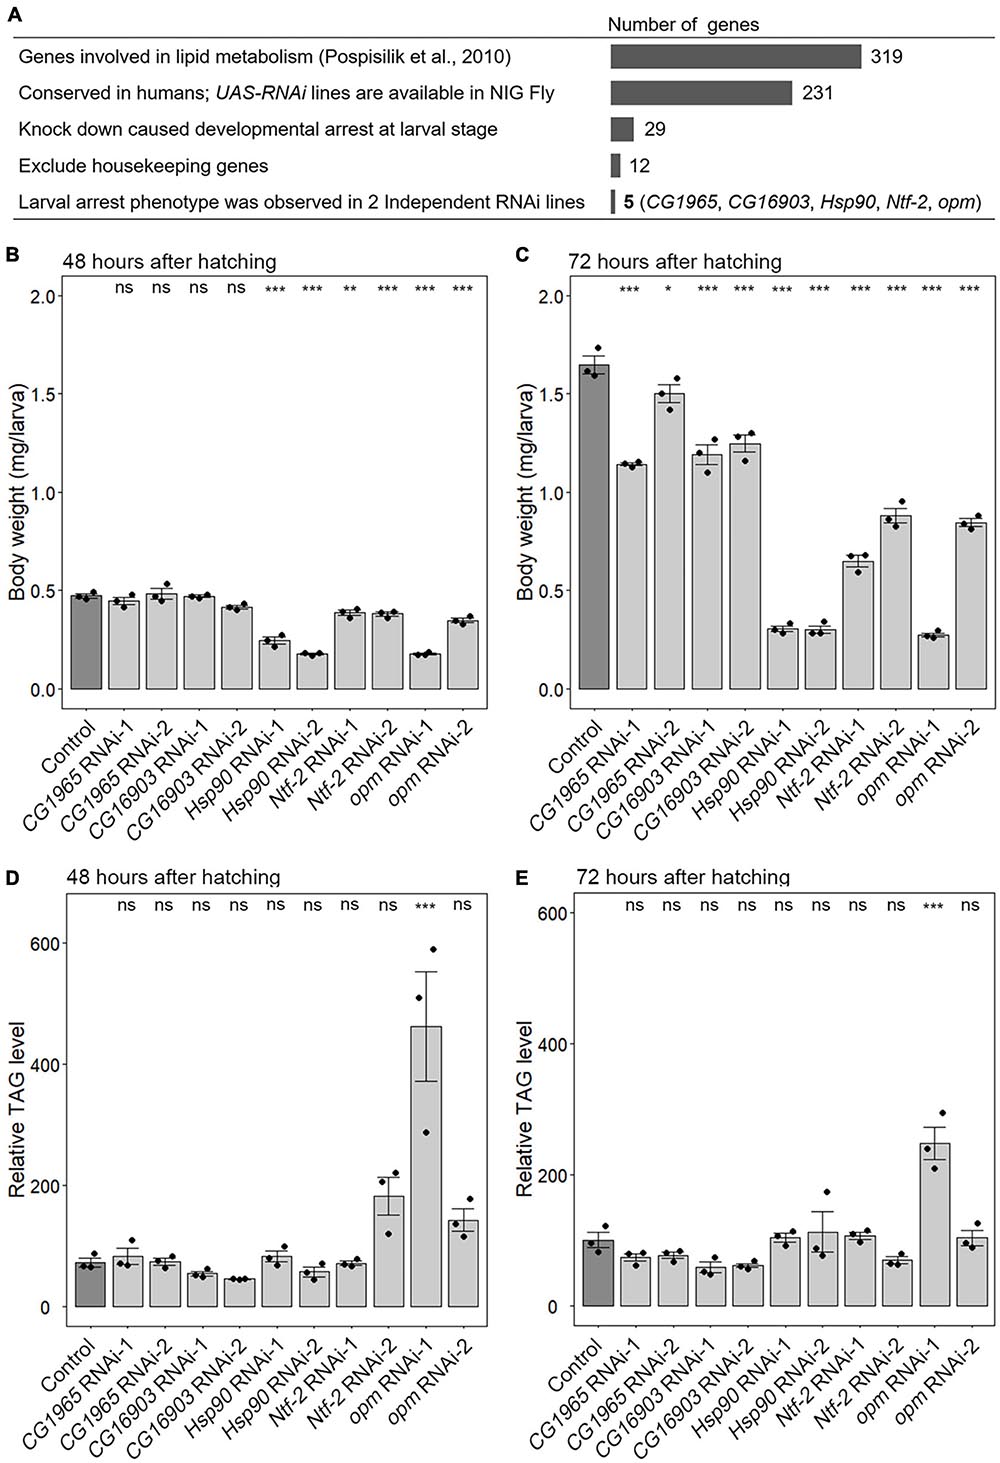
Figure 1. A fat-body-selective RNAi screen to identify novel growth regulators. (A) Scheme of a fat-body-selective RNAi screen to identify novel growth regulators. Candidate genes and the results are summarized in Supplementary Tables 1, 2. NIG Fly, Fly Stocks of National Institute for Basic Biology (Japan). (B–E) Fat-body-selective knockdown of Hsp90, Ntf-2, and opm causes growth retardation. The body weights (B,C) and the relative triacylglycerol (TAG) levels (D,E) in control (Cg-Gal4 > +) (dark gray) and knockdown animals (Cg-Gal4 > UAS-RNAi against gene-of-interest) (light gray) at 48 (B,D) and 72 h after hatching (C,E). In all graphs, the average values of triplicate datasets are shown with SEs and scatter plots. Ten or 15 larvae were pooled in each sample. Different lowercase letters indicate statistically significant differences (*P < 0.05, **P < 0.01, ***P < 0.001; Dunnett’s test). ns, not significant.
Next, we measured the body weight and TAG content in the knockdown animals. The body weights of CG1965 and CG16903 RNAi animals were slightly reduced compared to that of the control (Cg-Gal4 > +) at 72 hAH (Figures 1B,C), while the body weight of Hsp90, Ntf-2, and opm RNAi animals was more severely reduced at 48 and 72 hAH (Figures 1B,C). These results suggest that Hsp90, Ntf-2, and opm regulate systemic growth, whereas CG1965 and CG16903 are required for the onset of pupariation. Notably, although these genes were originally identified as the possible regulators of TAG metabolism in the adult stage (Pospisilik et al., 2010), the TAG levels were not significantly reduced in any knockdown larvae at 48 and 72 hAH (Figures 1D,E). This result suggests that these genes have little or no effect on TAG metabolism during larval development.
In our RNAi screen, fat-body-selective Hsp90 knockdown animals showed the most severe growth defect among the others (Figures 1B,C), suggesting that Hsp90 expressed in the fat body plays an essential role in organismal growth. We subsequently focused on Hsp90 and performed further genetic analyses to elucidate the in vivo functions.
First, we confirmed that the expression level of GFP-fused Hsp90 (Hsp90::GFP), expressed under the control of endogenous Hsp90 upstream sequences (Sarov et al., 2016), was reduced in the fat bodies of both Hsp90 RNAi-1 and RNAi-2 animals (Cg-Gal4 > UAS-Hsp90 RNAi-1/2, Hsp90::GFP) compared to that in control animals (Cg-Gal4 > +, Hsp90::GFP) (Supplementary Figure 1). This result indicates that these RNAi constructs are effective in reducing Hsp90 expression. Additionally, we confirmed that control animals (Cg-Gal4 > +) developed from larval to pupal stages, whereas Hsp90 RNAi-1 and RNAi-2 animals (Cg-Gal4 > UAS-Hsp90 RNAi-1/2) were arrested at the second instar larval stage (Figure 2A). Next, we measured the body weight of control and Hsp90 RNAi animals at 24, 48, and 72 hAH. At 24 hAH, the body weights of Hsp90 RNAi-1 and RNAi-2 animals were equivalent to those of control animals (Figure 2B). The weights of the control larvae reached approximately 1.8 mg at 72 hAH (Figure 2B), whereas those of Hsp90 RNAi-1 and RNAi-2 animals were approximately 0.25–0.3 mg at the same stage (Figures 2B,C). These results indicate that Hsp90 expressed in the fat body is required for the proper progression of systemic growth from 24 hAH onward.
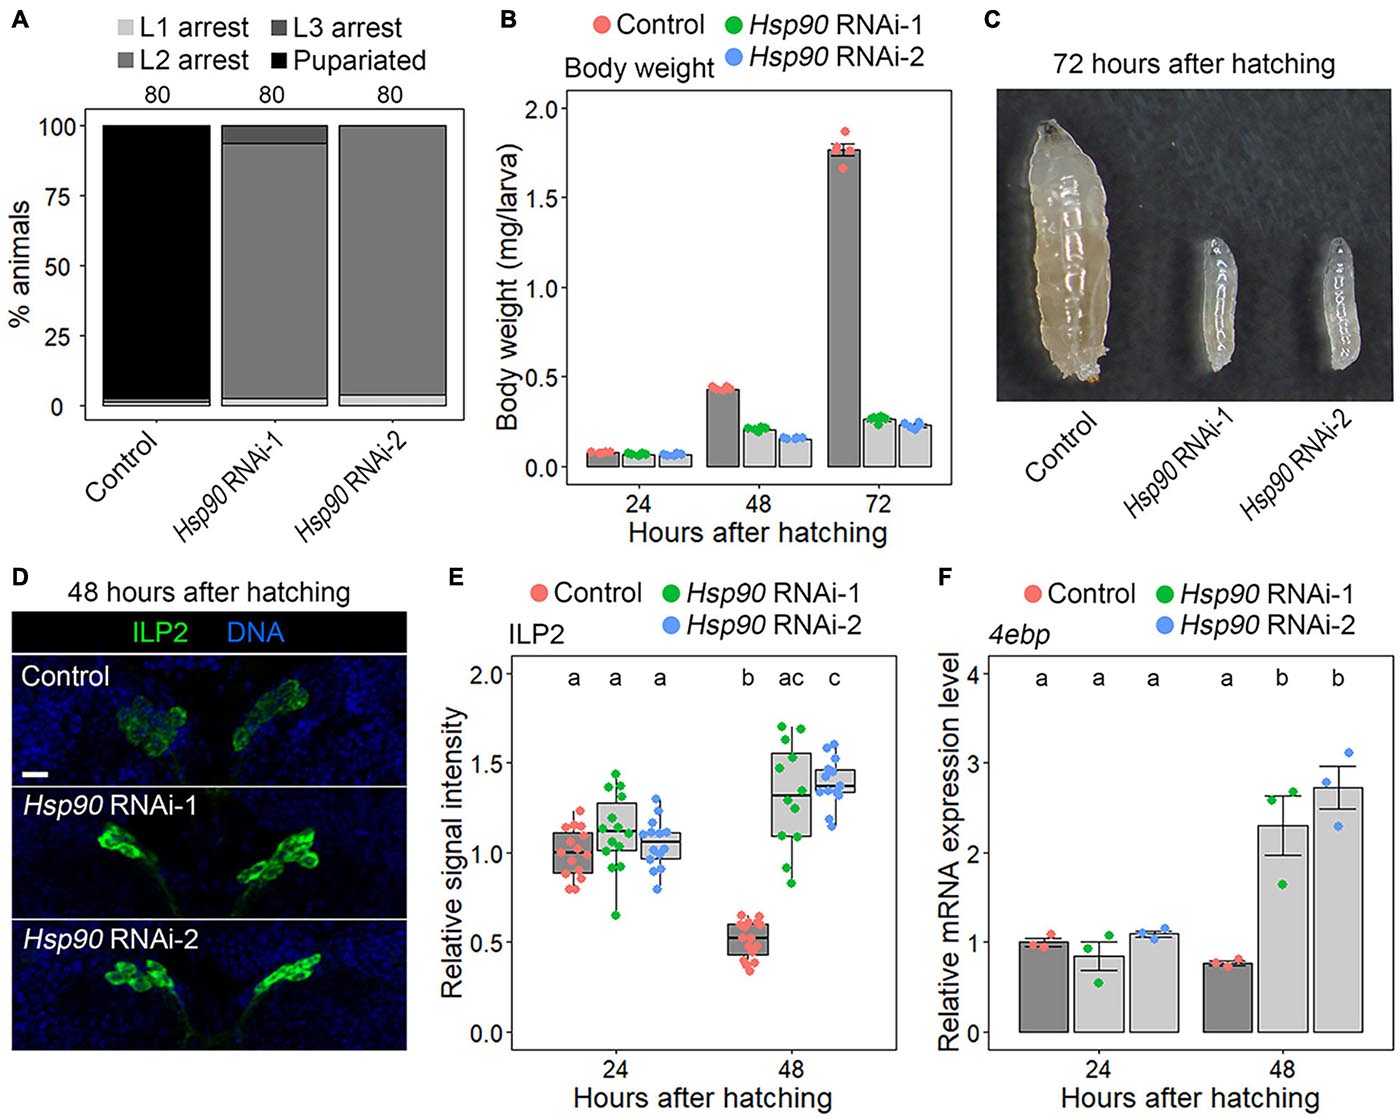
Figure 2. Hsp90 is required for ILP release and systemic growth. (A) Fat-body-selective knockdown of Hsp90 causes a developmental arrest at the 2nd instar larval stage. Percentages of pupariated animals (black) and arrested 1st instar (L1) (light gray)/2nd instar (L2) (gray)/3rd instar larvae (L3) (dark gray) in control (Cg-Gal4 > +), Hsp90 RNAi-1 (Cg-Gal4 > UAS-Hsp90 RNAi-1), and Hsp90 RNAi-2 (Cg-Gal4 > UAS-Hsp90 RNAi-2) are shown. Sample sizes (the number of animals) are shown above each column. (B) Fat-body-selective knockdown of Hsp90 causes a global growth defect. The body weight of control (red), Hsp90 RNAi-1 (green), and Hsp90 RNAi-2 animals (blue) is shown at indicated time points. Average values of five datasets with SE and scatter plots are shown. Ten to 15 larvae were pooled in each sample. (C) Control animals (left) developed into the 3rd instar larval stage and Hsp90 RNAi-1 (middle) and RNAi-2 animals (right) arrested at the L2 stage. The photograph was taken at 72 h after hatching. (D) ILP2 immunostaining signal increased in the brains of fat-body-selective Hsp90 knockdown animals. The brains of control (upper panel), Hsp90 RNAi-1 (middle panel), and Hsp90 RNAi-2 animals (lower panel) were labeled for ILP2 (green) and DNA (blue) at 48 h after hatching. Scale bar, 10 μm. (E) The ILP2 immunostaining signal intensities in the brains of control (red), Hsp90 RNAi-1 (green), and Hsp90 RNAi-2 animals (blue) are shown at indicated time points. The relative signal intensities are shown with box plots. The mean value of the controls at 24 h after hatching was set to 1. Sample sizes were 12–16. Different lowercase letters indicate statistically significant differences (P < 0.05; Steel–Dwass test). (F) The expression levels of 4ebp, which were measured using qPCR, were elevated in fat-body-selective Hsp90 knockdown animals. The relative expression levels of 4ebp in control (red), Hsp90 RNAi-1 (green), and Hsp90 RNAi-2 animals (blue) are shown at indicated time points. Triplicate datasets of the 4ebp expression levels are shown with average values, SEs, and scatter plots. Different lowercase letters indicate statistically significant differences (P < 0.05; Tukey’s test).
Since ILPs released from IPCs promote systemic growth, we assumed that ILP secretion and systemic insulin signaling are impaired in Hsp90 knockdown animals. To test this possibility, the signal intensity of ILP2, the major ILP secreted from IPCs, was measured in control and Hsp90 RNAi animals through immunostaining. If ILP2 secretion is blocked, ILP2 granules accumulate in IPCs, and hence the ILP immunostaining level is elevated. The signal intensity of ILP2 in Hsp90 RNAi-1 and RNAi-2 animals was equivalent to that of control animals at 24 hAH (Figure 2E), but was significantly elevated in Hsp90 RNAi-1 and RNAi-2 animals at 48 hAH (Figures 2D,E). This result indicates that IPC activity is suppressed in Hsp90 knockdown animals at 48 hAH but not at 24 hAH. Furthermore, qPCR analysis revealed that the expression level of eIF-4E-binding protein (4ebp), which is suppressed by insulin signaling (Hietakangas and Cohen, 2009), was significantly increased in Hsp90 knockdown animals at 48 hAH but not at 24 hAH (Figure 2F). Together, these results indicate that adipose Hsp90 is required for ILP secretion and systemic insulin signaling from 24 hAH onward.
Because ILP secretion is remotely controlled by fat-body-derived insulinotropic/insulinostatic signal peptides, we used qPCR to investigate whether Hsp90 knockdown causes downregulation of insulinotropic signal peptides or upregulation of insulinostatic signal peptides in the fat body. We selected GBP1, GBP2, stunted, and CCHa2 as insulinotropic signal peptide-coding genes because they promote ILP2 secretion and growth (Sano et al., 2015; Delanoue et al., 2016; Koyama and Mirth, 2016; Meschi et al., 2019). GBP1 expression was not affected in Hsp90 RNAi-1 and 2, whereas GBP2, stunted, and CCHa2 expression levels were significantly reduced in the fat bodies of Hsp90 RNAi-1 and RNAi-2 animals (Figure 3). This indicates that Hsp90 is required for the transcriptional upregulation of GBP2, stunted, and CCHa2. In contrast, we failed to amplify transcripts of TACE, which promotes secretion of the insulinostatic signal peptide Eiger (Agrawal et al., 2016), although we tested three independent primer sets (Supplementary Table 5). Thus, we could not determine whether Hsp90 regulates TACE expression in the fat body.
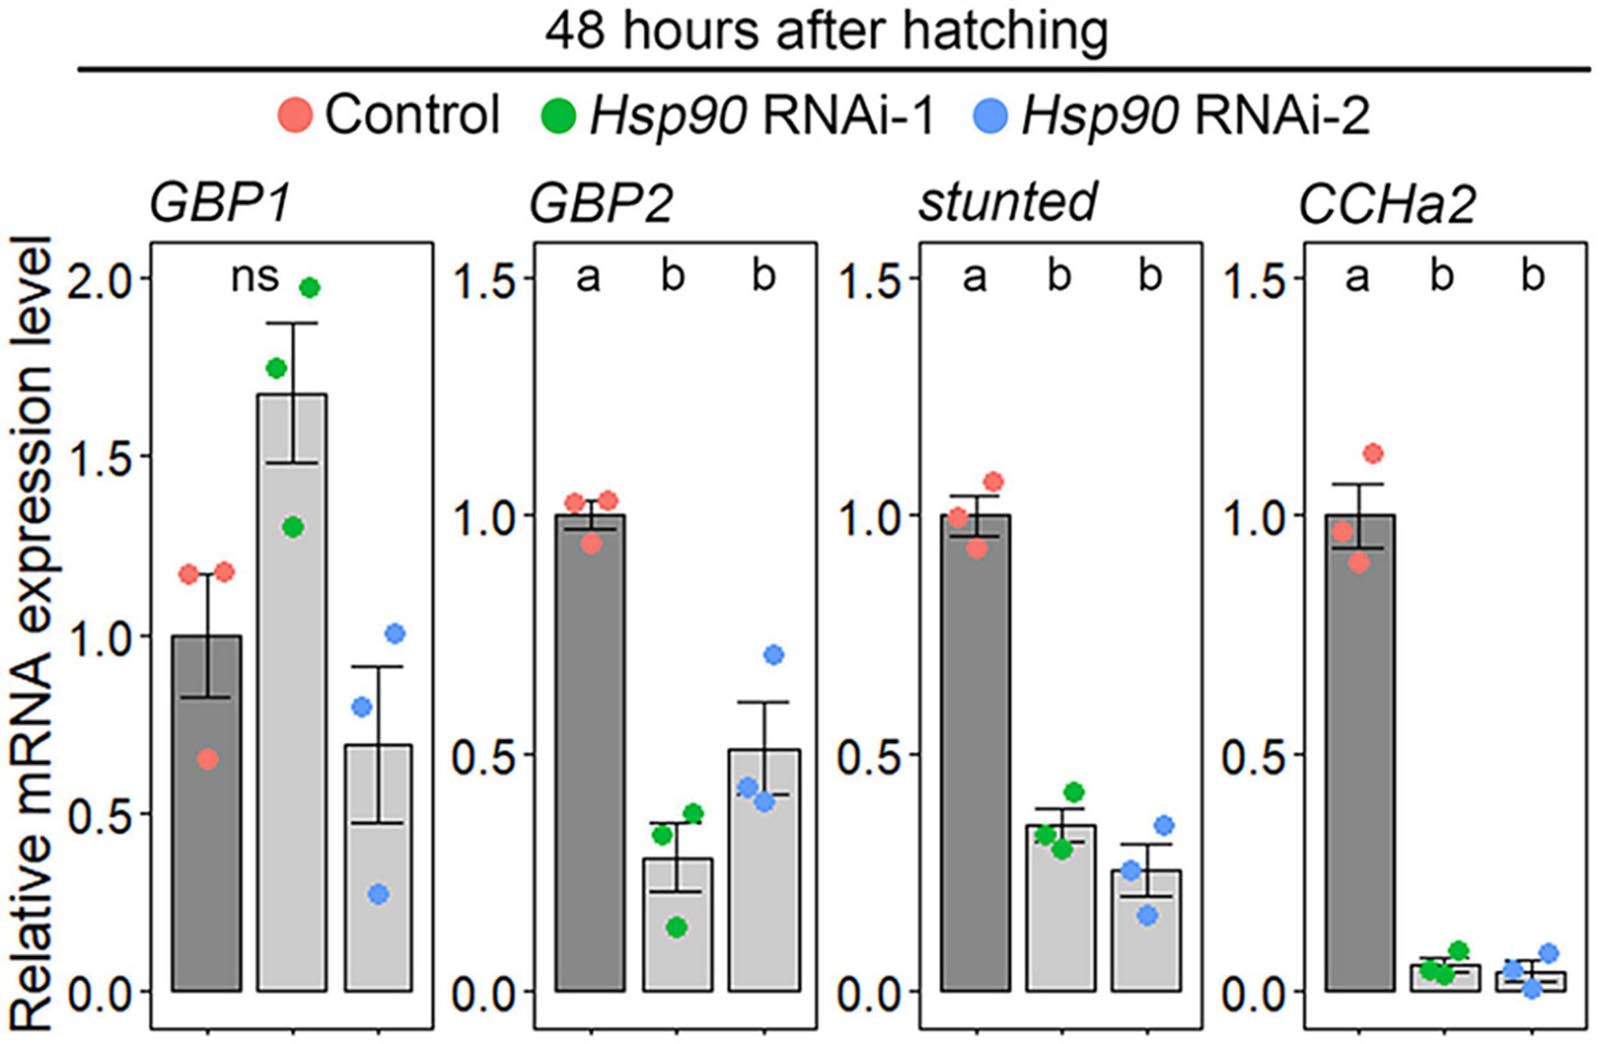
Figure 3. Hsp90 promotes GBP2, stunted, and CCHa2 expression in the fat body. The expression levels of GBP2, stunted, and CCHa2 were reduced in the fat bodies of Hsp90 knockdown animals. The expression levels of GBP1, GBP2, stunted, and CCHa2 in the fat bodies of control (Cg-Gal4 > +) (red), Hsp90 RNAi-1 (Cg-Gal4 > UAS-Hsp90 RNAi-1) (green), and Hsp90 RNAi-2 (Cg-Gal4 > UAS-Hsp90 RNAi-2) (blue) were measured by qPCR at 48 h after hatching. The average values of triplicate datasets are shown as SEs and scatter plots. Different lowercase letters indicate statistically significant differences (P < 0.05; Tukey’s test).
Next, to test whether protein/amino acid availability affected Hsp90 expression, we measured the Hsp90 expression levels in the following starved and re-fed larvae: larvae reared on nutrient-rich German food were starved from 24 to 48 hAH; they were re-fed on holidic media with or without protein until 96 hAH (Figure 4A and Supplementary Table 4). Hsp90 expression, developmental phenotype, and insulin signaling activity were examined using the WT (Oregon R) and Hsp90::GFP-expressing animals. First, we ascertained that WT larvae re-fed on a control holidic medium had an increased body weight and underwent pupariation; however, re-feeding WT animals on a protein-deficient holidic medium resulted in growth and developmental arrest (Figures 4B,C) and also caused an increase in the ILP2 immunostaining signal intensities and 4ebp expression (Figures 4D,E). These data are consistent with previous studies showing the protein/amino acid dependency of ILP release and larval growth (Sang, 1956; Géminard et al., 2009). We then observed Hsp90::GFP expression in the whole body and fat body in this starvation/re-feeding experiment. We found that Hsp90::GFP signal intensity was reduced after 24-hour starvation and was restored in the whole body and fat body by control holidic medium feeding (Figures 4F,G). In contrast, Hsp90::GFP expression remained downregulated in larvae cultured on protein-deficient holidic media (Figures 4F,G). This indicates that Hsp90 expression depends on protein/amino acid availability. Likewise, Hsp90 mRNA expression in the fat body was reduced by fasting and was restored by re-feeding of a protein-containing control holidic medium (Figure 4H). These results indicate that Hsp90 expression is upregulated at the transcriptional level, depending on protein/amino acid availability.
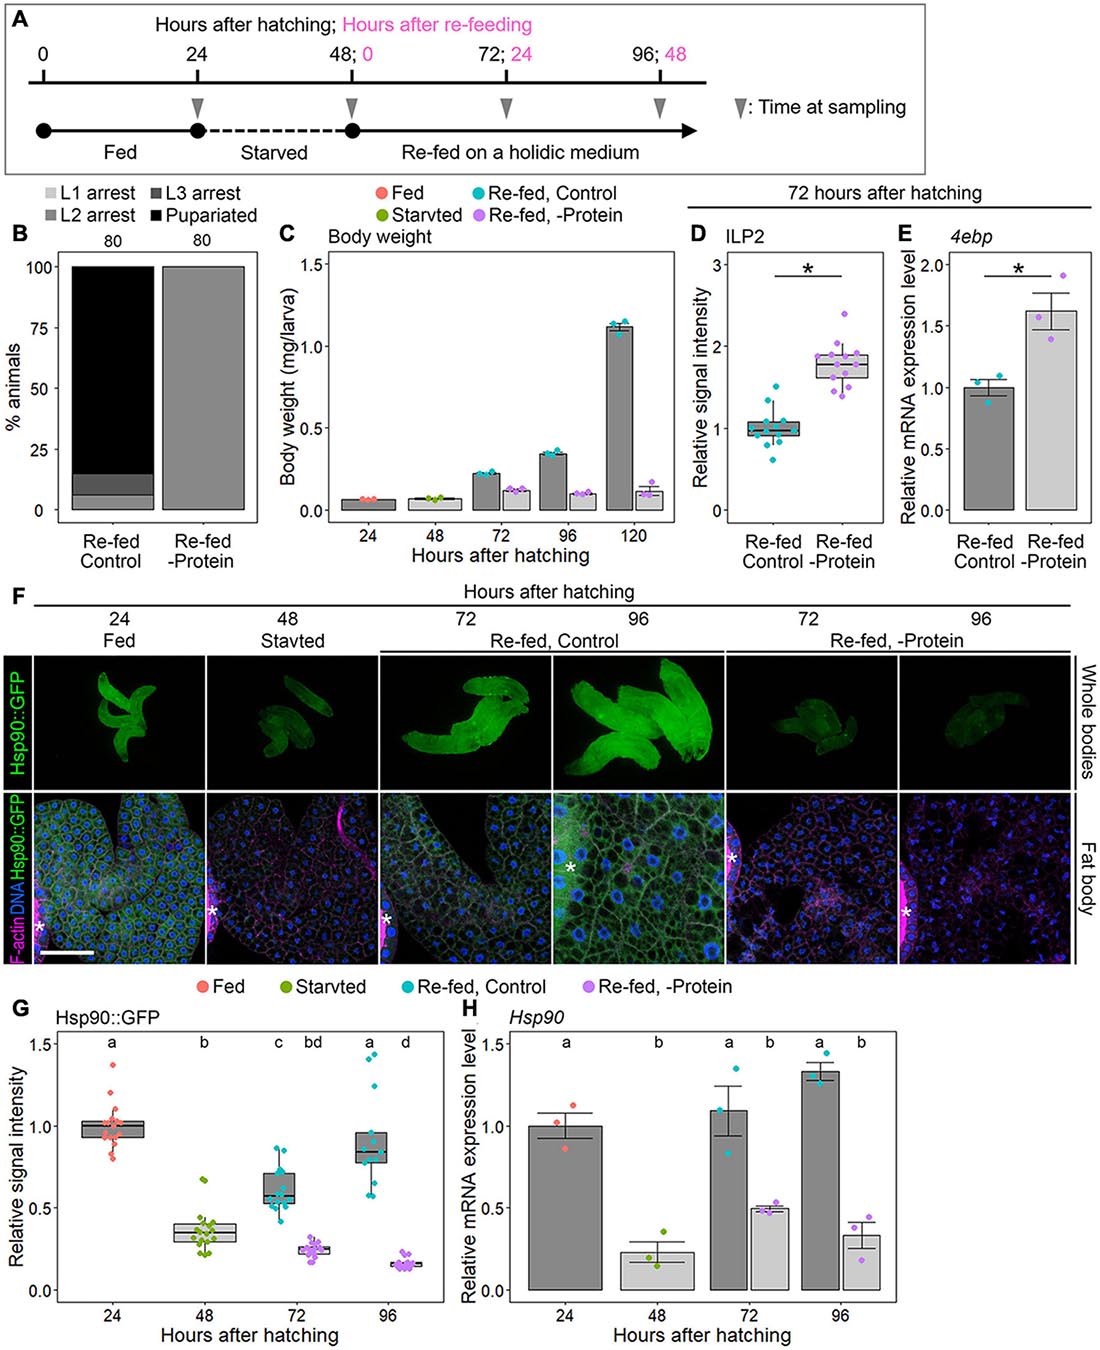
Figure 4. Hsp90 expression is dependent on protein feeding. (A) Starvation and re-feeding scheme. (B) Protein feeding is required for larval-pupal transition. Percentages of pupariated animals (black) and arrested 1st instar (L1) (light gray)/2nd instar (L2) (gray)/3rd instar larvae (L3) (dark gray) in wild-type (WT, Oregon R) animals re-fed on a control or protein-deficient holidic medium are shown. Sample sizes (number of animals) are shown above each column. (C) Protein feeding is required for systemic growth. The body weights of WT larvae reared on a German medium (red), starved on a starvation medium (green), and re-fed on a control (light blue) or a protein-deficient holidic medium (purple) are shown at indicated time points. Triplicate datasets are shown with average values, SEs, and scatter plots. Ten to 15 larvae were pooled in each sample. (D) ILP2 immunostaining signal is elevated in the brain of WT larvae re-fed on a protein-deficient holidic medium. ILP2 immunostaining signal intensities in the brains of WT larvae re-fed on a control (light blue) or a protein-deficient holidic medium (purple) were measured at 72 h after hatching (24 h after re-feeding). The relative signal intensities are shown with box plots. The mean value of the controls was set to 1. Sample size was 13 in both groups. Asterisk indicates statistically significant differences (P < 0.01; Steel–Dwass test). (E) 4ebp expression is elevated in WT larvae re-fed on a protein-deficient holidic medium. The relative expression levels of 4ebp in WT larvae re-fed on a control (light blue) or a protein-deficient holidic medium (purple) were measured using qPCR at 72 h after hatching (24 h after re-feeding). Triplicate datasets of the 4ebp expression levels are shown with average values, SEs, and scatter plots. Asterisk indicates statistically significant difference (P < 0.01; t-test). (F) GFP fluorescence is reduced in Hsp90::GFP-expressing larvae re-fed on a protein-deficient holidic medium. Hsp90::GFP-expressing larvae reared on a German medium (“Fed”), starved on a starvation medium (“Starved”), and re-fed on a control (“Re-fed, Control”) or a protein-deficient holidic medium (“Re-fed, -Protein”) were observed at indicated time points. Whole-bodies (upper panels) and fat bodies (lower panels) of Hsp90::GFP-expressing larvae are shown along with F-actin (magenta in lower panels) and DNA (blue in lower panels). Asterisks indicate the salivary gland. Scale bar, 50 μm. (G) The GFP signal intensities in the fat bodies of Hsp90::GFP-expressing animals reared on a German medium (red), starved on a starvation medium (green), and re-fed on a control (light blue) or a protein-deficient holidic medium (purple) are shown at indicated time points. The relative signal intensities of GFP are shown with box plots. The mean value at 24 h after hatching was set to 1. Sample sizes were 13–18. Different lowercase letters indicate statistically significant differences (P < 0.05; Steel–Dwass test). (H) Hsp90 expression is downregulated in the fat bodies of WT larvae re-fed on a protein-deficient holidic medium. The Hsp90 expression levels in the fat bodies of WT animals reared on a German medium (red), starved on a starvation medium (green), and re-fed on a control (light blue) or a protein-deficient holidic medium (purple) were measured by qPCR at indicated time points. The average values of triplicate datasets are shown with SEs and scatter plots. Different lowercase letters indicate statistically significant differences (P < 0.05; Tukey’s test).
Considering that TORC1 senses protein/amino acid availability, the above results raise the possibility that TORC1 controls Hsp90 expression. To address this hypothesis, we investigated Hsp90 expression levels in the fat bodies of Tor mutants and their developmental phenotypes. As shown in Supplementary Figure 2, Tork17004 and TorR97C homozygous mutants (Tork17004/Tork17004 and TorR97C/TorR97C) (Oldham et al., 2000; Zhang et al., 2000, 2006) showed developmental arrest at the second and first instar larval stages, respectively. In addition, transheterozygous Tor mutants (Tork17004/TorR97C) showed delayed pupariation. In contrast, WT (+/+) and heterozygous Tor mutants (Tork17004/+ and TorR97C/+) did not show any developmental defects. In accordance with the phenotypic severity, Hsp90 expression was not significantly decreased in the fat bodies of heterozygous Tork17004 and TorR97C mutants compared to WT, whereas it was significantly reduced in the fat bodies of Tork17004/TorR97C transheterozygous and Tork17004 homozygous mutants at 48 hAH (Figure 5A). These results indicate that Tor is required for the upregulation of Hsp90 expression in the fat body. Furthermore, fat-body-selective knockdown of Tor (Cg-Gal4 > UAS-Tor RNAi) and TORC1 component raptor (Cg-Gal4 > UAS-raptor RNAi) caused a delay in pupariation (Supplementary Figure 2), and Hsp90 transcript levels were reduced in the fat bodies of Tor and raptor knockdown animals (Figure 5B). These results indicate that TORC1 is required for the upregulation of Hsp90 expression in the fat body. However, fat-body-selective Hsp90 overexpression did not rescue the developmental delay in Tor RNAi animals (Supplementary Figure 2), suggesting that TORC1 likely regulates not only Hsp90 but also other effectors to promote growth and development. Additionally, the signal intensity of the canonical TORC1 signaling marker, phospho-S6 (Romero-Pozuelo et al., 2017), was not significantly reduced in the fat bodies of Hsp90 RNAi-1 and RNAi-2 animals (Supplementary Figure 3), suggesting that Hsp90 has little effect on TORC1 signaling activity in the fat body.
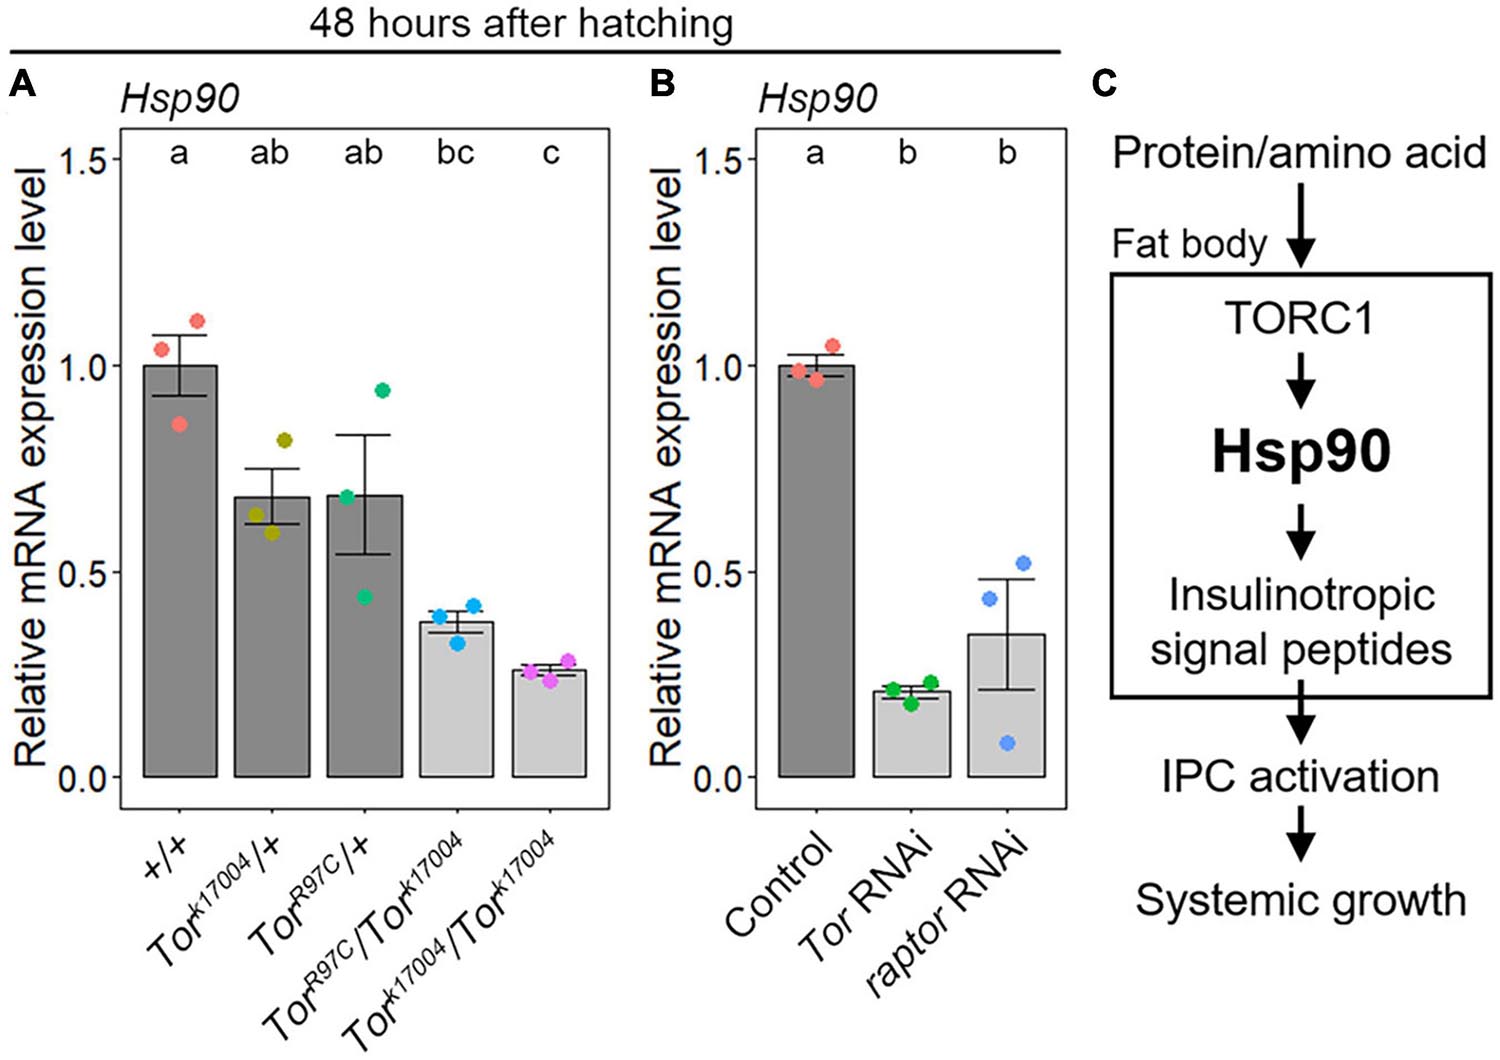
Figure 5. TORC1 signaling positively regulates Hsp90 expression in the fat body. (A) Loss of Tor activity causes a reduction in Hsp90 expression in the fat body. The Hsp90 expression levels in the fat bodies of WT (+/+) (red), heterozygous Tor mutants (Tork17004/+, TorR97C/+) (yellow and green, respectively), homozygous Tork17004 mutants (Tork17004/Tork17004) (light blue), and transheterozygous Tor mutants (Tork17004/TorR97C) (purple) were measured using qPCR at 48 h after hatching. The average values of triplicate datasets are shown with SE and scatter plots. Different lowercase letters indicate statistically significant differences (P < 0.05; Tukey’s test). (B) Fat-body-selective Tor knockdown causes a reduction in Hsp90 expression. The Hsp90 expression levels in the fat bodies of the control (Cg-Gal4 > +) (red), Tor RNAi (Cg-Gal4 > UAS-Tor RNAi) (green), and raptor RNAi animals (Cg-Gal4 > UAS-raptor RNAi) (blue) were measured using qPCR at 48 h after hatching. The average values of triplicate datasets are shown with SEs and scatter plots. Different lowercase letters indicate statistically significant differences (P < 0.05; Tukey’s test). (C) A current working model for systemic growth regulation by Hsp90. Hsp90 expression is upregulated by TORC1-mediated protein/amino acid signaling. Adipocyte Hsp90 promotes gene expression of insulinotropic signal peptides, and subsequently, Hsp90 remotely promotes IPC activity and systemic growth.
We assumed that ambient temperature controls Hsp90 expression since Hsp90 belongs to the HSP family, a group of heat-inducible molecular chaperones (Ashburner and Bonner, 1979). However, when Hsp90::GFP-expressing larvae were cultured at 29, 25, or 18°C, we observed from their histochemistry that temperature did not significantly affect Hsp90::GFP levels in the fat body (Supplementary Figure 4). This result suggests that Hsp90 expression is robust, at least in this temperature range during larval development.
Taken together, these results indicate that Hsp90 expression is upregulated by TORC1-mediated protein/amino acid signaling in the fat body (Figure 5C). In addition, considering that the expression of insulinotropic signal peptides, IPC activity, and growth rate were reduced in fat-body-selective Hsp90 knockdown animals, it is reasonable to propose that adipose Hsp90 remotely controls IPC activity and systemic growth through the regulation of insulinotropic signal peptides (Figure 5C).
In this study, we performed fat body-selective RNAi screening and identified CG1965, CG16903, Ntf-2, Hsp90, and opm as novel regulators of fat-body-mediated larval growth. Among these genes, CG1965 and CG16903 are functionally uncharacterized genes in Drosophila. CG1965 encodes a protein possessing a domain named GC-rich sequence DNA-binding factor, and its amino acid sequence is orthologous to human PAX3 and PAX7 binding protein 1 (PAXBP1) (see FlyBase; FBgn0037466), which serves as an adaptor protein linking the histone methyltransferase complex to a transcription factor PAX7 and regulates epigenetic regulation of target genes (Diao et al., 2012). Interestingly, human PAXBP1 possesses a potential pathogenic genetic variation in familial growth defects (Alharby et al., 2017). Furthermore, cyclin L1, a human ortholog of CG16903 (FBgn0040394), has been reported to be associated with fetal growth and birth weight (Freathy et al., 2010). Cyclin L1 participates in the regulation of RNA polymerase II transcription regulation and pre-mRNA processing (Dickinson et al., 2002). The role of CG1965 and CG16903 in Drosophila development is unclear; however, the above observations suggest the possibility that CG1965 and CG16903 encode evolutionarily conserved growth regulators, and Drosophila may serve as a useful genetic model to study the in vivo functions of these genes.
We found that Hsp90 expression is dependent on protein/amino acid feeding, and TORC1 upregulates its transcription (Figures 4, 5). Considering that TORC1 positively regulates the transcription factor Myc in Drosophila (Teleman et al., 2008; Demontis and Perrimon, 2009; Li et al., 2010; Parisi et al., 2011) and that Myc directly activates Hsp90 transcription in mammals (Teng et al., 2004), Myc is a potential transcriptional regulator of Hsp90 in Drosophila. It has also been reported that TOR upregulates the transcription factor DNA replication-related element-binding factor (DREF) partially via Myc in the fat body (Killip and Grewal, 2012). These findings and our data lead to the hypothesis that TORC1 regulates Hsp90 transcription through Myc and DREF. Alternatively, because Hsp90 and other Hsp genes are induced by a transcription factor called heat shock factor (HSF) upon induction of heat shock and other environmental stresses (Gomez-Pastor et al., 2018), it is also possible that HSF induces Hsp90 transcription in a TORC1-dependent manner, although it remains unclear whether HSF activity is dependent on proteins/amino acids and TORC1. It will be interesting to know whether HSF, Myc, DREF, or other transcriptional regulators upregulate Hsp90 expression in response to TORC1-mediated nutrient signals.
Chaperones generally support unspecific protein folding; however, Hsp90 seems to be less promiscuous than other chaperones (Wandinger et al., 2008). Hsp90 binds to client proteins such as transcription factors and signaling proteins in a near-native state at a later stage of folding to potentiate their functions (Pratt and Toft, 1997; Young et al., 2001; Wandinger et al., 2008; Trepel et al., 2010). Hsp90 is involved in various biological processes, including gene expression, chromatin remodeling, cell cycle progression, stem cell reactivation, and exosome release (Pratt and Toft, 1997; Tariq et al., 2009; Trepel et al., 2010; Sawarkar et al., 2012; Bandura et al., 2013; Huang and Wang, 2018; Lauwers et al., 2018). We revealed that Hsp90 promotes ILP2 secretion and systemic growth progression (Figure 2). Furthermore, we found that GBP2, stunted, and CCHa2 expression was reduced in the fat body of Hsp90 RNAi animals (Figure 3), indicating that Hsp90 upregulates the expression of these insulinotropic signal peptides. Previous studies have shown that GBP2 and CCHa2 expression is dependent on protein/amino acid feeding and TORC1 signaling (Sano et al., 2015; Koyama and Mirth, 2016). Hence, it is likely that TORC1 upregulates GBP2 and CCHa2 transcription via Hsp90. In contrast, the expression of stunted is regulated by the transcription factor peroxisome proliferator activated receptor-γ coactivator-1 (PGC1)/Spargel, whereas Stunted secretion into the hemolymph is governed by TORC1 (Delanoue et al., 2016). Thus, it is probable that Hsp90 interacts with PGC1 to regulate stunted expression. In contrast to GBP2, stunted, and CCHa2, GBP1 expression levels were not affected in Hsp90 RNAi animals (Figure 3), although GBP1 expression is also promoted by protein/amino acid feeding and TORC1 signaling (Koyama and Mirth, 2016). Therefore, it is likely that GBP1 transcription is regulated by Hsp90-independent but TORC1-dependent pathways. Indeed, fat-body-selective Hsp90 overexpression did not rescue the developmental delay in Tor RNAi animals (Supplementary Figure 2). Thus, TORC1 likely regulates not only Hsp90 but also other effectors to activate the insulinotropic signal peptide expression and systemic growth.
Because the fat body also secretes the insulinostatic signal peptide Eiger to downregulate ILP production in response to nutrient starvation (Agrawal et al., 2016), one possible mechanism is that Hsp90 suppresses the expression of TACE, a rate-limiting factor for the secretion of Eiger under nutrient-rich conditions. However, we failed to amplify TACE transcripts using qPCR. Thus, TACE transcription might be active in a narrow time window, or its expression pattern is influenced by unknown environmental conditions. Further studies are required to elucidate the transcriptional regulatory mechanisms of fat-body-derived signal peptides.
Another possible function of Hsp90 is to stabilize fat-body-derived peptides so that they can travel a large distance to the CNS. In mammals, Hsp90 is secreted into the extracellular space (Eustace et al., 2004; Xiaofeng et al., 2009). Considering that signal peptides such as EGF, including GBPs, only act locally, whereas fat-body-derived GBPs can reach the CNS as peptide hormones (Miura et al., 2006; Koyama and Mirth, 2016; Meschi et al., 2019), it is possible that the fat body secretes Hsp90 along with signal peptides to increase their stability. Moreover, recent studies have revealed that Hsp90 directly binds and remodels plasma membranes to promote the fusion of multivesicular bodies with the cell membrane and the subsequent release of exosomes in the Drosophila nervous system (Lauwers et al., 2018). Further studies are necessary to elucidate the role of Hsp90 in the adipocyte secretory system.
In conclusion, adipose Hsp90 acts as a nutrient-responding factor and promotes growth and development, at least in part, via the fat body-IPC axis. To our knowledge, this is the first study to show that Hsp90 serves as a nutrient-responsive growth regulator. Because the Hsp90 expression level seems to be dependent on proteins/amino acid feeding in many larval tissues (Figure 4), Hsp90 likely functions ubiquitously in response to protein/amino acids during larval development. Considering that juvenile animals need to build up their bodies by continuous intake of available macronutrients such as amino acids and proteins, we propose that Hsp90 is upregulated under such “amino acid/protein-rich stress” conditions to support continuous and rapid protein anabolism and growth.
The original contributions presented in the study are included in the article/Supplementary Material, further inquiries can be directed to the corresponding author/s.
YO and KY-K contributed to conception and design of the study. YO performed the statistical analysis and wrote the first draft of the manuscript. All authors contributed to experiment, manuscript revision, read, and approved the submitted version.
This work was supported by grants to YO from the Japan Society for the Promotion of Science KAKENHI Grant Number 16K18579 and the Life Science Center for Survival Dynamics, Tsukuba Advanced Research Alliance (TARA) in the University of Tsukuba.
The authors declare that the research was conducted in the absence of any commercial or financial relationships that could be construed as a potential conflict of interest.
We thank the National Institute of Genetics (Japan), the Vienna Drosophila RNAi Center, and the Bloomington Drosophila Stock Center (supported by NIH P40 OD018537) for fly stocks. We also thank Takashi Nishimura and Aurelio A. Teleman for antibodies. We also acknowledge Naoki Yamanaka for critical reading of the manuscript. We would also like to thank editage (www.editage.com) for english language editing. We also thank Satoru Kobayashi for constructive suggestions.
The Supplementary Material for this article can be found online at: https://www.frontiersin.org/articles/10.3389/fphys.2021.690564/full#supplementary-material
Agrawal, N., Delanoue, R., Mauri, A., Basco, D., Pasco, M., Thorens, B., et al. (2016). The Drosophila TNF eiger is an adipokine that acts on insulin-producing cells to mediate nutrient response. Cell Metab. 23, 675–684. doi: 10.1016/j.cmet.2016.03.003
Alharby, E., Albalawi, A. M., Nasir, A., Alhijji, S. A., Mahmood, A., Ramzan, K., et al. (2017). A homozygous potentially pathogenic variant in the PAXBP1 gene in a large family with global developmental delay and myopathic hypotonia. Clin. Genet. 92, 579–586. doi: 10.1111/cge.13051
Asha, H., Nagy, I., Kovacs, G., Stetson, D., Ando, I., and Dearolf, C. R. (2003). Analysis of Ras-induced overproliferation in Drosophila hemocytes. Genetics 163, 203–215.
Ashburner, M., and Bonner, J. J. (1979). The induction of gene activity in drosophila by heat shock. Cell 17, 241–254. doi: 10.1016/0092-8674(79)90150-8
Bandura, J. L., Jiang, H., Nickerson, D. W., and Edgar, B. A. (2013). The molecular chaperone Hsp90 is required for cell cycle exit in Drosophila melanogaster. PLoS Genet. 9:e1003835. doi: 10.1371/journal.pgen.1003835
Colombani, J., Raisin, S., Pantalacci, S., Radimerski, T., Montagne, J., and Léopold, P. (2003). A nutrient sensor mechanism controls Drosophila growth. Cell 114, 739–749. doi: 10.1016/S0092-8674(03)00713-X
Delanoue, R., Meschi, E., Agrawal, N., Mauri, A., Tsatskis, Y., McNeill, H., et al. (2016). Drosophila insulin release is triggered by adipose Stunted ligand to brain Methuselah receptor. Science 353, 1553–1556. doi: 10.1126/science.aaf8430
Demontis, F., and Perrimon, N. (2009). Integration of Insulin receptor/Foxo signaling and dMyc activity during muscle growth regulates body size in Drosophila. Development 136, 983–993. doi: 10.1242/dev.027466
Diao, Y., Guo, X., Li, Y., Sun, K., Lu, L., Jiang, L., et al. (2012). Pax3/7BP is a Pax7- and Pax3-binding protein that regulates the proliferation of muscle precursor cells by an epigenetic mechanism. Cell Stem Cell 11, 231–241. doi: 10.1016/j.stem.2012.05.022
Dickinson, L. A., Edgar, A. J., Ehley, J., and Gottesfeld, J. M. (2002). Cyclin L is an RS domain protein involved in pre-mRNA splicing. J. Biol. Chem. 277, 25465–25473. doi: 10.1074/jbc.M202266200
Eustace, B. K., Sakurai, T., Stewart, J. K., Yimlamai, D., Unger, C., Zehetmeier, C., et al. (2004). Functional proteomic screens reveal an essential extracellular role for hsp90α in cancer cell invasiveness. Nat. Cell Biol. 6, 507–514. doi: 10.1038/ncb1131
Freathy, R. M., Mook-Kanamori, D. O., Sovio, U., Prokopenko, I., Timpson, N. J., Berry, D. J., et al. (2010). Variants in ADCY5 and near CCNL1 are associated with fetal growth and birth weight. Nat. Genet. 42, 430–435. doi: 10.1038/ng.567
Garofalo, R. S. (2002). Genetic analysis of insulin signaling in Drosophila. Trends Endocrinol. Metab. 13, 156–162. doi: 10.1016/S1043-2760(01)00548-3
Géminard, C., Rulifson, E. J., and Léopold, P. (2009). Remote Control of Insulin Secretion by Fat Cells in Drosophila. Cell Metab. 10, 199–207. doi: 10.1016/j.cmet.2009.08.002
Gomez-Pastor, R., Burchfiel, E. T., and Thiele, D. J. (2018). Regulation of heat shock transcription factors and their roles in physiology and disease. Nat. Rev. Mol. Cell Biol. 19, 4–19. doi: 10.1038/nrm.2017.73
Hietakangas, V., and Cohen, S. M. (2009). Regulation of tissue growth through nutrient sensing. Annu. Rev. Genet. 43, 389–410. doi: 10.1146/annurev-genet-102108-134815
Huang, J., and Wang, H. (2018). Hsp83/Hsp90 physically associates with insulin receptor to promote neural stem cell reactivation. Stem Cell Rep. 11, 883–896. doi: 10.1016/j.stemcr.2018.08.014
Ikeya, T., Galic, M., Belawat, P., Nairz, K., and Hafen, E. (2002). Nutrient-dependent expression of insulin-like peptides from neuroendocrine cells in the CNS contributes to growth regulation in Drosophila. Curr. Biol. 12, 1293–1300. doi: 10.1016/S0960-9822(02)01043-6
Killip, L. E., and Grewal, S. S. (2012). DREF is required for cell and organismal growth in Drosophila and functions downstream of the nutrition/TOR pathway. Dev. Biol. 371, 191–202. doi: 10.1016/j.ydbio.2012.08.020
Koyama, T., and Mirth, C. K. (2016). Growth-blocking peptides as nutrition-sensitive signals for insulin secretion and body size regulation. PLoS Biol. 14:e1002392. doi: 10.1371/journal.pbio.1002392
Lauwers, E., Wang, Y. C., Gallardo, R., Van der Kant, R., Michiels, E., Swerts, J., et al. (2018). Hsp90 mediates membrane deformation and exosome release. Mol. Cell 71, 689–702.e9. doi: 10.1016/j.molcel.2018.07.016
Layalle, S., Arquier, N., and Léopold, P. (2008). The TOR pathway couples nutrition and developmental timing in Drosophila. Dev. Cell 15, 568–577. doi: 10.1016/j.devcel.2008.08.003
Li, L., Edgar, B. A., and Grewal, S. S. (2010). Nutritional control of gene expression in Drosophila larvae via TOR, Myc and a novel cis-regulatory element. BMC Cell Biol. 11:7. doi: 10.1186/1471-2121-11-7
Manière, G., Ziegler, A. B., Geillon, F., Featherstone, D. E., and Grosjean, Y. (2016). Direct sensing of nutrients via a LAT1-like transporter in Drosophila insulin-producing cells. Cell Rep. 17, 137–148. doi: 10.1016/j.celrep.2016.08.093
Meschi, E., Léopold, P., and Delanoue, R. (2019). An EGF-responsive neural circuit couples insulin secretion with nutrition in Drosophila. Dev. Cell 48, 76–86.e5. doi: 10.1016/j.devcel.2018.11.029
Miura, G. I., Buglino, J., Alvarado, D., Lemmon, M. A., Resh, M. D., and Treisman, J. E. (2006). Palmitoylation of the EGFR ligand spitz by rasp increases spitz activity by restricting its diffusion. Dev. Cell 10, 167–176. doi: 10.1016/j.devcel.2005.11.017
Okamoto, N., Nishimori, Y., and Nishimura, T. (2012). Conserved role for the Dachshund protein with Drosophila Pax6 homolog eyeless in insulin expression. Proc. Natl. Acad. Sci. U.S.A. 109, 2406–2411. doi: 10.1073/pnas.1116050109
Okamoto, N., and Nishimura, T. (2015). Signaling from glia and cholinergic neurons controls nutrient-dependent production of an insulin-like peptide for Drosophila body growth. Dev. Cell 35, 295–310. doi: 10.1016/j.devcel.2015.10.003
Okamoto, N., and Yamanaka, N. (2015). Nutrition-dependent control of insect development by insulin-like peptides. Curr. Opin. Insect Sci. 11, 21–30. doi: 10.1016/j.cois.2015.08.001
Oldham, S., Montagne, J., Radimerski, T., Thomas, G., and Hafen, E. (2000). Genetic and biochemical characterization of dTOR, the Drosophila homolog of the target of rapamycin. Genes Dev. 14, 2689–2694. doi: 10.1101/gad.845700
Parisi, F., Riccardo, S., Daniel, M., Saqcena, M., Kundu, N., Pession, A., et al. (2011). Drosophila insulin and target of rapamycin (TOR) pathways regulate GSK3 beta activity to control Myc stability and determine Myc expression in vivo. BMC Biol. 9:65. doi: 10.1186/1741-7007-9-65
Ponton, F., Chapuis, M. P., Pernice, M., Sword, G. A., and Simpson, S. J. (2011). Evaluation of potential reference genes for reverse transcription-qPCR studies of physiological responses in Drosophila melanogaster. J. Insect Physiol. 57, 840–850. doi: 10.1016/j.jinsphys.2011.03.014
Pospisilik, J. A., Schramek, D., Schnidar, H., Cronin, S. J. F., Nehme, N. T., Zhang, X., et al. (2010). Drosophila genome-wide obesity screen reveals hedgehog as a determinant of brown versus white adipose cell fate. Cell 140, 148–160. doi: 10.1016/j.cell.2009.12.027
Pratt, W. B., and Toft, D. O. (1997). Steroid receptor interactions with heat shock protein and immunophilin chaperones. Endocr. Rev. 18, 306–360. doi: 10.1210/er.18.3.306
R Core Team (2019). A Language and Environment for Statistical Computing. R Foundation for Statistical Computing. Available online at: http://www.r-project.org/ (accessed December 12, 2019).
Romero-Pozuelo, J., Demetriades, C., Schroeder, P., and Teleman, A. A. (2017). CycD/Cdk4 and discontinuities in Dpp signaling activate TORC1 in the Drosophila wing disc. Dev. Cell 42, 376–387.e5. doi: 10.1016/j.devcel.2017.07.019
Sang, B. Y. J. H. (1956). The quantitative nutritional requirements of Drosophila melanogaster. J. Exp. Biol. 33, 45–72.
Sano, H., Nakamura, A., Texada, M. J., Truman, J. W., Ishimoto, H., Kamikouchi, A., et al. (2015). The nutrient-responsive hormone CCHamide-2 controls growth by regulating insulin-like peptides in the brain of Drosophila melanogaster. PLoS Genet. 11:e1005209. doi: 10.1371/journal.pgen.1005209
Sarov, M., Barz, C., Jambor, H., Hein, M. Y., Schmied, C., Suchold, D., et al. (2016). A genome-wide resource for the analysis of protein localisation in Drosophila. eLife 5:e12068. doi: 10.7554/eLife.12068
Sawarkar, R., Sievers, C., and Paro, R. (2012). Hsp90 globally targets paused RNA polymerase to regulate gene expression in response to environmental stimuli. Cell 149, 807–818. doi: 10.1016/j.cell.2012.02.061
Saxton, R. A., and Sabatini, D. M. (2017). mTOR signaling in growth, metabolism, and disease. Cell 168, 960–976. doi: 10.1016/j.cell.2017.02.004
Schindelin, J., Arganda-Carrera, I., Frise, E., Verena, K., Mark, L., Tobias, P., et al. (2009). Fiji - an Open platform for biological image analysis. Nat. Methods 9, 678–682. doi: 10.1038/nmeth.2019.Fiji
Tariq, M., Nussbaumer, U., Chen, Y., Beisel, C., and Paro, R. (2009). Trithorax requires Hsp90 for maintenance of active chromatin at sites of gene expression. Proc. Natl. Acad. Sci. U.S.A. 106, 1157–1162. doi: 10.1073/pnas.0809669106
Teleman, A. A., Hietakangas, V., Sayadian, A. C., and Cohen, S. M. (2008). Nutritional control of protein biosynthetic capacity by insulin via Myc in Drosophila. Cell Metab. 7, 21–32. doi: 10.1016/j.cmet.2007.11.010
Teng, S. C., Chen, Y. Y., Su, Y. N., Chou, P. C., Chiang, Y. C., Tseng, S. F., et al. (2004). Direct activation of HSP90A transcription by c-Myc contributes to c-Myc-induced transformation. J. Biol. Chem. 279, 14649–14655. doi: 10.1074/jbc.M308842200
Tennessen, J. M., and Thummel, C. S. (2011). Coordinating growth and maturation - Insights from drosophila. Curr. Biol. 21, R750–R757. doi: 10.1016/j.cub.2011.06.033
Trepel, J., Mollapour, M., Giaccone, G., and Neckers, L. (2010). Targeting the dynamic HSP90 complex in cancer. Nat. Rev. Cancer 10, 537–549. doi: 10.1038/nrc2887
Wandinger, S. K., Richter, K., and Buchner, J. (2008). The Hsp90 chaperone machinery. J. Biol. Chem. 283, 18473–18477. doi: 10.1074/jbc.R800007200
Xiaofeng, W., Xiaomin, S., Wei, Z., Yan, F., Hubing, S., Yun, L., et al. (2009). The regulatory mechanism of Hsp90α secretion and its function in tumor malignancy. Proc. Natl. Acad. Sci. U.S.A. 106, 21288–21293. doi: 10.1073/pnas.0908151106
Young, J. C., Moarefi, I., and Ulrich Hartl, F. (2001). Hsp90: a specialized but essential protein-folding tool. J. Cell Biol. 154, 267–273. doi: 10.1083/jcb.200104079
Zhang, H., Stallock, J. P., Ng, J. C., Reinhard, C., and Neufeld, T. P. (2000). Regulation of cellular growth by the Drosophila target of rapamycin dTOR. Genes Dev. 14, 2712–2724. doi: 10.1101/gad.835000
Zhang, Y., Billington, C. J., Pan, D., and Neufeld, T. P. (2006). Drosophila target of rapamycin kinase functions as a multimer. Genetics 172, 355–362. doi: 10.1534/genetics.105.051979
Keywords: heat shock protein 90, fat body, insulin-like peptide, target of rapamycin, Drosophila
Citation: Ohhara Y, Hoshino G, Imahori K, Matsuyuki T and Yamakawa-Kobayashi K (2021) The Nutrient-Responsive Molecular Chaperone Hsp90 Supports Growth and Development in Drosophila. Front. Physiol. 12:690564. doi: 10.3389/fphys.2021.690564
Received: 03 April 2021; Accepted: 27 May 2021;
Published: 22 June 2021.
Edited by:
Kirst King-Jones, University of Alberta, CanadaReviewed by:
Makio Takeda, Kobe University, JapanCopyright © 2021 Ohhara, Hoshino, Imahori, Matsuyuki and Yamakawa-Kobayashi. This is an open-access article distributed under the terms of the Creative Commons Attribution License (CC BY). The use, distribution or reproduction in other forums is permitted, provided the original author(s) and the copyright owner(s) are credited and that the original publication in this journal is cited, in accordance with accepted academic practice. No use, distribution or reproduction is permitted which does not comply with these terms.
*Correspondence: Yuya Ohhara, eS1vaGhhcmFAdS1zaGl6dW9rYS1rZW4uYWMuanA=
Disclaimer: All claims expressed in this article are solely those of the authors and do not necessarily represent those of their affiliated organizations, or those of the publisher, the editors and the reviewers. Any product that may be evaluated in this article or claim that may be made by its manufacturer is not guaranteed or endorsed by the publisher.
Research integrity at Frontiers
Learn more about the work of our research integrity team to safeguard the quality of each article we publish.