 Stefan Möstl1*†
 Stefan Orter2†
 Fabian Hoffmann1,3
 Martin Bachler2
 Bernhard Hametner2
 Siegfried Wassertheurer2
 Jérémy Rabineau4
 Edwin Mulder1Bernd Johannes1
 Jens Jordan1,5
 Jens Tank1
- 1German Aerospace Center (DLR), Institute of Aerospace Medicine, Cologne, Germany
- 2Center for Health and Bioresources, AIT Austrian Institute of Technology, Vienna, Austria
- 3Department of Cardiology, University Hospital Cologne, Cologne, Germany
- 4Laboratory of Physics and Physiology, University of Brussels, Brussels, Belgium
- 5Chair of Aerospace Medicine, University Hospital Cologne, Cologne, Germany
Background: Cardiovascular risk may be increased in astronauts after long term space flights based on biomarkers indicating premature vascular aging. We tested the hypothesis that 60 days of strict 6° head down tilt bed rest (HDTBR), an established space analog, promotes vascular stiffening and that artificial gravity training ameliorates the response.
Methods: We studied 24 healthy participants (8 women, 24–55 years, BMI = 24.3 ± 2.1 kg/m2) before and at the end of 60 days HDTBR. 16 subjects were assigned to daily artificial gravity. We applied echocardiography to measure stroke volume and isovolumetric contraction time (ICT), calculated aortic compliance (stroke volume/aortic pulse pressure), and assessed aortic distensibility by MRI. Furthermore, we measured brachial-femoral pulse wave velocity (bfPWV) and pulse wave arrival times (PAT) in different vascular beds by blood pressure cuffs and photoplethysmography. We corrected PAT for ICT (cPAT).
Results: In the pooled sample, diastolic blood pressure (+8 ± 7 mmHg, p < 0.001), heart rate (+7 ± 9 bpm, p = 0.002) and ICT (+8 ± 13 ms, p = 0.036) increased during HDTBR. Stroke volume decreased by 14 ± 15 ml (p = 0.001). bfPWV, aortic compliance, aortic distensibility and all cPAT remained unchanged. Aortic area tended to increase (p = 0.05). None of the parameters showed significant interaction between HDTBR and artificial gravity training.
Conclusion: 60 days HDTBR, while producing cardiovascular deconditioning and cephalad fluid shifts akin to weightlessness, did not worsen vascular stiffness. Artificial gravity training did not modulate the response.
Introduction
Vascular biomarker studies suggest that the harsh environmental conditions in space including microgravity, galactic cosmic radiation, and perturbed circadian rhythms may promote vascular aging. Premature vascular aging could pose risks for astronauts’ performance and cardiovascular health during missions to the Moon and from there to Mars. Indeed, decreased carotid distensibility (Hughson et al., 2016; Arbeille et al., 2017), increased carotid and femoral intima media thickness (Arbeille et al., 2016), and decreased pulse wave arrival times (PAT) at the finger (Baevsky et al., 2007; Hughson et al., 2016) have been reported following long-term space missions. PAT relates to pulse wave velocity (PWV), an established cardiovascular risk marker (Williams et al., 2018), provided that isovolumetric contraction time (ICT) and vessel length do not change.
Beside aging, physical inactivity during bed rest rapidly evokes blood vessel remodeling (Thijssen et al., 2011). Sixty days head down tilt bed rest (HDTBR), which additionally models cardiovascular deconditioning and cephalad fluid shifts in space, also increased carotid and femoral intima media thickness (van Duijnhoven et al., 2010) and aortic PWV (Fayol et al., 2019). In another 35 days HDTBR study, the same vascular stiffness markers did not change (Palombo et al., 2015). Physical exercise reduced intima media thickening during HDTBR (van Duijnhoven et al., 2010). Artificial gravity through daily short-arm centrifugation, which partially attenuated cardiovascular deconditioning during 21 days HDTBR (Stenger et al., 2012), also holds promise in this regard.
Therefore, we hypothesized that 60 days HDTBR would increase aortic PWV and that artificial gravity would attenuate the response. Moreover, we recorded PAT at different sites to test for regional differences in vascular adaptation. Finally, unlike previous studies, we assessed distensibility and compliance of the aortic arch with magnetic resonance imaging and echocardiography, respectively.
Materials and Methods
Participants
After providing written informed consent, 8 women and 16 men aged between 24 and 55 years (33.4 ± 9.3 years, 24.3 ± 2.1 kg/m2) participated in the Artificial Gravity Bed Rest Study (AGBRESA). AGBRESA was a joint project between the National Aeronautics and Space Administration (NASA), the European Space Agency (ESA), and the German Aerospace Center (DLR). All participants had no history of cardiovascular disease, took no medication, and were non-smokers for at least 6 months prior to enrollment. The study was conducted in accordance with the declaration of Helsinki and was registered at the German Clinical Trials Register under number DRKS00015677. The protocol was approved by the ethics commissions of the Medical Association North Rhine (number 2018143) and NASA (Johnson Space Center, Houston, United States).
Study Design
The overreaching goal of AGBRESA was to assess the efficacy of artificial gravity as countermeasure for physiological adaptations evoked by 60 days strict HDTBR. Strict HDTBR means that no pillows were allowed except for a thin cushion when participants lay on the side, one shoulder always had to touch the mattress, and all daily activities including personal hygiene were done in the −6° position. Including the pre and post bed rest phases, the participants spent 87 days at the Envihab research facility in Cologne, Germany. All participants ingested standardized isocaloric diets with controlled fluid intake and were subjected to regulated bed times. Caffeine or alcohol containing beverages were not allowed. Participants did not exercise at least 24 h before we obtained our recordings. After the 14-day base line data collection (BDC), participants were distributed to three groups subjected to no artificial gravity (control, Ctr), continuous artificial gravity (cAG), or intermittent artificial gravity (iAG) (Figure 1). The bed rest period was followed by 14 days of recovery.
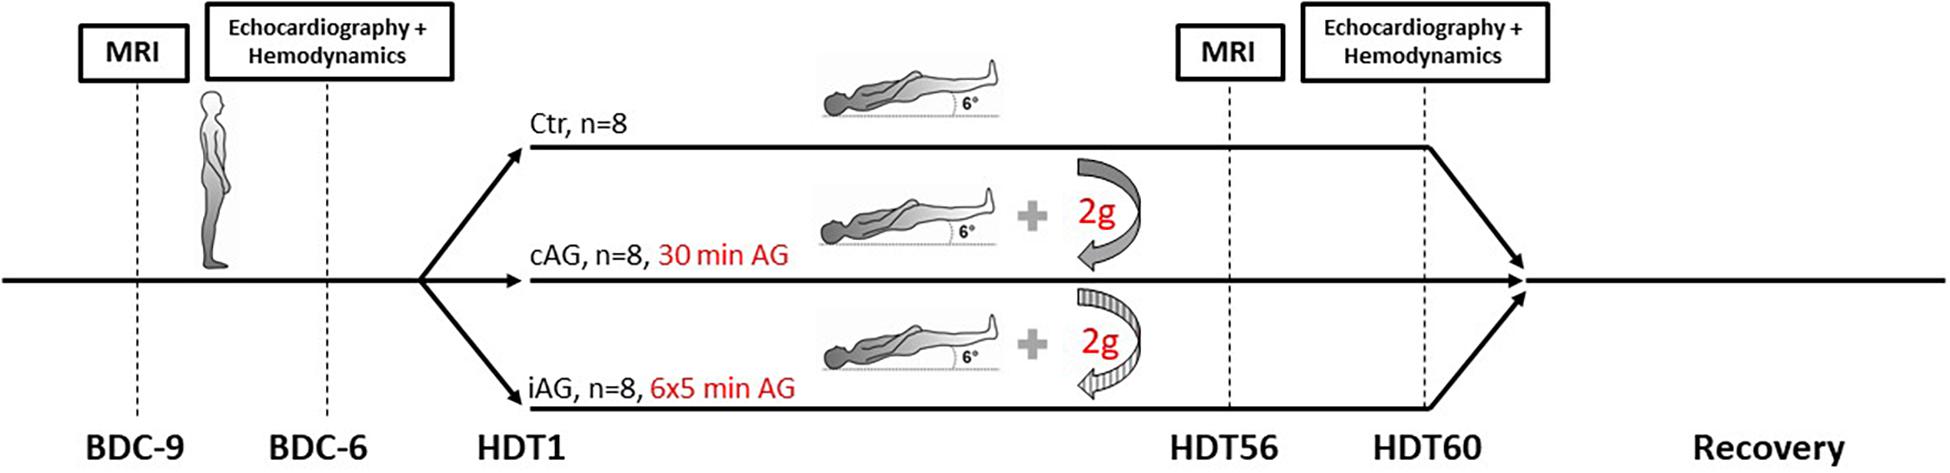
Figure 1. Illustration of the study design. During 14-day baseline data collection (BDC), subjects were ambulatory but supine for measurements. Shortly before the onset of the 60-day head down tilt period (HDT), subjects were assigned to three different intervention groups named control (Ctr, no artificial gravity), continuous artificial gravity (cAG), and intermittent artificial gravity (iAG). We obtained magnetic resonance imaging (MRI) measurements 9 days before (BDC-9), and on the 56th day of HDT (HDT56). We conducted echocardiography and assessed hemodynamics (blood pressure, pulse wave velocity, etc.) on BDC-6 and on HDT60.
Artificial Gravity Countermeasure
Artificial gravity was generated by a short arm centrifuge with participants in the supine position and the head toward the center of rotation. Distance to the center of rotation and angular velocity were adjusted to body height to reach 1 g at the center of body mass, and approximately 2 g at the feet. Daily artificial gravity was applied continuously for 30 min (cAG) or intermittently for 6 × 5 min (iAG) with 3-min breaks in between. Rotation direction was changed daily. A more detailed description of the artificial gravity countermeasure can be found elsewhere (Kramer et al., 2020).
Instrumentation and Experimental Protocol
We obtained recordings 6 days before (BDC-6, PRE) and on the last day of HDTBR (HDT60, HDT) following a complete clinical echocardiographic examination (Vivid-IQ with M5SC-RS sector-probe, GE Healthcare, Buckinghamshire, Great Britain) according to current guidelines (Galderisi et al., 2017). We assessed ICT as the interval between ventricular contraction onset, indicated by the electrocardiogram R-peak, and aortic valve opening, as indicated by flow onset in the left ventricular outflow tract (Figure 2). We calculated stroke volume by multiplying velocity time integral with left ventricular outflow tract area. For the PRE-sessions, participants were in the horizontal supine position. At HDT60, the echocardiography table was tilted to −6° in order to maintain strict HDTBR.
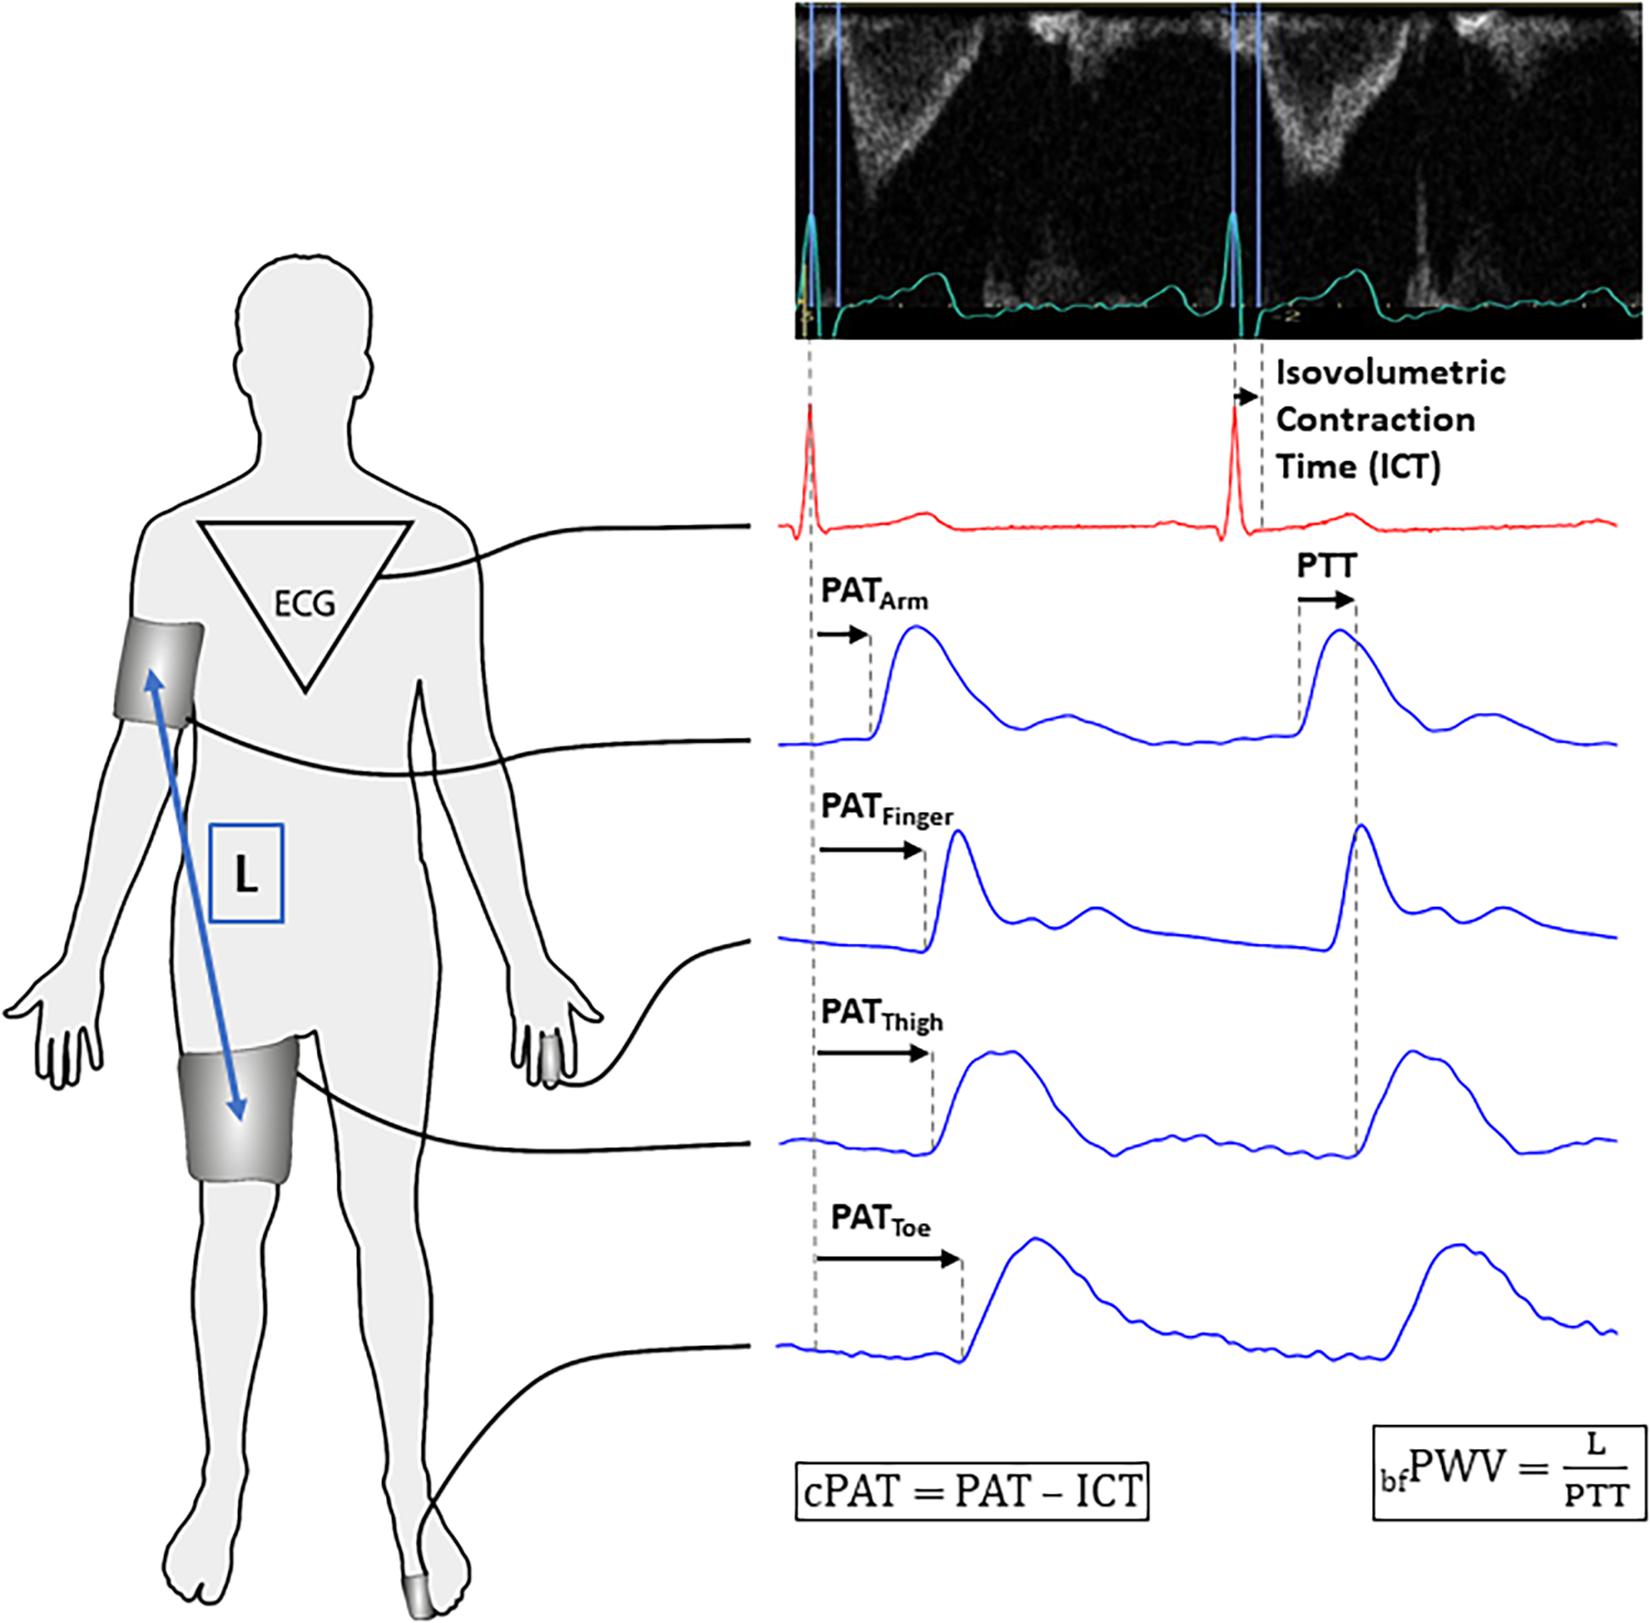
Figure 2. Data acquisition for vascular measurements. Left panel: Recording sites and length (L) determination for brachial-femoral pulse wave velocity (bfPWV) assessment. Right panel – top: ECG and Doppler flow curves in the left ventricular outflow tract. We measured isovolumetric contraction time (ICT) from the R-peak to aortic valve opening indicated by flow onset. Right panel – bottom: Pulse wave arrival time (PAT) is defined as the time from the ECG R-Peak to pulse wave arrival at a certain landmark. By dividing L by pulse transit time (PTT) between arm and thigh cuffs, we obtained bfPWV. We obtained measurements from every heartbeat recorded during a 60-s period. For the sake of clarity, PAT and PTT are shown for two consecutive heart beats. We calculated corrected PAT (cPAT) by subtracting ICT from PAT.
After the echocardiographic examination, we instrumented participants as shown in Figure 2. We placed a finger blood pressure cuff (Finometer MIDI, Finapres Medical Systems, Enschede, Netherlands) around the left ring or middle finger and recorded its raw analog signals at 2000 Hz (BIOPAC MP150, Biopac Systems Inc., Goleta, United States). We also placed blood pressure cuffs at the right upper arm and right thigh. During the PRE-sessions, we measured the distance between these cuffs to exactly reposition them at HDT60 (Figure 2). These cuffs were connected to a research device for non-invasive hemodynamic analysis (CardioCube, AIT Austrian Institute of Technology, Vienna, Austria). Beside the option to simultaneously operate two blood pressure cuffs, the device features a 3-lead-electrocardiogram module and two analog input channels recording signals at 250 Hz. The first channel recorded the pulse curve obtained with a photoplethysmography sensor (Blood Volume Pulse, PLUX wireless biosignals, Arruda dos Vinhos, Portugal) attached to the left long toe. The second channel recorded a trigger signal synchronizing CardioCube with Biopac. After instrumentation, we obtained three oscillometric blood pressure measurements using the upper arm cuff to record heart rate and brachial systolic and diastolic blood pressure (SBP and DBP). The CardioCube also calculated aortic systolic and diastolic blood pressure using the ARCSolver algorithm (Weber et al., 2011). Then, the cuffs were inflated to the previously determined DBP to record pulse curves and electrocardiogram for 1 min (Figure 2).
Signal and Data Analysis
We determined PAT as the time between electrocardiogram R-Peak and pulse wave arrival at the upper arm (PATArm), finger (PATFinger), thigh (PATThigh), and toe (PATToe) (Figure 2). For precise determination of pulse wave upstroke onset, we applied the so-called “diastole-patching method” to find the pairwise maximum cross correlation (implemented with MATLAB 2018, The MathWorks Inc., Natick, United States) (Bachler et al., 2013).
Because PAT could be confounded by ICT, we subtracted ICT from PAT values to obtain corrected measurements cPATArm, cPATFinger, cPATThigh, and cPATToe. As aortic PWV surrogate, we determined brachial-femoral PWV (bfPWV) by dividing the distance between arm and thigh cuffs by pulse transit time between these cuffs (Baier et al., 2018). Cardiac output was calculated by multiplying stroke volume with heart rate. Brachial pulse pressure was calculated by subtracting DBP from SBP. Aortic compliance (AOC) was obtained by dividing stroke volume by aortic pulse pressure (aortic SBP – aortic DBP).
Magnetic Resonance Imaging
We obtained aortic distensibility (AOD) using magnetic resonance imaging at BDC-9 (PRE) and HDT56 (HDT). To measure aortic cross-sectional area changes during one heart cycle, we applied two-dimensional steady-state-free-precession (SSFP) cine imaging (3 Tesla mMR Biograph PET/MRI scanner, Siemens Healthineers, Erlangen, Germany). We also measured brachial blood pressure at the right arm (Expression MR400, Philips Healthcare, Eindhoven, Netherlands) to obtain pulse pressure during the magnetic resonance imaging session. Then, we calculated AOD as relation between cross-sectional area changes of the ascending aorta and brachial pulse pressure (Voges et al., 2012). We also report the end diastolic minimum of the aortic area (AOAmin) since aortic dilation may influence stiffness (Guala et al., 2019).
Statistical Analysis
Linear mixed effects (LME) model (IBM SPSS, Version 21) was used for statistical analysis. Given the strong effect of age on vascular stiffness, we conducted an exploratory analysis by stratifying participants in age tertiles, which resulted in three different age groups: age group 1, 24–27 years, n = 9; age group 2, 29–36 years, n = 8; and age group 3, 37–55, n = 7. Bed rest (PRE vs. HDT) and its interaction with age group, sex, and intervention (Ctr, cAG, and iAG) were defined as fixed effect whereas the subjects were defined as random effects. In case of significant interaction, we identified affected groups using Bonferroni post-hoc correction for the multiple pairwise comparisons of PRE vs. HDT. A p-value < 0.05 indicated statistical significance. Results are reported as measured mean values ± standard deviation. We used Kolmogorov–Smirnov test for checking the distribution of residuals calculated by LME analysis.
Results
Hemodynamic and Vascular Response
Because baseline characteristic and cardiovascular responses did not differ between interventions, we conducted a pooled analysis (Table 1). All results sorted by intervention are provided in Table 2. Over all subjects, SBP remained unchanged after 60 days HDTBR (p = 0.652), whereas DBP increased from 70 ± 7 mmHg to 78 ± 7 (p < 0.001), such that pulse pressure decreased by 9 ± 9 mmHg (p < 0.001). On the fourth day of recovery, DBP had returned to baseline values at 70 ± 6 mmHg. To verify these findings, we also analyzed safety blood pressure measurements at PRE and HDT59 obtained through an oscillometric device (IntelliVue X2, Philips Healthcare, Eindhoven, The Netherlands). These measurements were obtained in duplicate immediately after awakening. At HDT59, DBP was increased by 7 ± 7 mmHg (p < 0.001). Aortic blood pressure followed brachial blood pressure with an unchanged aortic SBP (p = 0.935) and an increased aortic DBP (9 ± 7 mmHg, p < 0.001). A 14 ± 15 ml (p = 0.001) stroke volume reduction was partly compensated by a heart rate increase (7 ± 9 bpm, p = 0.002) such that cardiac output remained stable (5.9 ± 0.9 vs. 5.6 ± 1.1 l/min, p = 0.265). AOC remained unchanged following HDTBR (p = 0.094). While AOAmin tended to increase at the end of HDTBR (Table 1), we observed no changes in AOD (p = 0.364).
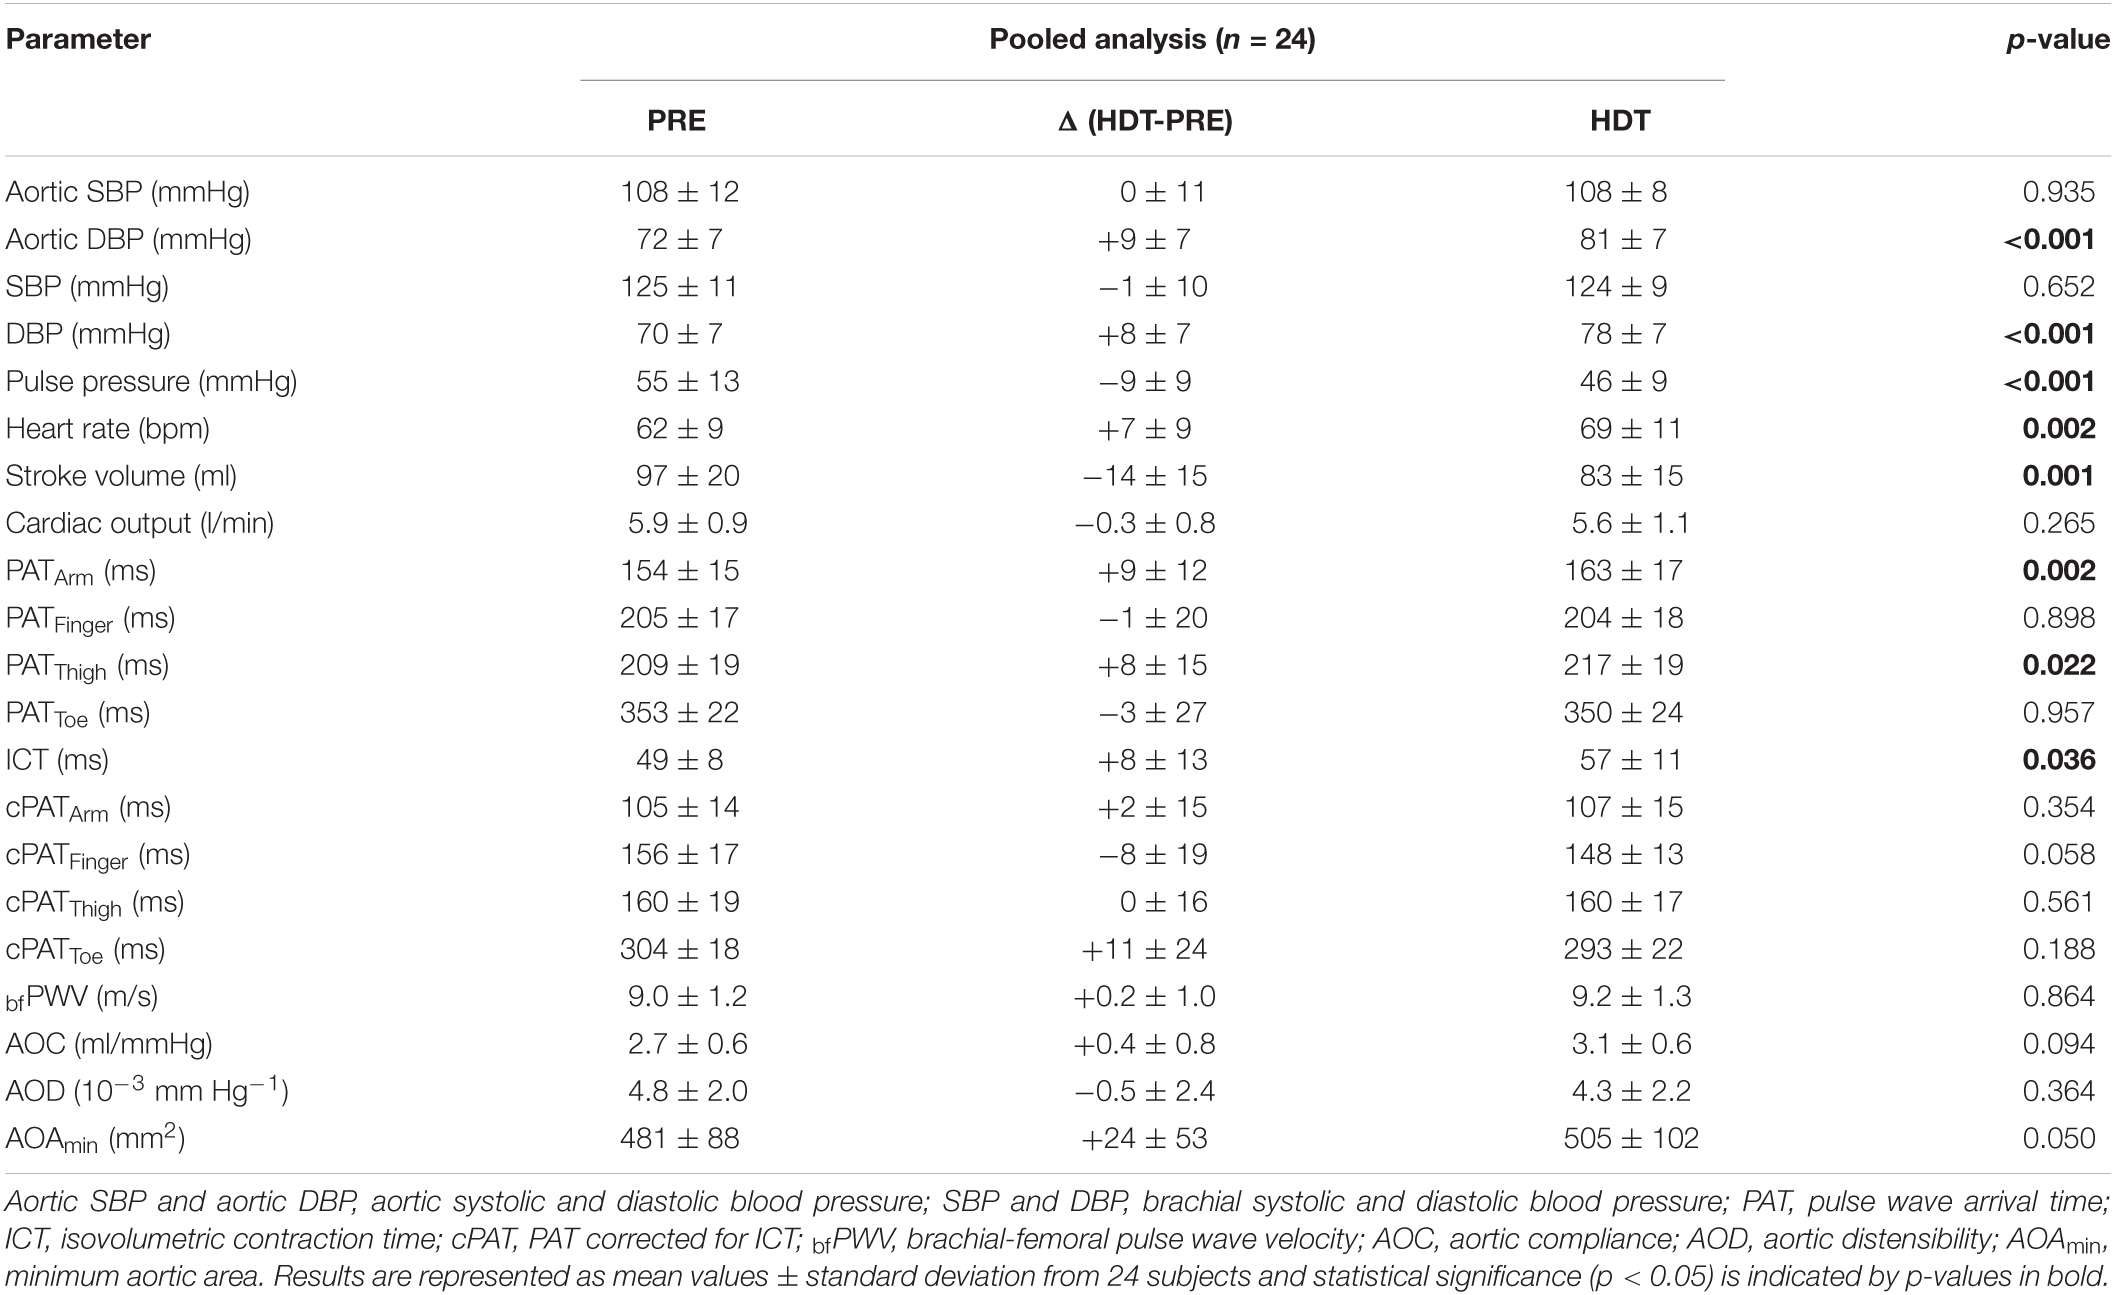
Table 1. All recorded parameters sorted by recordings before (PRE) and at the end of head down tilt bed rest (HDT).
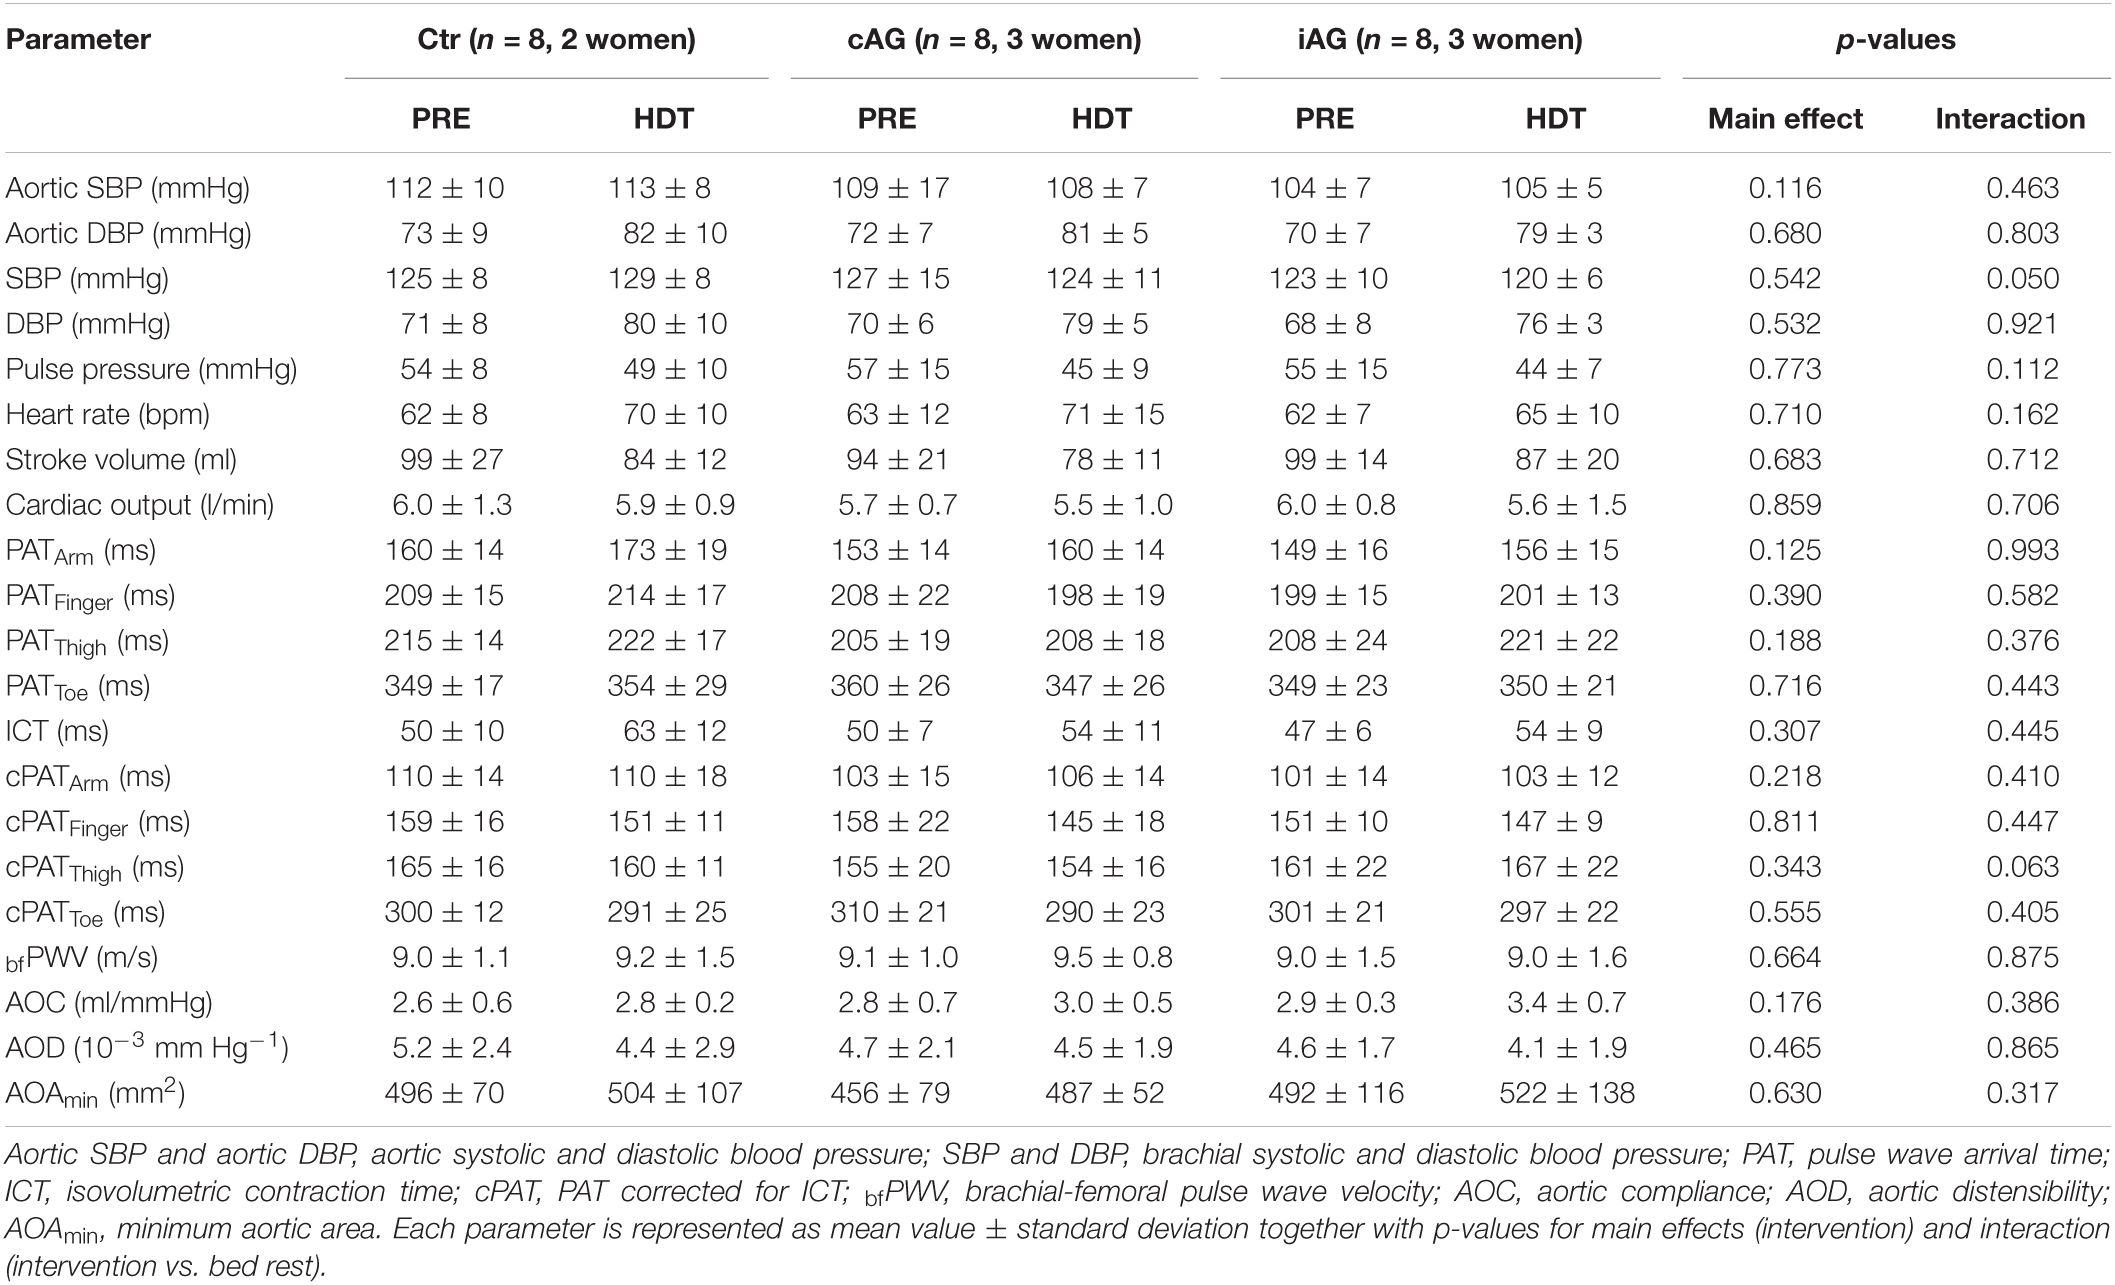
Table 2. All parameters recorded before (PRE) and at the end of head down tilt bed rest (HDT), sorted by intervention: control (Ctr), continuous artificial gravity (cAG) and intermittent artificial gravity (iAG).
Pulse Wave Velocity and Arrival Times
Averaged over all subjects, bfPWV remained unchanged between PRE and HDT (p = 0.864, Figure 3). In contrast, the uncorrected arrival times at brachial and femoral artery, which include the ICT, increased by 9 ± 13 ms (PATArm, p = 0.002) and 8 ± 15 ms (PATThigh, p = 0.022), respectively. PATFinger and PATToe remained unchanged (p = 0.898 and 0.957). However, ICT increased by 8 ± 13 ms (p = 0.036) after 60 days in HDTBR and the corrected PAT values (see Figure 4) for the femoral and brachial artery (cPATThigh and cPATArm) were unaffected by HDTBR. In contrast, cPATFinger and cPATToe tended to decrease by 8 ± 5 and 11 ± 13 ms, without reaching significance after correction for the increased ICT (see Table 1).
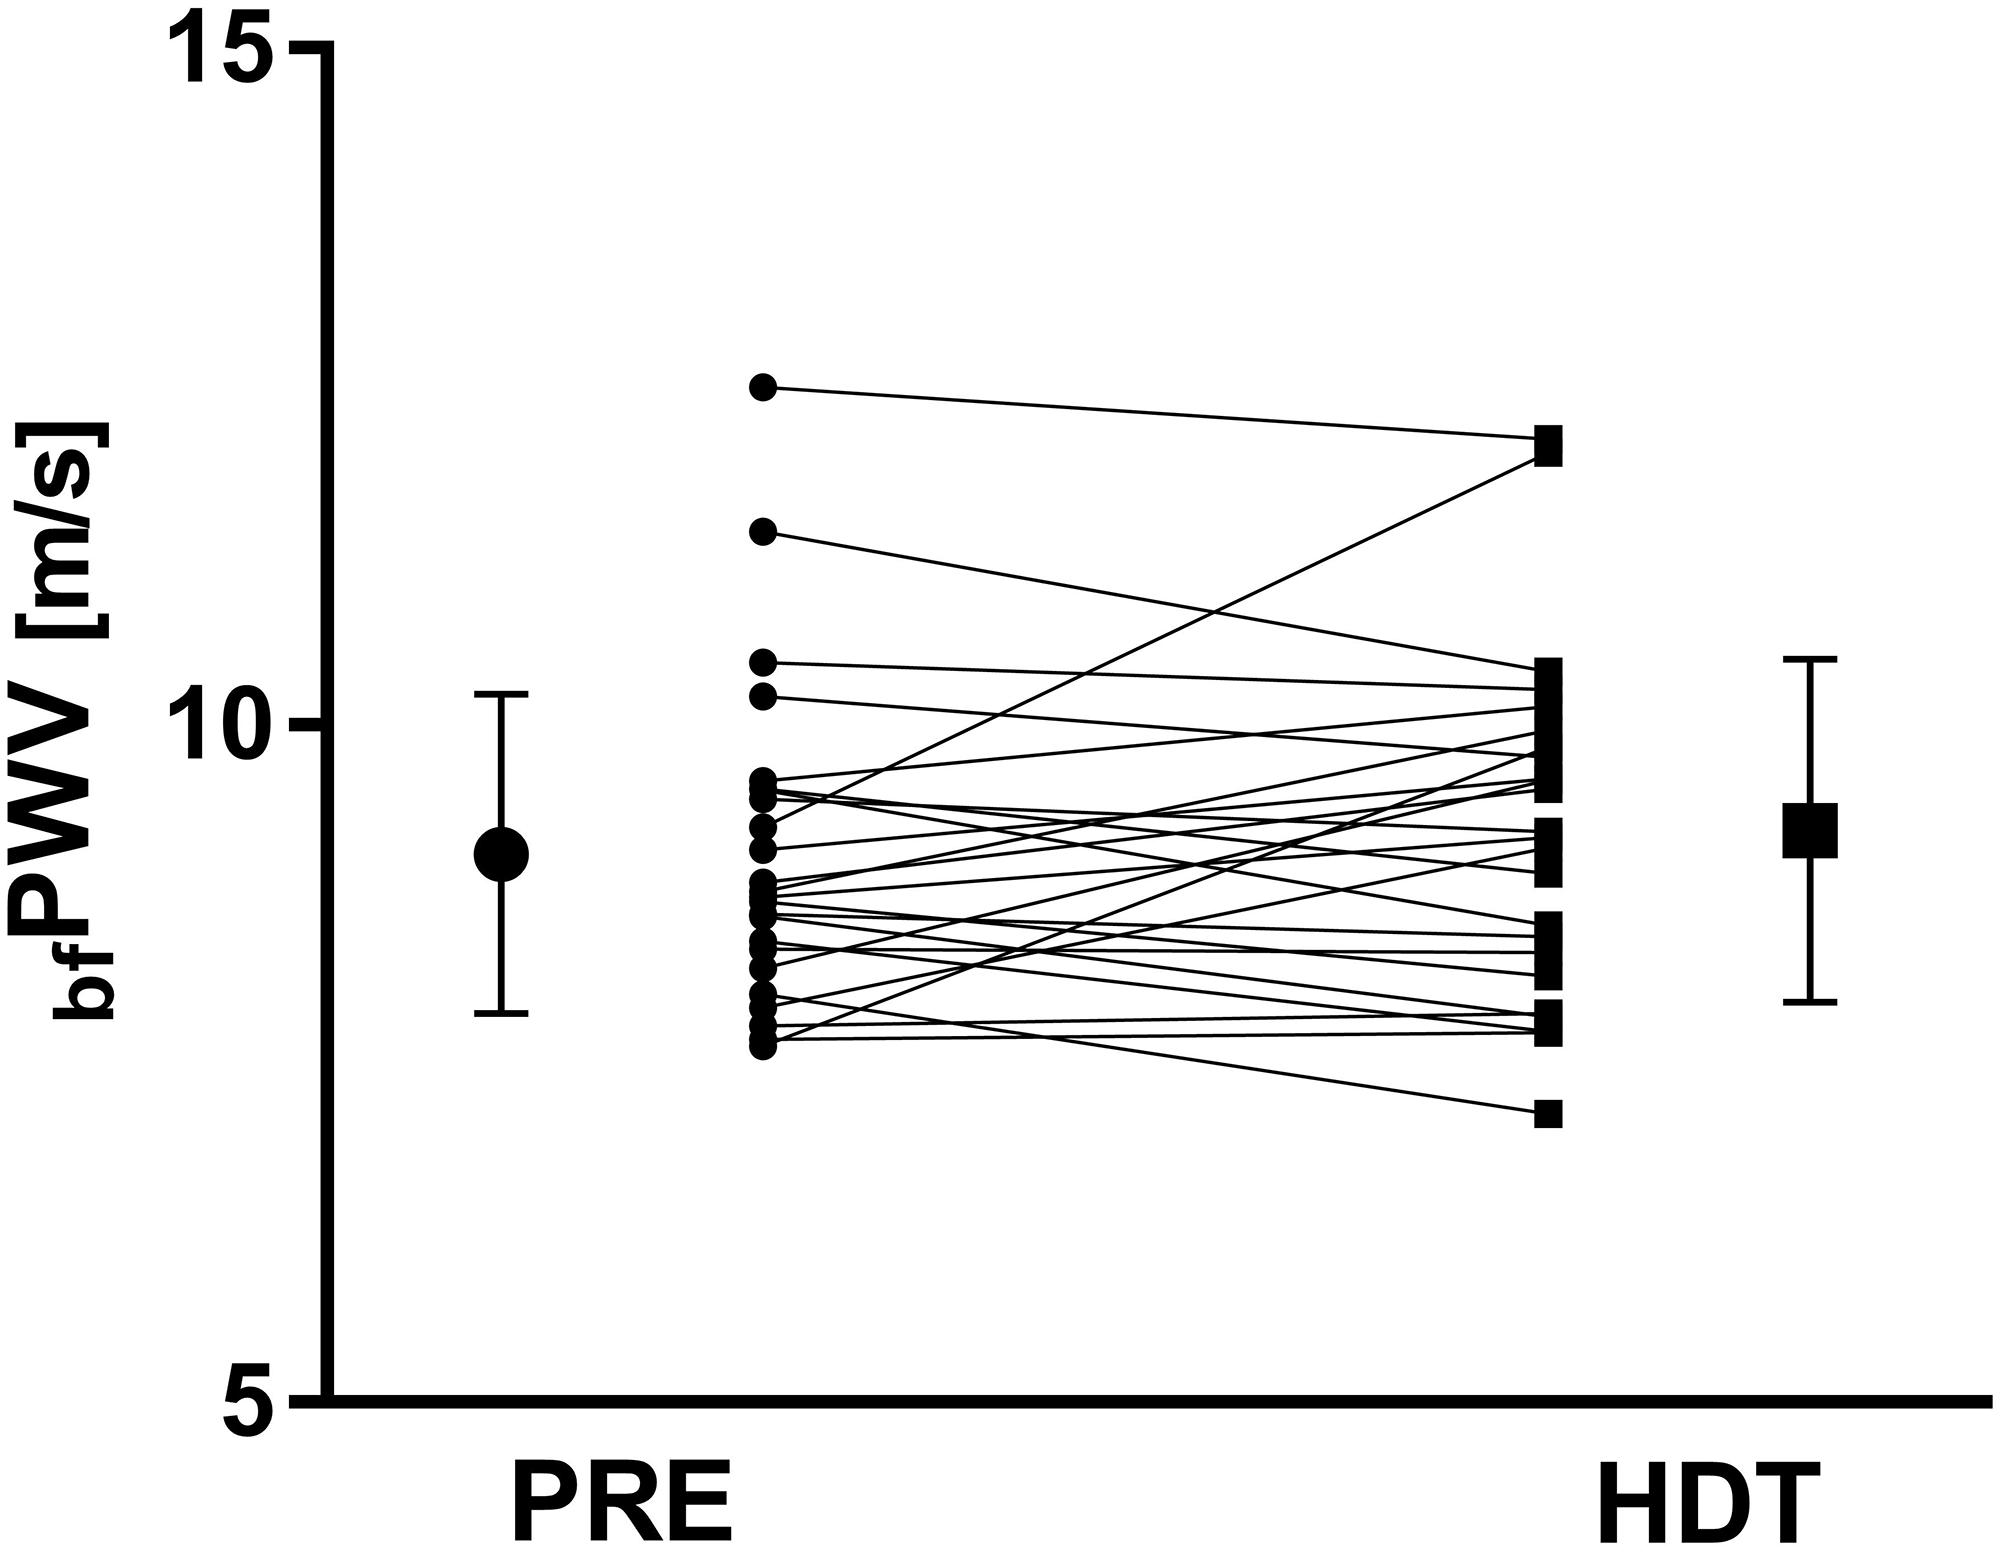
Figure 3. Line graph for individual brachial-femoral pulse wave velocities (bfPWV) 6 days before (PRE, dot symbol) and after 60 days HDTBR (HDT, square symbol). Scaled-up single symbols to the left and right represent corresponding mean values and error bars indicate the first standard deviation. bfPWV did not change with 60 days HDTBR (9.0 ± 1.2 vs. 9.2 ± 1.3 m/s, p = 0.864).
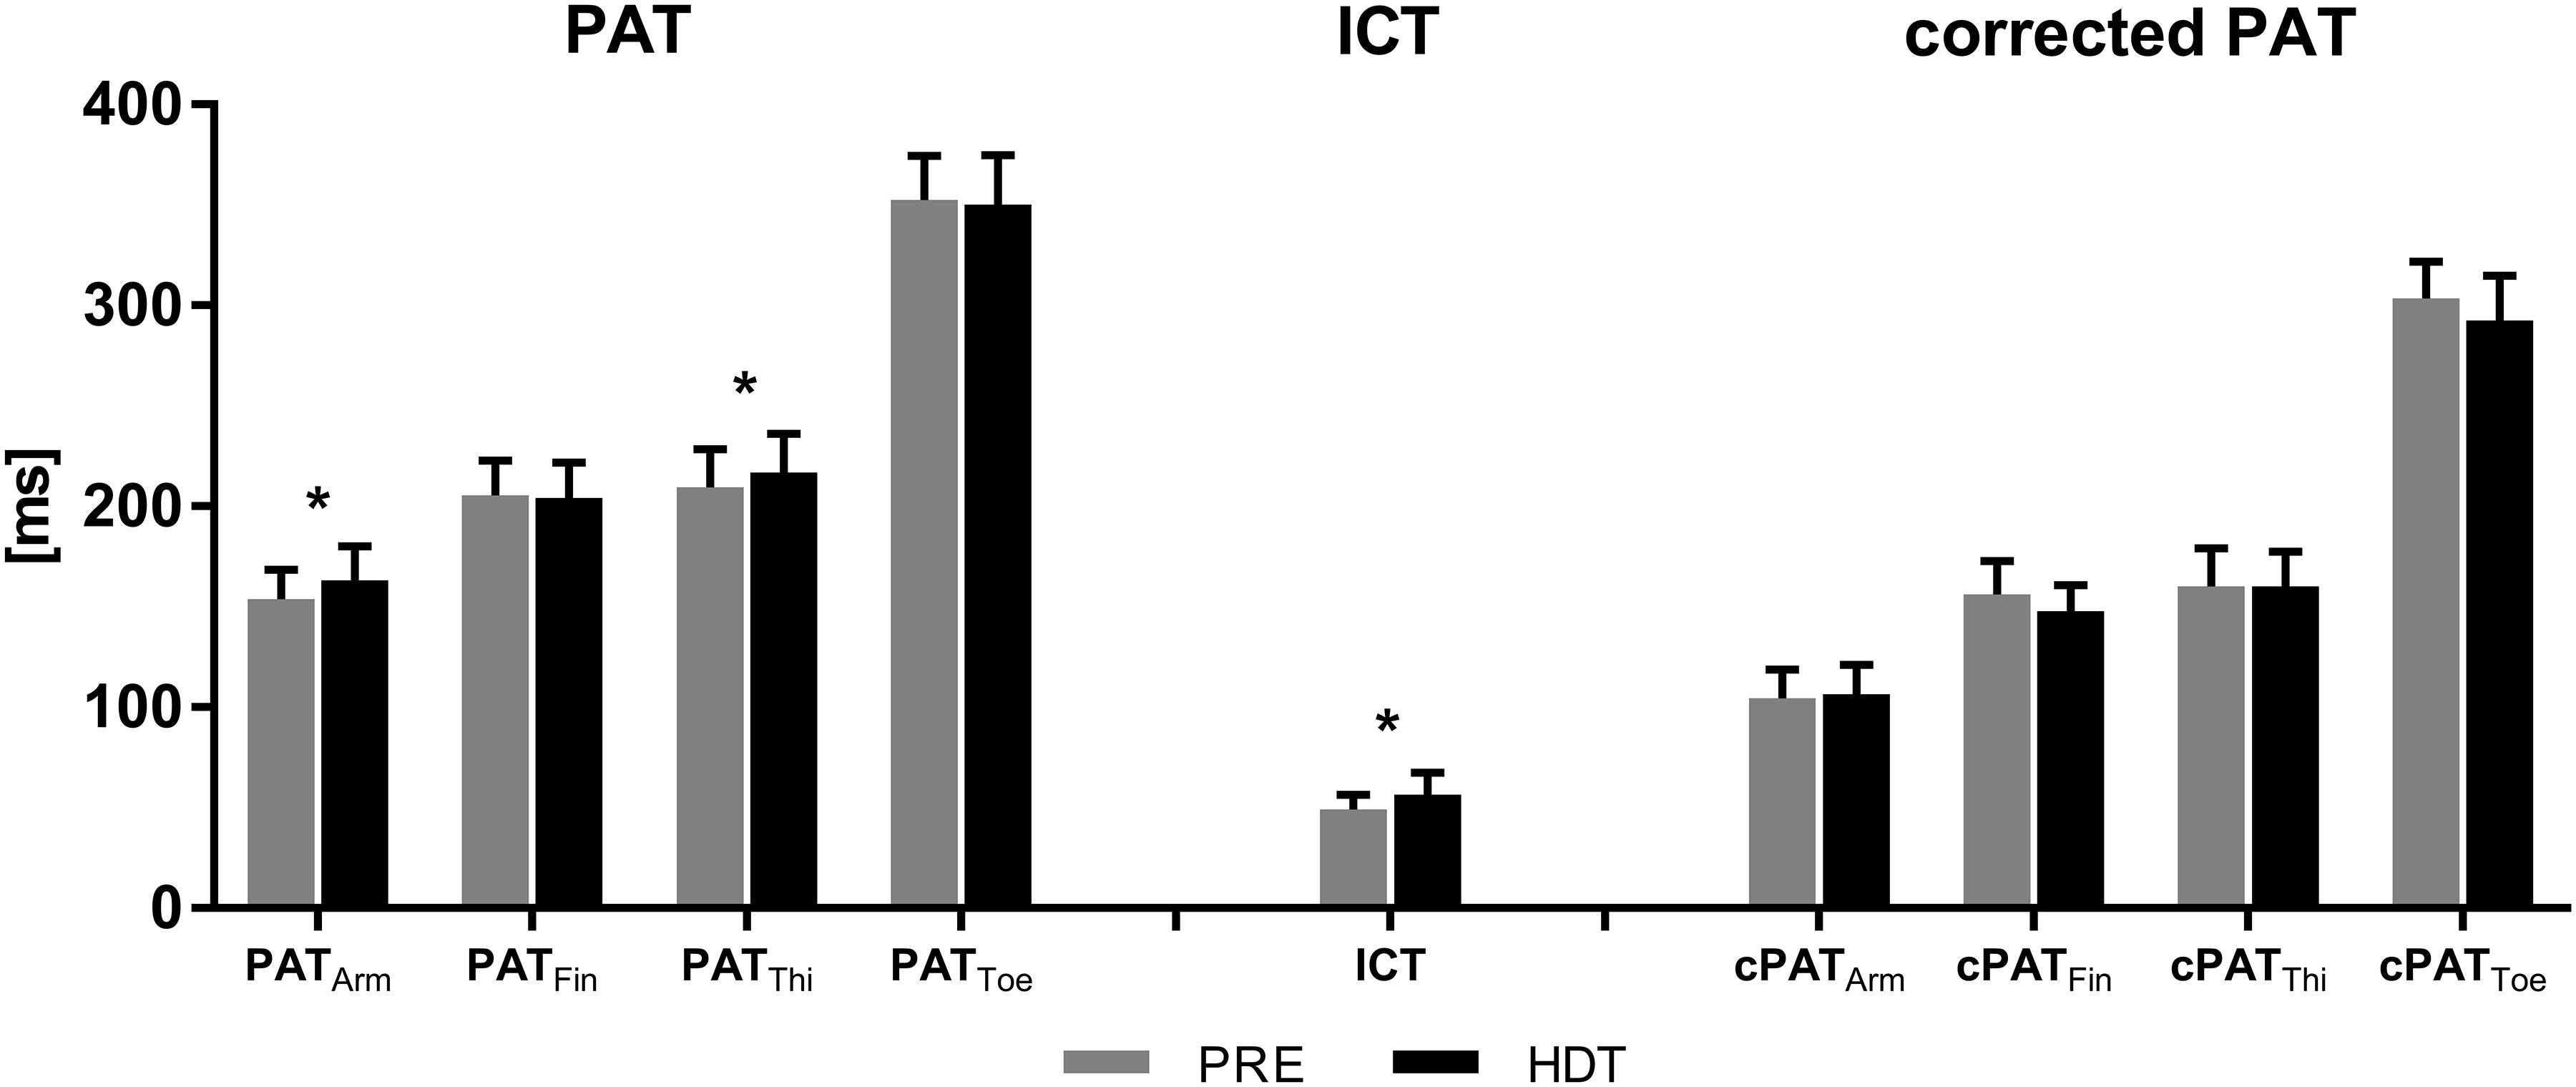
Figure 4. Pulse wave arrival times (PAT) increase with greater topological distance from the heart to arm, finger, thigh, and toe, all indicated by subscripted acronyms. PATArm and PATThigh significantly increased after 60 days HDTBR (black bars) compared to baseline recordings 6 days before HDTBR (gray bars). Isovolumetric contraction time (ICT) also increased with HDTBR. Corrected PAT did not change with HDTBR. Results are represented as mean values from 24 subjects with error bars indicating the first standard deviation; * < 0.05.
Potential Age and Sex Influences
In general, AOAmin and bfPWV increased from the youngest to the oldest tertile (p = 0.013 and p = 0.027). For some of the measurements, we observed a significant interaction between age and HDTBR. These results are listed in Table 3 and an exemplary selection is displayed in Figure 5. We did not observe a qualitative difference in the response to HDTBR between women and men (Table 4).
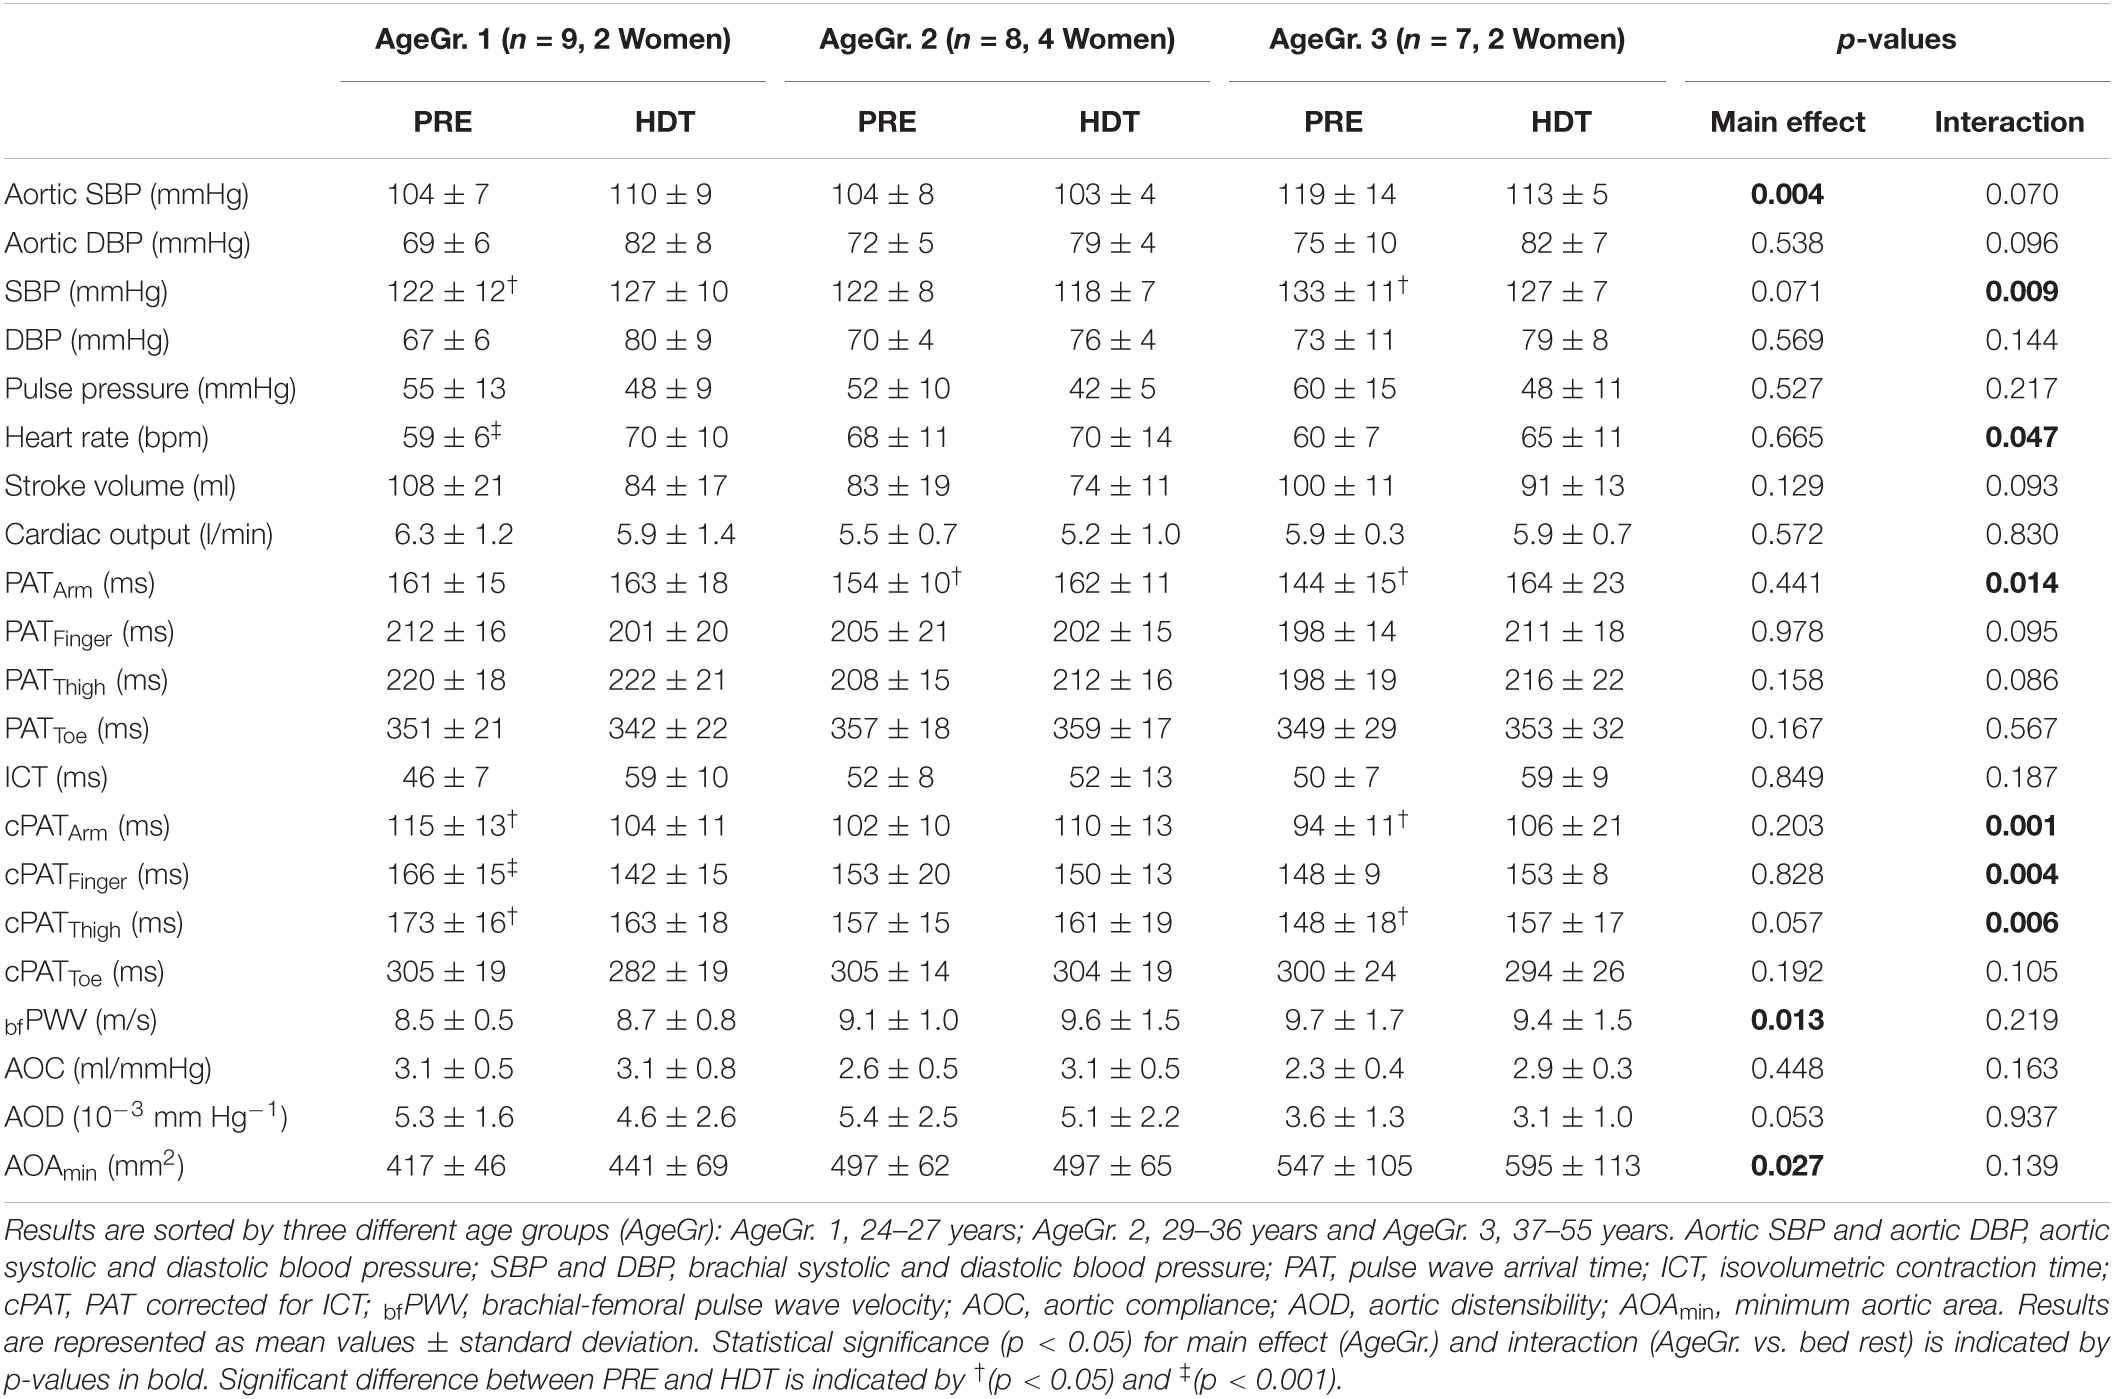
Table 3. All parameters recorded before (PRE) and at the end of head down tilt bed rest (HDT).
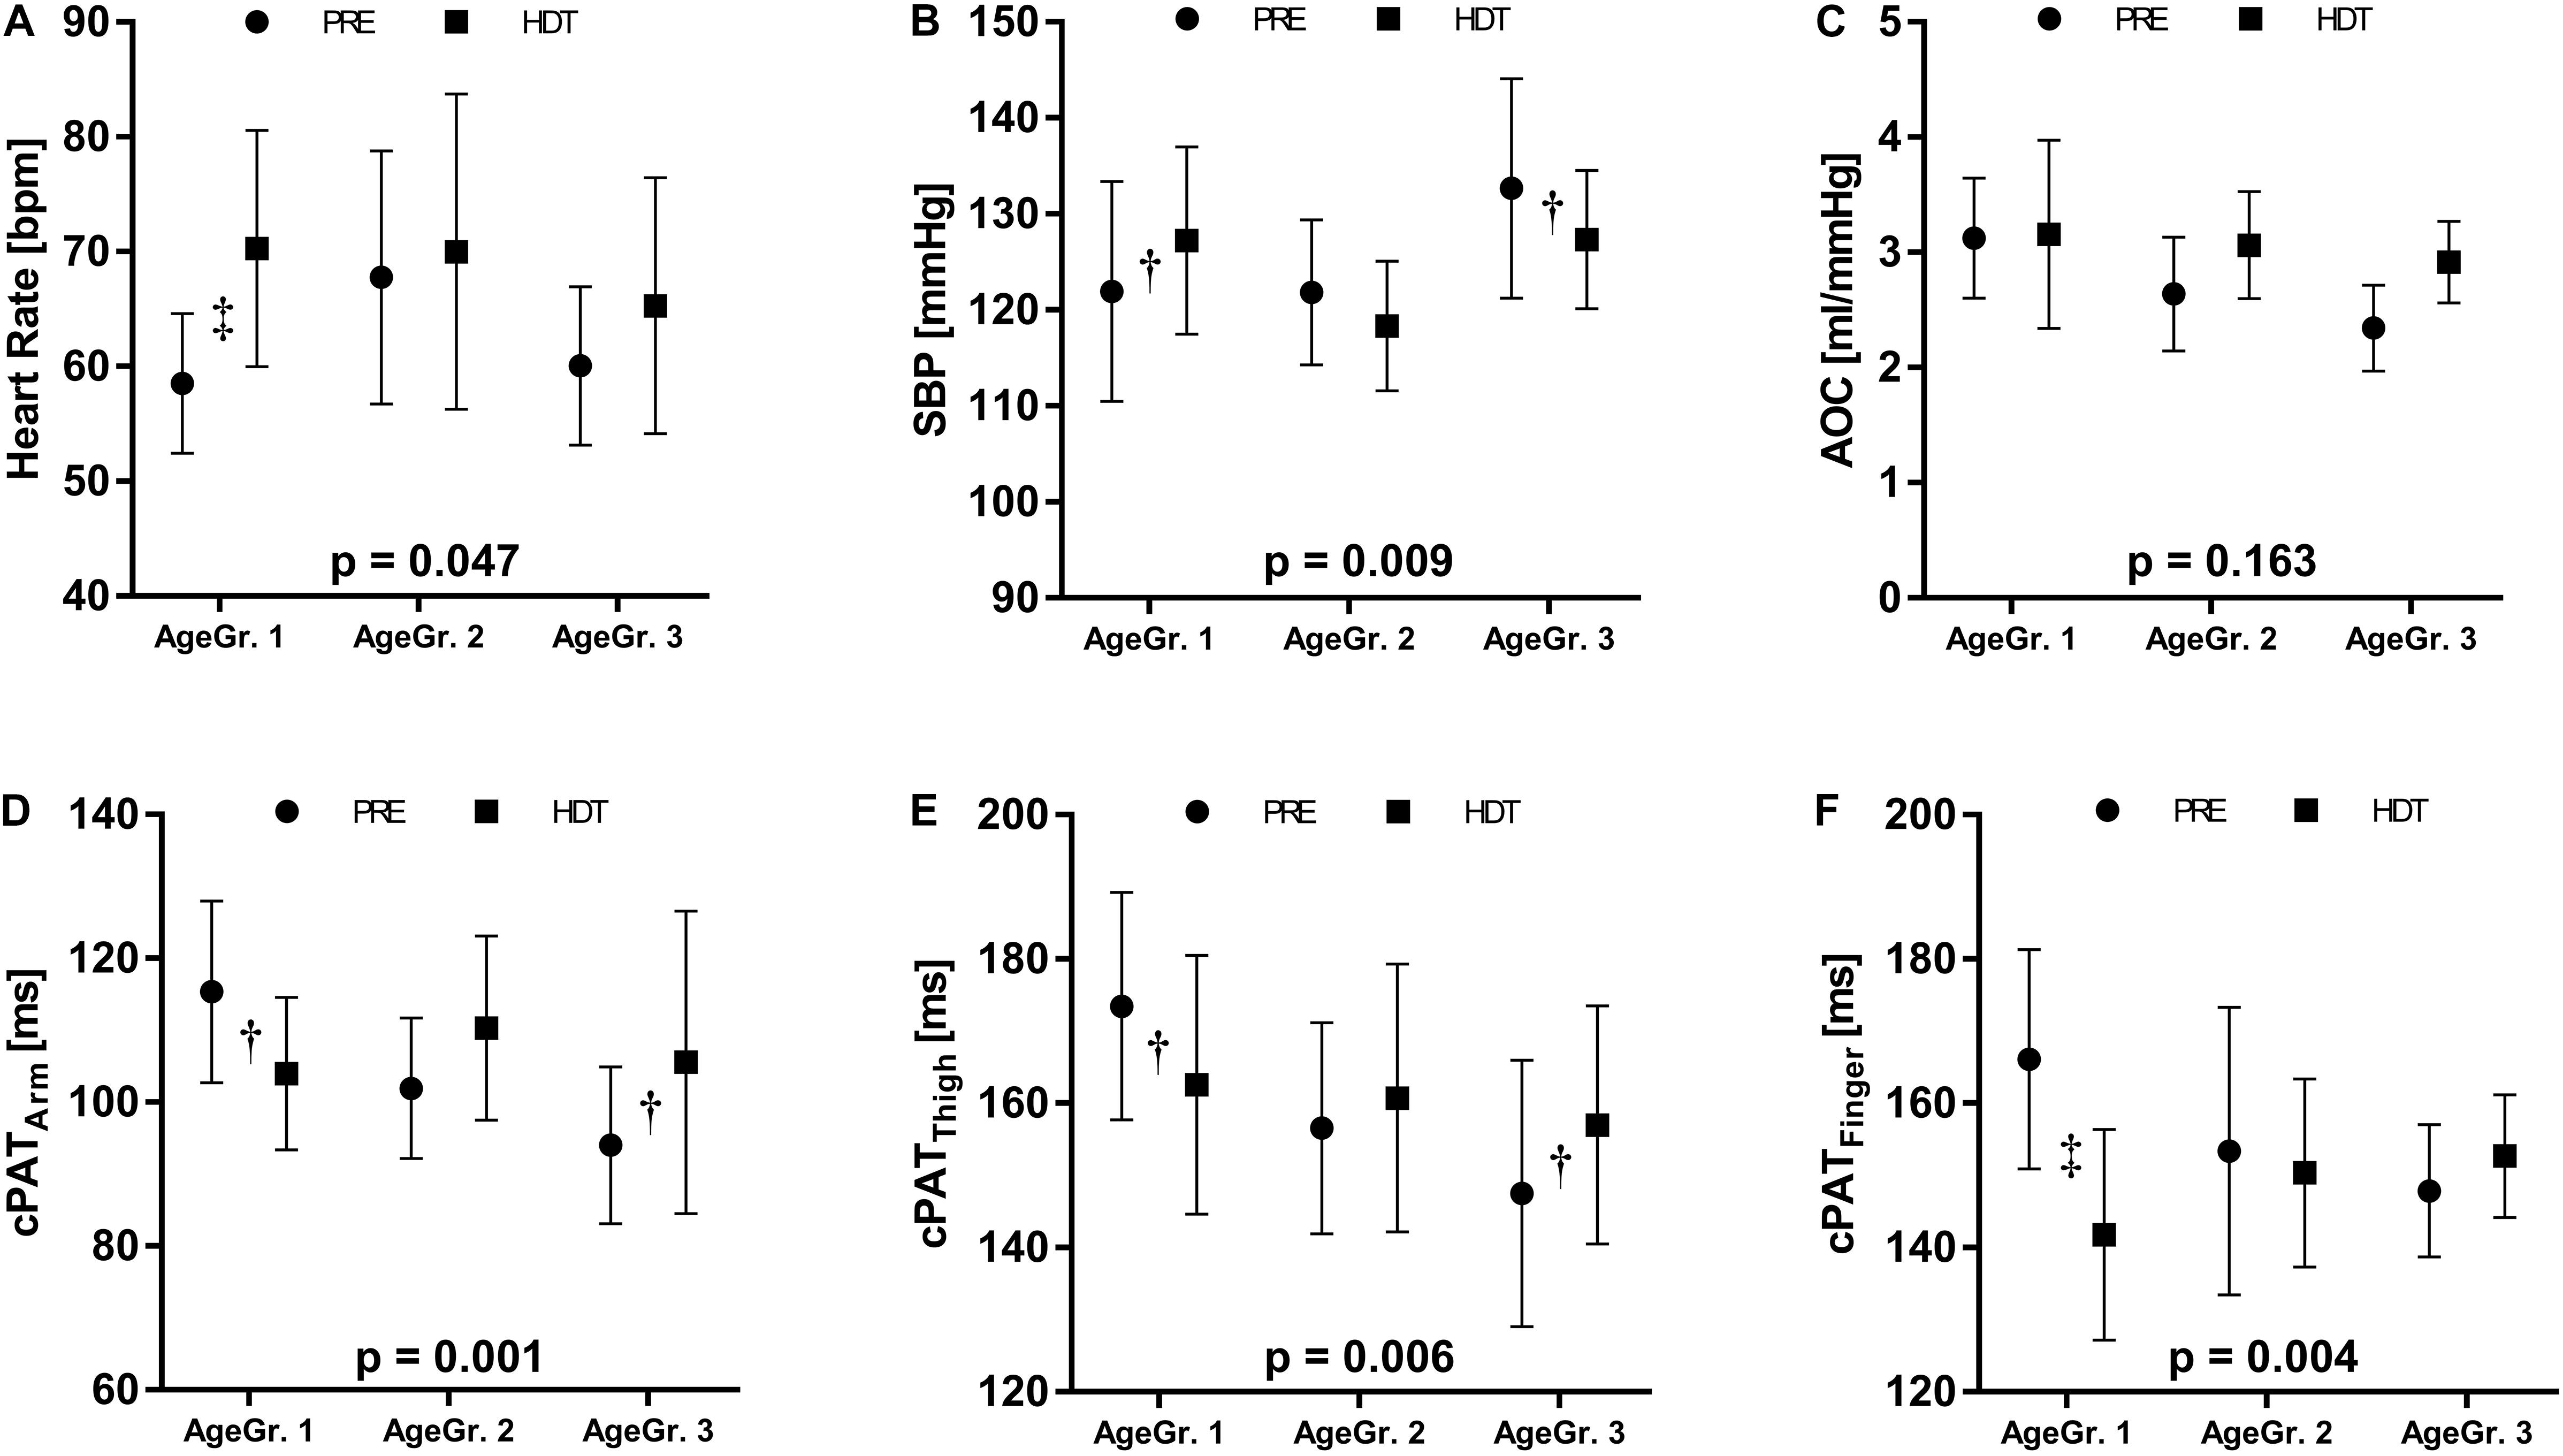
Figure 5. Exploratory analysis relating the HDTBR response to age. We stratified participants in three age groups (AgeGr.): AgeGr. 1 = 24–27 years; AgeGr. 2 = 29–36 years, and AgeGr. 3 = 37–55 years. (A) heart rate, (B) systolic blood pressure (SBP), (C) aortic compliance (AOC), and corrected pulse wave arrival times to the (D) arm (cPATArm), (E) thigh (cPATThigh), and (F) finger (cPATFinger). The p-values indicate the interaction between AgeGr. and bed rest. Results are represented as mean values ± standard deviation from base line recordings (PRE, dot symbol) and HDT (square symbol). Significant difference between these time points is indicated by †(p < 0.05) and ‡(p < 0.001).
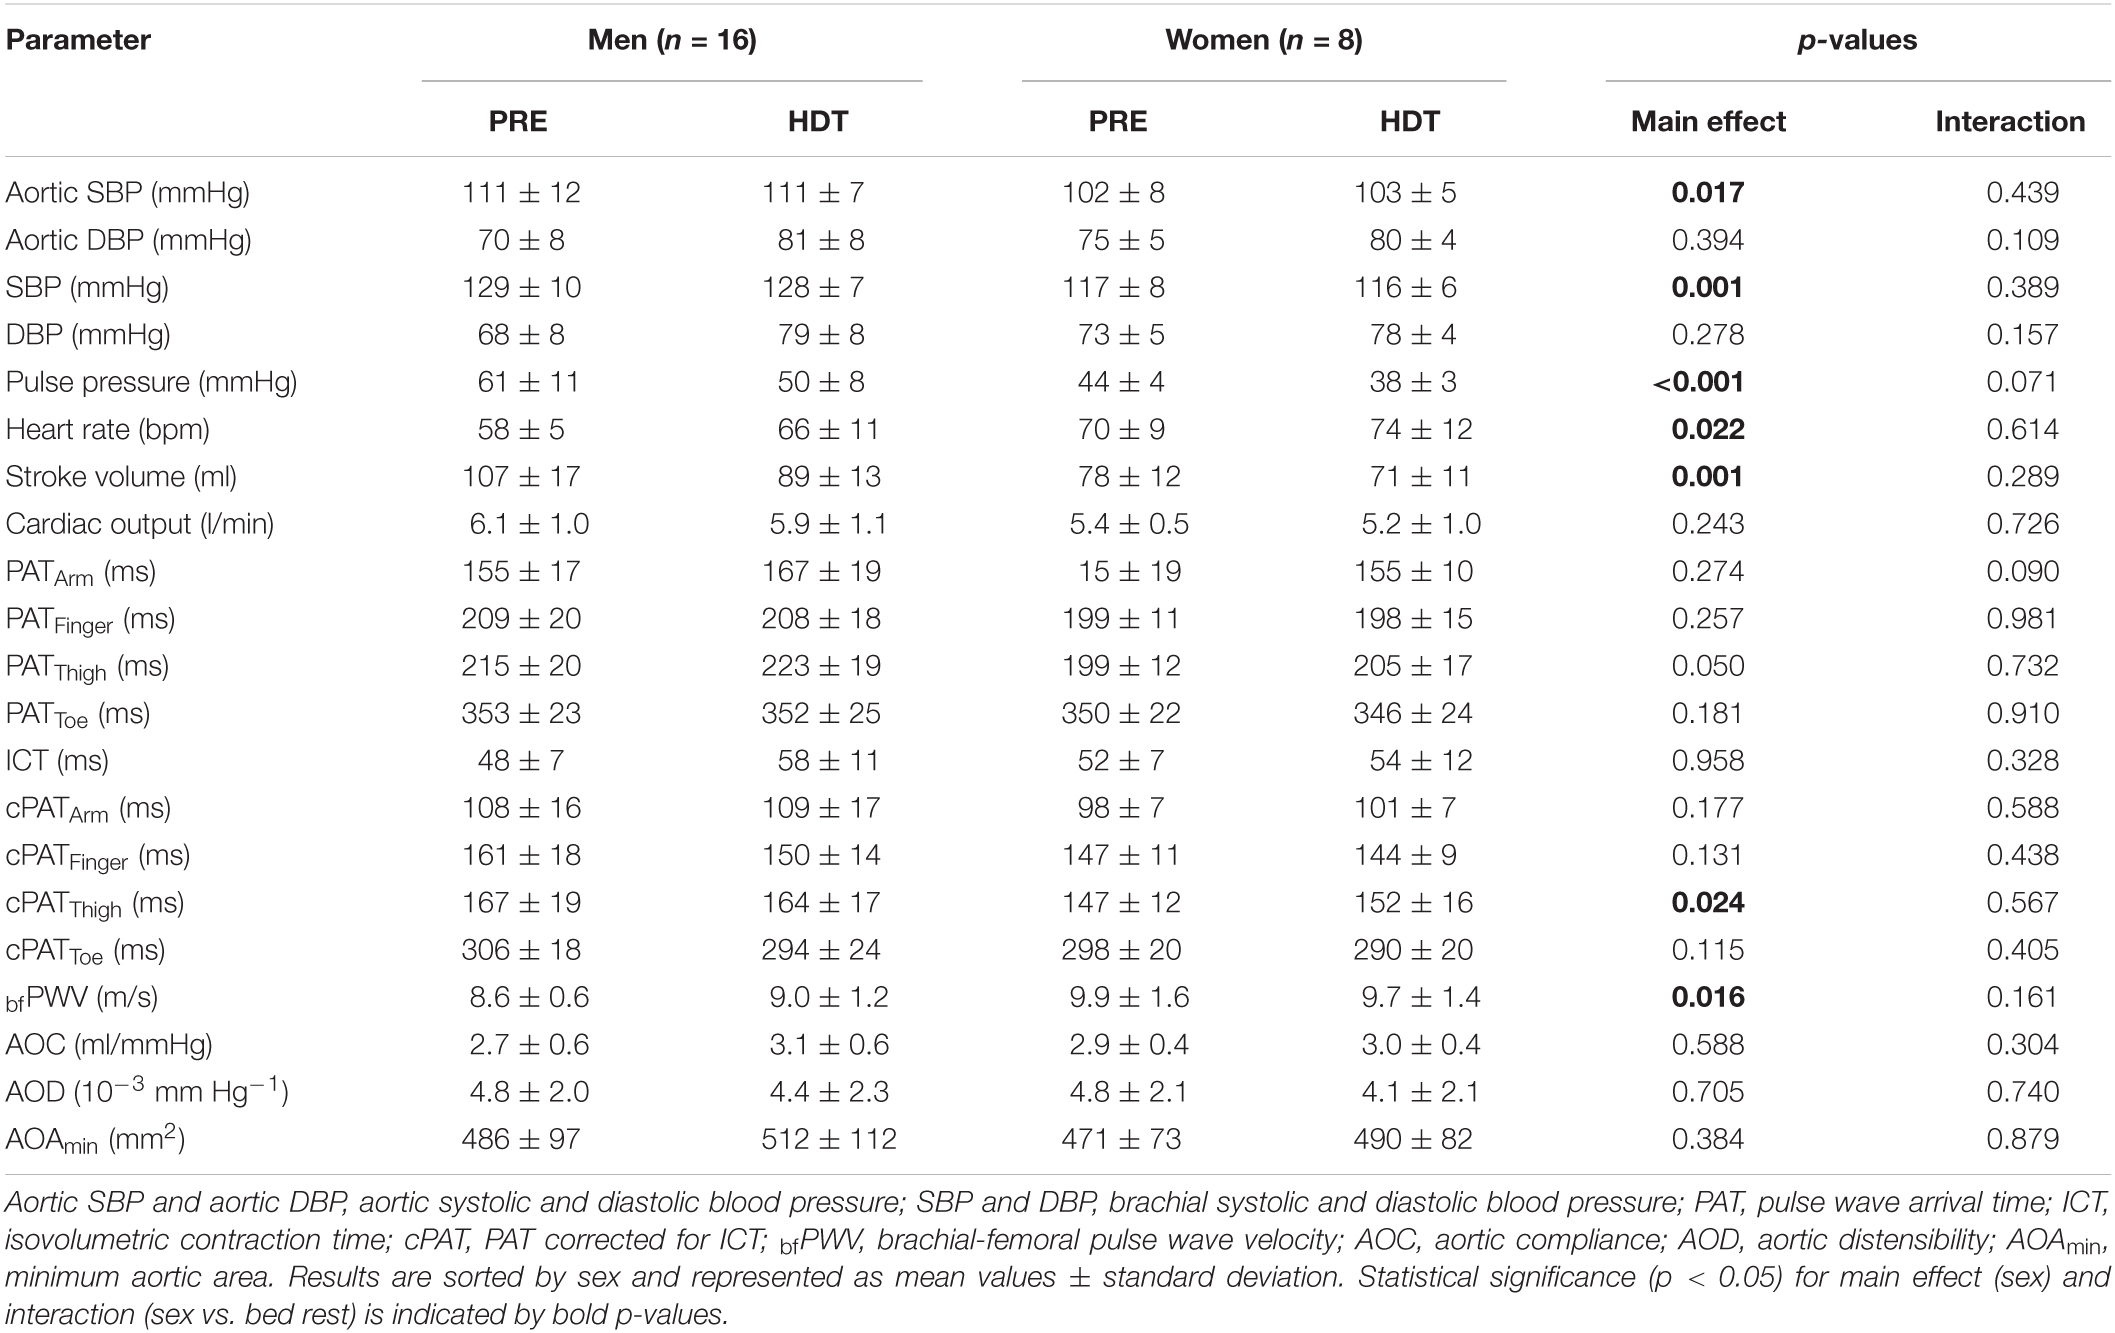
Table 4. All parameters recorded before (PRE) and at the end of head down tilt bed rest (HDT).
Discussion
The important finding of our study is that 60 days strict HDTBR did not produce clinically relevant changes in bfPWV or cPAT in healthy persons. In fact, bfPWV and cPAT at different vascular beds were almost identical before and after HDTBR. However, we observed an unexpected albeit modest transient increase in aortic area following strict HDTBR, which has not been previously described.
Strict HDTBR models some aspects of space travel, particularly cardiovascular deconditioning and cephalad fluid shifts. Both responses could affect vascular aging biomarkers including PAT, PWV, or AOD. The increase in heart rate with reductions in pulse pressure and stroke volume in our study is consistent with cardiovascular deconditioning. Similar stroke volume reductions indicating cardiac deconditioning and atrophy during HDTBR have been previously described (Levine et al., 1997; Iwasaki et al., 2000; Perhonen et al., 2001; Stenger et al., 2012; Palombo et al., 2015). HDTBR also reduces cardiopulmonary fitness (Saltin et al., 1968; Wagner, 2015) and orthostatic tolerance (Guinet et al., 2009). Strict HDTBR results in significant cephalad fluid shifts indicated by retinal papillary edema (Laurie et al., 2019) and mastoid effusions (Lecheler et al., 2021). Similar changes have been reported in astronauts returning from longer duration space missions (Inglesby et al., 2020).
An increase in heart rate is commonly associated with decreased pre-ejection period, the interval between electrocardiogram Q-wave and aortic valve opening (Weissler et al., 1968). If so, uncorrected PAT could overestimate vascular stiffness. In contrast, we observed concomitant increases in HR and ICT following strict HDTBR. The phenomenon has been previously observed with HDTBR (Hodges et al., 2010) and may result from an increased cardiac afterload (Hassan and Turner, 1983), as indicated by the observed increase in aortic DBP. Thus, uncorrected PATArm and PATThigh underestimated aortic stiffness in our study whereas corresponding cPAT remained unchanged. Furthermore, bfPWV, which is an ICT independent aortic stiffness parameter, also remained unchanged. However, most PWV measurements have the potential disadvantage of being blind to vascular stiffness changes in the aortic arch (Mitchell, 2009). Yet, AOD of the ascending aorta, which is an accepted vascular stiffness marker (Redheuil et al., 2010; Dogui et al., 2011; Voges et al., 2012), was also unchanged following HDTBR. We observed a trend for aortic area to increase with HDTBR likely indicating increased vascular filling. The observation that aortic area had almost returned to baseline after fourth day recovery is consistent with changes in vascular filling rather than remodeling. Increased vascular filling tends to increase vascular stiffness measurements (Guala et al., 2019). It is, therefore, unlikely that PWV changes were masked by altered vascular loading.
The finding that PWV does not change despite 60 days bed rest deconditioning is somewhat counterintuitive because physical inactivity is associated with increased arterial stiffness (Thijssen et al., 2011), whereas mild physical exercise appears to ameliorate aortic PWV (Havlik et al., 2005). In one previous HDTBR study, which has only been published as abstract, carotid-femoral PWV increased in every participant (Fayol et al., 2019). In another study, carotid-femoral PWV was 6.9 m/s before and 6.9 m/s after 35 days HDTBR (Palombo et al., 2015). Overall, HDTBR for up to 60 days may not elicit a consistent, clinically relevant change in PWV. Among others, changes in the collagen-to-elastin ratio, collagen crosslinks (Schellinger et al., 2019), and changes in the expression of endothelial and inducible nitric oxide synthases (Cau et al., 2012) have been implicated in vascular aging. Possibly, HDTBR alone is not sufficient to drive vascular (aortic) aging in the absence of additional risk factors. Age, which affects metabolic and muscular adaptation to bed rest (Pišot et al., 2016), is a prime suspect. In contrast to our expectation, an exploratory analysis did not provide evidence that older age exacerbates aortic stiffening during HDTBR. In fact, we observed the opposite response. Another potential explanation is that aortic remodeling sufficient to cause consistently measurable PWV changes in a smaller scale study requires more than 60 days HDTBR.
An important limitation of our study is the relatively small number of participants in each intervention group limiting the statistical power to detect potential protective actions of artificial gravity. At this point we would like to point out that we had no influence onto the overall study design. Since vascular stiffness biomarkers did not deteriorate with HDTBR, artificial gravity cannot improve the outcome. Another potential limitation is that, while covering a relatively large age range, the study is too small for a detailed analysis relating HDTBR responses to age. The same is true for a sex-specific analysis. It is reassuring that we did not observe an obvious qualitative difference in the HDTBR response between women and men. Another potential limitation of the study is that we did not assess the intima media thickness of different arteries. We also did not measure pulse wave arrival time to carotid artery or its therefrom derived carotid-femoral PWV, which is considered to be the non-invasive gold standard.
Despite these limitations we suggest that 60 days HDTBR, while producing cardiovascular deconditioning and cephalad fluid shifts, do not elicit clinically relevant changes in vascular stiffness biomarkers. Furthermore, the cardiovascular adaptation to HDTBR was not affected by daily artificial gravity training. Other analyses from AGBRESA also report no relevant influences of the artificial gravity intervention on physiological outcomes (Attias et al., 2020; Hoffmann et al., 2020; Kramer et al., 2020; Ganse et al., 2021; Lecheler et al., 2021). Combining artificial gravity with exercise holds promise for future bed rest studies (Diaz-Artiles et al., 2018).
Clearly, our findings cannot be simply extrapolated to real space conditions. In fact, current missions in low Earth orbit and future missions to Mars are substantially longer. Moreover, astronauts are exposed to additional risks that could exacerbate vascular aging, particularly radiation (Hughson et al., 2018). Our findings may also help interpreting previous vascular function data obtained in space and guide technology development for future missions. For example, previous studies in astronauts reported reduced PAT without measuring ICT (Baevsky et al., 2007; Hughson et al., 2016). Cardiac deconditioning in space (Hughson et al., 2018) could conceivably affect ICT. In fact, prolonged pre-ejection periods were reported in three Skylab astronauts after 59 days in space (Bergman et al., 1976). Combined with our findings from HDTBR, we conclude that only ICT corrected PAT values should be used as vascular biomarkers.
Data Availability Statement
The raw data supporting the conclusions of this article will be made available by the authors, without undue reservation.
Ethics Statement
The studies involving human participants were reviewed and approved by the Ethics Commissions of the Medical Association North Rhine (number 2018143) and NASA (Johnson Space Center, Houston, United States). The patients/participants provided their written informed consent to participate in this study.
Author Contributions
SM, JT, MB, and BH designed the experiment. MB provided technical support. SM, FH, and JR performed data acquisition. SM, FH, and SO were in charge of data analysis. BJ did statistical analysis. SM was primarily in charge of drafting the manuscript. EM, JT, and JJ primarily revised the manuscript. All authors contributed and accepted the final version.
Funding
The AGBRESA-study was funded by DLR, ESA (contract number 4000113871/15/NL/PG), and NASA (contract number 80JSC018P0078). DLR, ESA, and NASA designed the bed rest study, but had no role in the design, data analysis, manuscript draft, or decision to publish the part of the study described in this manuscript. FH received funding by DLR and the German Federal Ministry of Economy and Technology, BMWi (50WB1816). SO, MB, BH, and SW were funded by the Austrian Federal Ministry for Climate Action, Environment, Energy, Mobility, Innovation and Technology, BMK (SPACE4ALL Project, FFG No. 866761). JR was funded by FNRS (FC 29801).
Conflict of Interest
The authors declare that the research was conducted in the absence of any commercial or financial relationships that could be construed as a potential conflict of interest.
Acknowledgments
We would like to thank the entire team at DLR for conducting the bed rest study. We would also like to thank our 24 subjects for their patience and perseverance.
References
Arbeille, P., Provost, R., and Zuj, K. (2016). Carotid and femoral artery intima-media thickness During 6 months of spaceflight. Aerosp. Med. Hum. Perform. 87, 449–453. doi: 10.3357/amhp.4493.2016
Arbeille, P., Provost, R., and Zuj, K. (2017). Carotid and femoral arterial wall distensibility during long-duration spaceflight. Aerosp. Med. Hum. Perform. 88, 924–930. doi: 10.3357/amhp.4884.2017
Attias, J., Grassi, A., Bosutti, A., Ganse, B., Degens, H., and Drey, M. (2020). Head-down tilt bed rest with or without artificial gravity is not associated with motor unit remodeling. Eur. J. Appl. Physiol. 120, 2407–2415. doi: 10.1007/s00421-020-04458-7
Bachler, M., Mayer, C., Hametner, B., and Wassertheurer, S. (2013). “Increasing stability of real-time pulse wave velocity estimation by combining established and new approaches” in Proceeding of the 2013 8th EUROSIM Congress on Modelling and Simulation. (Cardiff: IEEE) 47–51. doi: 10.1109/EUROSIM.2013.18
Baevsky, R. M., Baranov, V. M., Funtova, I. I., Diedrich, A., Pashenko, A. V., Chernikova, A. G., et al. (2007). Autonomic cardiovascular and respiratory control during prolonged spaceflights aboard the International Space Station. J. Appl. Physiol. 103, 156–161. doi: 10.1152/japplphysiol.00137.2007
Baier, D., Teren, A., Wirkner, K., Loeffler, M., and Scholz, M. (2018). Parameters of pulse wave velocity: determinants and reference values assessed in the population-based study LIFE-Adult. Clin. Res. Cardiol. 107, 1050–1061. doi: 10.1007/s00392-018-1278-3
Bergman, S. A. Jr., Hoffler, G. W., Johnson, R. L., and Wolthuis, R. A. (1976). Pre- and postflight systolic time intervals during LBNP: the second manned Skylab mission. Aviat. Space Environ. Med. 47, 359–362.
Cau, S. B., Carneiro, F. S., and Tostes, R. C. (2012). Differential modulation of nitric oxide synthases in aging: therapeutic opportunities. Front. Physiol. 3:218. doi: 10.3389/fphys.2012.00218
Diaz-Artiles, A., Heldt, T., and Young, L. R. (2018). Short-term cardiovascular response to short-radius centrifugation with and without ergometer exercise. Front. Physiol. 9:1492. doi: 10.3389/fphys.2018.01492
Dogui, A., Kachenoura, N., Frouin, F., Lefort, M., De Cesare, A., Mousseaux, E., et al. (2011). Consistency of aortic distensibility and pulse wave velocity estimates with respect to the Bramwell-Hill theoretical model: a cardiovascular magnetic resonance study. J. Cardiovasc. Magn. Reson. 13:11. doi: 10.1186/1532-429x-13-11
Fayol, A., Malloisel-Delaunay, J., Fouassier, D., Cristian, C., Leguy, C., Bareille, M. P., et al. (2019). Impact of 60 day of bedrest on long-term pulse wave velocity evolution. J. Hypertens. 37:e85. doi: 10.1097/01.hjh.0000570256.58051.21
Galderisi, M., Cosyns, B., Edvardsen, T., Cardim, N., Delgado, V., Di Salvo, G., et al. (2017). Standardization of adult transthoracic echocardiography reporting in agreement with recent chamber quantification, diastolic function, and heart valve disease recommendations: an expert consensus document of the European Association of Cardiovascular Imaging. Eur. Heart J Cardiovasc. Imaging 18, 1301–1310. doi: 10.1093/ehjci/jex244
Ganse, B., Bosutti, A., Drey, M., and Degens, H. (2021). Sixty days of head-down tilt bed rest with or without artificial gravity do not affect the neuromuscular secretome. Exp. Cell Res. 399:112463. doi: 10.1016/j.yexcr.2020.112463
Guala, A., Rodriguez-Palomares, J., Dux-Santoy, L., Teixido-Tura, G., Maldonado, G., Galian, L., et al. (2019). Influence of aortic dilation on the regional aortic stiffness of bicuspid aortic valve assessed by 4-dimensional flow cardiac magnetic resonance: comparison with marfan syndrome and degenerative aortic aneurysm. JACC Cardiovasc Imaging 12, 1020–1029. doi: 10.1016/j.jcmg.2018.03.017
Guinet, P., Schneider, S. M., Macias, B. R., Watenpaugh, D. E., Hughson, R. L., Le Traon, A. P., et al. (2009). WISE-2005: effect of aerobic and resistive exercises on orthostatic tolerance during 60 days bed rest in women. Eur. J. Appl. Physiol. 106, 217–227. doi: 10.1007/s00421-009-1009-6
Hassan, S., and Turner, P. (1983). Systolic time intervals: a review of the method in the non-invasive investigation of cardiac function in health, disease and clinical pharmacology. Postgrad. Med. J. 59, 423–434.
Havlik, R. J., Phillips, C. L., Brock, D. B., Lohman, K., Haskell, W., Snell, P., et al. (2005). Walking may be related to less vascular stiffness in the Activity Counseling Trial (ACT). Am Heart J 150, 270–275. doi: 10.1016/j.ahj.2004.09.006
Hodges, G. J., Mattar, L., Zuj, K. A., Greaves, D. K., Arbeille, P. M., Hughson, R. L., et al. (2010). WISE-2005: prolongation of left ventricular pre-ejection period with 56 days head-down bed rest in women. Exp. Physiol. 95, 1081–1088. doi: 10.1113/expphysiol.2010.054254
Hoffmann, F., Rabineau, J., Mehrkens, D., Gerlach, D. A., Moestl, S., Johannes, B. W., et al. (2020). Cardiac adaptations to 60 day head-down-tilt bed rest deconditioning. Findings from the AGBRESA study. ESC Heart Fail 8, 729–744. doi: 10.1002/ehf2.13103
Hughson, R. L., Helm, A., and Durante, M. (2018). Heart in space: effect of the extraterrestrial environment on the cardiovascular system. Nat. Rev. Cardiol. 15, 167–180. doi: 10.1038/nrcardio.2017.157
Hughson, R. L., Robertson, A. D., Arbeille, P., Shoemaker, J. K., Rush, J. W., Fraser, K. S., et al. (2016). Increased postflight carotid artery stiffness and inflight insulin resistance resulting from 6-mo spaceflight in male and female astronauts. Am. J. Physiol. Heart Circ. Physiol. 310, H628–H638. doi: 10.1152/ajpheart.00802.2015
Inglesby, D. C., Antonucci, M. U., Spampinato, M. V., Collins, H. R., Meyer, T. A., Schlosser, R. J., et al. (2020). Spaceflight-associated changes in the opacification of the paranasal sinuses and mastoid air cells in astronauts. JAMA Otolaryngol. Head Neck Surg. 146, 571–577. doi: 10.1001/jamaoto.2020.0228
Iwasaki, K.-I., Zhang, R., Zuckerman, J. H., Pawelczyk, J. A., and Levine, B. D. (2000). Effect of head-down-tilt bed rest and hypovolemia on dynamic regulation of heart rate and blood pressure. Am. J. Physiol. Regul. Integr. Comp. Physiol. 279, R2189–R2199. doi: 10.1152/ajpregu.2000.279.6.R2189
Kramer, A., Venegas-Carro, M., Mulder, E., Lee, J. K., Moreno-Villanueva, M., Bürkle, A., et al. (2020). Cardiorespiratory and neuromuscular demand of daily centrifugation: results from the 60-Day AGBRESA bed rest study. Front. Physiol. 11:562377. doi: 10.3389/fphys.2020.562377
Laurie, S. S., Macias, B. R., Dunn, J. T., Young, M., Stern, C., Lee, S. M. C., et al. (2019). Optic disc edema after 30 days of strict head-down tilt bed rest. Ophthalmology 126, 467–468. doi: 10.1016/j.ophtha.2018.09.042
Lecheler, L., Paulke, F., Sonnow, L., Limper, U., Schwarz, D., Jansen, S., et al. (2021). Gravity and Mastoid Effusion. Am. J. Med. 134, e181–e183. doi: 10.1016/j.amjmed.2020.09.020
Levine, B. D., Zuckerman, J. H., and Pawelczyk, J. A. (1997). Cardiac atrophy after bed-rest deconditioning: a nonneural mechanism for orthostatic intolerance. Circulation 96, 517–525. doi: 10.1161/01.cir.96.2.517
Mitchell, G. F. (2009). Arterial stiffness and wave reflection: biomarkers of cardiovascular risk. Artery Res. 3, 56–64. doi: 10.1016/j.artres.2009.02.002
Palombo, C., Morizzo, C., Baluci, M., Lucini, D., Ricci, S., Biolo, G., et al. (2015). Large artery remodeling and dynamics following simulated microgravity by prolonged head-down tilt bed rest in humans. Biomed. Res. Int. 2015:342565. doi: 10.1155/2015/342565
Perhonen, M. A., Franco, F., Lane, L. D., Buckey, J. C., Blomqvist, C. G., Zerwekh, J. E., et al. (2001). Cardiac atrophy after bed rest and spaceflight. J. Appl. Physiol. 91, 645–653. doi: 10.1152/jappl.2001.91.2.645
Pišot, R., Marusic, U., Biolo, G., Mazzucco, S., Lazzer, S., Grassi, B., et al. (2016). Greater loss in muscle mass and function but smaller metabolic alterations in older compared with younger men following 2 wk of bed rest and recovery. J. Appl. Physiol. 120, 922–929. doi: 10.1152/japplphysiol.00858.2015
Redheuil, A., Yu, W. C., Wu, C. O., Mousseaux, E., de Cesare, A., Yan, R., et al. (2010). Reduced ascending aortic strain and distensibility: earliest manifestations of vascular aging in humans. Hypertension 55, 319–326. doi: 10.1161/hypertensionaha.109.141275
Saltin, B., Blomqvist, G., Mitchell, J. H., Johnson, R. L. Jr., Wildenthal, K., and Chapman, C. B. et al. (1968). Response to exercise after bed rest and after training. Circulation 38(5 Suppl.), Vii1–Vii78.
Schellinger, I. N., Mattern, K., and Raaz, U. (2019). The hardest part. Arterioscler. Thromb. Vasc. Biol. 39, 1301–1306. doi: 10.1161/atvbaha.118.311578
Stenger, M. B., Evans, J. M., Knapp, C. F., Lee, S. M., Phillips, T. R., Perez, S. A., et al. (2012). Artificial gravity training reduces bed rest-induced cardiovascular deconditioning. Eur. J. Appl. Physiol. 112, 605–616. doi: 10.1007/s00421-011-2005-1
Thijssen, D. H., Green, D. J., and Hopman, M. T. (2011). Blood vessel remodeling and physical inactivity in humans. J. Appl. Physiol. 111, 1836–1845. doi: 10.1152/japplphysiol.00394.2011
van Duijnhoven, N. T., Green, D. J., Felsenberg, D., Belavy, D. L., Hopman, M. T., and Thijssen, D. H. (2010). Impact of bed rest on conduit artery remodeling: effect of exercise countermeasures. Hypertension 56, 240–246. doi: 10.1161/hypertensionaha.110.152868
Voges, I., Jerosch-Herold, M., Hedderich, J., Pardun, E., Hart, C., Gabbert, D. D., et al. (2012). Normal values of aortic dimensions, distensibility, and pulse wave velocity in children and young adults: a cross-sectional study. J. Cardiovasc. Magn. Reson. 14:77. doi: 10.1186/1532-429X-14-77
Wagner, P. D. (2015). A re-analysis of the 1968 Saltin et al. “Bedrest” paper. Scand. J. Med. Sci. Sports 25(Suppl. 4), 83–87. doi: 10.1111/sms.12597
Weber, T., Wassertheurer, S., Rammer, M., Maurer, E., Hametner, B., Mayer, C. C., et al. (2011). Validation of a brachial cuff-based method for estimating central systolic blood pressure. Hypertension 58, 825–832. doi: 10.1161/hypertensionaha.111.176313
Weissler, A. M., Harris, W. S., and Schoenfeld, C. D. (1968). Systolic time intervals in heart failure in man. Circulation 37, 149–159.
Williams, B., Mancia, G., Spiering, W., Agabiti Rosei, E., Azizi, M., Burnier, M., et al. (2018). 2018 ESC/ESH guidelines for the management of arterial hypertension: the task force for the management of arterial hypertension of the European Society of Cardiology and the European Society of Hypertension. J. Hypertens. 36, 1953–2041. doi: 10.1097/hjh.0000000000001940
Keywords: pre-ejection period, pulse wave arrival time, pulse wave velocity, artificial gravity, AGBRESA, arterial stiffness, aortic distensibility, isovolumetric contraction time
Citation: Möstl S, Orter S, Hoffmann F, Bachler M, Hametner B, Wassertheurer S, Rabineau J, Mulder E, Johannes B, Jordan J and Tank J (2021) Limited Effect of 60-Days Strict Head Down Tilt Bed Rest on Vascular Aging. Front. Physiol. 12:685473. doi: 10.3389/fphys.2021.685473
Received: 25 March 2021; Accepted: 04 May 2021;
Published: 28 May 2021.
Edited by:
Tobias Weber, European Space Agency (ESA), FranceReviewed by:
Ana Diaz Artiles, Texas A&M University, United StatesJun Sugawara, National Institute of Advanced Industrial Science and Technology (AIST), Japan
Copyright © 2021 Möstl, Orter, Hoffmann, Bachler, Hametner, Wassertheurer, Rabineau, Mulder, Johannes, Jordan and Tank. This is an open-access article distributed under the terms of the Creative Commons Attribution License (CC BY). The use, distribution or reproduction in other forums is permitted, provided the original author(s) and the copyright owner(s) are credited and that the original publication in this journal is cited, in accordance with accepted academic practice. No use, distribution or reproduction is permitted which does not comply with these terms.
*Correspondence: Stefan Möstl, U3RlZmFuLm1vZXN0bEBkbHIuZGU=
†These authors have contributed equally to this work and share first authorship