
94% of researchers rate our articles as excellent or good
Learn more about the work of our research integrity team to safeguard the quality of each article we publish.
Find out more
ORIGINAL RESEARCH article
Front. Physiol., 11 May 2021
Sec. Fractal Physiology
Volume 12 - 2021 | https://doi.org/10.3389/fphys.2021.678507
 Antonio Barajas-Martínez1,2,3
 Elizabeth Ibarra-Coronado2,4
 Ruben Fossion2,4
 Juan Claudio Toledo-Roy2,4
 Vania Martínez-Garcés5
 Juan Antonio López-Rivera2,6
 Geraldine Tello-Santoyo3
 Rusland D. Lavin2José Luis Gómez6
 Christopher R. Stephens2,4
 Carlos A. Aguilar-Salinas7Bruno Estañol2,7
 Nimbe Torres7
 Armando R. Tovar7
 Osbaldo Resendis-Antonio2,8
 Marcia Hiriart2,9
 Alejandro Frank2,4,10
 Ana Leonor Rivera2,4*
Within human physiology, systemic interactions couple physiological variables to maintain homeostasis. These interactions change according to health status and are modified by factors such as age and sex. For several physiological processes, sex-based distinctions in normal physiology are present and defined in isolation. However, new methodologies are indispensable to analyze system-wide properties and interactions with the objective of exploring differences between sexes. Here we propose a new method to construct complex inferential networks from a normalization using the clinical criteria for health of physiological variables, and the correlations between anthropometric and blood tests biomarkers of 198 healthy young participants (117 women, 81 men, from 18 to 27 years old). Physiological networks of men have less correlations, displayed higher modularity, higher small-world index, but were more vulnerable to directed attacks, whereas networks of women were more resilient. The networks of both men and women displayed sex-specific connections that are consistent with the literature. Additionally, we carried out a time-series study on heart rate variability (HRV) using Physionet’s Fantasia database. Autocorrelation of HRV, variance, and Poincare’s plots, as a measure of variability, are statistically significant higher in young men and statistically significant different from young women. These differences are attenuated in older men and women, that have similar HRV distributions. The network approach revealed differences in the association of variables related to glucose homeostasis, nitrogen balance, kidney function, and fat depots. The clusters of physiological variables and their roles within the network remained similar regardless of sex. Both methodologies show a higher number of associations between variables in the physiological system of women, implying redundant mechanisms of control and simultaneously showing that these systems display less variability in time than those of men, constituting a more resilient system.
The integration of the physiological systems that conform the human body and its operation can be considered an open structure with characteristics of a complex system that are the result of the large number of system components that comprise it, and the coupling and interactions between them (Bashan et al., 2012). The non-linear interaction of these components, their self-organization, emergent behavior, scale invariance, in addition to their adaptability, support the functional balance required for life (Rivera et al., 2020). In this context, proper functionality and adaptability are necessary to maintain health. Homeostasis is given by the balance between robustness, which define a system and its conformation, and adaptability (which is the ability of the system to respond to changes in the environment) while preserving its functionality (Fossion et al., 2018). Loss of this balance leads to disease. The systemic interactions within human physiology change as a function of many factors, age and sex being prominent examples. Here, by “sex” we refer to “the classification as male or female according to reproductive organs and functions assigned by the chromosomal complement” (Institute of Medicine (US) Committee on Understanding the Biology of Sex and Gender Differences, 2001). The expression of this sexual differentiation produces changes in many organ systems and across the lifespan of the individual, influencing how our bodies interact with the environment to determine health (Rich-Edwards et al., 2018). In this way, sex is recognized as a genetic modifier of disease pathophysiology, resulting in variations which should be considered in the biomedical enterprise (Mauvais-Jarvis et al., 2020).
There is ample evidence that the mechanisms underlying the regulation of various homeostatic processes are different in men and women. Physiologically, differences have been found in the function and morphology, for example, of the distribution and metabolism of adipose tissue (Palmer and Clegg, 2015), leading to the development of different types of obesity in women and men (Lumish et al., 2020). At the central nervous system level, morphological differences have been demonstrated in terms of structures and information processing: For instance, the thickness of the cortical mantle is greater in women than in men; also, memory consolidation is also different between sexes (Maren et al., 1994; Piefke et al., 2005). Other examples of physiological differences are specific pathologies such as neurodevelopmental disorders and neurodegenerative diseases, which are more frequent in men than in women (Hanamsagar and Bilbo, 2016), while on the other hand it is known that women have a greater predisposition to develop autoimmune diseases (Ngo et al., 2014), or gastrointestinal problems such as achalasia (Furuzawa-Carballeda et al., 2015; Rivera et al., 2021). The response to different pathogens also seems to depend on sex (McClelland and Smith, 2011). In the cardiovascular system, various studies provide evidence that men have a greater predisposition to develop cardiovascular diseases (Lloyd-Jones et al., 1999), greater cardiovascular mortality due to them (Regitz-Zagrosek, 2006), such that the risk factors between men and women are different. For example, while the average age at which women tend to experience myocardial infarction is higher than that of men, variables such as hypertension, diabetes and smoking result in significantly higher hazard ratios of myocardial infarction in women than in men (Mauvais-Jarvis et al., 2020). Metabolic syndrome may also develop differently due to physiological sexual dimorphism, as has been seen in other animals (Velasco et al., 2020).
Sex-based differences in normal physiology, including those dependent on the endocrine system, are present and have been described in isolation for many physiological systems. However, to examine system-wide properties and interactions, new methodologies are necessary. Here we use time series analysis (Fossion et al., 2018) and network theory applied to data mining (Stephens et al., 2020) as two complementary approaches to study relations between physiological variables and their variability (Fossion et al., 2017). Cardiovascular coupling is a representative example of homeostatic regulation between different systems influenced by sex that is easily captured by several physiological time series. According to the control theory applied to homeostasis, physiological control systems are able to maintain the values of regulated variables that are vital for the organism within “normal” ranges because of the physiological responses of the corresponding effector variables which increase their variability (Fossion et al., 2018). In the cardiovascular system, heart rate serves as a regulatory variable and blood pressure as a regulated variable to sustain perfusion in the tissues. Different conditions and variations in metabolic activity induce changes in frequency and amplitude of the pulmonary and cardiac cycles in conjunction with vascular resistance and capacitance to provide an adequate constant oxygen supply. Modulation of these couplings is multidirectional in order to preserve homeostasis, and both acute and chronic diseases change this modulation through different pathophysiological mechanisms. This physiological modulation exhibits sex-based differences, and cyclic changes along the ovarian cycle phases (Figure 1). By examining differences in this modulation through time series analysis, different aspects of coupling are studied.
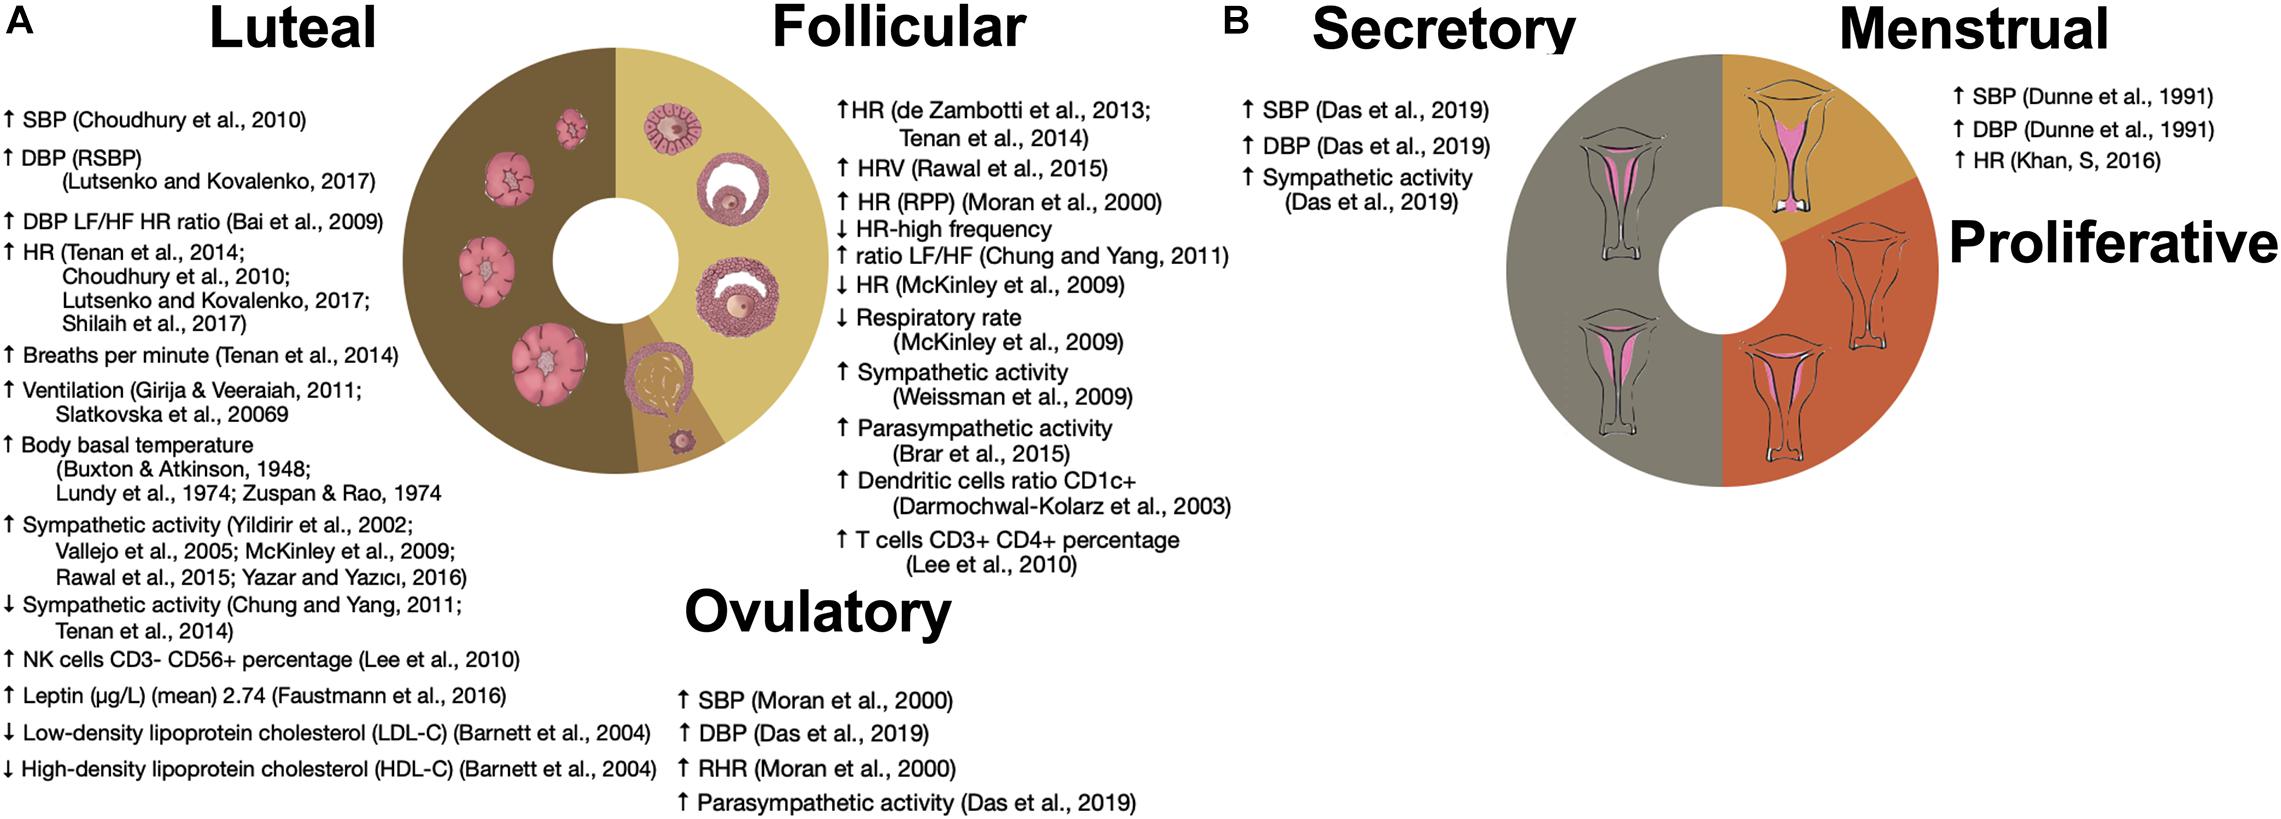
Figure 1. Influence of ovarian and menstrual cycles on physiological variables. (A) Changes in the time series variability and statistical distribution moments of physiological variables that have been associated with the ovarian cycle. (B) Changes in the time series variability and statistical distribution moments of physiological variables along the menstrual cycle. ↑ SBP (Choudhury et al., 2010), ↑ DBP (RSBP) (Lutsenko and Kovalenko, 2017), ↑ DBP LF/HF HR ratio (Bai et al., 2009), ↑ HR (Choudhury et al., 2010; Tenan et al., 2014; Lutsenko and Kovalenko, 2017; Shilaih et al., 2017), ↑ Breaths per minute (Tenan et al., 2014), ↑ Ventilation (Slatkovska et al., 2006; Girija and Veeraiah, 2011), ↑ Body basal temperature (Buxton and Atkinson, 1948; Lundy et al., 1974; Zuspan and Rao, 1974), ↑ Sympathetic activity (Yildirir et al., 2002; Vallejo et al., 2005; McKinley et al., 2009; Rawal et al., 2015; Yazar and Yazıcı, 2016), ↓ Sympathetic activity (Chung and Yang, 2011; Tenan et al., 2014), ↑ NK cells CD3– CD56+ percentage (Lee et al., 2010), ↑ Leptin (ug/L) (mean) 2.74 (Faustmann et al., 2016), ↓ Low-density lipoprotein cholesterol (LDL-C) (Barnett et al., 2004), ↑ High-density lipoprotein cholesterol (HDL-C) (Barnett et al., 2004), ↑ HR (de Zambotti et al., 2013; Tenan et al., 2014), ↑ HRV (Rawal et al., 2015), ↑ HR (RPP) (Moran et al., 2000), ↓ HR-high frequency ratio LF/HF (Chung and Yang, 2011), ↓ HR (McKinley et al., 2009), ↓ Respiratory rate (McKinley et al., 2009), ↑ Sympathetic activity (Weissman et al., 2009), ↑ Parasym pathetic activity (Brar et al., 2015), ↑ Dendritic cells ratio CD1c+ (Darmochwal-Kolarz et al., 2003), ↑ T cells CD3+ CD4+ percentage (Lee et al., 2010), ↑ SBP (Moran et al., 2000), ↑ DBP Das et al., 2019), ↑ RHR (Moran et al., 2000), ↑ Parasym pathetic activity (Das et al., 2019), ↑ SBP (Das et al., 2019), ↑ DBP (Das et al., 2019), ↑ Sympathetic activity (Das et al., 2019), ↑ SBP (Dunne et al., 1991), ↑ DBP (Dunne et al., 1991), and ↑ HR (Khan et al., 2016).
Sex differences are widespread across physiology, and may be classified as sex chromosome effects as well as hormonal effects that are either organizational or activational (Arnold et al., 2009). Therefore, physiological differences between men and women also occur in systems that are not easily recordable by continuous monitoring, and are instead widely approached through transversal studies of human populations. To take advantage of the wide selection of physiological variables available for transversal studies, correlation matrices in narrow-age cohorts can be used to construct complex inference networks (Hofer and Sliwinski, 2001; Batushansky et al., 2016; Barajas-Martínez et al., 2020, 2021; Cohen et al., 2021). Complex inference networks allow to find and explore statistical associations from the perspective of network theory, which provides a natural way to describe the relationships between a large set of entities (Stephens et al., 2018). Through networks, biological systems can be described by both graph-theoretical metrics as well as visual analysis (Aittokallio and Schwikowski, 2006; Merico et al., 2009; Pavlopoulos et al., 2011). This approach provides the possibility of observing the aggregate behavior of the system, offering insights on the function and structure of the system (Arnold et al., 2009; Jansson, 2020).
Historically, basic and clinical research has been carried out preferably in men or male animals. The bias to use male animals is based on reasons that have to do with the practicality of the study. For example, the preference for using male animals may be due to the fact that individuals are usually larger and therefore easier to manipulate when dissecting, or having better access in neurological studies for example. Another justification is that they do not have estrous cycles that strongly alter various physiological variables. There are also specific considerations such as the possibility of a differential response to treatment between men and women, and it is specifically for this reason that gender disparities should not be overlooked (Buoncervello et al., 2017). From preclinical studies (in animal models) to clinical studies, the study of the mechanisms involved in the appearance of many pathologies must consider the existence of different behavior and regulatory mechanisms between sexes, which is why there are explicit recommendations to include both sexes in preclinical studies (Sandberg et al., 2015) and to consider it in clinical treatment and evaluation (Mauvais-Jarvis et al., 2020). The aim of this study is to explore differences in the properties of the physiological systems of women and men using integrative approaches.
The present contribution analyzes the differences that exist in physiological regulation mechanisms between women and men. To see these differences on one physiological variable (cardiac frequency) was studied by the time series obtained from electrocardiographic records of men and women from the Fantasia database of Physionet (Iyengar et al., 1996; Goldberger et al., 2000). To see systemic differences, a network analysis of biochemical and anthropometric biomarkers was carried out using a database of healthy men and women, using the physiological network model previously reported by our research group in Barajas-Martínez et al. (2021).
The Fantasia database (Iyengar et al., 1996) provided by Physionet (Goldberger et al., 2000) was used. This database was compiled by the Massachusetts Institute of Technology and the Beth Hospital in Israel (MIT/BIH DB), which is available at https://www.physionet.org/ (Iyengar et al., 1996; Goldberger, 1996). The database contains the 120 min electrocardiogram records of 10 men and 10 women between 21 and 34 years old, and 10 men and 10 women from 68 to 85 years old, in supine condition, while they were watching the Disney movie “Fantasia”.
To study heart rate variability, time series of intervals between successive QRS complexes (RR intervals) were used. The statistical moments of the resulting time series were calculated: arithmetic mean (μ), standard deviation (SD), skewness (sk), and kurtosis (k). The analysis was also carried out using non-linear measures, such as Shannon’s entropy, which measures the transfer of information (Pincus and Viscarello, 1992; Goldberger, 1996). Poincaré plots (obtained by plotting the time series against a version of it shifted by one time unit) were also studied, as they offer a measure of the first order correlations between the values in the series. The Poincaré plot is generally represented as an ellipse containing 95% of the points, the longitudinal diameter of this ellipse (SD1) describes the long-term deviation of the heart rate, and the cross-sectional diameter (SD2) represents short-term changes in heart rate. Student t-test was used to measure statistical differences between all the groups compared with the young women group.
The study was developed according to Good Clinical Practice guidelines and the Declaration of Helsinki, and was carried out in accordance with current regulation contained in the Mexican Official Normativity, NOM-012-SSA3-2012. The Ethics Committee of the Facultad de Medicina of the Universidad Nacional Autónoma de México (UNAM) approved the procedures and protocols for this study as project FM/DI/023/2014. All the participants provided written informed consent.
The dataset employed for the study of physiological networks is available in Barajas-Martínez et al. (2021). We conducted a cross-sectional analysis of first- and second-year students living in Mexico City and its metropolitan surroundings. Inclusion criteria were men and women above 18 years old in the first and second years of the School of Medicine at UNAM. Exclusion criteria were refusal to give informed consent, students already participating in clinical rotations, drug consumption in the 24 h previous to the study and non-fasting at the time of blood sample collection (Figure 2).
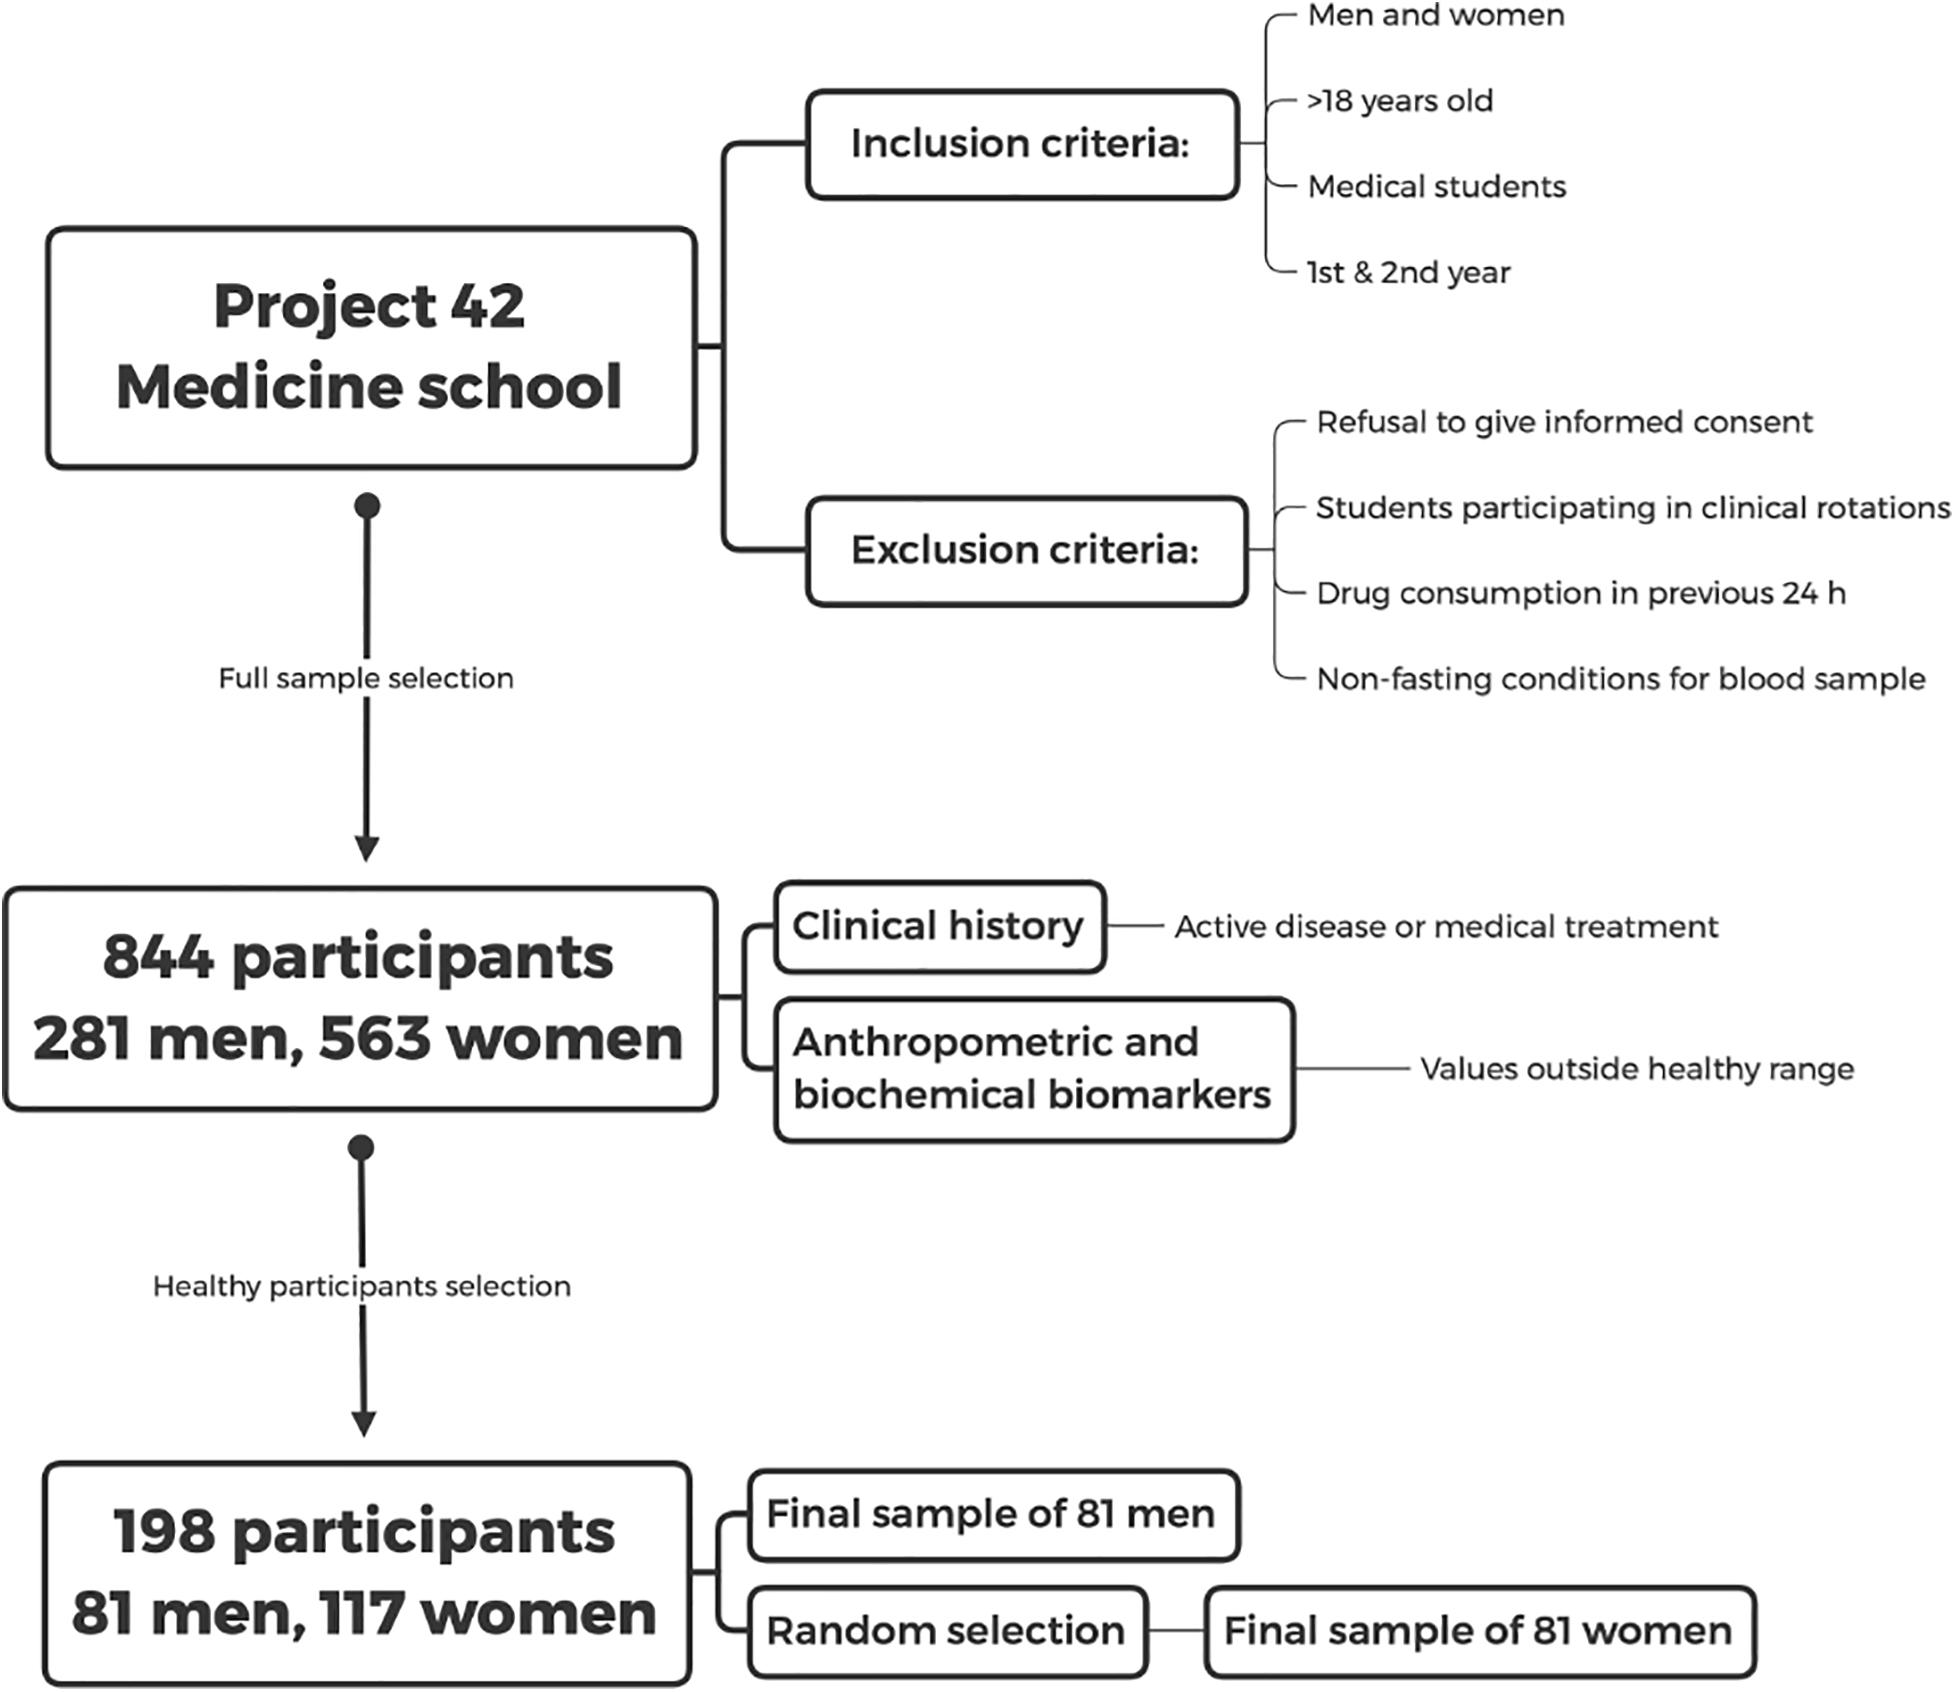
Figure 2. Study design. Inclusion and exclusion criteria for the database of the Medical School which was taken from the later database of “Project 42” are shown. The selection procedure of the healthy sample is described in the text.
After initially screening 844 participants, 281 men and 563 women, were included and underwent an extensive questionnaire, measurements of anthropometric variables, and evaluation of biochemical biomarkers. Sixty-nine percent of the participants were women, with an age ranging from 18 to 28 years old (mean age of 20 ± 2 years), reflecting the demographic composition of the School of Medicine. The detailed questionnaire included a brief medical history, evaluation of socioeconomic status, and health-related questions on sleep, exercise and dietary habits. Participants with active diseases or with any value outside the healthy ranges described in Tables 1, 2 and were classified as non-healthy. Specifically, after the normalization procedure described below in Eq. 2, rows were excluded if they contained any value above 1 or below 0. Only 198 participants, 81 men and 117 women, were selected as healthy. For the purpose of our analysis, health was defined as the absence of active disease, medication for chronic disease, and any physiological parameter outside the normal range. The aim of this operational definition is to select a very specific physiological state, where all possible indicators of health are within standard ranges. As such, this definition is not intended as a general-purpose definition of health.
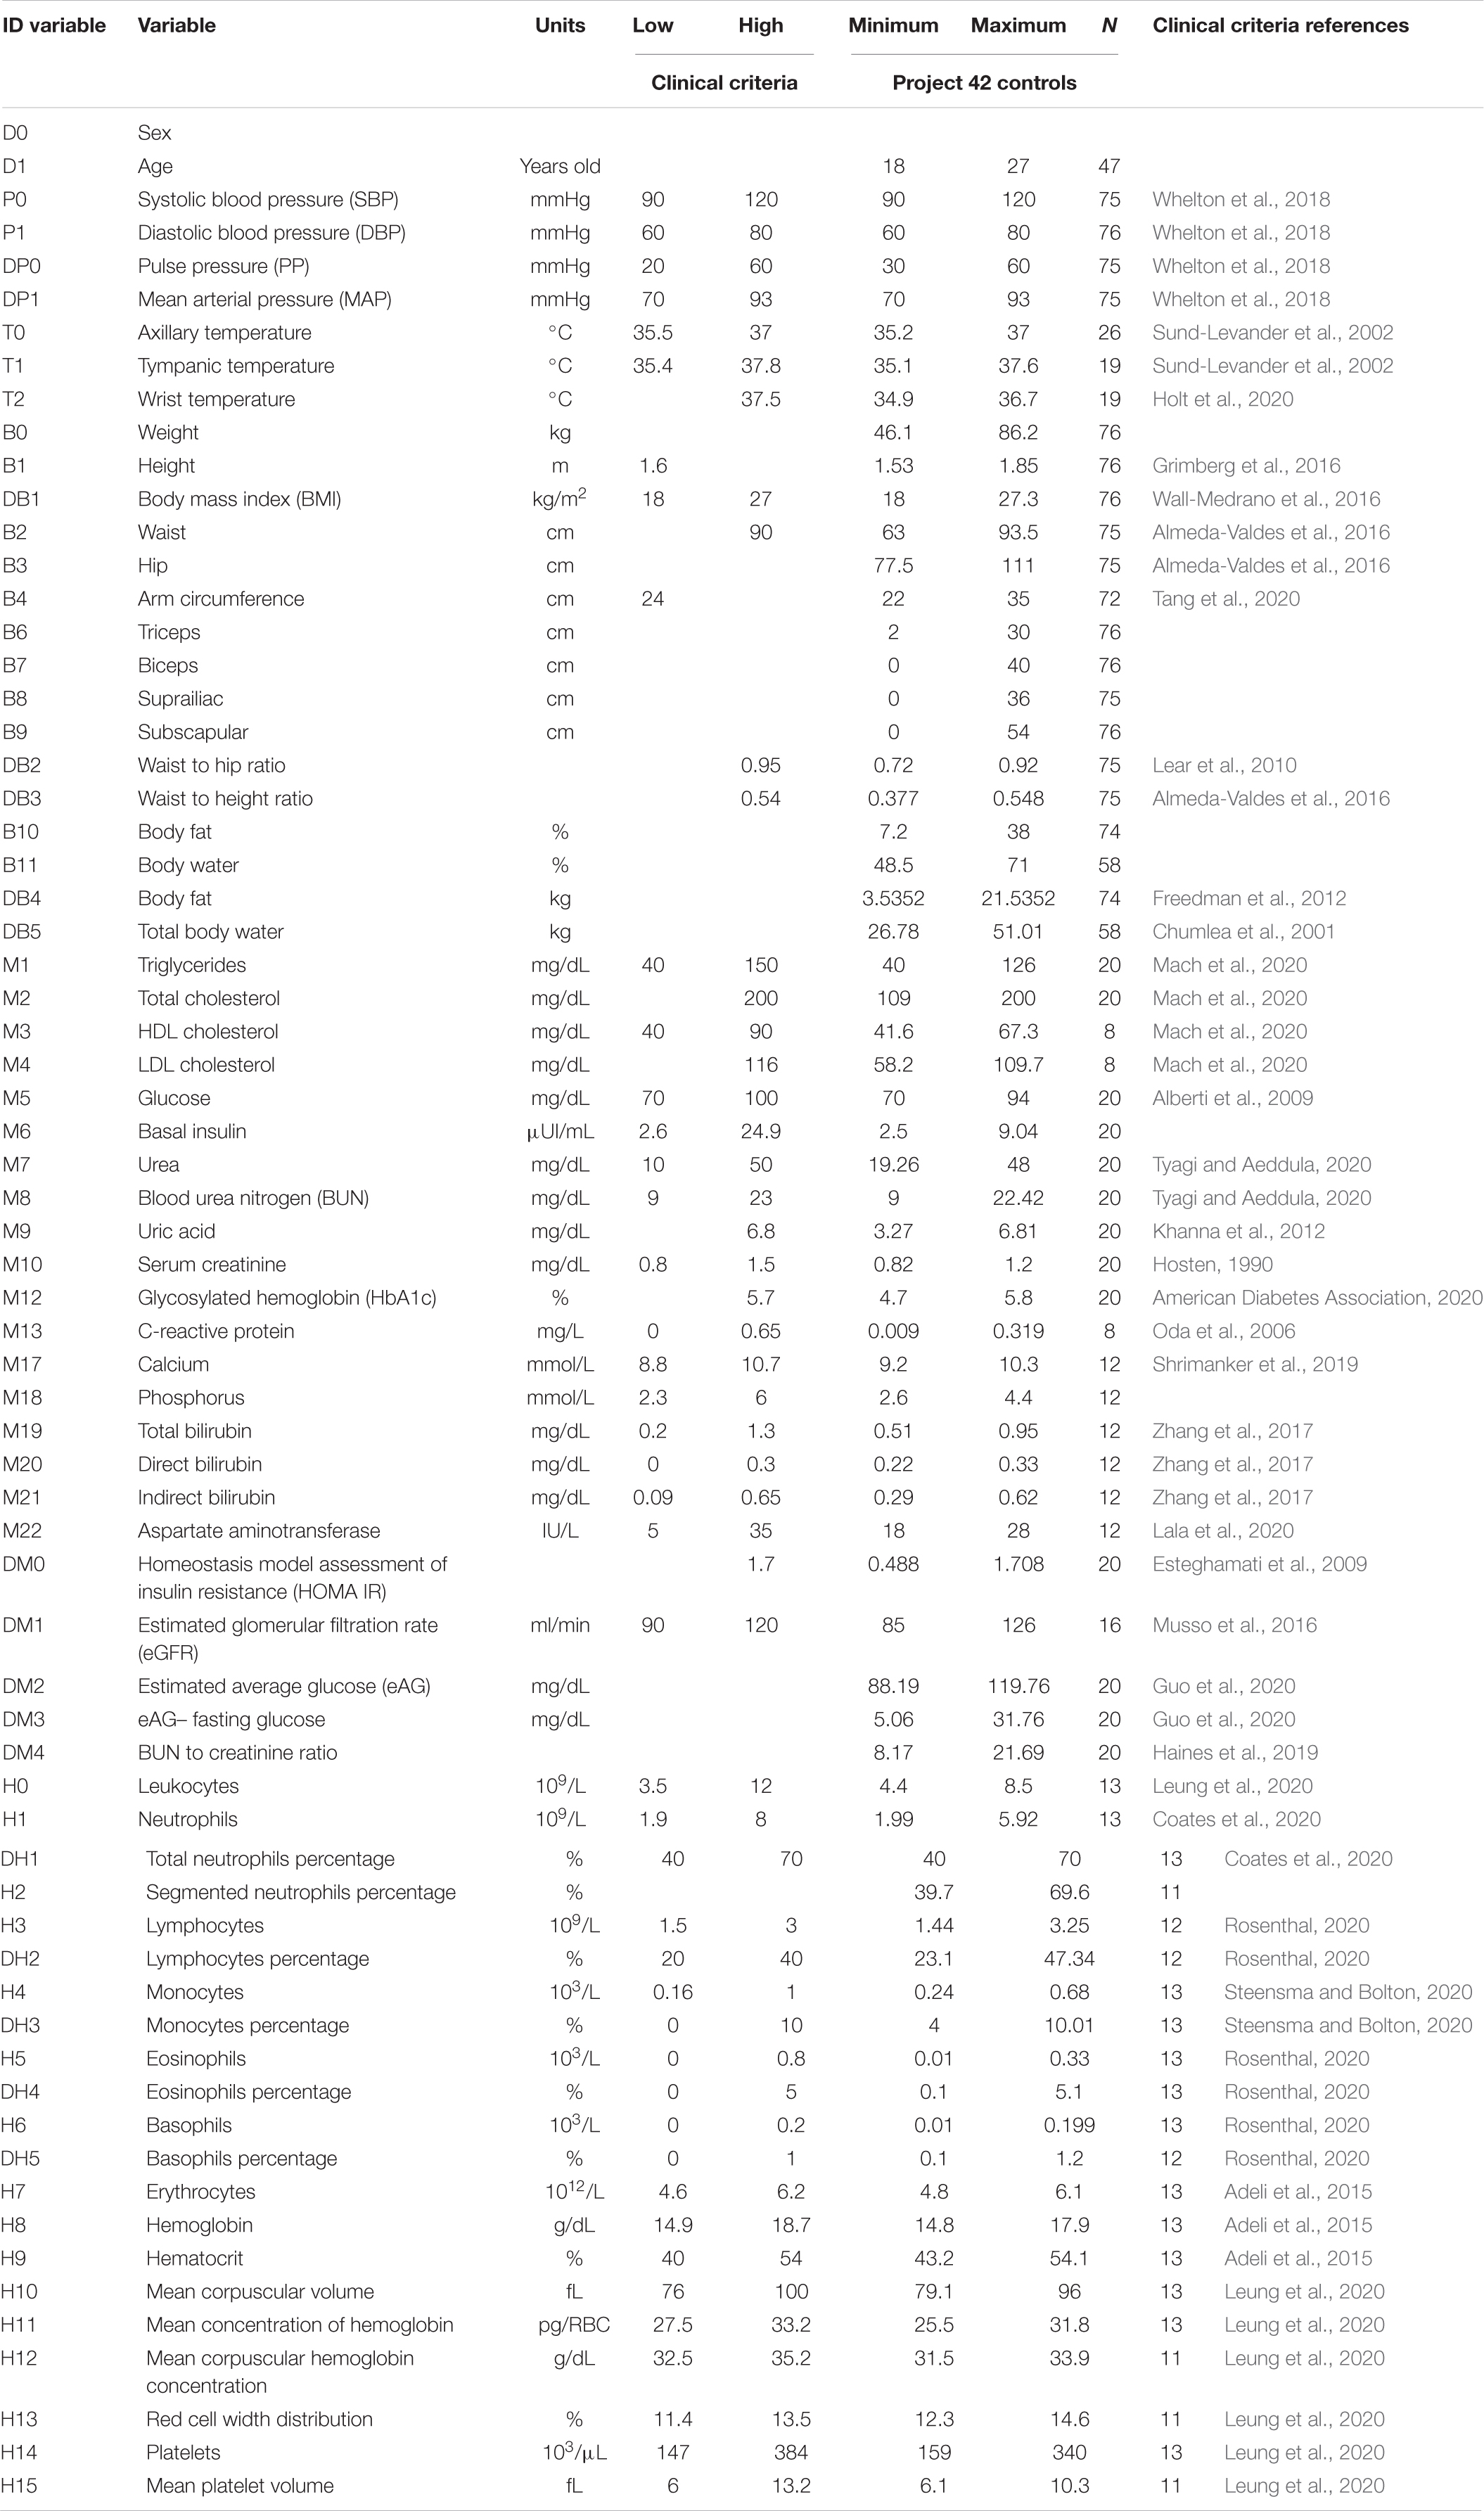
Table 1. Criteria of health in men.

Table 2. Criteria of health in women.
We found no differences between men and women in current consumption of soft drinks and snacks. Self-reported current, previous year and 5 years ago sleep and exercise time were compared by mixed-effects analysis with Tukey’s post hoc test for effects within rows and columns. Both men and women had significant reductions in the time of weekly exercise, F(2,2246) = 80.4, p < 0.001, and daily sleep, F(1.97,1474) = 480, p < 0.001, compared to the time invested in these activities previously. Men reported more current weekly exercise (Median = 3 h) than women (Median = 1 h). This difference was statistically significant, U(59, 107) = 2075, p < 0.0001. However, these values were not statistically different from the values of their sex-matched unhealthy counterparts (Median = 2 h, p = 0.55 for unhealthy men and median = 1 h, p = 0.97 for unhealthy women). Thus, differences between men and women would be the result of physiological differences between sexes and not due to dietary habits or exercise. Even within healthy ranges, body weight, height, waist circumference, body fat and body water, arm circumference, triceps skinfold width, systolic and mean blood pressure, creatinine, uric acid, erythrocytes, hemoglobin, and hematocrit were significantly different between men and women in multiple Mann–Whitney tests with Bonferroni-Dunn correction for multiple comparisons (see Supplementary Table 2). The full database including health questionnaires is available at https://www.c3.unam.mx/health/.
All samples and anthropometric measurements were obtained in fasting conditions from 7:00 to 9:00 a.m. after a medical check-up. Anthropometric measurements and vital signs were taken using following established protocols by trained medical personnel. A total of 50 variables related to anthropometry, bioimpedance, hematic biometry, and blood chemistry were assessed (see list of variables in Tables 1, 2). The database also comprises 12 derived variables widely used to define meaningful relationships between variables (formula to evaluate derived variables are given on Supplementary Table 1). The dataset used for the methodology and data analysis is available in Barajas-Martínez et al. (2021). Healthy men and women individuals were selected from the original sample by clinical diagnosis by medical doctors, clinical history, and using thresholds established in the literature to differentiate between normal values and abnormal values (Tables 1, 2). Based on current medical understanding, these thresholds are not meant as a diagnostic of illness, but rather are sufficiently stringent to suggest the increased risk of an individual to contract a disease. After screening using these healthy control, two groups were selected: one of 81 men, and another of 117 women (databases available on Supplementary Material). To ensure parity on size between groups 81 women were chosen at random from the 117 original samples. Characteristics of all anthropometric and biochemical measurements are displayed for men (see Table 1) and women (see Table 2). There is a comprehensive summary of the biochemical procedures available (Barajas-Martínez et al., 2020). The formulas employed for the calculation of derived variables are accessible in the Supplementary Table 1.
Statistical moments were calculated for all variables in order to describe fine details of their variability within the included populations. Calculations were carried out using Excel® and Origin® Pro 2020 and included the arithmetic mean (μ), standard deviation (SD), skewness (sk), and kurtosis (k). Using the statistical moments, the momentum space metric in SD-sk-κ space that indicates deviation from a Gaussian distribution was evaluated through (Rivera et al., 2016):
For a Gaussian distribution, . The reduction in standard deviation (increase in rigidity), skewness with respect to the median (symmetry measure), and kurtosis (change to more leptokurtic distributions) indicates increased rigidity of the physiological variable (Rivera et al., 2016).
For the generation of the correlation matrix of physiological variables we use a novel approach. Instead of relying on the data distribution of the limited observations of a study, whenever possible, we use the normal ranges and criteria reported in clinical guidelines and medical references (Tables 1, 2). This allows for immediate identification of values above (>1) or below (<0) the thresholds set on the best evidence present in the literature. Incidentally, some physiological variables are expected to be displaced from these international normal ranges, for example, blood hemoglobin levels are increased in individuals living in cities at high altitude. In these cases, normal ranges previously reported for these special circumstances were employed.
For each variable from the data, we obtained the normalized value Xi applying the following normalization to the original data:
where:
There are no applicable ranges or health guidelines in the literature for certain physiological variables. If this is the case, after exclusion of all unhealthy individuals, the range of data values was used for normalization.
The construction of complex inferential networks of this contribution employed and replicated the same methods as previously presented in Barajas-Martínez et al. (2020, 2021) unless otherwise specified. After the normalization procedure, each variable was identified with a node number as indicated in Tables 1, 2. The Spearman rank correlation ρ was selected as a suitable measure of correlation for the generation of the correlation matrix between physiological variables (Batushansky et al., 2016). The Spearman rank correlation is a non-parametric measure of the statistical dependency between the rank values of the variables considering a monotonic relationship (not necessarily linear) and is not influenced by normalization procedures. When missing values were present, we performed pairwise deletion without data imputation in order to use all available participants who provide data relevant for each correlation. For each pair of physiological variables, X, Y, rank (rkX,rkY, respectively), standard deviation (SDrkXSDrkY) were evaluated, and the Spearman rank correlation was calculated as the ratio between covariance (cov) and deviations:
A Student’s t distribution with (n-2) degrees of freedom was employed to test the Spearman rank correlation and the significance of its departure from zero. A p-value threshold was selected for best connectedness and modularity (Barajas-Martínez et al., 2021). In this case, significant correlations were defined using a threshold value of p < 0.05, indicating that the relation does not support the null hypothesis that the independent and dependent variables are unrelated. For the construction of this Spearman correlation matrix, Prism 8.1.2 (277), GraphPad® Software, La Jolla, CA, United States, www.graphpad.com was employed. After filtering the correlation matrix by the p-value threshold (p < 0.05), the ρ coefficients were squared in order to obtain only positive values between pairs of physiological variables, generating the adjacency matrix of the network. The resulting network is weighted and undirected. For the network construction RStudio®, an R® language programming suite and igraph package were employed (Csárdi et al., 2016; R Core Team, 2020; RStudio Team, 2020).
In short, nodes within a network can be ranked according to several interpretations of importance that fall into two different categories, radial and medial measurements (Borgatti and Everett, 2006). In this work, we used eigencentrality as a measure of influence within the network and betweenness as the measure of intermediation. This centrality indicates either the influence of nodes (radial measure) or gatekeeping (medial measure) within the network. Centrality values were obtained using the evcent and betweenness functions from the SNA package. Assortativity of these centralities, i.e., the propensity of nodes with similar centrality to link together, was calculated. To assess whether networks had overall different centrality values, Wilcoxon’s matched-pairs signed test were done. Spearman rank correlation was done to determine whether centrality values of the nodes were correlated in both networks. To showcase hierarchical arrangement from the node with highest eigencentrality, Sugiyama layout was implemented (Sugiyama et al., 1981). Nodes were placed into layers to minimize crossings. Since our networks contain cycles, the weakest links in the cycle was broken first.
Three different approaches were used to ascertain which physiological variables are more closely related within the system. First, we employed a robust approach to Principal Component Analysis using our correlation matrix, then, for the networks we used clustering algorithms and topological clusters. Principal Component Analysis was applied to the Spearman correlation matrix, then physiological variables were ordered according to the angular positions of their eigenvectors using the first and second principal components, placing the most similar variables contiguously. The order of the correlation matrix of women was selected to allow side by side comparison between matrices, as this system was more resilient.
To ascertain whether a natural aggregation of physiological variables is present in the networks, clustering algorithms were used, which is an advantage of network approaches that are not available in reductionist methods. Modularity was used to test whether these groupings fulfilled the requirement to exceed the internal edge density that would be expected in an analogous network where connections are arranged at random (Newman, 2006). The cluster detection maintained and replicated the same methodology described in Barajas-Martínez et al., 2021. In the literature, two types of clustering are recognized, topological clusters according to the placement of nodes within an energy model layout, and communities defined by appropriate algorithms grouping the vertices within a graph such that they are more densely linked to each other than to other vertices (Csárdi et al., 2016). As in the cited article, energy-model layouts such as a Linear logarithmic layout (Linlog) identify topological clusters that complement the representation of the community structure of a network (Noack, 2009; Mihaicuta et al., 2017). In this layout, distance is independent of path length, thus nodes with high collinearity are simply overlapped. For this contribution two different clustering algorithms included in the igraph package were tested, Louvain (Blondel et al., 2008) and Spinglass (Reichardt and Bornholdt, 2006). The Louvain algorithm is a heuristic method based on modularity optimization, implemented in the cluster_louvain function from the igraph package (Blondel et al., 2008). The spinglass community algorithm selects those nodes with the greatest probability to be found in the same state concurrently, with the cluster_spinglass function from the igraph package (Reichardt and Bornholdt, 2006). The results of this automated clustering were then examined against previous research with the aim of finding functional systems that best described the nodes. Various measures of clustering comparison were employed to evaluate the degree of correspondence between the two networks, namely, variation of information, normalized mutual information, and Rank Index (Rand, 1971; Meilǎ, 2003; Danon et al., 2005). In order to produce a cluster network showing the interactions between various functional clusters, as previously stated, all nodes within the same cluster were contracted into the node of greatest eigencentrality (Barajas-Martínez et al., 2021).
In order to test whether overall differences in topology were indeed present, 30 networks for men and 30 networks for women were assembled from correlation matrices that comprehended only 60 individuals selected at random each time from the original 81 healthy men and 117 healthy women. To study network resilience, and vulnerability, the NetSwan package was used. Differences between networks were tested with a paired Friedman’s test and Dunn’s post hoc test. The topological properties were evaluated as follows: the density of the network, reciprocity and characteristic path length were calculated using the igraph package. The DirectedClustering package was used for the calculation of the weighted transitivity and the clustering coefficient of these undirected weighted networks (Clemente and Grassi, 2018). As calculated by qgraph the small-world index, a measure that describes the relation between the clustering coefficient and the mean pathlength in a network against what would be expected in a random network, was used as a summary metric of the network topology (Watts and Strogatz, 1998).
Significant differences on the physiology of men and women were found using two complementary analysis: a univariate physiological time series study carry-on in heart rate variability (section “Analysis of Heart Rate Variability Using the Physionet Fantasia Database”) and a systemic approach by a physiological network construction (section “Physiological Network”).
Heart rate records from Fantasia database were analyzed using the time intervals between R peaks on the electrocardiogram (RR) considering four groups: young women, young men, old women, and old men. Statistical moments are shown in Figure 3, and reported in Supplementary Table 3. RR mean values are higher for young men than for young women (p < 0.05), while for older men and women no differences are found, both groups have tachycardic records (see Figure 3A). Variability of RR (measure by the standard deviation) is higher on young men compare young women, and older women have more robust heart rate because they show the lowest variability of all the groups (see Figure 3B). RR distributions are not symmetric as shown in skewness plot (Figure 3C). With respect to the skewness, there are no differences between men and women, however, RR is more asymmetric for older subjects. Additionally, there are significant changes observed between sexes in kurtosis, but for older subjects the RR distributions are leptokurtic (see Figure 3D).
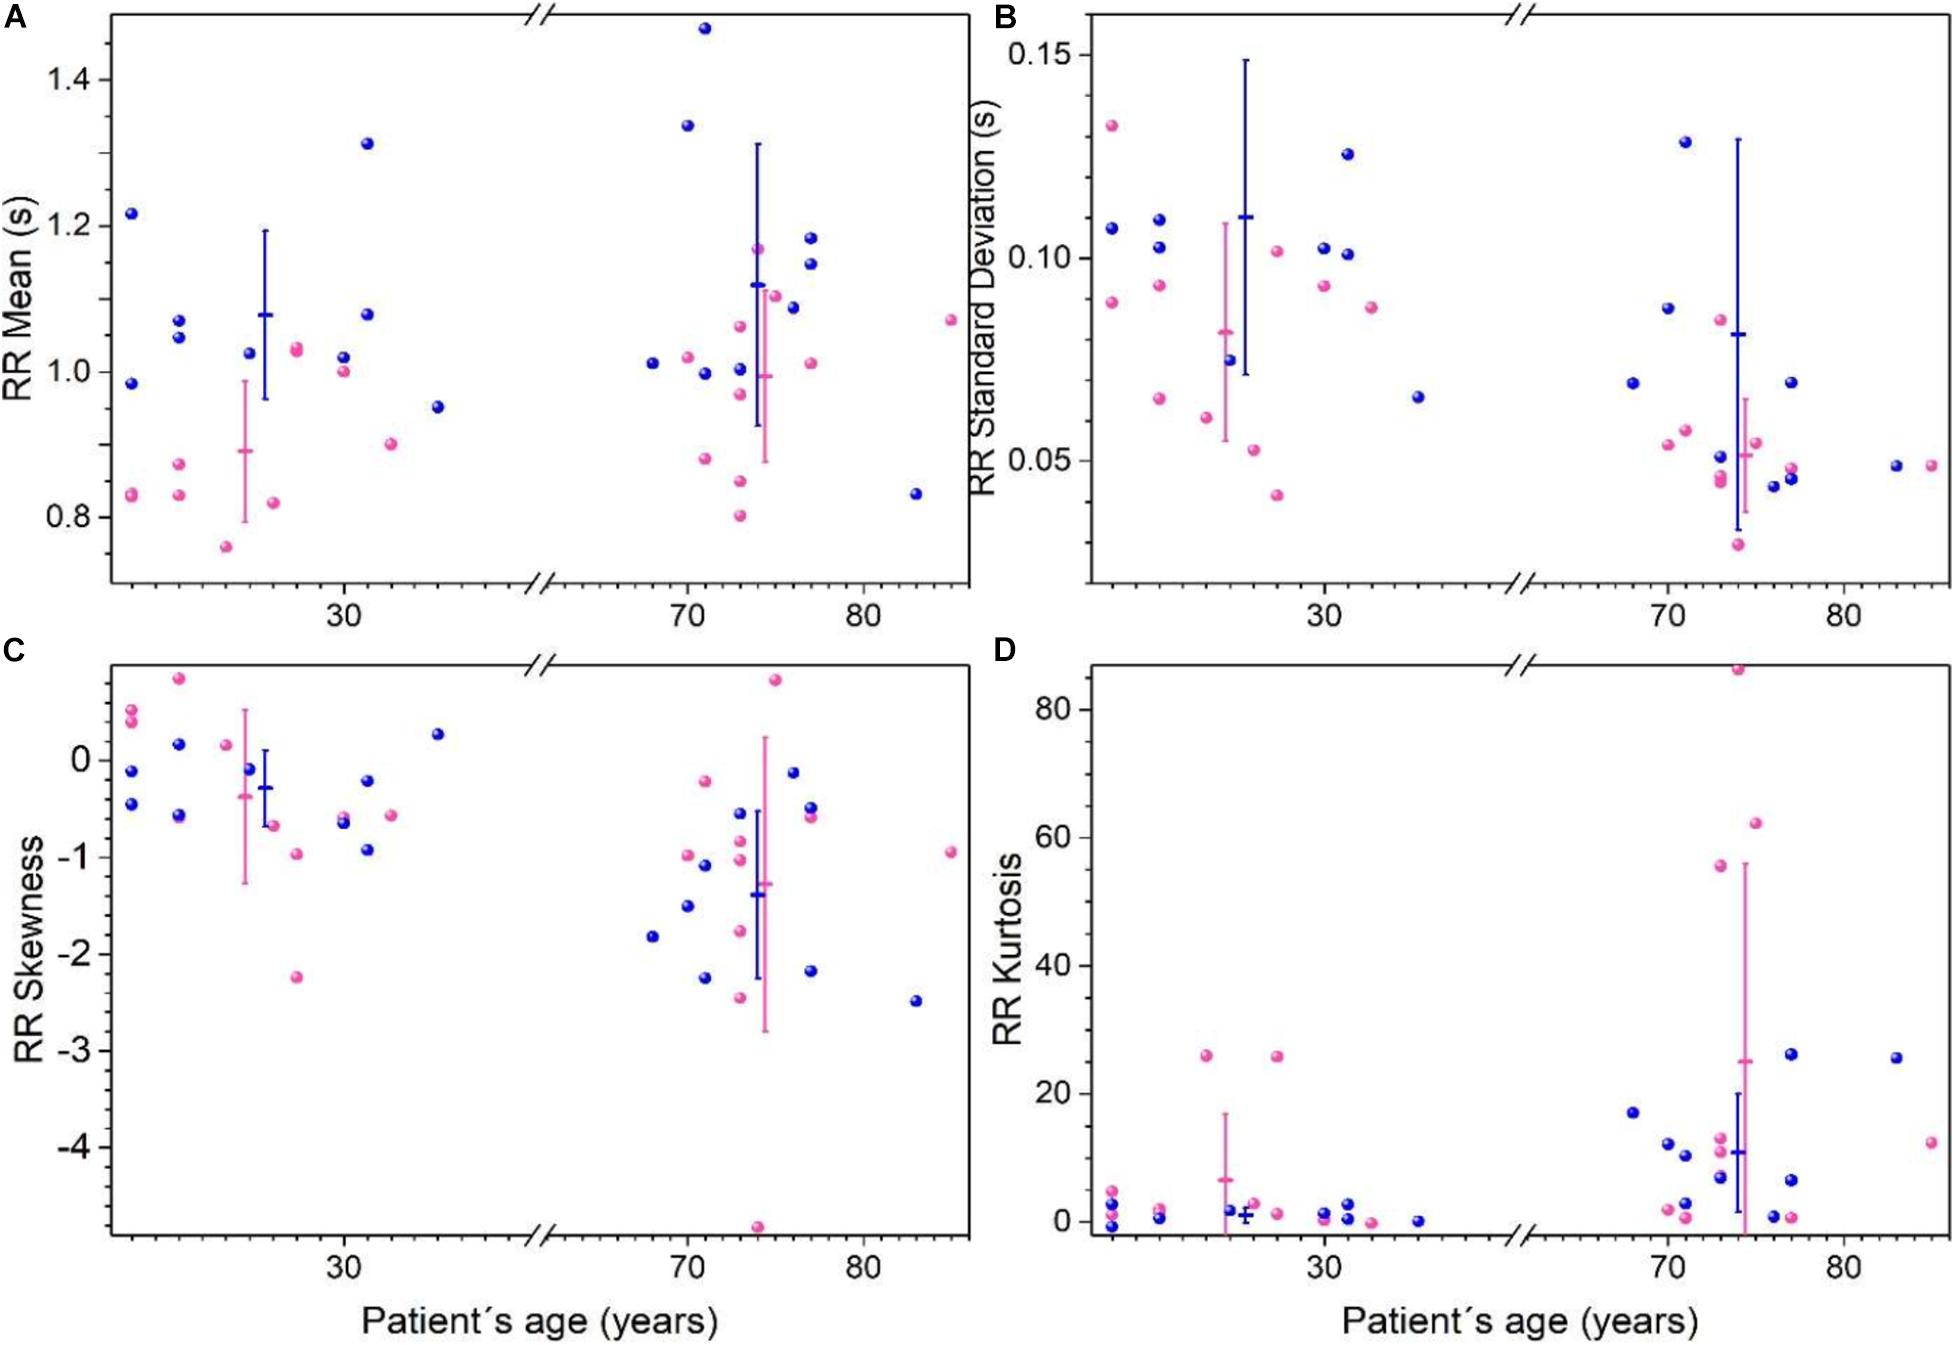
Figure 3. Statistical moments of time series of the RR heartbeat intervals from Physionet’s Fantasia database. Each point corresponds to data from a women (pink) or men (blue) subject. For each group (women, men, young, and old) the mean of each parameter ± the standard deviation is plotted for RR average (A), standard deviation (B), skewness (C), and kurtosis (D). (Adapted from Lavin-Perez and Rivera, 2018).
Poincare’s plots are shown in Figure 4, Shannon’s entropy and measures of the 95% ellipse (SD1, SD2, and eccentricity) are given in Supplementary Table 4. For young subjects, RR short-range correlations measure by Poincare’s ellipse SD1 is greater in men, and this variability is reduced with age, for old subjects, there is no sex difference (Figure 4A). The long-term deviation of the RR time series measure by Poincare’s ellipse SD2 is greater in young men, and is reduced in older men (Figure 4B). Shannon’s entropy is shown as a complementary approach to characterize the variability of heart rate. Interestingly, this measure is similar in young men and women, and remains high for older women, but is decreased for older men (Figure 4C).
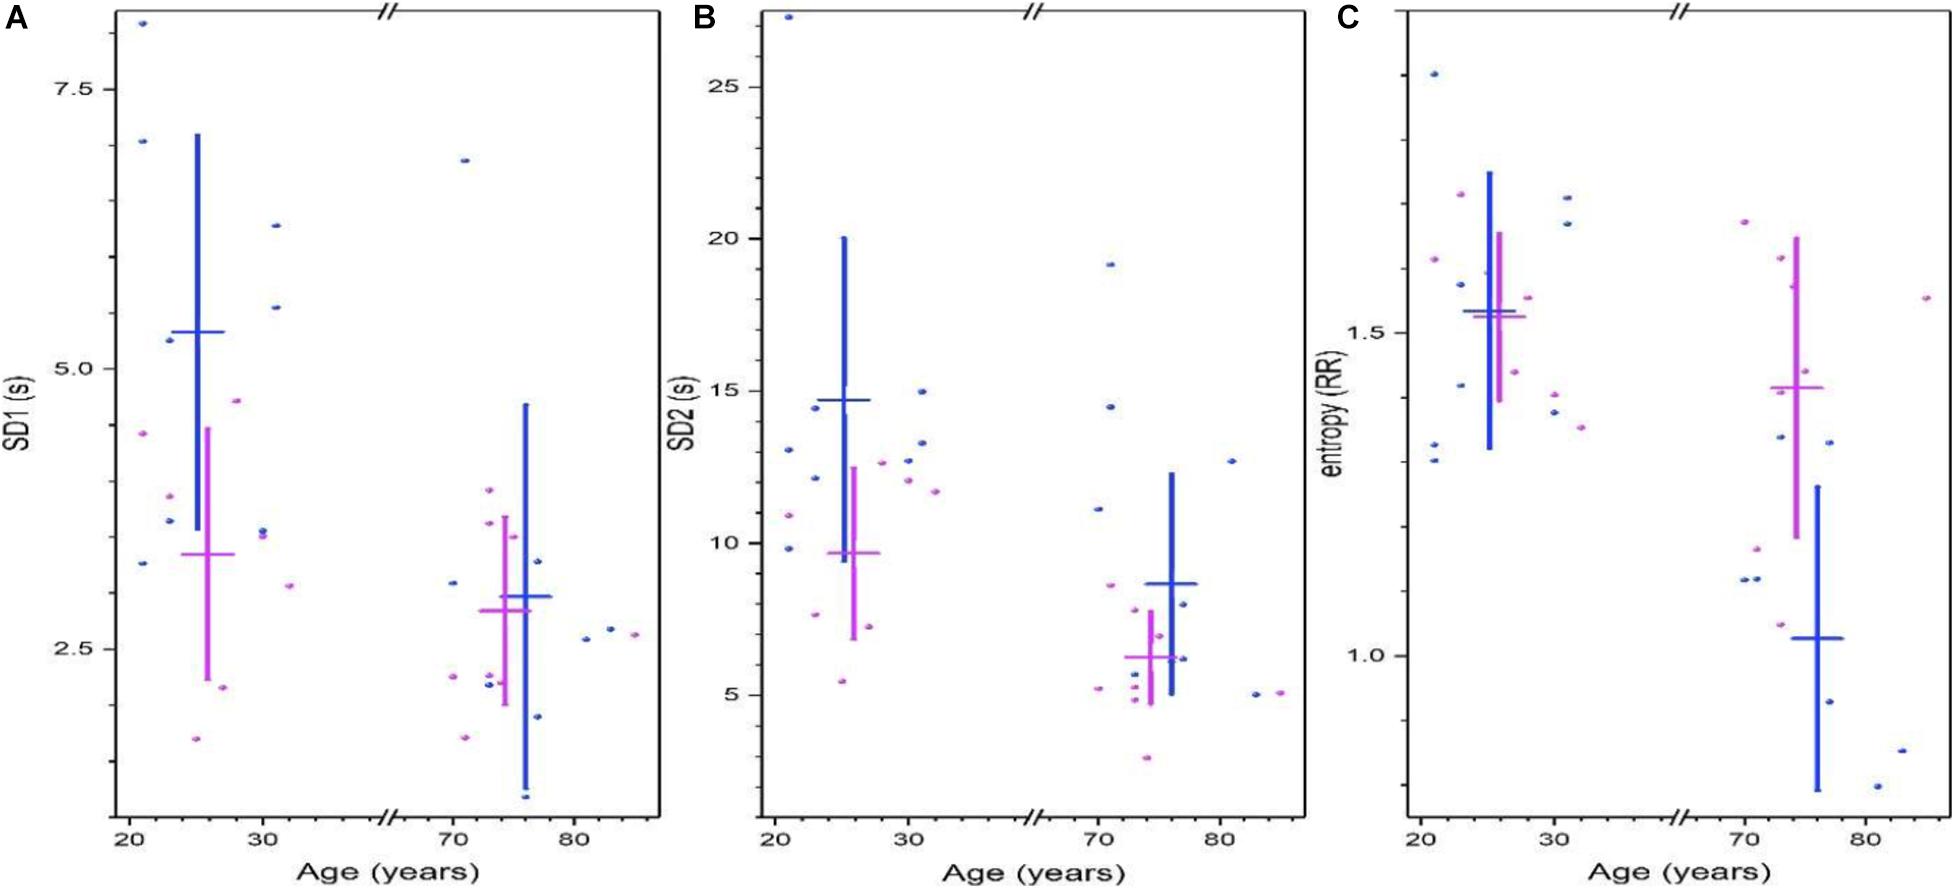
Figure 4. Non-linear analysis of heart rate variability from Physionet’s Fantasia database. Parameters of the 95% Poincare’s ellipse of the data SD1 (A) and SD2 (B). Shannon’s entropy is shown in (C). For all graphics. Each point corresponds to data from a women (pink) or men (blue) subject, while vertical lines correspond to the mean ± the standard deviation for each group (women, men, young, and old). (Adapted from Lavin-Perez and Rivera, 2018).
The construction of physiological networks based on the Spearman correlation analysis provides characteristics that describe the regulation of physiological systems. They indicate the degree of robustness that is established in the relationship between different variables, and their grouping. As seen in the unfiltered correlation matrix, networks of men had a tendency to display stronger positive and negative correlations, and higher modularity, while women had less modularity (Figure 5). After applying the threshold, the topology shows the type of connections, their density and whether they are within-cluster (intra) or between-clusters (inter), which is of particular interest. Different physiological networks result for men and women (Figure 6). The resulting topological characteristics for these networks are summarized in Table 3. The size of these networks is fixed to the number of physiological variables surveyed. The degree distributions of the network of men and women were significantly different by Kolmogorov-Smirnov test (D = 0.4478, p < 0.0001). Connectedness was higher in the network of women, while efficiency was similar for both networks (Figures 7A,F). The physiological network of women had more edges and consequently greater density (Figure 7B). On the other hand, the characteristic path length, diameter and Freeman centralization for betweenness, all measures that depend on the path structure of the network, were similar. The average clustering coefficient is greater in the network of women and the differences add up to result in a greater small-world index in men (Figure 7). Consequently, modularity was higher in men than in women (Figure 7D). These characteristics provide information on the mechanism and regulation of a physiological system, suggesting that the physiological networks of men, being more small-world, are consequently more adaptable. These topological differences are reflected in the centrality measures of the nodes. Particularly, the nodes in the network of men had greater eigencentrality values than in the network of women (W = −690, p < 0.05), but betweenness values remained comparable in both networks (W = 92, p = 0.7). Regardless of these differences between networks, there was a significant correlation of eigencentrality (ρ = 0.61, p < 0.0001), and betweenness (ρ = 0.42, p < 0.001). This indicates that the role of each physiological variable either as an influence or as an intermediary remained similar both in men and women. When comparing clusters between the networks of men and women there was similarity (Table 4). All these elements suggest that while topological structure is quite different, the role of physiological variables and their association within the network remains similar.
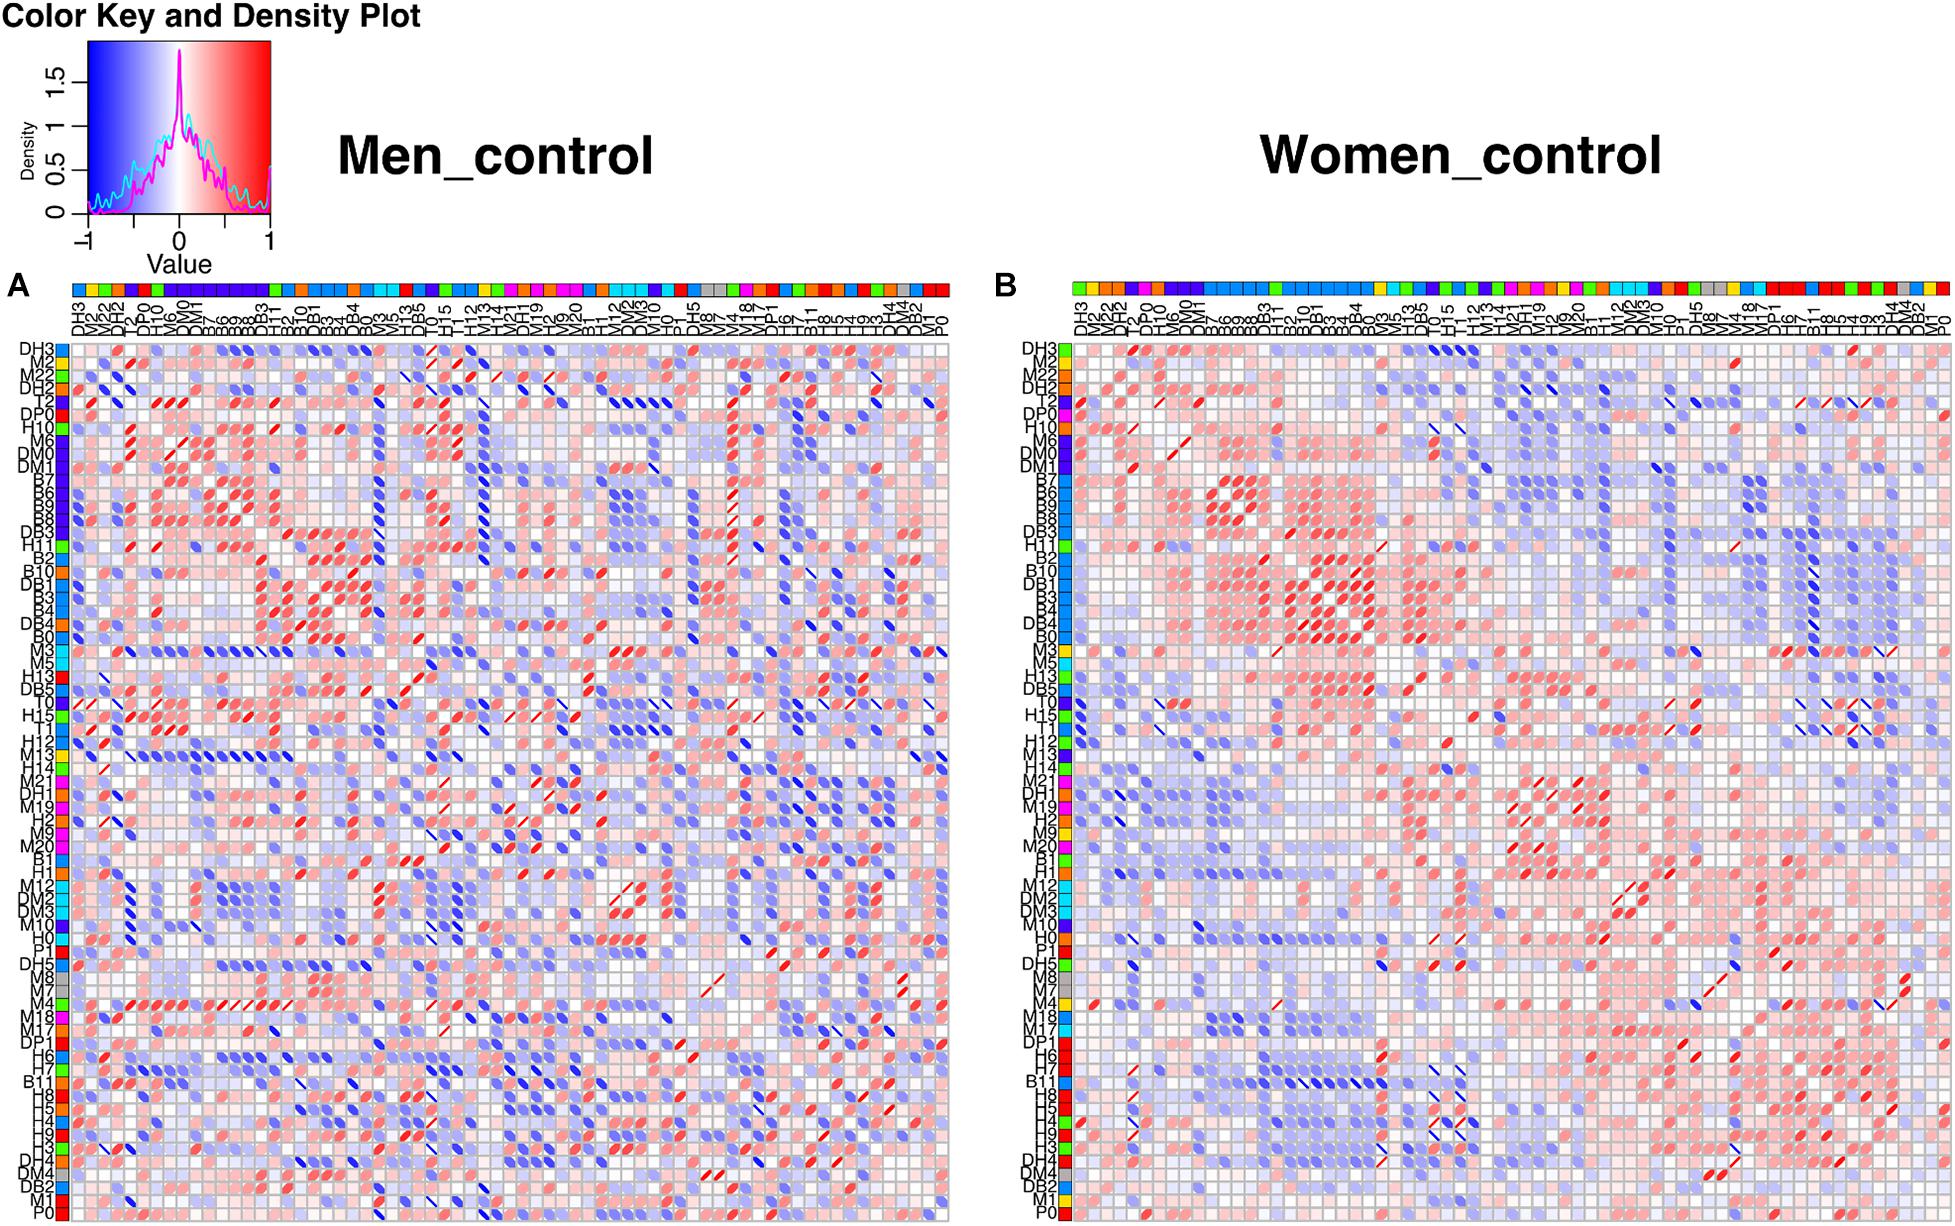
Figure 5. Unfiltered correlation matrix of men and women. Spearman correlation matrices are shown as heatmaps for men (A) and women (B). The density plot for the correlations is presented in the upper left side, for men (cyan) and for women (magenta). Columns and rows are ordered according to the angular order of the eigenvectors of women matrix. The network clustering is shown in colors to the right of the labels of the physiological variables. Spearman correlations are presented as ellipses. Positive correlations are shown in shades of red while negative correlations are shown in shades of blue.
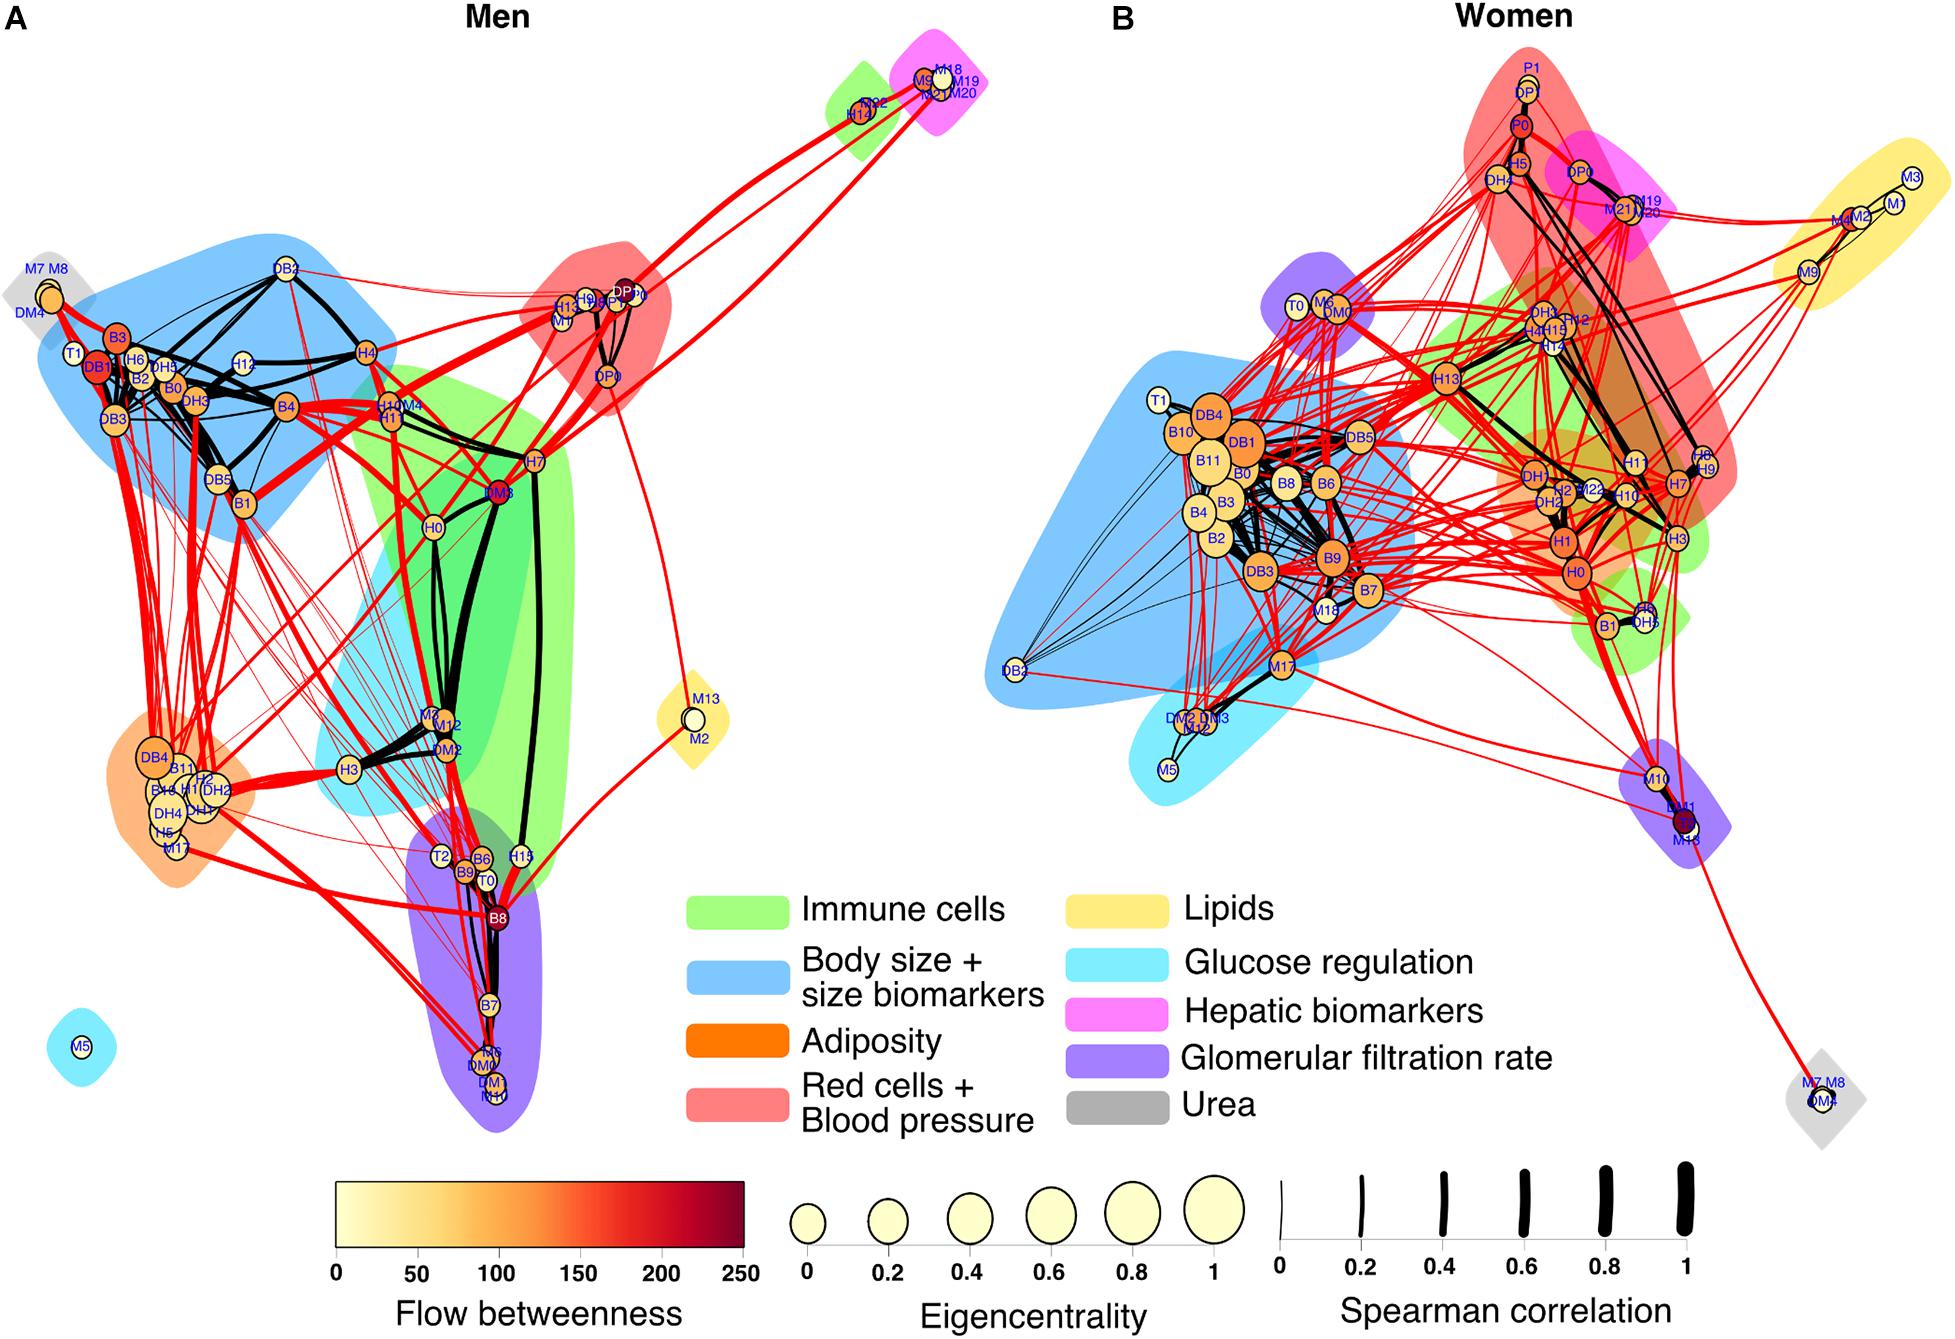
Figure 6. Physiological networks of men and women. The physiological network of men (A) and women (B) are represented using a Linlog force-directed model. Node size indicates the eigencentrality and node color the flow betweenness. Color clouds show nodes clustered together using the Louvain algorithm. Link width represents the strength of the Spearman correlation between physiological variables. Intercluster links are highlighted in red, whereas intracluster links are black.
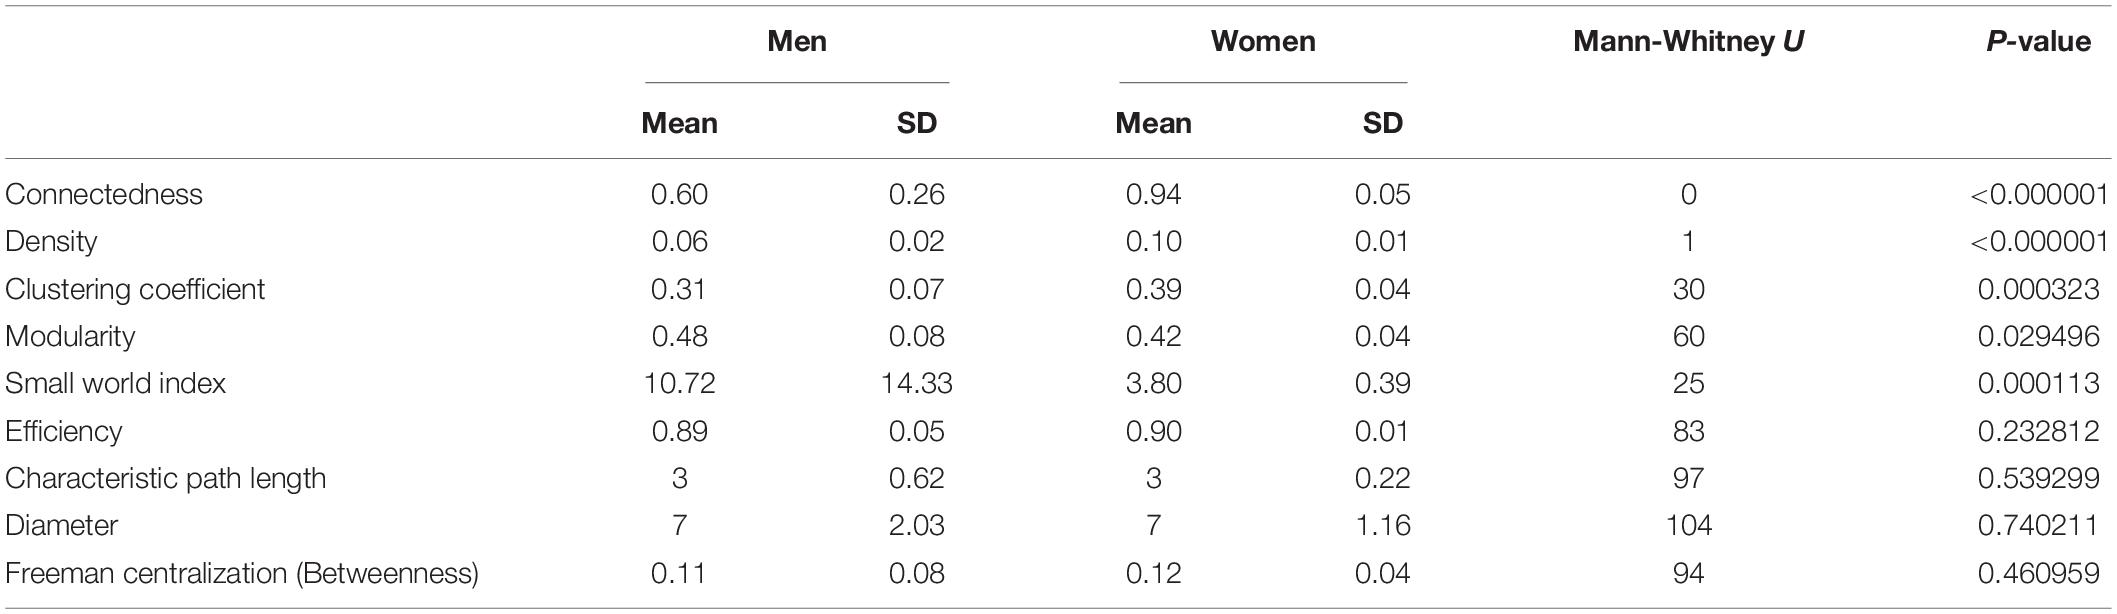
Table 3. Topological characteristics of the physiological network for men and women.
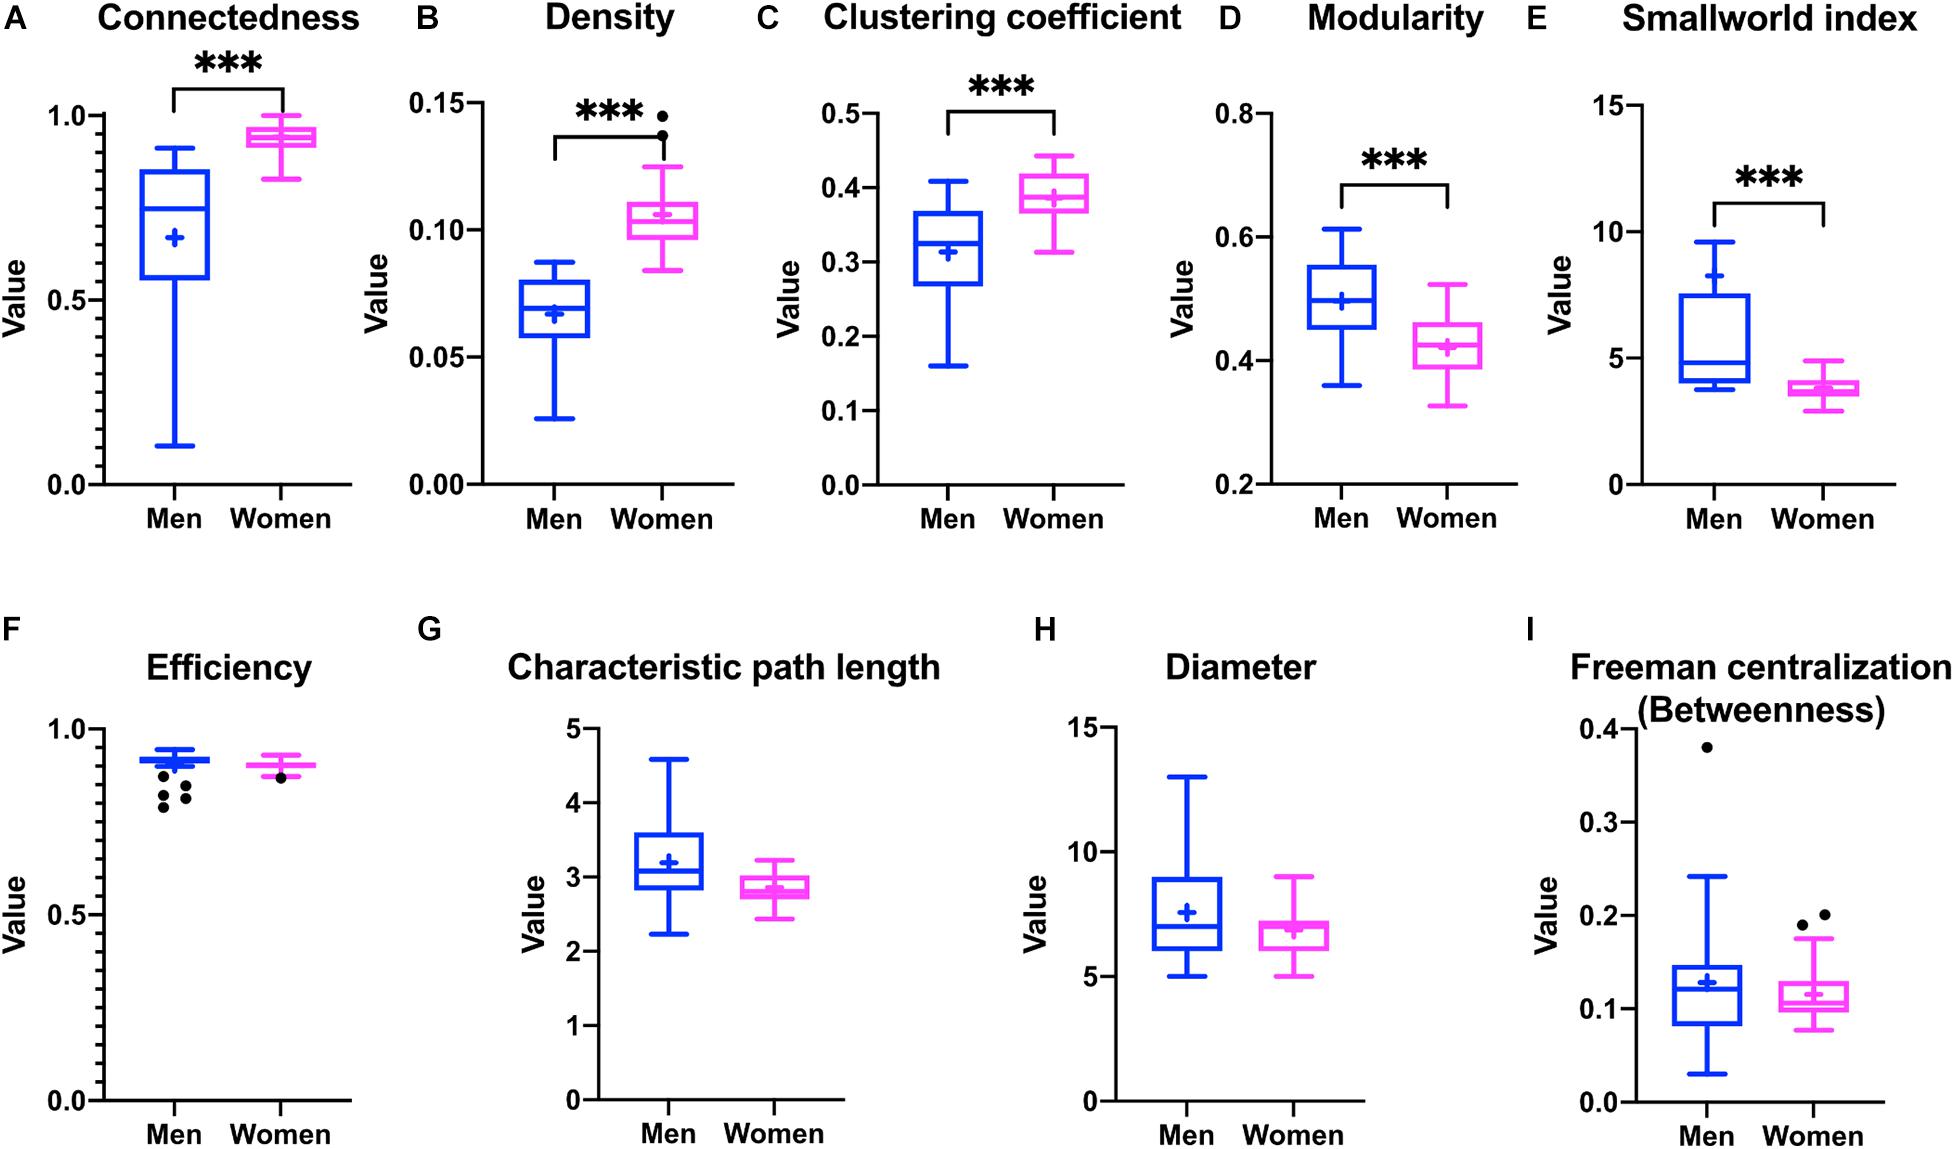
Figure 7. Differences in the topological characteristics of the networks for men and women. Differences in connectedness (A), density (B), clustering coefficient (C), modularity (D), smallworld index (E), efficiency (F), characteristic path length (G), diameter (H), and betweenness Freeman centralization (I) are shown between the physiological networks of men and women. Statistical significant difference is indicated by ∗∗∗ if p < 0.001.

Table 4. Comparison of clusters in the physiological networks for men and women.
Of particular interest for this work is to observe the differences between a typical network of healthy women versus healthy men. A differential network highlighting the presence or absence of each edge in the networks shows how interactions between physiological variables and clusters contrast (Figure 8). There 90 robust links that are present in both men and women from a total of 426. These correlations between physiological variables were strong and independent of sex. The physiological network for women has greater density, which appears readily in the larger number of exclusive links (221) than for men (115). However, there was no statistical difference between the strength of the nodes in the physiological network of men and women (W = −240, p = 0.5).
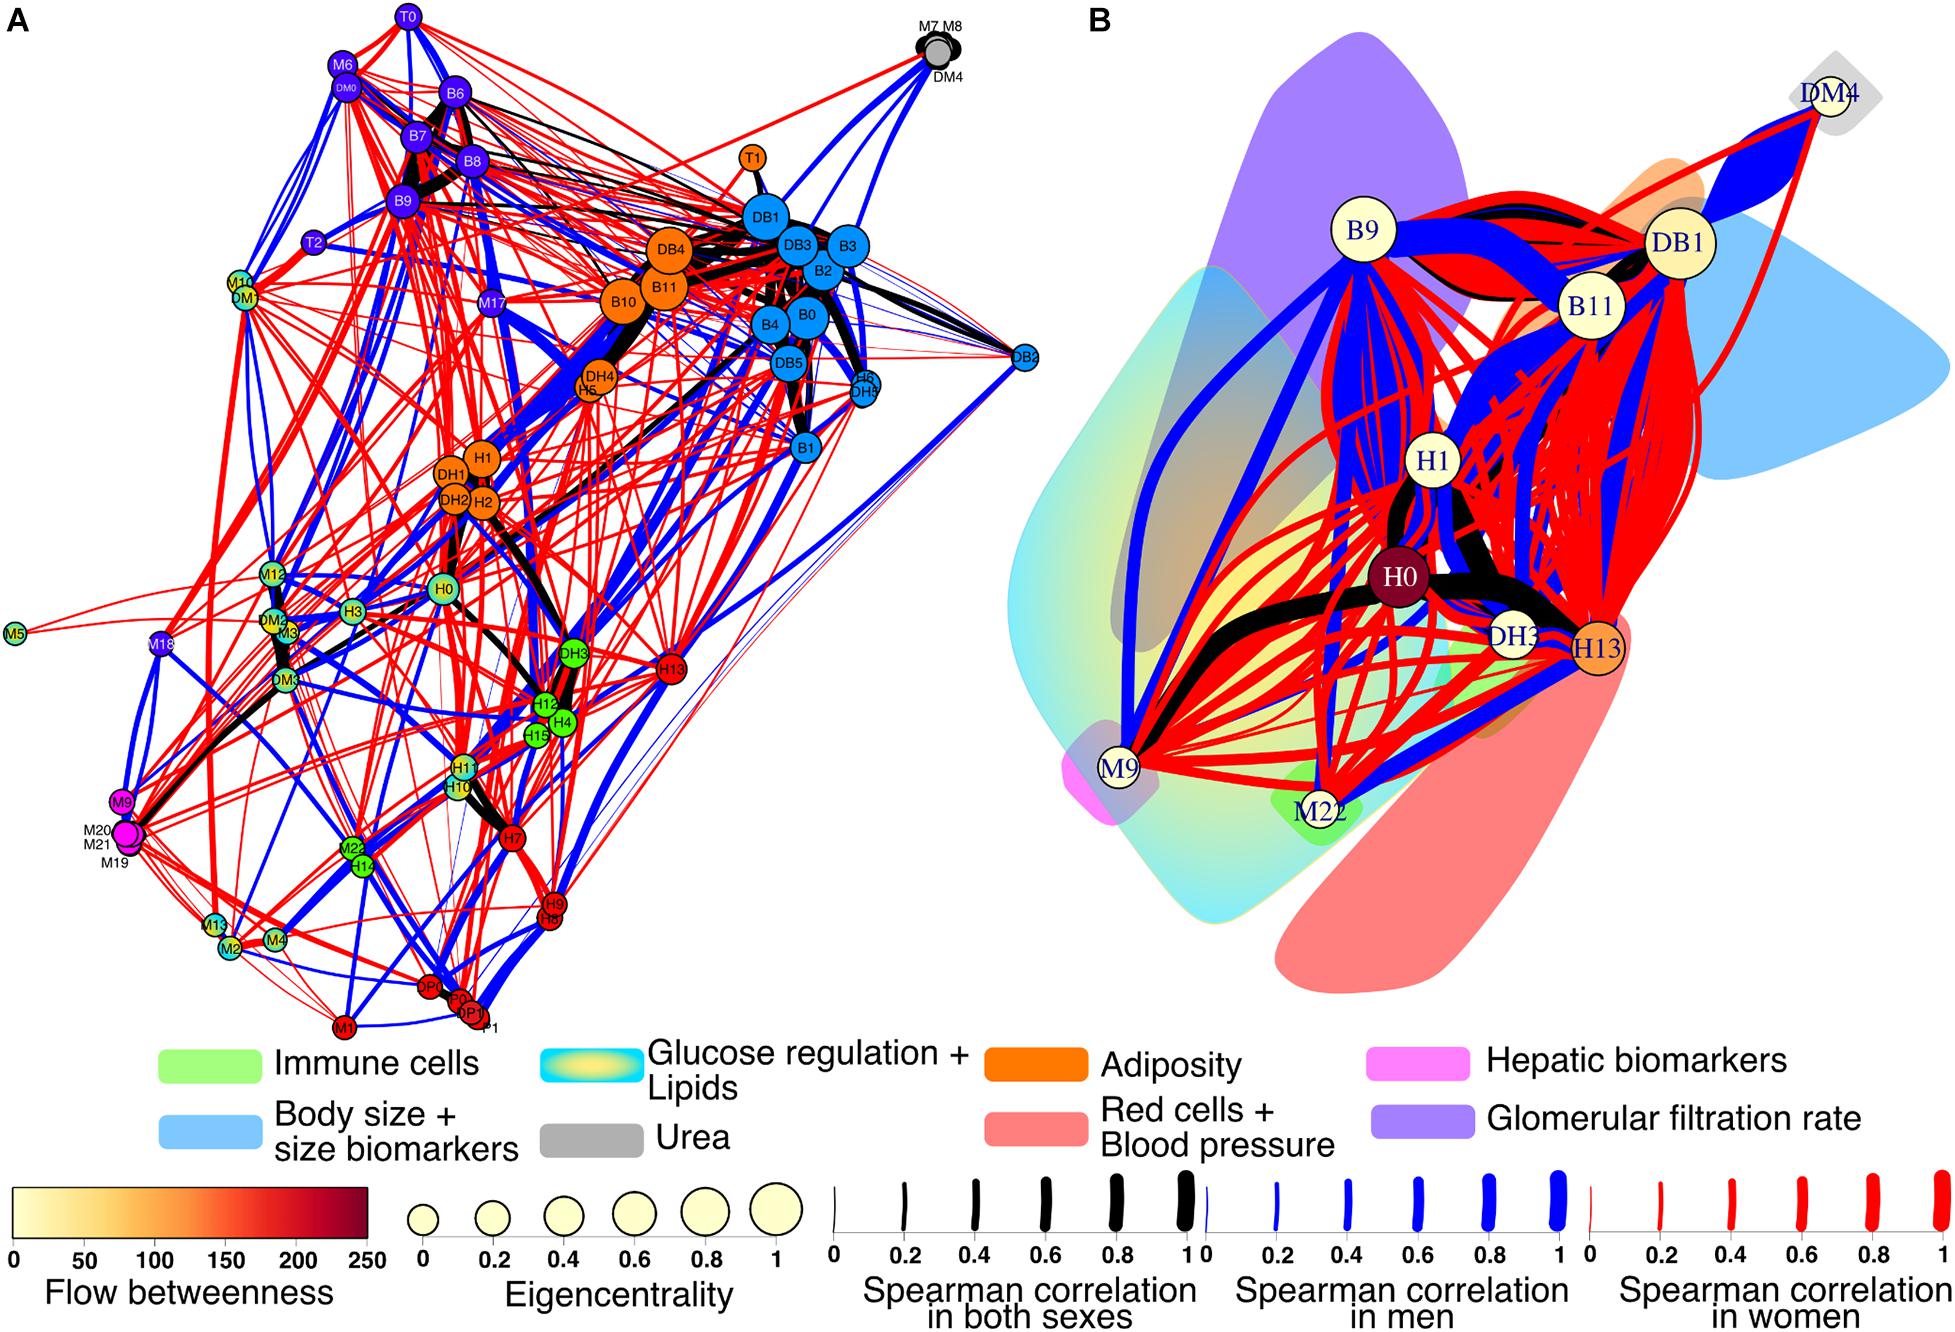
Figure 8. Differential physiological network. To showcase the differences between men and women, the physiological networks were superimposed onto an undirected network (A). Links found in both networks are black, while blue links are present only in men and red only in women. The width of the links represents the strength of the correlation between physiological variables. Nodes are colored according to the clusters. For the cluster network (B) all nodes within the same cluster were contracted into the node of greatest eigencentrality. The color cloud represents the original area of the cluster. The eigencentrality and flow betweenness of each cluster are also shown.
Several differences were apparent in the network and the cluster network (Figure 8). For instance, the urea/creatinine ratio (DM4) cluster is closely related to the body mass index, BMI (DB1) cluster only in men, while in women it is related to estimated glomerular filtration rate (DM1) node. Insulin (M6) and HOMA index (DM0) were correlated with serum creatinine (M10) and estimated glomerular filtration rate (DM1) in men, but not in women. In men, blood pressure related variables (P0, P1, DP0, and DP1) are strongly related to erythrocytes (H7), hemoglobin (H8), and hematocrit (H9). In men, plycometric measurements of tricipital (B5), bicipital (B6), suprailiac (B7), subscapular (B8) skinfolds are correlated with metabolic variables HDL cholesterol (M3), glycosylated hemoglobin HbA1c % (M12), and estimated average glucose (DM2), but not in women. Conversely, variables within the body fat (B9) cluster are related to neutrophil variables, total neutrophils (H1), segmented neutrophils (H2), neutrophils percentage (DH1), and segmented neutrophils percentage (DH2) only in women. As shown in the cluster network, the red cell distribution width (H13) cluster has plenty of connections with the BMI (DB1) cluster only in women. For men, several connections are present between the body water (B10) and the total neutrophils (H1) clusters, relating bioimpedance measurements body fat % (B9), body water % (B10), and body fat in kg (DB4) with the neutrophil variables H1, H2, DH1, and DH2. Finally, the neutrophils H1 cluster is connected in women with the uric acid (M9) cluster that also comprises bilirubin variables, total (M19), direct (M20), and indirect (M22).
When arranged hierarchically with the Sugiyama layout, nodes with the greatest eigencentrality were body water % (B10) for men and BMI (DB1) for women (Figure 9). From these central nodes, all others can be reached in 4 steps for men and 5 steps for women, as shown by the number of layers, with the exception of glucose (M5) which is an isolated node for the network of men. There was a significant correlation between the hierarchical arrangement of both networks (ρ = 0.43, p < 0.001), indicating that the physiological variables were organized similarly in men and women. For the network of men, the nodes with greatest betweenness were subscapular (B8) and mean arterial blood pressure (DP1), while for women it was BMI (DM1). Assortativity is also apparent in this layout where nodes with the greatest eigencentrality are closer both in men (0.62) and women (0.47). Overall anthropometric physiological variables had both greater eigencentrality and are higher in the hierarchy than all other variables in both networks. Interestingly, some variables related to immune cells measured in the hematic biometry are peripheric in men, but more deeply located in the network of women.
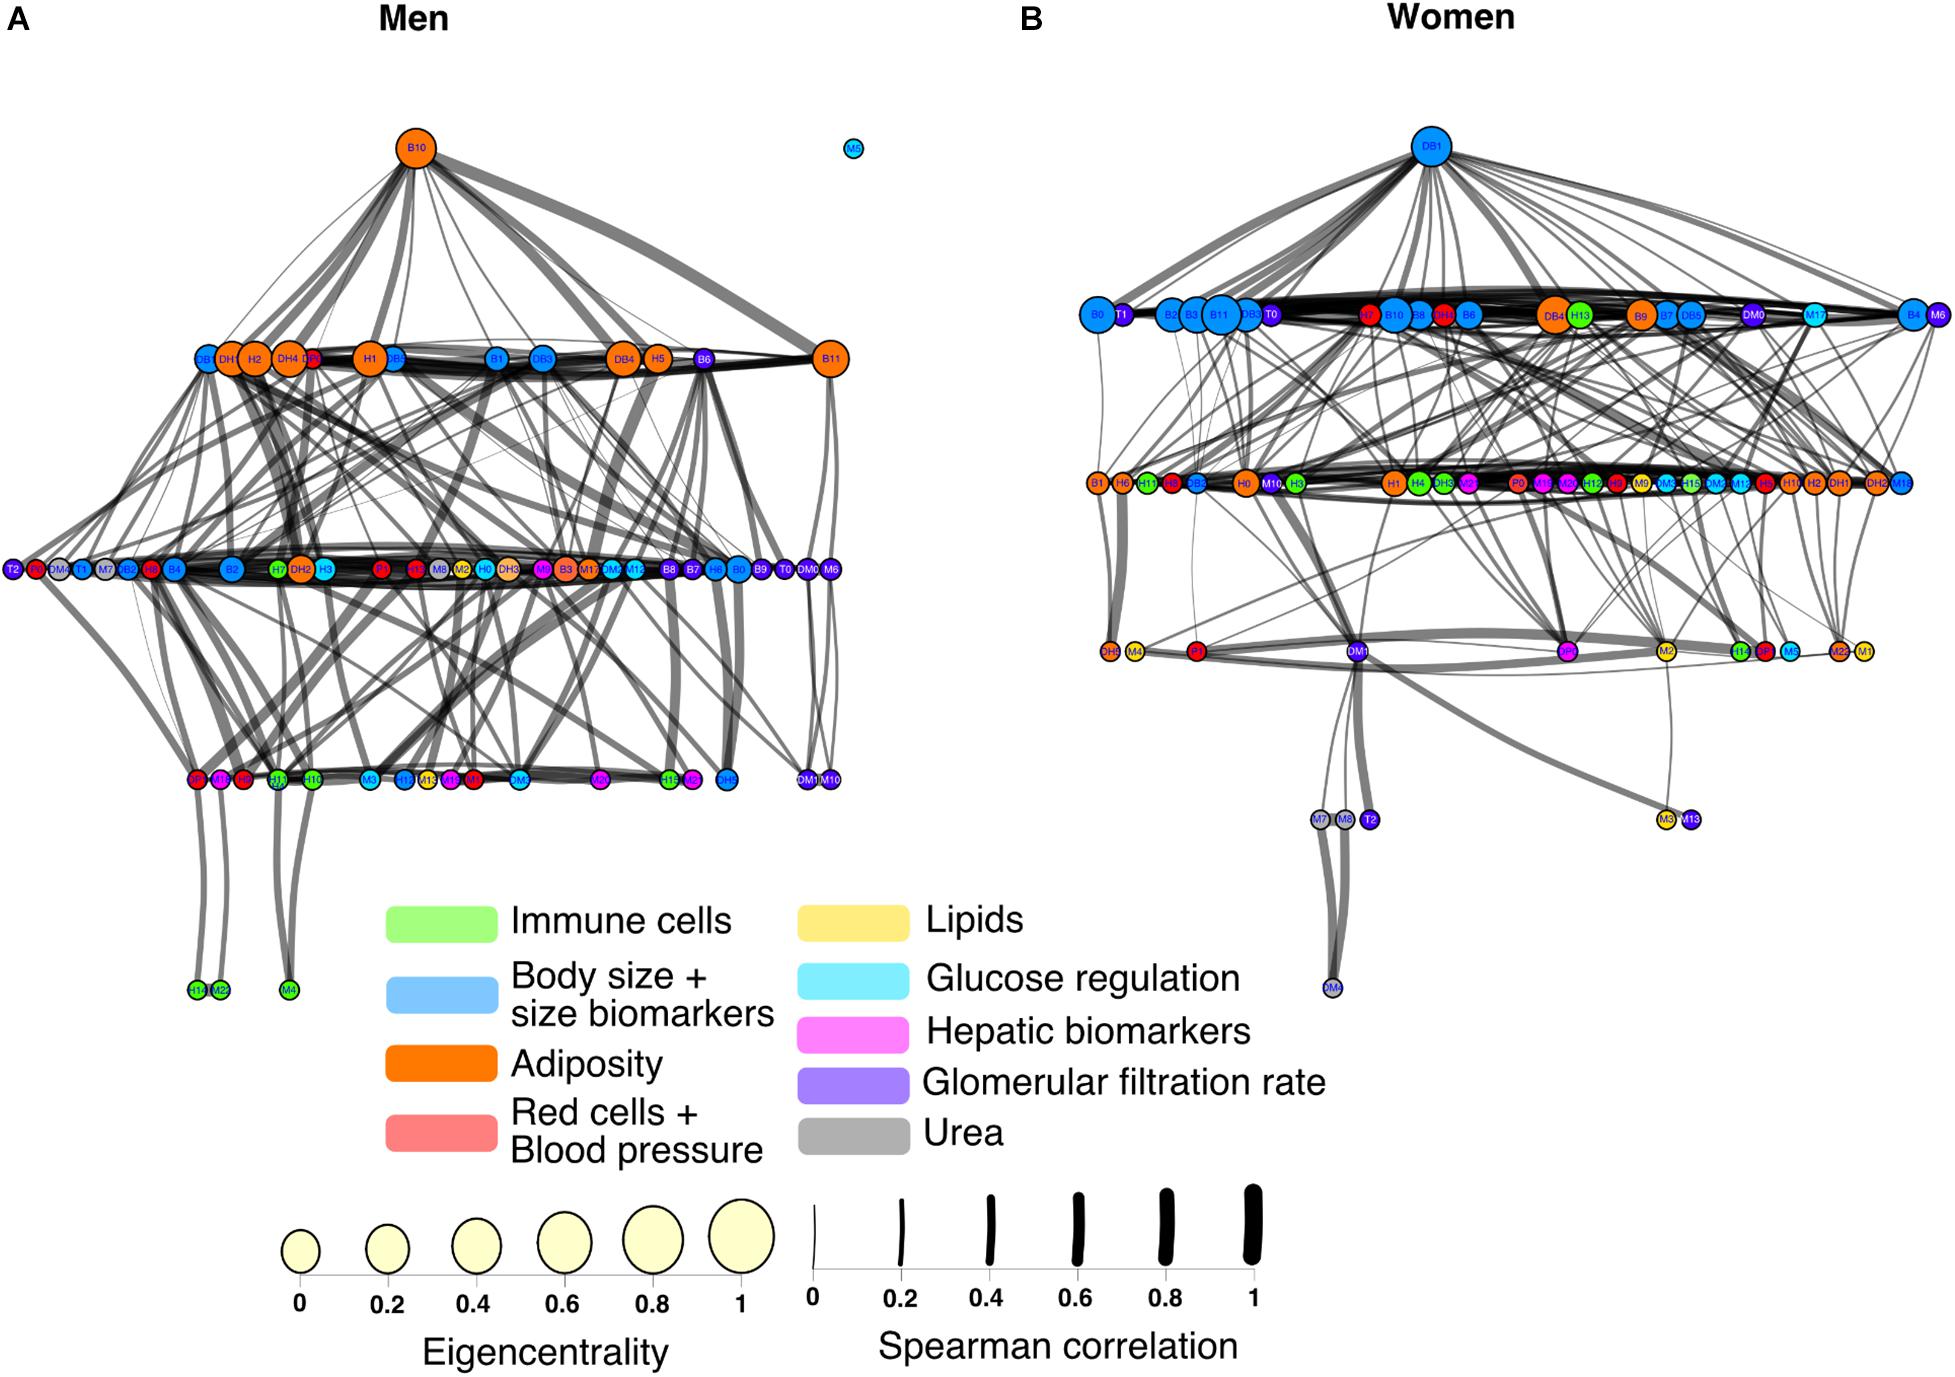
Figure 9. Hierarchy of physiological networks of men and women. The corresponding physiological networks are laid out hierarchically with the Sugiyama algorithm for men (A) and women (B). Nodes are ordered into layers according to eigencentrality and placed to minimize crossings. The color of the node indicates the cluster to which it belongs in the network.
Finally, to better describe the network strengths and weaknesses, nodes were removed either at random or as a directed attack guided by degree, betweenness, or cascading (Figure 10). Characteristic of complex networks, directed attacks resulted in greater loss of connectivity than random removal of nodes. There were no differences in susceptibility to random failure between men and women, as expected. However, the physiological network of men was more vulnerable to directed attacks than the network of women. For instance, in order to obtain a loss of 70% of the network connectivity in a cascading attack, it is only required to remove 13% of the nodes for men while 21% are required for network of women. Likewise, in degree and betweenness attacks the network of men loses 70% of its connectivity with the removal of 19% of nodes, while network of women requires 30% removal. This is a result of the reduced density of the physiological network of men and how nodes with greater degree are placed within the network. Taken together, all these measures suggest that the physiological system is more resilient in women than in men.
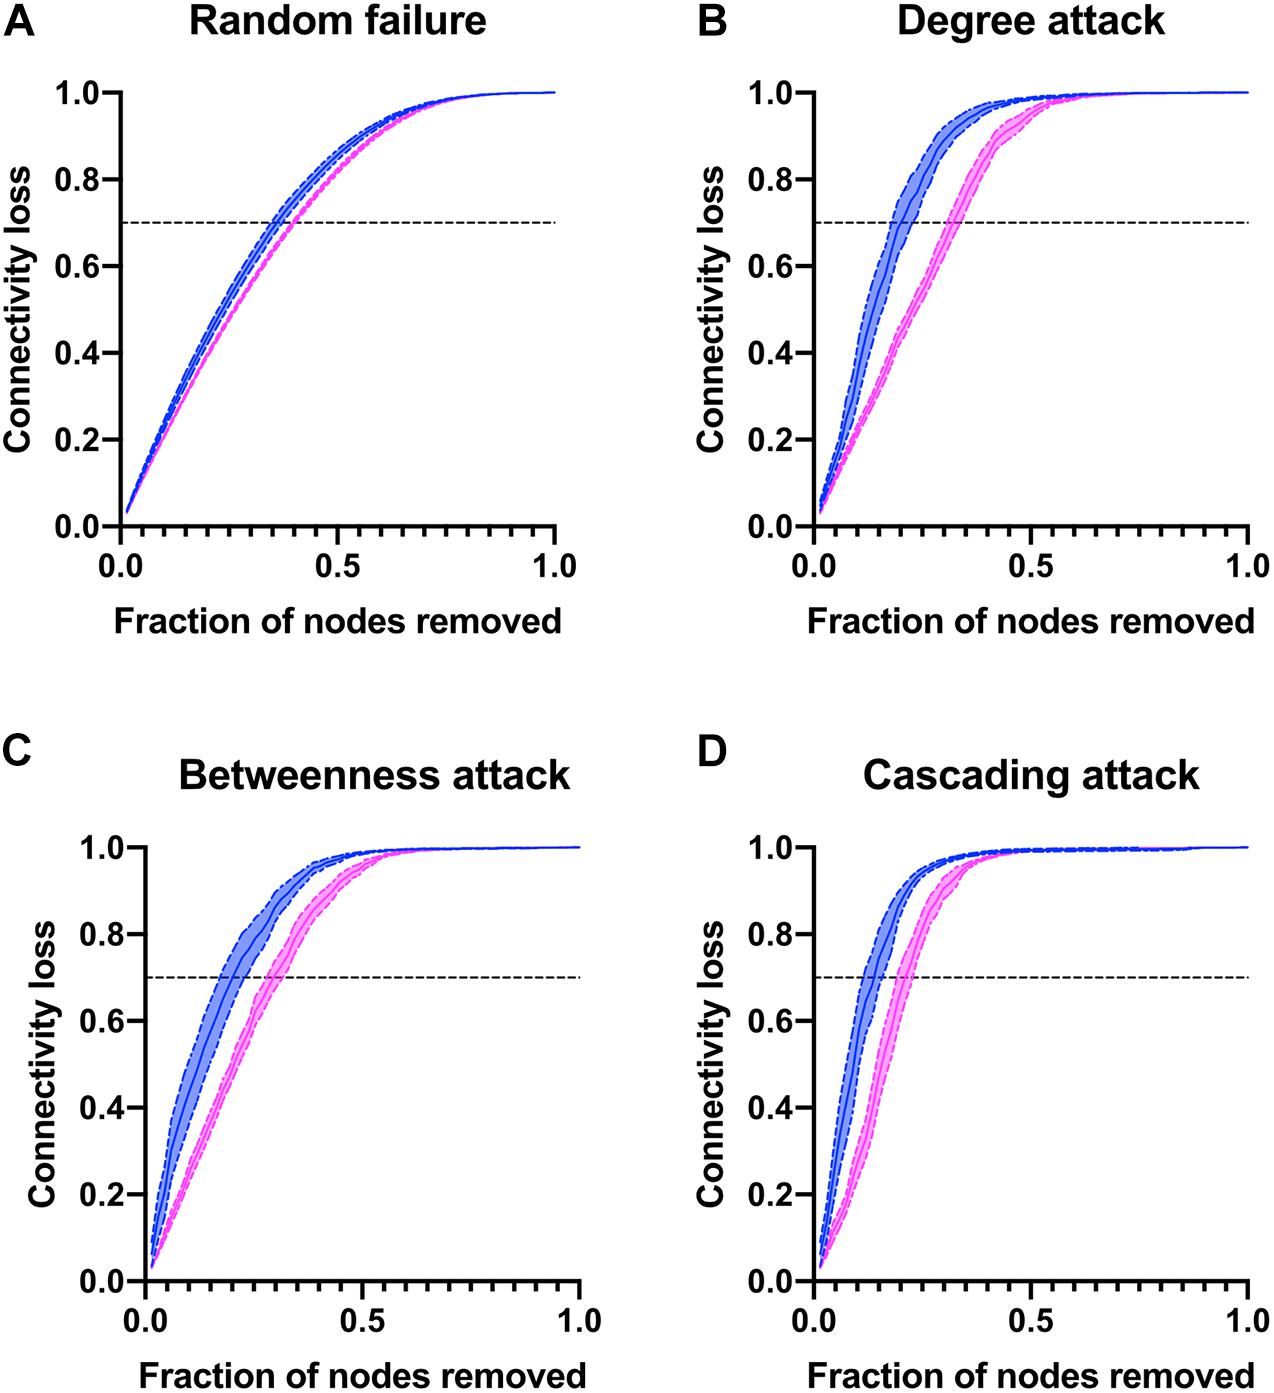
Figure 10. Network vulnerability to directed attacks. The connectivity loss is plotted against the number nodes removed either at random (A) or as a directed attack guided by degree (B), betweenness (C) or cascading (D) attacks for men and women.
Thus far, we have observed differences in resilience and adaptability between men and women through time series variability and complex inferential networks. In addition, we sought to examine these differences through certain biomarkers ratios that are recognized as variability indicators, and by the differences in distribution moments of all the physiological variables in the population (Figure 11). For instance, glucose variability, assessed through the difference between estimated average glucose and fasting plasma glucose was similar in both healthy men and women (Figure 11A). In contrast, acute muscle catabolism, assessed through the ratio between blood urea nitrogen and serum creatinine was higher for healthy women than for healthy men (Figure 11B). Finally, for most physiological variables measured, deviation from normal distribution was lower in women than in men, except for body water % (B10), body mass index (DM1), total body water (DB5), and tympanic temperature (T1) (Figure 11C). Conversely, physiological parameters related to immune cells were non-normal in men (H0, H1, H3, and H4) approached more a normal distribution in women.
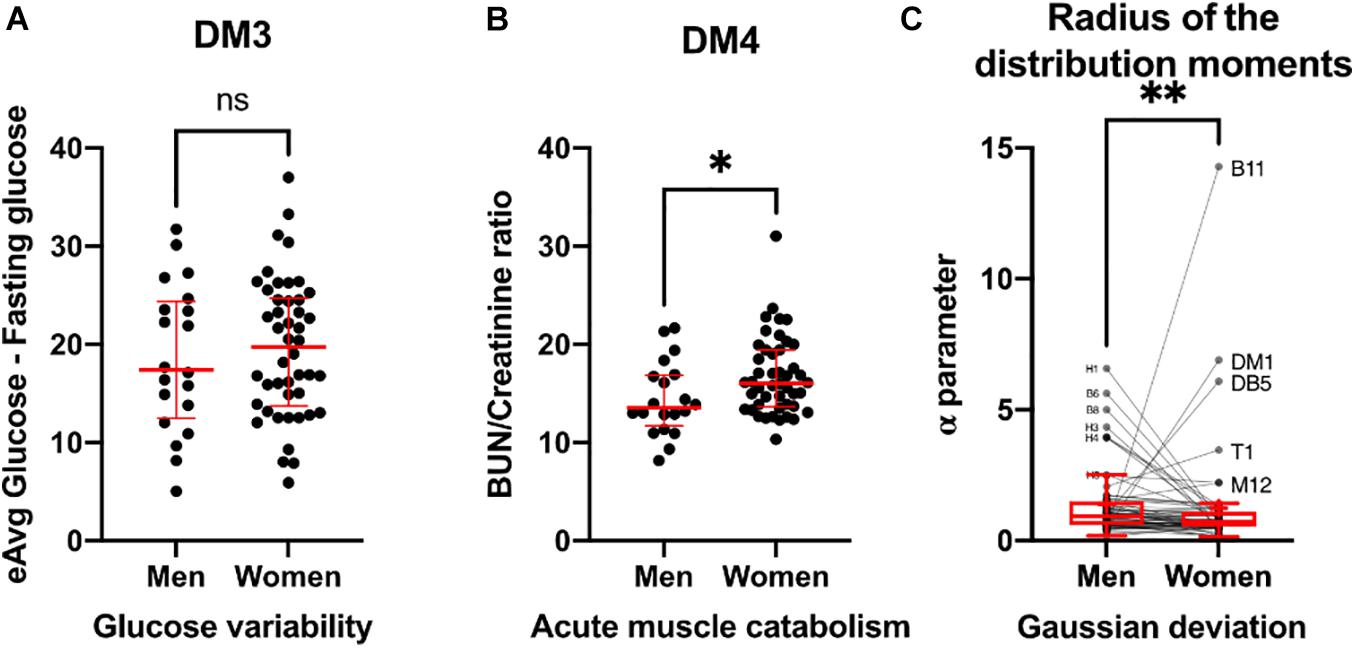
Figure 11. Biomarkers of variability. Glucose variability (A), assessed by estimated average glucose minus fasting glucose is presented as individual values (black) with median ± 95% CI (red). Acute muscle catabolism (B), and hydration state are summarized by BUN/creatinine ratio and presented as individual values (black) with median ± 95% CI (red). Deviation from Gaussian distribution (C) calculated as the radius of the distribution moments for each physiological variable is shown as individual values (black) and Tukey’s box-plots showing median and interquartile range. Physiological variables with visible separation from Gaussian behavior are labeled. Statistical significant difference is indicated by ∗ if p < 0.05, ∗∗ if p < 0.01 and ns for no difference (p > 0.05).
There is a close relationship between indices of sympathetic activity and vascular resistance in men as a function of age (Joyner et al., 2016). This relationship is absent in young women, but is noticeable in postmenopausal women. These sex and age differences are related to vascular resistance, and are the result of changes in the balance between the receptors responsible for arterial tone, i.e., vasoconstriction and vasodilation (Joyner et al., 2016). In young men, there is a relationship between neuromuscular sympathetic activity (NSA) and total peripheral resistance (TPR). However, this relationship is not associated with blood pressure, but is due to the fact that cardiac output is inversely proportional to NSA and TPR. In contrast, in young women, there is no relationship between NSA and TPR, due to the vasodilator mechanism of B-adrenergic receptors, which counteract the vasoconstriction of A-adrenergic receptors. Therefore, blood pressure is not related to NSA in young women (Joyner et al., 2016).
Sympathetic activity also affects the cardiovascular system; thus, it would produce different heart rate variability signals depending on age and sex. The cardiovascular system is one of the most regulated systems in the human body, and its study sets the tone for a great tradition of research and innovation. In the context of this characteristic integration of several systems, it has been established that significant differences occur between men and women in physiological regulation. The analysis of the time series of cardiac activity provides indicators of the functioning of the system and also of the effect of the parasympathetic and vagal modulation to which it may be subjected. The analysis of these fluctuations allows to know the state of these oscillators with respect to sympathetic and vagal modulation (Berntson et al., 1997). The analysis of the statistical moments provides indicators of the degree of rigidity or adaptability of the physiological system (Rivera et al., 2016, 2018).
For the case of Fantasia database, statistical moments shows that in young women RR is more rigid and less variable than for men, and that in old age the variability presented by men is lost, becoming a rigid system. With respect to Poincare’s plots, young men have the most elliptic distributions, related with low correlations, and old men the most linear ones indicating stronger correlations, rigid distributions. Women statistical parameters change less than the ones of men, suggesting that the heart rate variability is more “robust” and correlated.
In contrast, Shannon’s entropy for young subjects is in the same region for women and men, and it is statistically significant different between old women and men. The change of entropy between young and old women is small compare with the suffer by men. Considering Shannon’s entropy as a measure of the facility to transmit information on the time series, for a constant signal the value will be zero (that corresponds to a “death” subject), and the larger the value better information transmission will be in the system. Similar values of entropy for young subjects indicate a “good” homeostatic balance independent of sex, with aging this entropy have a slow decrease for women, but a stronger change in men, that goes for old men close to zero. This may be one of the many factors that made heart rate variability a vulnerability factor for death incidence greater in old men.
We have reported previously how node centrality measures show the role of physiological variables within the physiological networks, how these roles change with age (Barajas-Martínez et al., 2020), and how topological and algorithmic community detection reveals functional clusters (Barajas-Martínez et al., 2021). Through this methodology, we have constructed physiological networks to describe how the changes in the coupling between regulated variables and those regulatory systems that try to maintain homeostasis may differ between young healthy men and women. Here we interpret the lack of correlation as one variable not being dependent on another. Some correlations are suggestive of a vulnerability of the system to develop a pathologic state (even when all values are within normal parameters and disease onset has yet to happen), while others indicate a healthy physiological coordination. In the differential network we found sex-dependent differences in several nodes. We found that for men urea levels are correlated with BMI and related anthropometric indicators but not for women, being both equally young healthy subjects that have urea, creatinine, and eGFR within the normal range (Figures 6, 8). Likewise, for men creatinine was related to insulin and HOMA, but not for women. This is notable in the context of the urea/creatinine ratio, an indicative of acute muscle catabolism, being higher for women (Figure 11). This reinforces the hypothesis, as previously suggested in the literature, that men have a greater difficulty in maintaining homeostasis between food intake and uremic solute clearance for the same level of eGFR (Nitsch, 2014). Another difference we found between sexes was the correlation between blood pressure and hemoglobin in men (Figures 6, 8). This correlation has been found for both men and women in a large cohort of Dutch voluntary blood donors and was attributed to erythropoietin, renin-angiotensin-aldosterone system or the mechanic effects of blood viscosity (Atsma et al., 2012). It is possible that a larger sample is required to observe the effect on both sexes, or that the age difference with our sample is behind this discrepancy. Nonetheless, we notice that both erythropoietin responsiveness and renin-angiotensin-aldosterone have sex differences that may also play a role (Ifudu et al., 2001; Komukai et al., 2010). Only in men, plycometric measurement of skinfolds was correlated with HDL, estimated average glucose and HbA1c (Figures 6, 8), even when both sexes had similar glucose variability (Figure 11). Glucose and lipid metabolism are directly modulated by sexual hormones, resulting in different combinations of the clustering of metabolic syndrome factors (Regitz-Zagrosek et al., 2007; Kuk and Ardern, 2010). Finally, we observed different correlations of neutrophils in men and women. While neutrophil variables were associated with insulin, HOMA and plycometry in women, they were correlated with body composition measurements by bioimpedance in men. This may be due to differences in the adipose tissue patterns that depend on sex, with subcutaneous fat being more abundant in women and visceral fat in men (Lumish et al., 2020). These proinflammatory associations in neutrophils have been found for both sexes (Ibáñez et al., 2005; Xu et al., 2015). It is important to mention that the correlations discovered in this work are the result of a network that has been filtered using a p-value threshold. Other strategies, however, are possible. For example, a multiple comparison correction could be added to aid in the selection of significant correlations. Another strategy is to use a bootstrap value threshold to identify correlations that occur frequently and are thus more robust. Row bootstrap or pair bootstrap methods can be used for this purpose (Musciotto et al., 2018). We use a row bootstrap approach to determine whether the differences in topological properties between sexes are robust. This same procedure could be used to further filter the network’s correlations.
On the level of whole network analysis, we found that despite the apparent differences in connections between sexes, each physiological variable played similar roles in terms of influence (eigencentrality) and intermediation (betweenness). Additionally, algorithmic clustering was similar for both physiological networks (Table 4). Furthermore, the hierarchical arrangement of nodes shows a similar structure for both sexes (Figure 9). This suggests that global functions of the systems are largely the same. The most notable difference in topology results from the density and modularity of the network, as a result the physiological network of men has a greater small-world index (Figure 7). Consequently, the physiological network of men was more vulnerable to degree-directed attacks, and women’s physiological network was resilient to random failure (Figure 10). Lastly, deviation from normality was higher for physiological variables of men than those for women (Figure 11). All things considered, the physiological network of women indicates a more resilient homeostatic regulation that restrains regulated variables within strict ranges, and as a result, network properties such as small-world and modularity are decreased. Taking into account this assortment of approaches, we suggest important differences in the resilience and adaptability of physiological systems in men and women. In the context of the network representation of physiological systems, a network is resilient to attacks if it contains a large number of alternative paths that maintain the system’s connectedness and thus coordination. This increase in a system’s robustness comes at the expense of its component’s flexibility. An adaptable network has a higher modularity, allowing components to operate independently while retaining the small world topology that enables rapid communication within the network. This, however, exposes the network to targeted attacks. Figure 10 is a simulation of a directed attack with the purpose of highlighting differences between men and women in the structural response to attack in networks. One real-world example may be the different structural response to an infection with SARS-CoV2, where being male has been considered as a risk factor (Peckham et al., 2020), possibly due to a less resilient physiological network with respect to women.
It is important here to point out that the aim of our work is to characterize the function and properties of physiological systems in men and women. In this sense, the meaning of the words “adaptable,” “robust,” and “resilient” are not intended to describe individuals but the physiological systems. Additionally, when searching for sex differences, caution is advised in “big data” approaches to consider confounding factors that may be involved due to the risk of finding sex differences where none exist (type I error) (Rich-Edwards et al., 2018). To attenuate this risk, we performed a narrow-age cohort from a specific population, the participants were then filtered by health criteria presented on Tables 1, 2 to ensure a well-defined sample as much as possible. The database from which these healthy young subjects were selected has also an extensive questionnaire on socio-economic status and health risks. Finally, by using a network approach, conclusions are drawn in the context of the whole instead of relying in any single correlation in isolation. Despite the fact that bivariate similarity tests are easy to understand and represent, higher-order correlations cannot be taken into account by this analysis. As a result, in order to inspect these correlations, other methodologies would need to be added.
We examined the differences between the sexes in the coordination of physiological systems by means of two methodologies: time series analysis of the specific variable of heart interbeat intervals and physiological networks constructed from point measurements of 62 different variables (50 variables directly measured related to anthropometry, bioimpedance, hematic biometry, blood chemistry, and 12 derived variables). We show consistency in the existence of sex differences both in the dynamics of heart rate as in the architecture of physiological networks. In youth, men have higher heart rate variability than women, as measured, e.g., with standard deviation or SD1 and SD2 of Poincaré plots, but with aging this variability is lost at a more rapid rate in men than in women. This effect is even more evident using Shannon entropy, which shows that entropy of heart interbeat intervals tends to be conserved in women but decreases drastically with aging in men. With respect to physiological networks, women have a higher connectedness, density and clustering coefficients, whereas men have higher modularity, eigencentrality and small-world index. Efficiency, node strength and measures that depend on the path structure of the network were similar for men and women. There were no differences in susceptibility to random failure between men and women, but the network of men was more vulnerable to directed attacks than the network of women. Both methodologies suggest that the physiological system of women has a greater number of connections, which translates into redundant regulation mechanisms and, on the other hand, has less variability with respect to that of men, that is, it is a more resilient system.
The original contributions presented in the study are included in the article/Supplementary Material, further inquiries can be directed to the corresponding author/s.
The studies involving human participants were reviewed and approved by the Ethics Committee of the Facultad de Medicina of the Universidad Nacional Autónoma de México (UNAM) under project FM/DI/023/2014. The patients/participants provided their written informed consent to participate in this study.
AB-M, EI-C, and AR performed the network modeling and wrote the manuscript. CS did the conceptualization of the project for dataset of Project_42 and funding acquisition. AB-M and JL-R participated in data collection. AR, JL-R, RL, and JG did the data curation. AB-M, EI-C, JL-R, RL, JG, and AR performed the data analysis. AR, AB-M, EI-C, RF, JT-R, BE, OR-A, and AF participated in the complexity interpretation and analysis of the results. VM-G, GT-S, CA-S, BE, NT, AT, and MH participated in the medical interpretation. All authors contributed with the manuscript revision, read, and approved the final version of the manuscript.
This work was partially supported by the CONACyT through the grants FORDECYT-PRONACES 610285/2020, 263377/2020, Fondo Sectorial de Investigación en Salud y Seguridad Social, grant SALUD-2014-1-233950, and Universidad Nacional Autónoma de México through DGAPA, PAPIIT AG101520, IV100120, IN113619, IN110321, and PAPIME PE103519. We also acknowledge partial support from SECTEI CDMX grant SECIT/093/2018 and a donation from Academic Relations, Microsoft Corporation.
The authors declare that the research was conducted in the absence of any commercial or financial relationships that could be construed as a potential conflict of interest.
We appreciate the assistance of the medical team, including the physicians Adriana Robles Cabrera, Alonso Alejandro Hernández-Chávez, Ricardo Jesús Martínez-Tapia, and Juan Pablo Berumen Cano from the Facultad de Medicina at the Universidad Nacional Autónoma de México, the technical support to allocate the database from Romel Calero, and Clementina Castañares for data analysis.
The Supplementary Material for this article can be found online at: https://www.frontiersin.org/articles/10.3389/fphys.2021.678507/full#supplementary-material
Adeli, K., Raizman, J. E., Chen, Y., Higgins, V., Nieuwesteeg, M., Abdelhaleem, M., et al. (2015). Complex biological profile of hematologic markers across pediatric, adult, and geriatric ages: establishment of robust pediatric and adult reference intervals on the basis of the Canadian Health Measures Survey. Clin. Chem. 61, 1075–1086. doi: 10.1373/clinchem.2015.240531
Aittokallio, T., and Schwikowski, B. (2006). Graph-based methods for analysing networks in cell biology. Brief. Bioinform. 7, 243–255. doi: 10.1093/bib/bbl022
Alberti, K. G. M. M., Eckel, R. H., Grundy, S. M., Zimmet, P. Z., Cleeman, J. I., Donato, K. A., et al. (2009). Harmonizing the metabolic syndrome: a joint interim statement of the international diabetes federation task force on epidemiology and prevention; National Heart, Lung, and Blood Institute; American Heart Association; World Heart Federation; International Atherosclerosis Society; and International Association for the Study of Obesity. Circulation 120, 1640–1645. doi: 10.1161/CIRCULATIONAHA.109.192644
Almeda-Valdes, P., Aguilar-Salinas, C. A., Uribe, M., Canizales-Quinteros, S., and Méndez-Sánchez, N. (2016). Impact of anthropometric cut-off values in determining the prevalence of metabolic alterations. Eur. J. Clin. Investig. 46, 940–946. doi: 10.1111/eci.12672
American Diabetes Association (2020). 2. Classification and diagnosis of diabetes: standards of medical care in diabetes-2020. Diabetes Care 43(Suppl. 1), S14–S31. doi: 10.2337/dc20-s002
Arnold, A. P., van Nas, A., and Lusis, A. J. (2009). Systems biology asks new questions about sex differences. Trends Endocrinol. Metab. 20, 471–476. doi: 10.1016/j.tem.2009.06.007
Atsma, F., Veldhuizen, I., de Kort, W., van Kraaij, M., Pasker-de Jong, P., and Deinum, J. (2012). Hemoglobin level is positively associated with blood pressure in a large cohort of healthy individuals. Hypertension 60, 936–941. doi: 10.1161/HYPERTENSIONAHA.112.193565
Bai, X., Li, J., Zhou, L., and Li, X. (2009). Influence of the menstrual cycle on nonlinear properties of heart rate variability in young women. Am. J. Physiol. Heart Circ. Physiol. 297, H765–H774. doi: 10.1152/ajpheart.01283.2008
Barajas-Martínez, A., Easton, J. F., Rivera, A. L., Martínez-Tapia, R., de la Cruz, L., Robles-Cabrera, A., et al. (2020). Metabolic physiological networks: the impact of age. Front. Physiol. 11:587994. doi: 10.3389/fphys.2020.587994
Barajas-Martínez, A., Ibarra-Coronado, E., Sierra-Vargas, M. P., Cruz-Bautista, I., Almeda-Valdes, P., Aguilar-Salinas, C. A., et al. (2021). Physiological network from anthropometric and blood test biomarkers. Front. Physiol. 11:612598. doi: 10.3389/fphys.2020.612598
Barnett, J. B., Woods, M. N., Lamon-Fava, S., Schaefer, E. J., McNamara, J. R., Spiegelman, D., et al. (2004). Plasma lipid and lipoprotein levels during the follicular and luteal phases of the menstrual cycle. J. Clin. Endocrinol. Metab. 89, 776–782. doi: 10.1210/jc.2003-030506
Bashan, A., Bartsch, R. P., Kantelhardt, J. W., Havlin, S., and Ivanov, P. C. (2012). Network physiology reveals relations between network topology and physiological function. Nat. Commun. 3:702. doi: 10.1038/ncomms1705
Batushansky, A., Toubiana, D., and Fait, A. (2016). Correlation-based network generation, visualization, and analysis as a powerful tool in biological studies: a case study in cancer cell metabolism. Biomed. Res. Int. 2016:8313272. doi: 10.1155/2016/8313272
Berntson, G. G., Thomas Bigger, J., Eckberg, D. L., Grossman, P., Kaufmann, P. G., Malik, M., et al. (1997). Heart rate variability: Origins, methods, and interpretive caveats. Psychophysiology 34, 623–648. doi: 10.1111/j.1469-8986.1997.tb02140.x
Blondel, V. D., Guillaume, J.-L. L., Lambiotte, R., and Lefebvre, E. (2008). Fast unfolding of communities in large networks. J. Stat. Mech. 2008, 1–12. doi: 10.1088/1742-5468/2008/10/P10008
Borgatti, S. P., and Everett, M. G. (2006). A graph-theoretic perspective on centrality. Soc. Netw. 28, 466–484. doi: 10.1016/j.socnet.2005.11.005
Brar, T. K., Singh, K. D., and Kumar, A. (2015). Effect of different phases of menstrual cycle on heart rate variability (HRV). J. Clin. Diagn. Res. JCDR 9, CC01–CC04. doi: 10.7860/JCDR/2015/13795.6592
Buoncervello, M., Marconi, M., Carè, A., Piscopo, P., Malorni, W., and Matarrese, P. (2017). Preclinical models in the study of sex differences. Clin. Sci. 131, 449–469. doi: 10.1042/CS20160847
Buxton, C. L., and Atkinson, W. B. (1948). Hormonal factors involved in the regulation of basal body temperature during the menstrual cycle and pregnancy. J. Clin. Endocrinol. Metab. 8, 544–549. doi: 10.1210/jcem-8-7-544
Choudhury, R., Jahan, N., Sultana, N., Akter, R., and Khanum, A. A. (2010). Sympathetic nerve function status in follicular and late luteal phases of menstrual cycle in healthy young women. J. Bangladesh Soc. Physiol. 5, 80–88. doi: 10.3329/jbsp.v5i2.6782
Chumlea, W. C., Guo, S. S., Zeller, C. M., Reo, N. V., Baumgartner, R. N., Garry, P. J., et al. (2001). Total body water reference values and prediction equations for adults. Kidney Int. 59, 2250–2258. doi: 10.1046/j.1523-1755.2001.00741.x
Chung, M.-H., and Yang, C. C. H. (2011). Heart rate variability across the menstrual cycle in shift work nurses. J. Exp. Clin. Med. 3, 121–125. doi: 10.1016/j.jecm.2011.04.001
Clemente, G. P., and Grassi, R. (2018). Directed clustering in weighted networks: A new perspective. Chaos Solitons Fractals 107, 26–38. doi: 10.1016/j.chaos.2017.12.007
Coates, S., Wang, D., Pierscionek, T., Fernandes, S., Djumanov, D., Lorch, U., et al. (2020). Time- and race-specific haematological reference intervals for healthy volunteer trials: a retrospective analysis of pooled data from multiple phase I trials. Front. Pharmacol. 11:314. doi: 10.3389/fphar.2020.00314
Cohen, A. A., Leblanc, S., and Roucou, X. (2021). Robust physiological metrics from sparsely sampled networks. Front. Physiol. 12:624097. doi: 10.3389/fphys.2021.624097
Csárdi, G., Nepusz, T., and Airoldi, E. M. (2016). Statistical Network Analysis with iGraph. Berlin: Springer.
Danon, L., Díaz-Guilera, A., Duch, J., and Arenas, A. (2005). Comparing community structure identification. J. Stat. Mech. 2005:09008. doi: 10.1088/1742-5468/2005/09/P09008
Darmochwal-Kolarz, D., Rolinski, J., Tabarkiewicz, J., Leszczynska-Gorzelak, B., Buczkowski, J., Wojas, K., et al. (2003). Blood myeloid and lymphoid dendritic cells are stable during the menstrual cycle but deficient during mid-gestation. J. Reprod. Immunol. 59, 193–203. doi: 10.1016/S0165-0378(03)00047-0
Das, S., Panja, S., and Samajdar, K. (2019). A study of cardiovascular sympathetic function tests during different phases of menstrual cycle in young females. Int. J. Res. Med. Sci. 7, 3367–3373. doi: 10.18203/2320-6012.ijrms20193915
de Zambotti, M., Nicholas, C. L., Colrain, I. M., Trinder, J. A., and Baker, F. C. (2013). Autonomic regulation across phases of the menstrual cycle and sleep stages in women with premenstrual syndrome and healthy controls. Psychoneuroendocrinology 38, 2618–2627. doi: 10.1016/j.psyneuen.2013.06.005
Dunne, F. P., Barry, D. G., Ferriss, J. B., Grealy, G., and Murphy, D. (1991). Changes in blood pressure during the normal menstrual cycle. Clin. Sci. Lond. Engl. 1979, 515–518. doi: 10.1042/cs0810515
Esteghamati, A., Khalilzadeh, O., Anvari, M., Meysamie, A., Abbasi, M., Forouzanfar, M., et al. (2009). The economic costs of diabetes: a population-based study in Tehran, Iran. Diabetologia 52, 1520–1527. doi: 10.1007/s00125-009-1398-4
Faustmann, G., Tiran, B., Maimari, T., Kieslinger, P., Obermayer-Pietsch, B., Gruber, H., et al. (2016). Circulating leptin and NF-κB activation in peripheral blood mononuclear cells across the menstrual cycle. Biofactors 42, 376–387. doi: 10.1002/biof.1281
Fossion, R., Rivera, A. L., and Estañol, B. (2018). A physicist’s view of homeostasis: how time series of continuous monitoring reflect the function of physiological variables in regulatory mechanisms. Physiol. Measure. 39:084007. doi: 10.1088/1361-6579/aad8db
Fossion, R., Stephens, C. R., García-Pelagio, K. P., and García-Iglesias, L. (2017). Data mining and time-series analysis as two complementary approaches to study body temperature in obesity. ACM Int. Conf. Proc. Ser. Part F 128634, 190–194. doi: 10.1145/3079452.3079504
Freedman, D. S., Thornton, J. C., Pi-Sunyer, F. X., Heymsfield, S. B., Wang, J., Pierson, R. N., et al. (2012). The body adiposity index (hip circumference ÷ height(1.5)) is not a more accurate measure of adiposity than is BMI, waist circumference, or hip circumference. Obesity (Silver Spring, Md.) 20, 2438–2444. doi: 10.1038/oby.2012.81
Furuzawa-Carballeda, J., Aguilar-León, D., Gamboa-Domínguez, A., Valdovinos, M. A., Nuñez-Álvarez, C., Martín-del-Campo, L. A., et al. (2015). Achalasia—An autoimmune inflammatory disease: a cross-sectional study. J. Immunol. Res. 2015:729217. doi: 10.1155/2015/729217
Girija, B., and Veeraiah, S. (2011). Effect of different phases of menstrual cycle on physical working capacity in Indian population. Indian J. Physiol. Pharmacol. 55, 165–169. doi: 10.1007/s40279-020-01319-3
Goldberger, A. L. (1996). Non-linear dynamics for clinicians: chaos theory, fractals, and complexity at the bedside. Lancet 347, 1312–1314. doi: 10.1016/S0140-6736(96)90948-4
Goldberger, A. L., Amaral, L. A. N., Glass, L., Hausdorff, J. M., Ivanov, P. Ch, Mark, R. G., et al. (2000). Physiobank, physiotoolkit, and physionet. Circulation 101, e215–e220. doi: 10.1161/01.CIR.101.23.e215
Grimberg, A., DiVall, S. A., Polychronakos, C., Allen, D. B., Cohen, L. E., Quintos, J. B., et al. (2016). Guidelines for growth hormone and insulin-like growth factor-I treatment in children and adolescents: growth hormone deficiency, idiopathic short stature, and primary insulin-like growth factor-I deficiency. Horm. Res. Paediatr. 86, 361–397. doi: 10.1159/000452150
Guo, J., Lei, S., Zhou, Y., and Pan, C. (2020). The ratio of estimated average glucose to fasting plasma glucose level as an indicator of insulin resistance in young adult diabetes. Medicine 99:e22337. doi: 10.1097/MD.0000000000022337
Haines, R. W., Zolfaghari, P., Wan, Y., Pearse, R. M., Puthucheary, Z., and Prowle, J. R. (2019). Elevated urea-to-creatinine ratio provides a biochemical signature of muscle catabolism and persistent critical illness after major trauma. Intens. Care Med. 45, 1718–1731. doi: 10.1007/s00134-019-05760-5
Hanamsagar, R., and Bilbo, S. D. (2016). Sex differences in neurodevelopmental and neurodegenerative disorders: focus on microglial function and neuroinflammation during development. J. Ster. Biochem. Mol. Biol. 160, 127–133. doi: 10.1016/j.jsbmb.2015.09.039
Hofer, S. M., and Sliwinski, M. J. (2001). Understanding ageing. an evaluation of research designs for assessing the interdependence of ageing-related changes. Gerontology 47, 341–352. doi: 10.1159/000052825
Holt, S. G., Yo, J. H., Karschimkus, C., Volpato, F., Christov, S., Smith, E. R., et al. (2020). Monitoring skin temperature at the wrist in hospitalised patients may assist in the detection of infection. Intern. Med. J. 50, 685–690. doi: 10.1111/imj.14748
Hosten, A. O. (1990). “BUN and creatinine,” in Clinical Methods: The History, Physical, and Laboratory Examinations, 3rd Edn, eds H. K. Walker, W. D. Hall, and J. W. Hurst (New York, NY: Butterworths).
Ibáñez, L., Jaramillo, A. M., Ferrer, A., and de Zegher, F. (2005). High neutrophil count in girls and women with hyperinsulinaemic hyperandrogenism: normalization with metformin and flutamide overcomes the aggravation by oral contraception. Hum. Reprod. 20, 2457–2462. doi: 10.1093/humrep/dei072
Ifudu, O., Uribarri, J., Rajwani, I., Vlacich, V., Reydel, K., Delosreyes, G., et al. (2001). Gender modulates responsiveness to recombinant erythropoietin. Am. J. Kidney Dis. 38, 518–522. doi: 10.1053/ajkd.2001.26842
Institute of Medicine (US) Committee on Understanding the Biology of Sex and Gender Differences (2001). Exploring the Biological Contributions to Human Health: Does Sex Matter?, eds T. M. Wizemann and M.-L. Pardue (Washington, DC: National Academies Press).
Iyengar, N., Peng, C. K., Morin, R., Goldberger, A. L., and Lipsitz, L. A. (1996). Age-related alterations in the fractal scaling of cardiac interbeat interval dynamics. Am. J. Physiol. 271(4Pt 2), R1078–R1084. doi: 10.1152/ajpregu.1996.271.4.R1078
Jansson, L. (2020). Network explanations and explanatory directionality. Philos. Trans. R. Soc. Lond. B Biol. Sci. 375, 20190318. doi: 10.1098/rstb.2019.0318
Joyner, M. J., Wallin, B. G., and Charkoudian, N. (2016). Sex differences and blood pressure regulation in humans: sex differences and human blood pressure. Exp. Physiol. 101, 349–355. doi: 10.1113/EP085146
Khan, S., Prakash, J., Rashid, M., Beg, U., Kumar, M., Hussain, G., et al. (2016). To study the effect of different phases of menstrual cycle on ECG & blood pressure in healthy young adult females. J. Med. Sci. Clin. Res. 4, 10406–10414. doi: 10.18535/JMSCR/V4I5.07
Khanna, D., FitzGerald, J. D., Khanna, P. P., Bae, S., Singh, M., Neogi, T., et al. (2012). 2012 American college of rheumatology guidelines for management of gout part I: systematic non-pharmacologic and pharmacologic therapeutic approaches to hyperuricemia. Arthritis care Res. 64, 1431–1446. doi: 10.1002/acr.21772
Komukai, K., Mochizuki, S., and Yoshimura, M. (2010). Gender and the renin–angiotensin–aldosterone system. Fundam. Clin. Pharmacol. 24, 687–698. doi: 10.1111/j.1472-8206.2010.00854.x
Kuk, J. L., and Ardern, C. I. (2010). Age and sex differences in the clustering of metabolic syndrome factors: association with mortality risk. Diabetes Care 33, 2457–2461. doi: 10.2337/dc10-0942
Lala, A., Johnson, K. W., Januzzi, J. L., Russak, A. J., Paranjpe, I., Richter, F., et al. (2020). Prevalence and impact of myocardial injury in patients hospitalized With COVID-19 infection. J. Am. Coll. Cardiol. 76, 533–546. doi: 10.1016/j.jacc.2020.06.007
Lavin-Perez, R. D., and Rivera, A. L. (2018). Diferencias de género y edad en la variabilidad a corto plazo de la frecuencia card aca y la presión arterial. Master on Science Thesis (Physics) UNAM.
Lear, S. A., James, P. T., Ko, G. T., and Kumanyika, S. (2010). Appropriateness of waist circumference and waist-to-hip ratio cutoffs for different ethnic groups. Eur. J. Clin. Nutr. 64, 42–61. doi: 10.1038/ejcn.2009.70
Lee, S., Kim, J., Jang, B., Hur, S., Jung, U., Kil, K., et al. (2010). Fluctuation of peripheral blood T, B, and NK cells during a menstrual cycle of normal healthy women. J. Immunol. 185, 756–762. doi: 10.4049/jimmunol.0904192
Leung, K. K., Wilson, G. M., Kirkemo, L. L., Riley, N. M., Coon, J. J., and Wells, J. A. (2020). Broad and thematic remodeling of the surfaceome and glycoproteome on isogenic cells transformed with driving proliferative oncogenes. Proc. Natl. Acad. Sci. 117, 7764–7775. doi: 10.1073/pnas.1917947117
Lloyd-Jones, D. M., Larson, M. G., Beiser, A., and Levy, D. (1999). Lifetime risk of developing coronary heart disease. Lancet 353, 89–92. doi: 10.1016/S0140-6736(98)10279-9
Lumish, H. S., O’Reilly, M., and Reilly, M. P. (2020). Sex differences in genomic drivers of adipose distribution and related cardiometabolic disorders. Arterioscler. Thromb. Vasc. Biol. 40, 45–60. doi: 10.1161/ATVBAHA.119.313154
Lundy, L., Lee, S., Levy, W., Woodruff, J., Wu, C., and Abdalla, M. (1974). The ovulatory cycle. A histologic, thermal, steroid, and gonadotropin correlation. Obstetr. Gynecol. 44, 14–25.
Lutsenko, O. I., and Kovalenko, S. O. (2017). Blood pressure and hemodynamics: mayer waves in different phases of ovarian and menstrual cycle in women. Physiol. Res. 66, 235–240. doi: 10.33549/physiolres.933313
Mach, F., Baigent, C., Catapano, A. L., Koskinas, K. C., Casula, M., Badimon, L., et al. (2020). 2019 ESC/EAS Guidelines for the management of dyslipidaemias: lipid modification to reduce cardiovascular risk: the task force for the management of dyslipidaemias of the European Society of Cardiology (ESC) and European Atherosclerosis Society (EAS). Eur. Heart J. 41, 111–188. doi: 10.1093/eurheartj/ehz455
Maren, S., De Oca, B., and Fanselow, M. S. (1994). Sex differences in hippocampal long-term potentiation (LTP) and Pavlovian fear conditioning in rats: positive correlation between LTP and contextual learning. Brain Res. 661, 25–34. doi: 10.1016/0006-8993(94)91176-2
Mauvais-Jarvis, F., Bairey Merz, N., Barnes, P. J., Brinton, R. D., Carrero, J.-J., DeMeo, D. L., et al. (2020). Sex and gender: modifiers of health, disease, and medicine. Lancet 396, 565–582. doi: 10.1016/S0140-6736(20)31561-0
McClelland, E. E., and Smith, J. M. (2011). Gender specific differences in the immune response to infection. Arch. Immunol. Ther. Exp. 59, 203–213. doi: 10.1007/s00005-011-0124-3
McKinley, P. S., King, A. R., Shapiro, P. A., Slavov, I., Fang, Y., Chen, I. S., et al. (2009). The impact of menstrual cycle phase on cardiac autonomic regulation. Psychophysiology 46, 904–911. doi: 10.1111/j.1469-8986.2009.00811.x
Meilǎ, M. (2003). “Comparing clusterings by the variation of information,” in Learning Theory and Kernel Machines, eds B. Schölkopf and M. K. Warmuth (Berlin: Springer), 173–187. doi: 10.1007/978-3-540-45167-9_14
Merico, D., Gfeller, D., and Bader, G. D. (2009). How to visually interpret biological data using networks. Nat. Biotechnol. 27, 921–924. doi: 10.1038/nbt.1567
Mihaicuta, S., Udrescu, M., Topirceanu, A., and Udrescu, L. (2017). Network science meets respiratory medicine for OSAS phenotyping and severity prediction. PeerJ 5:e3289. doi: 10.7717/peerj.3289
Moran, V. H., Leathard, H. L., and Coley, J. (2000). Cardiovascular functioning during the menstrual cycle. Clin. Physiol. 20, 496–504. doi: 10.1046/j.1365-2281.2000.00285.x
Musciotto, F., Marotta, L., Miccichè, S., and Mantegna, R. N. (2018). Bootstrap validation of links of a minimum spanning tree. Phys. A Stat. Mech. Appl. 512, 1032–1043.
Musso, C. G., Álvarez-Gregori, J., Jauregui, J., and Macías-Núñez, J. F. (2016). Glomerular filtration rate equations: a comprehensive review. Int. Urol. Nephrol. 48, 1105–1110. doi: 10.1007/s11255-016-1276-1
Newman, M. E. J. (2006). Finding community structure in networks using the eigenvectors of matrices. Phys. Rev. E 74:036104. doi: 10.1103/PhysRevE.74.036104
Ngo, S. T., Steyn, F. J., and McCombe, P. A. (2014). Gender differences in autoimmune disease. Front. Neuroendocrinol. 35:347–369. doi: 10.1016/j.yfrne.2014.04.004
Nitsch, D. (2014). Is there a difference in metabolic burden between men and women? Nephrol. Dialysis Transpl. 29, 1110–1112. doi: 10.1093/ndt/gft518
Noack, A. (2009). Modularity clustering is force-directed layout. Phys. Rev. E 79:026102. doi: 10.1103/PhysRevE.79.026102
Oda, E., Oohara, K., Abe, A., Veeraveedu, P. T., Watanabe, K., Kato, K., et al. (2006). The optimal cut-off point of C-reactive protein as an optional component of metabolic syndrome in Japan. Circ. J. 70, 384–388. doi: 10.1253/circj.70.384
Palmer, B. F., and Clegg, D. J. (2015). The sexual dimorphism of obesity. Mol. Cell. Endocrinol. 402, 113–119. doi: 10.1016/j.mce.2014.11.029
Pavlopoulos, G. A., Secrier, M., Moschopoulos, C. N., Soldatos, T. G., Kossida, S., Aerts, J., et al. (2011). Using graph theory to analyze biological networks. Biodata Mining 4:10. doi: 10.1186/1756-0381-4-10
Peckham, H., de Gruijter, N. M., Raine, C., Radziszewska, A., Ciurtin, C., Wedderburn, L. R., et al. (2020). Male sex identified by global COVID-19 meta-analysis as a risk factor for death and ITU admission. Nat. Commun. 11:6317. doi: 10.1038/s41467-020-19741-6
Piefke, M., Weiss, P. H., Markowitsch, H. J., and Fink, G. R. (2005). Gender differences in the functional neuroanatomy of emotional episodic autobiographical memory. Hum. Brain Mapp. 24, 313–324. doi: 10.1002/hbm.20092
Pincus, S. M., and Viscarello, R. R. (1992). Approximate entropy: a regularity measure for fetal heart rate analysis. Obstetr. Gynecol. 79, 249–255.
R Core Team. (2020). R: A Language and Environment for Statistical Computing. 4.0.1. Vienna: R Foundation for Statistical Computing.
Rand, W. M. (1971). Objective criteria for the evaluation of clustering methods. J. Am. Stat. Assoc. 66, 846–850. doi: 10.1080/01621459.1971.10482356
Rawal, K., Saini, B. S., and Saini, I. (2015). Adaptive correlation dimension method for analysing heart rate variability during the menstrual cycle. Australas. Phys. Eng. Sci. Med. 38, 509–523. doi: 10.1007/s13246-015-0369-y
Regitz-Zagrosek, V. (2006). Therapeutic implications of the gender-specific aspects of cardiovascular disease. Nat. Rev. Drug Discov. 5, 425–439. doi: 10.1038/nrd2032
Regitz-Zagrosek, V., Lehmkuhl, E., and Mahmoodzadeh, S. (2007). Gender aspects of the role of the metabolic syndrome as a risk factor for cardiovascular disease. Gender Med. 4(Suppl. B), S162–S177. doi: 10.1016/s1550-8579(07)80056-8
Reichardt, J., and Bornholdt, S. (2006). Statistical mechanics of community detection. Phys. Rev. E Stat. Nonlin. Soft. Matter. Phys. 74(1Pt 2):016110. doi: 10.1103/PhysRevE.74.016110
Rich-Edwards, J. W., Kaiser, U. B., Chen, G. L., Manson, J. E., and Goldstein, J. M. (2018). Sex and gender differences research design for basic, clinical, and population studies: essentials for investigators. Endocr. Rev. 39, 424–439. doi: 10.1210/er.2017-00246
Rivera, A. L., Claudio Toledo-Roy, J., and Frank, A. (2020). Symmetry and signs of self-organized criticality in living organisms. J. Phys. 1612, 012024. doi: 10.1088/1742-6596/1612/1/012024
Rivera, A. L., Estañol, B., Macías-Gallado, J. J., Delgado, G., Fossion, R., Frank, A., et al. (2021). Cardiovascular dysautonomia in Achalasia patients: blood pressure and heart rate variability alterations. PLoS One 16:e0248106. doi: 10.1371/journal.pone.0248106
Rivera, A. L., Estañol, B., Robles-Cabrera, A., Toledo-Roy, J. C., Fossion, R., and Frank, A. (2018). “Looking for biomarkers in physiological time series,” in Quantitative Models for Microscopic to Macroscopic Biological Macromolecules and Tissues, eds L. Olivares-Quiroz and O. Resendis-Antonio (Cham: Springer International Publishing), 111–131. doi: 10.1007/978-3-319-73975-5_6
Rivera, A. L., Estañol, B., Sentíes-Madrid, H., Fossion, R., Toledo-Roy, J. C., Mendoza-Temis, J., et al. (2016). Heart rate and systolic blood pressure variability in the time domain in patients with recent and long-standing diabetes mellitus. PLoS One 11:e0148378. doi: 10.1371/journal.pone.0148378
Rosenthal, D. S. (2020). Evaluation of the Peripheral Blood Smear – UpToDate [WWW Document]. Available online at: https://www-uptodate-com/contents/evaluation-of-the-peripheral-blood-smear (accessed March 29, 2021).
RStudio Team. (2020). RStudio: Integrated Development for R. PBC, 1.3.959. Boston, MA: R. RStudio PBC.
Sandberg, K., Umans, J. G., and Group the Georgetown Consensus Conference Work (2015). Recommendations concerning the new U.S. National Institutes of Health initiative to balance the sex of cells and animals in preclinical research. FASEB J. 29, 1646–1652. doi: 10.1096/fj.14-269548
Shilaih, M., Clerck, V., Falco, L., Kübler, F., and Leeners, B. (2017). Pulse rate measurement during sleep using wearable sensors, and its correlation with the menstrual cycle phases, a prospective observational study. Sci. Rep. 7:1294. doi: 10.1038/s41598-017-01433-9
Shrimanker, R., Keene, O., Hynes, G., Wenzel, S., Yancey, S., and Pavord, I. D. (2019). Prognostic and predictive value of blood eosinophil count, fractional exhaled nitric oxide, and their combination in severe asthma: a post hoc analysis. Am. J. Respir. Crit. Care Med. 200, 1308–1312. doi: 10.1164/rccm.201903-0599LE
Slatkovska, L., Jensen, D., Davies, G. A., and Wolfe, L. A. (2006). Phasic menstrual cycle effects on the control of breathing in healthy women. Respir. Physiol. Neurobiol. 154, 379–388. doi: 10.1016/j.resp.2006.01.011
Steensma, D. P., and Bolton, K. L. (2020). What to tell your patient with clonal hematopoiesis and why: Insights from 2 specialized clinics. Blood 136, 1623–1631. doi: 10.1182/blood.2019004291
Stephens, C. R., Easton, J. F., Robles-Cabrera, A., Fossion, R., de la Cruz, L., Martínez-Tapia, R., et al. (2020). The impact of education and age on metabolic disorders. Front. Public Health 8:180. doi: 10.3389/fpubh.2020.00180
Stephens, C. R., Sierra Alcocer, R., and González Salazar, C. (2018). Complex inference networks: a new tool for spatial modelling. Discont. Nonlin. Complex. 7, 383–396. doi: 10.5890/DNC.2018.12.003
Sugiyama, K., Tagawa, S., and Toda, M. (1981). Methods for visual understanding of hierarchical system structures. IEEE Trans. Syst. Man Cyber. 11, 109–125. doi: 10.1109/TSMC.1981.4308636
Sund-Levander, M., Forsberg, C., and Wahren, L. K. (2002). Normal oral, rectal, tympanic and axillary body temperature in adult men and women: a systematic literature review. Scand. J. Caring Sci. 16, 122–128. doi: 10.1046/j.1471-6712.2002.00069.x
Tang, A. M., Chung, M., Dong, K. R., Bahwere, P., Bose, K., Chakraborty, R., et al. (2020). Determining a global mid-upper arm circumference cut-off to assess underweight in adults (men and non-pregnant women). Public Health Nutr. 23, 3104–3113. doi: 10.1017/S1368980020000397
Tenan, M. S., Brothers, R. M., Tweedell, A. J., Hackney, A. C., and Griffin, L. (2014). Changes in resting heart rate variability across the menstrual cycle. Psychophysiology 51, 996–1004. doi: 10.1111/psyp.12250
Tyagi, A., and Aeddula, N. R. (2020). “Azotemia,” in StatPearls, eds S. Kinkade, M. Attia, and T. Davidoff (Treasure Island, FL: Stat Pearls Publishing).
Vallejo, M., Márquez, M. F., Borja-Aburto, V. H., Cárdenas, M., and Hermosillo, A. G. (2005). Age, body mass index, and menstrual cycle influence young women’s heart rate variability –a multivariable analysis. Clin. Auton. Res. 15, 292–298. doi: 10.1007/s10286-005-0272-9
Velasco, M., Ortiz-Huidobro, R. I., Larqué, C., Sánchez-Zamora, Y. I., Romo-Yáñez, J., and Hiriart, M. (2020). Sexual dimorphism in insulin resistance in a metabolic syndrome rat model. Endocr. Connect. 9, 890–902. doi: 10.1530/EC-20-0288
Wall-Medrano, A., Ramos-Jiménez, A., Hernandez-Torres, R. P., Villalobos-Molina, R., Tapia-Pancardo, D. C., Jiménez-Flores, J. R., et al. (2016). Cardiometabolic risk in young adults from northern Mexico: revisiting body mass index and waist-circumference as predictors. BMC Public Health 16:236. doi: 10.1186/s12889-016-2896-1
Watts, D. J., and Strogatz, S. H. (1998). Collective dynamics of ’small-world9 networks. Nature 393, 440–442. doi: 10.1038/30918
Weissman, A., Lowenstein, L., Tal, J., Ohel, G., Calderon, I., and Lightman, A. (2009). Modulation of heart rate variability by estrogen in young women undergoing induction of ovulation. Eur. J. Appl. Physiol. 105, 381–386. doi: 10.1007/s00421-008-0914-4
Whelton, P. K., Carey Robert, M., Aronow Wilbert, S., Casey Donald, E., Collins Karen, J., Dennison Himmelfarb, C., et al. (2018). 2017 ACC/AHA/AAPA/ABC/ACPM/AGS/APhA/ASH/ASPC/NMA/PCNA Guideline for the prevention, detection, evaluation, and management of high blood pressure in adults. J. Am. Coll. Cardiol. 71, e127–e248. doi: 10.1016/j.jacc.2017.11.006
Xu, X., Su, S., Wang, X., Barnes, V., De Miguel, C., Ownby, D., et al. (2015). Obesity is associated with more activated neutrophils in African American male youth. Int. J. Obes. 39, 26–32. doi: 10.1038/ijo.2014.194
Yazar, Ş, and Yazıcı, M. (2016). Impact of menstrual cycle on cardiac autonomic function assessed by heart rate variability and heart rate recovery. Med. Princ. Pract. Int. J. Kuwait Univ. Health Sci. Cent. 25, 374–377. doi: 10.1159/000444322
Yildirir, A., Kabakci, G., Akgul, E., Tokgozoglu, L., and Oto, A. (2002). Effects of menstrual cycle on cardiac autonomic innervation as assessed by heart rate variability. Ann. Noninvas. Electrocardiol. 7, 60–63. doi: 10.1111/j.1542-474x.2001.tb00140.x
Zhang, M.-M., Gao, Y., Zheng, Y.-Y., Chen, Y., Liu, F., Ma, Y.-T., et al. (2017). Association of fasting serum bilirubin levels with clinical outcomes after percutaneous coronary intervention: a prospective study. Cardiovasc. Toxicol. 17, 471–477. doi: 10.1007/s12012-017-9405-3
Keywords: physiological network, sex differences, sexual dimorphism, heart rate variability, blood test, anthropometric measures, health
Citation: Barajas-Martínez A, Ibarra-Coronado E, Fossion R, Toledo-Roy JC, Martínez-Garcés V, López-Rivera JA, Tello-Santoyo G, Lavin RD, Gómez JL, Stephens CR, Aguilar-Salinas CA, Estañol B, Torres N, Tovar AR, Resendis-Antonio O, Hiriart M, Frank A and Rivera AL (2021) Sex Differences in the Physiological Network of Healthy Young Subjects. Front. Physiol. 12:678507. doi: 10.3389/fphys.2021.678507
Received: 09 March 2021; Accepted: 12 April 2021;
Published: 11 May 2021.
Edited by:
Luca Faes, University of Palermo, ItalyReviewed by:
Yuri Antonacci, Sapienza University of Rome, ItalyCopyright © 2021 Barajas-Martínez, Ibarra-Coronado, Fossion, Toledo-Roy, Martínez-Garcés, López-Rivera, Tello-Santoyo, Lavin, Gómez, Stephens, Aguilar-Salinas, Estañol, Torres, Tovar, Resendis-Antonio, Hiriart, Frank and Rivera. This is an open-access article distributed under the terms of the Creative Commons Attribution License (CC BY). The use, distribution or reproduction in other forums is permitted, provided the original author(s) and the copyright owner(s) are credited and that the original publication in this journal is cited, in accordance with accepted academic practice. No use, distribution or reproduction is permitted which does not comply with these terms.
*Correspondence: Ana Leonor Rivera, YW5hLnJpdmVyYUBudWNsZWFyZXMudW5hbS5teA==
Disclaimer: All claims expressed in this article are solely those of the authors and do not necessarily represent those of their affiliated organizations, or those of the publisher, the editors and the reviewers. Any product that may be evaluated in this article or claim that may be made by its manufacturer is not guaranteed or endorsed by the publisher.
Research integrity at Frontiers
Learn more about the work of our research integrity team to safeguard the quality of each article we publish.