 Sung-Woo Kim
 Hun-Young Park
 Hoeryong Jung3
 Kiwon Lim
- 1Physical Activity and Performance Institute, Konkuk University, Seoul City, South Korea
- 2Department of Sports Medicine and Science, Graduate School, Konkuk University, Seoul City, South Korea
- 3Department of Mechanical Engineering, Konkuk University, Seoul City, South Korea
- 4Department of Physical Education, Konkuk University, Seoul City, South Korea
Continuous health care and the measurement of health-related physical fitness (HRPF) is necessary for prevention against chronic diseases; however, HRPF measurements including laboratory methods may not be practical for large populations owing to constraints such as time, cost, and the requirement for qualified technicians. This study aimed to develop a multiple linear regression model to estimate the HRPF of Korean adults, using easy-to-measure dependent variables, such as gender, age, body mass index, and percent body fat. The National Fitness Award datasets of South Korea were used in this analysis. The participants were aged 19–64 years, including 319,643 male and 147,600 females. HRPF included hand grip strength (HGS), flexibility (sit and reach), muscular endurance (sit-ups), and cardiorespiratory fitness (estimated VO2max). An estimation multiple linear regression model was developed using the stepwise technique. The outlier data in the multiple regression model was identified and removed when the absolute value of the studentized residual was ≥2. In the regression model, the coefficient of determination for HGS (adjusted R2: 0.870, P < 0.001), muscular endurance (adjusted R2: 0.751, P < 0.001), and cardiorespiratory fitness (adjusted R2: 0.885, P < 0.001) were significantly high. However, the coefficient of determination for flexibility was low (adjusted R2: 0.298, P < 0.001). Our findings suggest that easy-to-measure dependent variables can predict HGS, muscular endurance, and cardiorespiratory fitness in adults. The prediction equation will allow coaches, athletes, healthcare professionals, researchers, and the general public to better estimate the expected HRPF.
Introduction
Physical fitness is defined as a physiological state of wellbeing in which one can perform daily activities without strain, or that provides the basis for exercise performance. Health-related physical fitness (HRPF) includes components related to a health condition, such as musculoskeletal and cardiorespiratory fitness (CRF; Liguori and American College of Sports Medicine, 2020).
Health-related physical fitness and physical activity (PA) level are often used together, with physical fitness generally considered a more accurate measurement of PA level than self-reported assessments (Williams, 2001). PA involves body movements caused by skeletal muscle contractions that increase energy consumption beyond the basic level (Meredith and Welk, 2010; Liguori and American College of Sports Medicine, 2020). Systematic research on the association between PA and health conditions began six decades ago, and since then, the scientific literature has confirmed the relationship between these two areas (Liguori and American College of Sports Medicine, 2020). Physical fitness was reported to be similar to PA in terms of its association with morbidity and mortality (Blair and Brodney, 1999; Erikssen, 2001). However, physical fitness predicts health outcomes more strongly than PA (Blair et al., 2001; Williams, 2001; Myers et al., 2004). Previous studies have shown at least a 50% decrease in mortality among individuals with a high physical fitness level compared to those with a low physical fitness level (Myers et al., 2004). In addition to serving as a prognostic and diagnostic health indicator in clinical settings, CRF has been used as an indicator of regular exercise (Lin et al., 2015). Warburton et al. reported that the physiological functions of the human body and HRPF continuously decrease with aging, leading to an increased risk for chronic diseases (Warburton et al., 2006). Among the HRPF components, the CRF index’s maximal oxygen uptake decreases by about 3–6% due to aging (Fleg et al., 2005). High levels of HRPF maintained from adulthood can reduce musculoskeletal, cardiovascular, and metabolic diseases such as osteoporosis, sarcopenia, hypertension, and diabetes (Carnethon et al., 2003; Katzmarzyk et al., 2004; Barry et al., 2014; Kim et al., 2019b). The HRPF is an indirect health indicator of the body, and continuous care is important. Therefore, all of the previous study findings establish the need to include HRPF testing in health condition monitoring systems (Ortega et al., 2008). Furthermore, the World Health Organization suggested that regular physical fitness and PA testing should be examined as a public health priority (World Health Organization [WHO], 2010). To prevent chronic diseases, continuous healthcare is necessary, which requires the evaluation of HRPF. However, measurements of HRPF are often not practical or feasible to perform in daily life. Additionally, laboratory methods can accurately measure physical fitness, but may not be a feasible approach for entire populations owing to cost, time constraints, and the need for qualified technicians and sophisticated devices.
The American College of Sports Medicine suggested that physical health is a measurable result of an individual’s PA and exercise habits, which is why many healthcare providers value the accurate and precise measurement of HRPF (Liguori and American College of Sports Medicine, 2020). Common HRPF tests include the isometric hand grip strength (HGS) test for measuring muscle strength (Bäckman et al., 1995), the sit and reach test for flexibility (Mier, 2011), the sit-up test for abdominal muscular endurance (Chen et al., 2020b), and the graded exercise test for cardiorespiratory endurance (Beltz et al., 2016; Kim et al., 2019b). The association between HRPF and health conditions has been established in several studies (Mendes et al., 2016; Chrismas et al., 2019; Chen et al., 2020a). Recently, technological advances in health care and sports science have provided coaches, athletes, healthcare professionals, and researchers with efficient, reliable, and economical means to record health-related and exercise performance data (Seshadri et al., 2017; Aroganam et al., 2019; Kim et al., 2019a; Ray et al., 2019). The connected gains of novel analytical techniques, portable and reliable devices, and comprehensive software programs suggest that research on health promotion will increase in the future (Loncar-Turukalo et al., 2019). Several predictive equations have been developed to estimate HRPF to increase utility for field-based research (Esco et al., 2008; Shenoy et al., 2012; Lopes et al., 2018; Zaccagni et al., 2020). These previous studies generally linked HRPF parameters to laboratory evaluations. However, there were differences in the equation’s estimation reliability due to sample size, the number of independent variables, differences in measurement methods, and statistical analysis methods.
Therefore, our study aimed to develop a multiple linear regression model to predict HRPF parameters (e.g., HGS, flexibility, muscular endurance, and CRF) using easy-to-measure dependent variables [e.g., gender, age, body mass index (BMI), and percent body fat] in Korean adults.
Materials and Methods
Datasets
The National Fitness Award (NFA) datasets of South Korea were used in this analysis. The NFA is a nationwide test in 75 sites that assesses the physical fitness of the general population in South Korea. This study included male and female (age: 19–64 years) who participated in the NFA from 2015 to 2019. Among a total of 457,942 adults, we excluded participants who had no data on their dependent variables (n = 640) and had no data on their HRPF parameters (n = 669). Finally, a total of 456,633 adults (male: n = 210,613, female: n = 246,020) were included in the analysis. Male and female were divided in the ratio of 7:3 using the Bernoulli trial. Approximately 70% of the divided data (total: n = 319,643, male: n = 147,600, female: n = 172,043) were used in the development of the HRPF estimation formula with gender, age, BMI, and percent body fat, and approximately 30% of the data (total: n = 136,990, male: n = 63,013, female: n = 73,977) were used for the validity test. The power test was performed using G∗Power 3.1.9.2 (Franz Faul, University of Kiel, Kiel, Germany) at the tails of two, the H1 ρ2 of 0.3, the H0 ρ2 of 0, the significant level of 0.05 (α = 0.05), the power of 0.9, and the number of predictors of 4 for all statistical tests. G∗Power showed that 51 subjects had sufficient power for this study. The study was conducted according to the guidelines of the Declaration of Helsinki and approved by the Institutional Review Board of Kunkuk University (7001355-202101-E-132). All individuals provided informed consent before enrollment. The population characteristics are presented in Table 1.
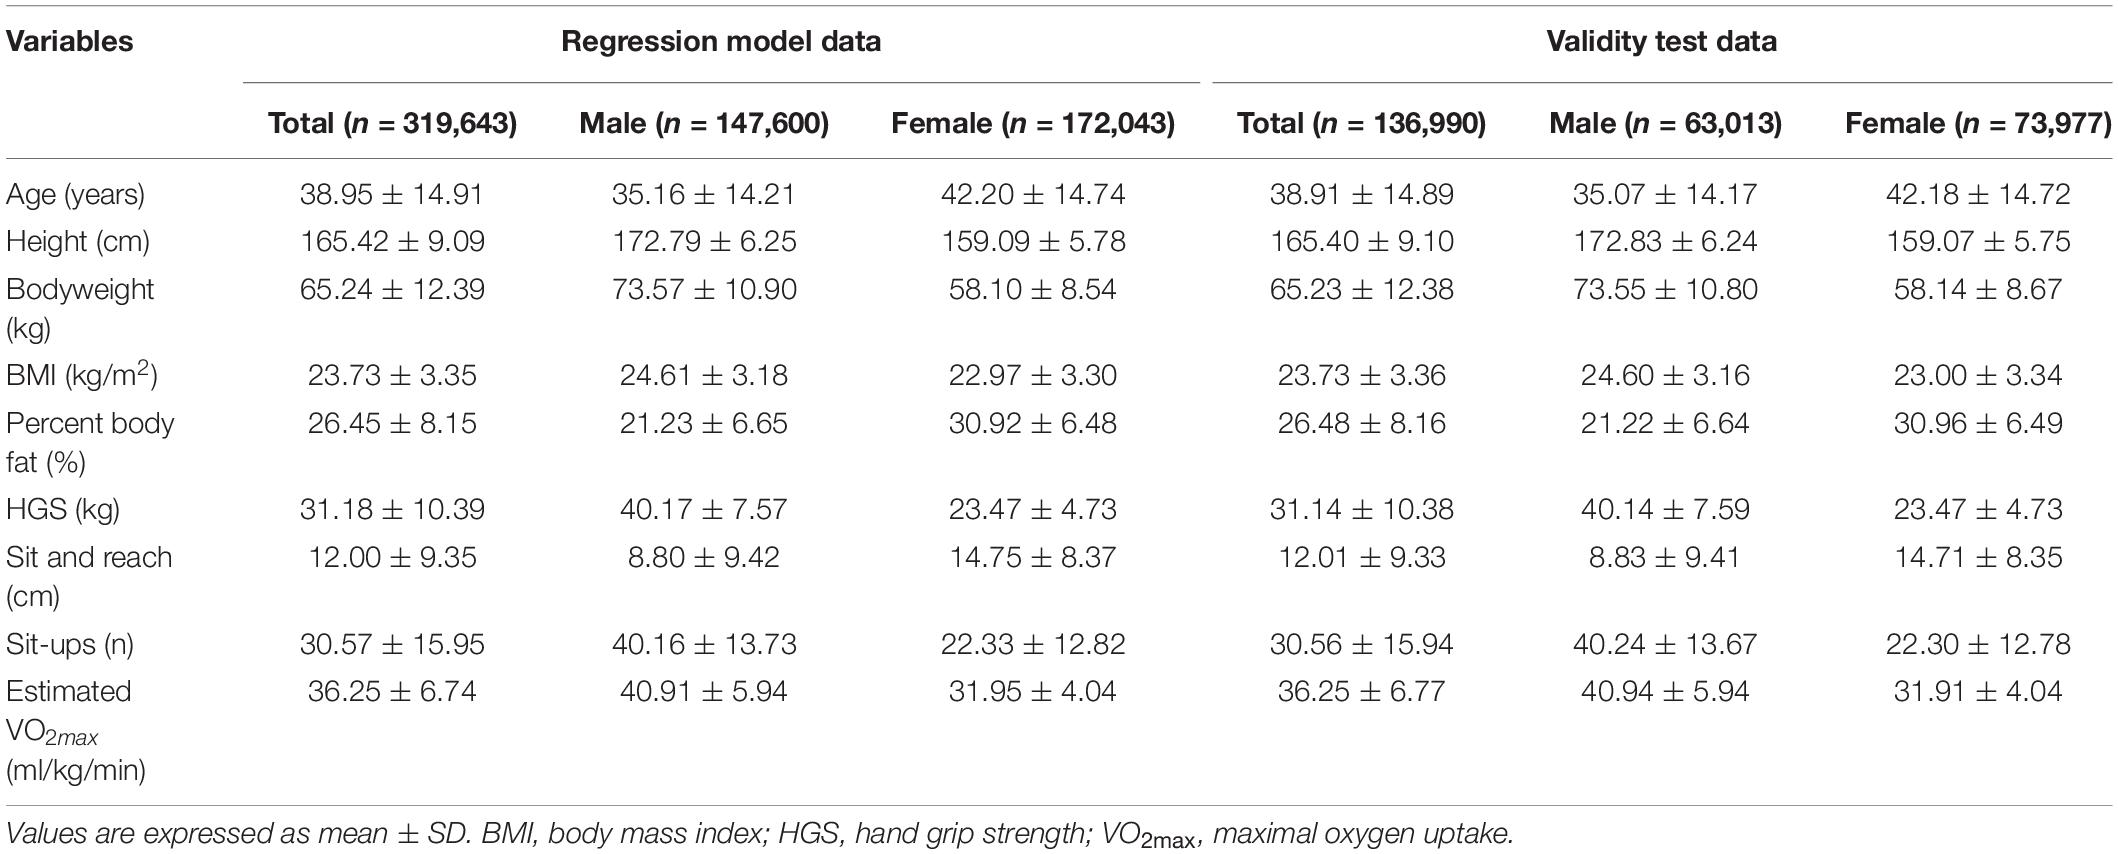
Table 1. Characteristics of the study population.
Measurement of Dependent Variables
Height was measured to the nearest 0.1 cm using a stadiometer (Seca, Seca Corporation, Columbia, MD, United States). Body weight and percent body fat were measured using bioelectrical impedance analysis equipment (Inbody 720, Inbody, Seoul, Korea) (Jeong et al., 2020). BMI was calculated by dividing body weight (kg) by height squared (m2).
Health-Related Physical Fitness Parameters
All HRPF parameters were measured by certified health and physical fitness instructors. The HRPF assessment for adults included HGS, flexibility (sit and reach), muscular endurance (sit-ups), and CRF (estimated VO2max). Descriptions of the tests are as follows:
HGS (kg): Isometric muscle strength was assessed using a hand dynamometer (GRIP-D 5101, Takei, Niigata, Japan). Participants held the dynamometer with their preferred hand and squeezed it as forcefully as possible. All participants were tested twice, and the best result was recorded to the nearest 0.1 kg.
Sit-and-reach (cm): The participants sat on a mat and placed their feet in front of the measurement board with their legs fully extended. Participants were directed to gradually reach forward with both hands overlapped and push the bar as far as possible, holding this position for approximately 3 s. The best score was recorded after two trials and recorded to the nearest 0.1 cm.
Sit-ups (number of times): The participants laid on a mat with their knees bent at 90° and their feet held down by a partner. After being instructed to begin, they raised their upper body until their elbows touched the knees, and then returned to the initial position where both shoulders were in contact with the mat. Their hands were required to remain placed crosswise on the chest during the test. The total number of accurately performed and complete sit-ups was recorded.
Estimated VO2max (ml/kg/min): A graded exercise treadmill test with Bruce protocol (Bruce et al., 1973) was applied to measure a VO2max. All participants began walking at a speed of 2.7 km/h, at an inclination of 10%. The speed was increased 1.3–1.4 km/h at 3 min intervals, and the incline was increased by 2% with each stage. The graded exercise test was performed on a treadmill (TM55 treadmill, Quinton Cardiology Systems, Inc., Seattle, WA, United States). Heart rate was measured using a heart rate monitor (Quinton Q-Stress, Quinton Cardiology Systems, Inc., Bothell, WA, United States). The participants were expected to reach three of the following criteria: (1) heart rate reserve >85%; (2) heart rate did not increase even when the stage increased; (3) rating of perceived exertion >17 (range: 6–20); (4) request to stop by the participant. The VO2max was calculated using the Bruce formula: 6.70 − 2.82 × (1: male, 2: female) + (0.056 × exercise maintaining time (s)) (Bruce et al., 1973).
Statistical Analysis
The mean and standard deviation were calculated for all measured parameters. The normality of distribution of all outcome variables was verified using the Kolmogorov–Smirnov test. To perform multiple linear regression analysis, the β-value (the regression coefficient) was used to verify if the independent variables had explanatory power (Park et al., 2020). In this work we used the stepwise mode of regression analysis, which is indicated when multiple independent variables are taken as predictors (Shepperd and MacDonell, 2012; Bardsiri et al., 2014). The stepwise regression technique aims to maximize the estimated power with a minimum number of independent variables. Multiple linear regression analysis with the stepwise technique predicted HRPF parameters (HGS, flexibility, muscular endurance, and CRF) using dependent variables (e.g., gender, age, body mass index, and percent body fat). In addition, we rigorously conformed to the basic assumptions of the regression model: linearity, independence, autocorrelation, homoscedasticity, continuity, normality, and outliers. The outlier data in the multiple regression model were identified and removed when the absolute value of the studentized residual (SRE) was ≥2. The validity of the regression model was tested using approximately 30% of the total data, which had already been divided through the Bernoulli trial, and were not included in the development of the regression model. The validation test calculated the predicted values of the HRPF parameters using the regression equation, and the mean error and standard errors of estimation (SEE) were calculated using formulas 1 and 2. Two-tailed Pearson-correlation analysis was performed to estimate the relationships between measured and predicted HRPF parameters. The Statistical Package for the Social Sciences (SPSS) version 25.0 (IBM Corporation, Armonk, NY, United States) was used for analysis, and the level of significance was set at 0.05.
Formula 1. The calculation formula for the mean error
Formula 2. The calculation formula for the standard errors of estimation.
Results
For each multiple regression model developed, the F-test was used to validate the significance of the model. Multiple regression analyses have shown that the regression coefficients for the selected independent variable were statistically significant. Multiple regression analyses for each model included coefficients of determination (R2), adjusted coefficients of determination (adjusted R2), and SEE. The correlations between the dependent variables and HRPF parameters are shown in Table 2.
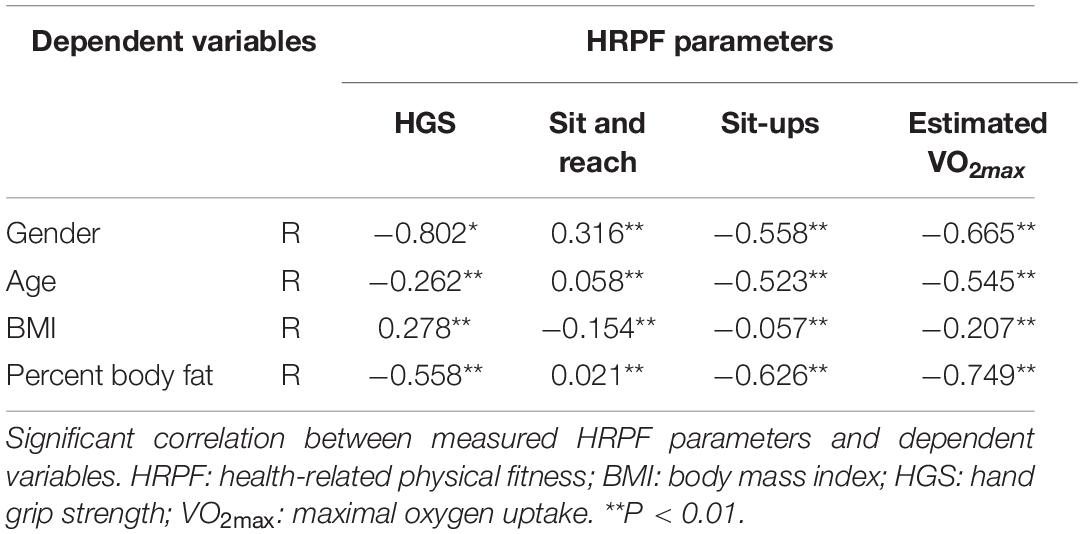
Table 2. Correlation coefficients between dependent variables and HRPF parameters for the estimating regression model.
Performance Evaluation of Regression Models and Regression Equations
The detailed results of the multiple regression analysis using HRPF parameters are shown in Table 3. The estimated explanatory power of HGS regression models was 71.0%, and SEE was 5.60 kg (F = 194,597.062, P < 0.001). Further, the explanatory power of the sit and reach regression models was 15.5%, and SEE was 8.60 cm (F = 14,568.080, P < 0.001). The explanatory power of sit-ups regression models was 55.5%, and SEE was 10.63 n (F = 98,806.560, P < 0.001). In addition, the explanatory power of estimated VO2max regression models was 72.0%, and SEE was 3.56 ml/kg/min (F = 131291.452, P < 0.001).
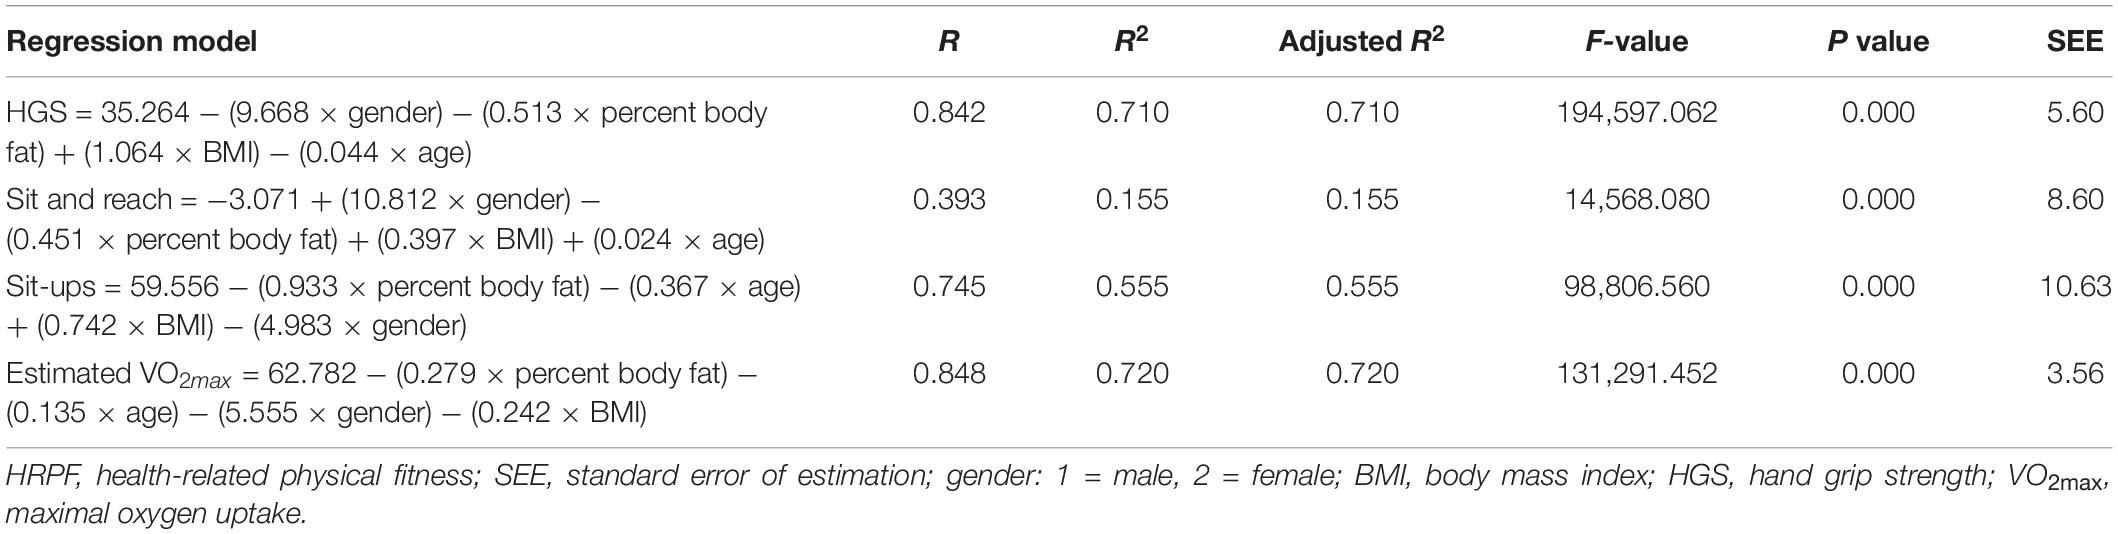
Table 3. Estimated regression equations predicting HRPF parameters.
Performance Evaluation of Regression Models and Regression Equations Without Outlier Data
Table 4 shows the results of the multiple regression analysis using HRPF parameters without outlier data. The explanatory power of HGS regression models (SRE 27: n = 253,339) was 87.0%, and SEE was 3.27 kg (F = 422009.836, P < 0.001). Moreover, the explanatory power of the developed sit and reach regression models (SRE 31: n = 263,737) was 29.8%, and SEE was 5.64 cm (F = 28,019.748, P < 0.001). The explanatory power of sit-ups regression models (SRE 34: n = 268,182) was 75.1%, and SEE was 7.44 n (F = 202,721.241, P < 0.001). In addition, the explanatory power of estimated VO2max regression models (SRE 44: n = 151,314) was 88.5%, and SEE was 1.77 ml/kg/min (F = 290,332.119, P < 0.001).
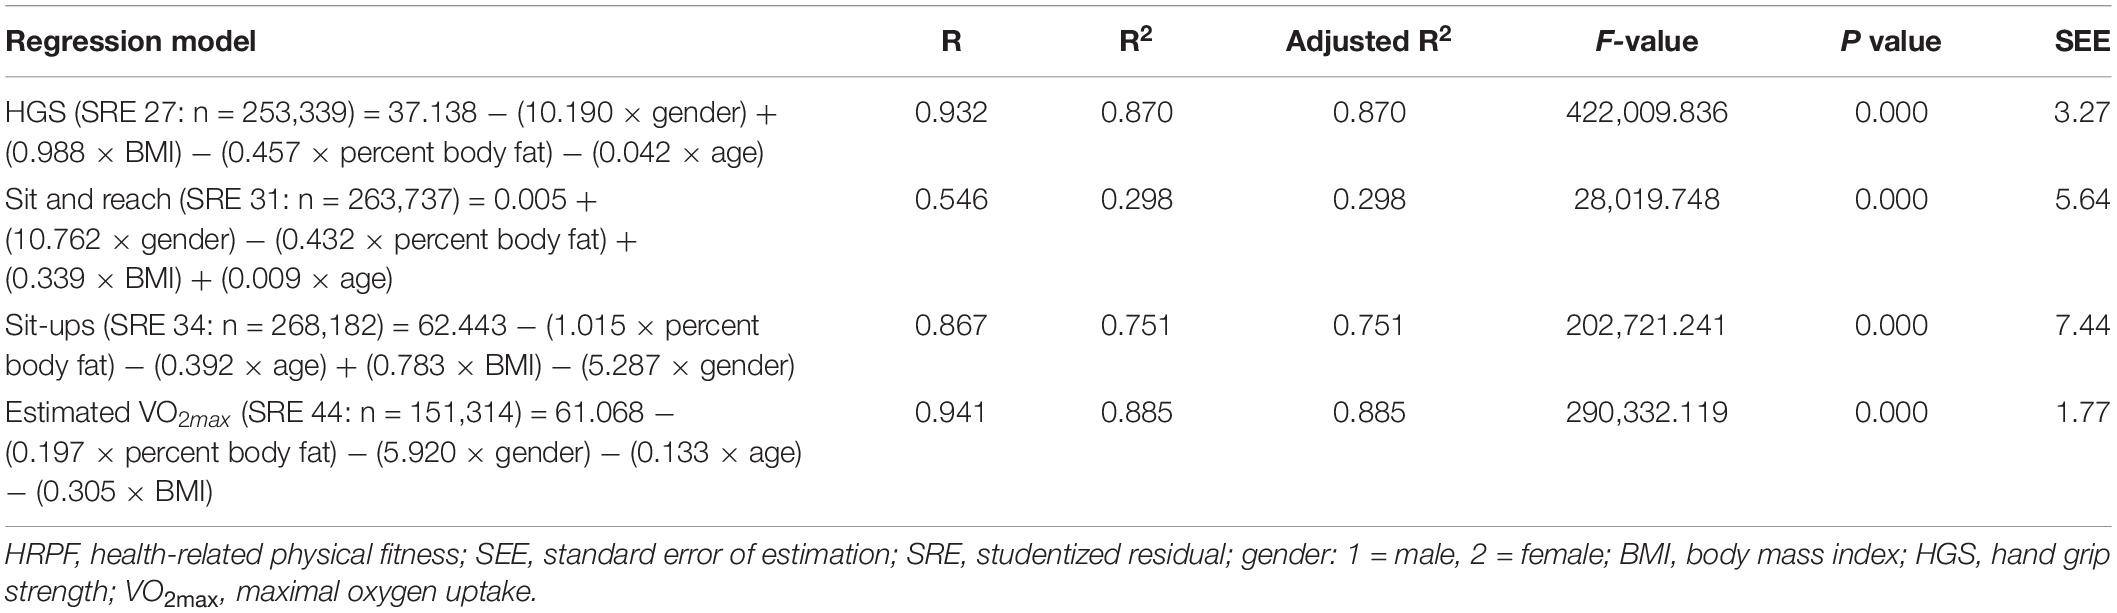
Table 4. Estimated regression equations predicting HRPF parameters without outlier data.
Regression Model Validity
The validity of the developed regression models was calculated using data not included in multiple regression analyses. In all regression models of HRPF parameters, the mean error was −38.13 to 3.36% (HGS: −4.33%, sit and reach: −14.92%, sit-ups: −38.13%, and estimated VO2max: 3.36%), and SEE was higher than the developed regression model (Table 5).
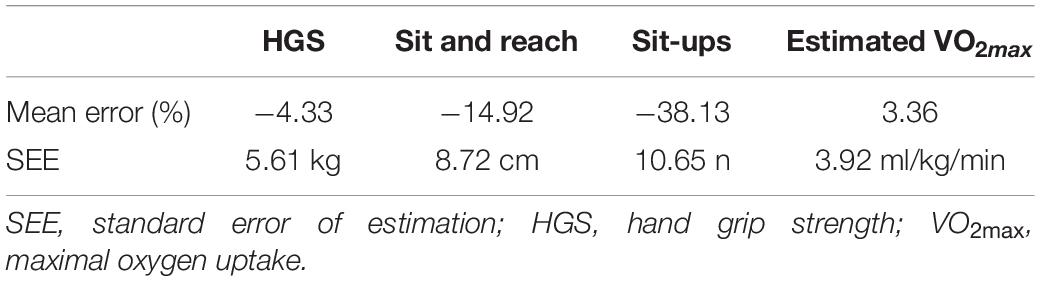
Table 5. Validity of estimating the regression model.
Relationship Between Measured and Predicted HRPF Parameters
Table 6 displays the relationship between the measured and predicted HRPF parameters. Measured HRPF parameters were positively related with predicted HGS (r = 0.841, P < 0.01), sit and reach (r = 0.391, P < 0.01), sit-ups (r = 0.746, P < 0.01), and estimated VO2max (r = 0.848, P < 0.01), as seen in Figure 1.
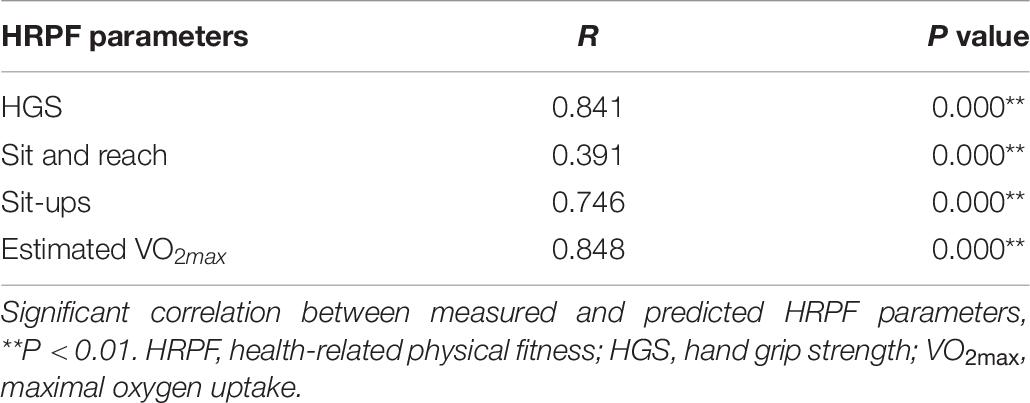
Table 6. Relationship between measured and predicted HRPF parameters.
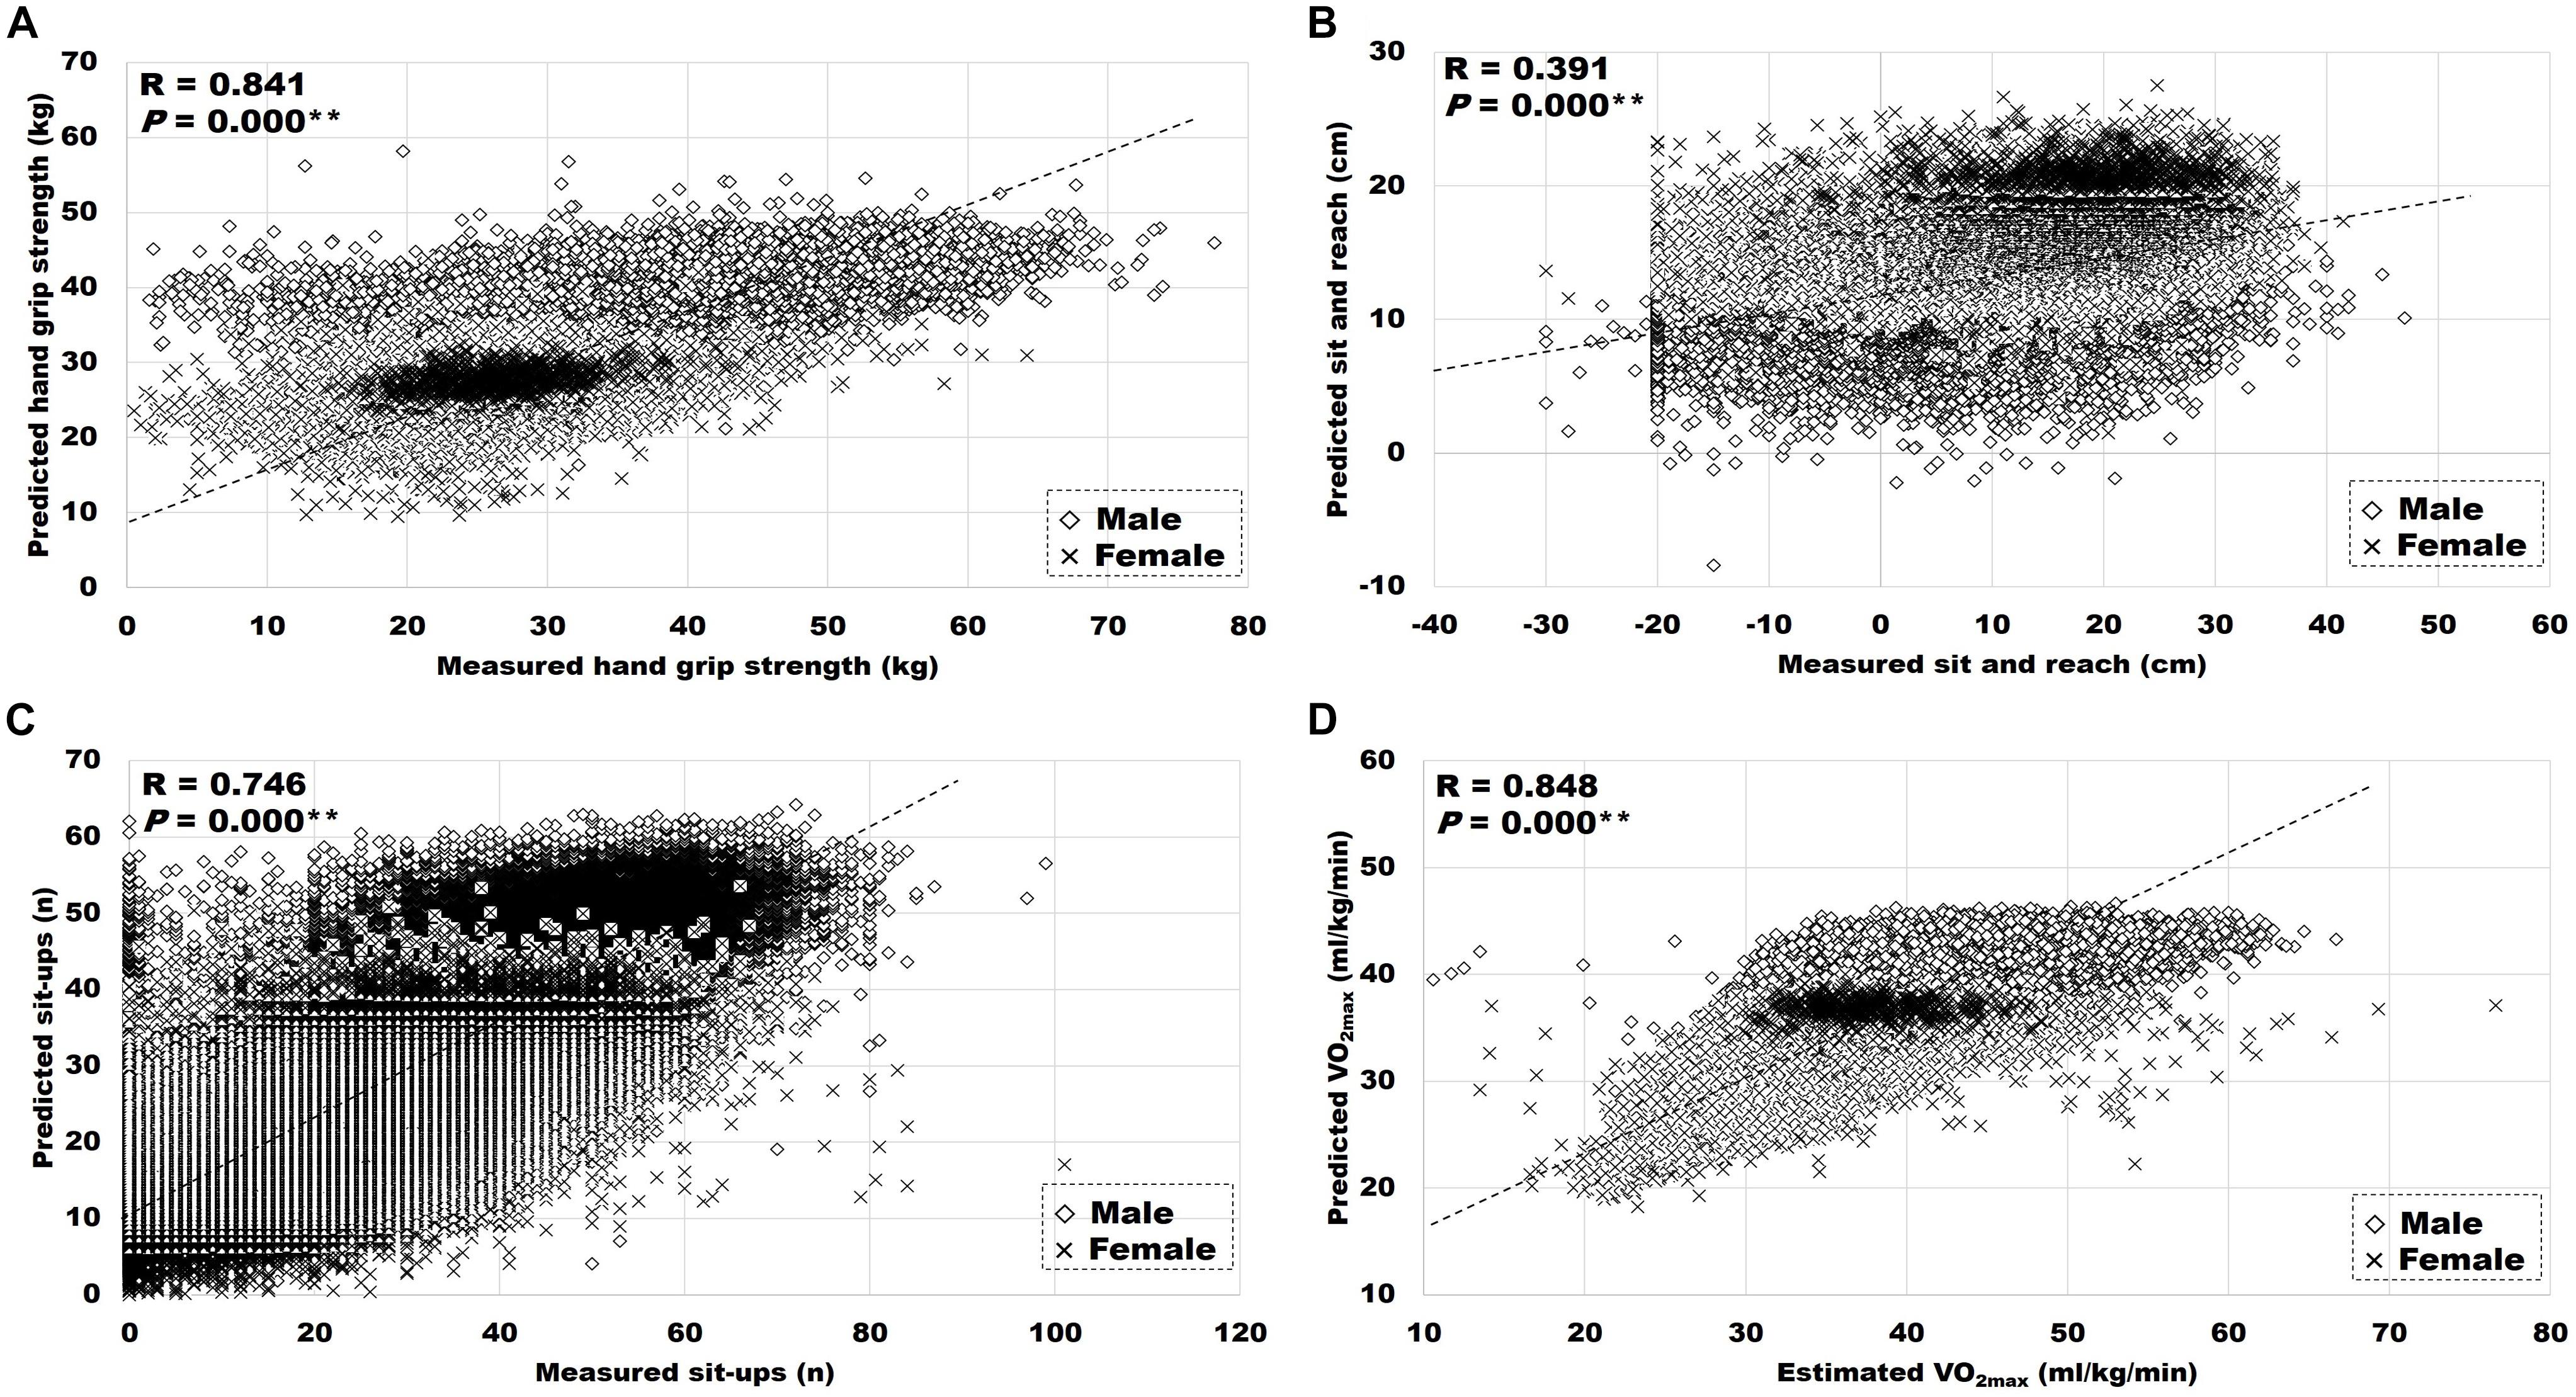
Figure 1. Relationship between measured or estimated, and predicted HRPF. (A) Hand grip strength. (B) Sit and reach. (C) Sit-ups. (D) VO2max. Significant correlation between measured or estimated and predicted variables, **P < 0.01.
Discussion
Over the years, the components of HRPF have been established in various ways in scientific research (Meredith and Welk, 2010). Previous studies describe HRPF as having a multidimensional structure despite the many different definitions (Meredith and Welk, 2010). Some European studies consider HRPF to include body composition, musculoskeletal fitness, CRF, and skill-related fitness (agility, speed, and coordination) (Artero et al., 2011; Ruiz et al., 2011; Secchi et al., 2014). Other studies consider only body composition, CRF, musculoskeletal fitness, and flexibility (Pillsbury et al., 2013); or body composition, CRF, muscle strength, and flexibility as components of HRPF (Castillo-Garzón et al., 2006). However, the American College of Sports Medicine recommends five factors: body composition, flexibility, muscular strength, muscular endurance, and CRF (Liguori and American College of Sports Medicine, 2020). Therefore, multiple regression analysis using the stepwise technique predicted the HRPF parameters (HGS, flexibility, muscular endurance, and CRF) of the American College of Sports Medicine criteria using dependent variables (e.g., gender, age, body mass index, and percent body fat).
Many researchers have conducted studies to evaluate health conditions and exercise performance using HRPF, while assuming that the HRPF parameter is a reliable healthcare index. For healthcare, the development of tools or equipment that can easily measure and evaluate HRPF in daily life will be useful. Previous studies developed equations with relatively small sample sizes or samples with limited age ranges (Esco et al., 2008; Shenoy et al., 2012; Lopes et al., 2018; Zaccagni et al., 2020). This study aimed to develop a multiple regression model for estimating the HRPF parameters in Korean adults using easy-to-measure dependent variables. Before performing multiple regressions to estimate HRPF parameters, it is essential to eliminate outliers because they increase predictive errors. The absolute value of the studentized residual was used to eliminate outliers in this study. The coefficient of determination of the HRPF parameters in the developed multiple regression models was high, except for flexibility. The mean explanatory power of the sit and reach regression model in our study was 29.8%.
The HGS used to evaluate total muscle strength measures the ability of hand muscles to produce force (tension) using a hand dynamometer (Mitsionis et al., 2009). The relevance of HGS measurements continues to grow due to their clinical and epidemiological application for sarcopenia diagnosis, as suggested by the European Working Group (Cruz-Jentoft et al., 2010), or as a nutrition status indication and their association with morbidity and mortality (Norman et al., 2011). HGS has been studied in relation with various anthropometric factors (Alahmari et al., 2017; Eidson et al., 2017; Lopes et al., 2018; Zaccagni et al., 2020). In the current study, the mean explanatory power of the HGS regression model (37.138 − (10.190 × gendermale = 1; female = 2) + (0.988 × BMI) − (0.457 × percent body fat) − (0.042 × age)) was 87.0% (adjusted R2). Alahmari et al. (2017) showed that three variables (i.e., age, hand length, and forearm circumference) predicted 42.7% (adjusted R2) of what constitutes the HGS of healthy adult males (aged: 20–74 years; n = 116) in Saudi Arabia. Furthermore, Zaccagni et al. (2020) reported that the independent variables sex, upper arm muscle area, arm fat index, fat mass, and fat free mass accounted for 74.6% (adjusted R2) of the variance of HGS in young adults (aged: 18–30 years; total: n = 544; male: n = 356; female: n = 188). Lopes et al. (2018) showed that 71% (adjusted R2) of the variability in the dominant HGS could be explained by gender, forearm circumference, and hand length (−15.490 + (10.787 × gendermale = 1; female = 0) + (0.558 × forearm circumference) + (1.763 × hand length)). In addition, 70% (adjusted R2) of the variability in the nondominant HGS was explained by gender and hand length (−9.887 + (12.832 × gendermale = 1; female = 0) + (2.028 × hand length)) in young adult and middle-aged participants (aged: 20–60 years; total: n = 80; male: n = 40; female: n = 40). Our study confirmed that the regression model formulation developed is more accurate and straightforward than the predictive power of previous studies.
The two most important trunk muscle abilities have been presented as trunk muscle strength and muscular endurance in both the athletic and general populations (Granacher et al., 2013). Trunk muscle strength and muscular endurance testing in clinical fields have been important in injury rehabilitation and prevention programs (Jackson et al., 1998; del Pozo-Cruz et al., 2013). Sit-ups test are known to evaluate strength and muscular endurance in the abdomen (Morrow et al., 2015; Liguori and American College of Sports Medicine, 2020). Esco et al. showed that 63.7% (R2) of the variability in sit-ups could be explained by height, push-ups, skinfolds at the thigh, and skinfolds at the subscapularis (1.651 + (0.368 × push-ups) + (0.495 × height) − (0.277 × skinfolds at the thigh) − (0.336 × skinfolds at the subscapularis)) in healthy adults (aged: 18–48 years; total: n = 100; male: n = 40; female: n = 60) (Esco et al., 2008). The sit-ups regression model’s (62.443 − (1.015 × percent body fat) − (0.392 × age) + (0.783 × BMI) − (5.287 × gendermale = 1; female = 2)) mean explanatory power estimated in our study was 75.1% (adjusted R2).
Cardiorespiratory fitness is an essential component of health and physical fitness, and is affected by the respiratory, cardiovascular, and skeletal muscle systems (Liguori and American College of Sports Medicine, 2020). The gold standard measurement of CRF is VO2max when performing a maximum graded exercise test (Liguori and American College of Sports Medicine, 2020). However, while VO2max is the most accurate way to evaluate CRF, testing requires expensive equipment, space to accommodate equipment, and trained personnel. Previous studies developed a method to predict VO2max without exercise using multiple regression analysis (Bradshaw et al., 2005; Shenoy et al., 2012). The non-exercise regression equations provide convenient estimates of CRFs without performing maximum or submaximal exercise tests (Bradshaw et al., 2005). Shenoy et al. showed that 79.9% (adjusted R2) of the variability in VO2max could be explained by gender, perceived functional ability, and body surface area (−1.541 + (1.096 × gendermale = 1; female = 0) + (0.081 × perceived functional ability) + (1.084 × body surface area)) in healthy young Indian adults (aged: 18–27 years; total: n = 120; male: n = 60; female: n = 60) (Shenoy et al., 2012). Bradshaw et al. (2005) showed that 87% (R2) of the variability in VO2max could be explained by gender, age, BMI, perceived functional ability, and PA rating (48.073 + (6.178 × gendermale = 1; female = 0) – (0.246 × age) – (0.619 × BMI) + (0.712 × perceived functional ability) + (0.671 × PA rating)) in adults (aged: 18–65 years; total: n = 100; male: n = 50; female: n = 50). In our study, the mean explanatory power of the estimated VO2max regression model (61.068 − (0.197 × percent body fat) − (5.920 × gendermale = 1; female = 2) − (0.133 × age) − (0.305 × BMI)) was 88.5% (adjusted R2). Accordingly, we obtained similar or higher regression coefficient than previous studies by using independent variables that are more accessible to measure, and a larger sample size. Therefore, we consider the results of this study straightforward and accurate.
Limitations
This study had some limitations. The role of HRPF and nutrition in decreasing the progression of chronic diseases is growing more important (Gil et al., 2015). Nutrition was described as a major modifiable behavior, and HRPF has also been defined as an essential health-related indication (Camões and Lopes, 2008). Previous studies have shown that improvements in HRPF and nutritional factors could prevent functional limitations related to aging, lead to healthier and independent aging processes (Strandberg et al., 2017; Wickramasinghe et al., 2020). However, the association with HRPF parameters could not be evaluated because the NFA database did not provide nutrition information. We only included adults between the ages of 19 and 64 in our analysis. Therefore, the multiple regression equation developed in the present study does not apply to older adults. In the future, a multi-regression equation development study will be necessary to predict the functional physical fitness of older adults.
Conclusion
This study demonstrated that the variability of HGS, muscular endurance, and CRF in healthy adults could be explained by gender, age, BMI, and percent body fat. A multi-regression equation could be developed based on these demographic and anthropometric variables. Since this multi-regression equation requires only a simple parameter measurement, it could be time-efficient, inexpensive, and realistic for large groups in clinical practice. The prediction equation will allow coaches, athletes, healthcare professionals, researchers, and the general public to better estimate the expected HRPF in order to improve the data interpretation.
Data Availability Statement
The original contributions presented in the study are included in the article/Supplementary Material, further inquiries can be directed to the corresponding author.
Ethics Statement
The studies involving human participants were reviewed and approved by Institutional Review Board of Kunkuk University. Written informed consent for participation was not required for this study in accordance with the national legislation and the institutional requirements.
Author Contributions
S-WK, HJ, JL, and H-YP: conception and study design. S-WK, HJ, and H-YP: statistical analysis. H-YP: investigation. S-WK and H-YP: data interpretation and writing–review and editing. S-WK: writing–original draft preparation. KL: supervision. All authors have read and approved the final manuscript.
Funding
This research was supported by the Sports Promoting Fund of the Korea Sports Promotion Foundation (KSPO) from the Ministry of Culture, Sports and Tourism and Konkuk University (KU) Research Professor Program.
Conflict of Interest
The authors declare that the research was conducted in the absence of any commercial or financial relationships that could be construed as a potential conflict of interest.
References
Alahmari, K. A., Silvian, S. P., Reddy, R. S., Kakaraparthi, V. N., Ahmad, I., and Alam, M. M. (2017). Hand grip strength determination for healthy males in Saudi Arabia: a study of the relationship with age, body mass index, hand length and forearm circumference using a hand-held dynamometer. J. Int. Med. Res. 45, 540–548. doi: 10.1177/0300060516688976
Aroganam, G., Manivannan, N., and Harrison, D. (2019). Review on wearable technology sensors used in consumer sport applications. Sensors (Basel) 19:1983. doi: 10.3390/s19091983
Artero, E. G., España-Romero, V., Castro-Piñero, J., Ortega, F. B., Suni, J., Castillo-Garzon, M. J., et al. (2011). Reliability of field-based fitness tests in youth. Int. J. Sports Med. 32, 159–169. doi: 10.1055/s-0030-1268488
Bäckman, E., Johansson, V., Häger, B., Sjöblom, P., and Henriksson, K. G. (1995). Isometric muscle strength and muscular endurance in normal persons aged between 17 and 70 years. Scand. J. Rehabil. Med. 27, 109–117.
Bardsiri, V. K., Jawawi, D. N. A., Hashim, S. Z. M., and Khatibi, E. (2014). A flexible method to estimate the software development effort based on the classification of projects and localization of comparisons. Empiric. Softw. Eng. 19, 857–884. doi: 10.1007/s10664-013-9241-4
Barry, V. W., Baruth, M., Beets, M. W., Durstine, J. L., Liu, J., and Blair, S. N. (2014). Fitness vs. fatness on all-cause mortality: a meta-analysis. Prog. Cardiovasc. Dis. 56, 382–390. doi: 10.1016/j.pcad.2013.09.002
Beltz, N. M., Gibson, A. L., Janot, J. M., Kravitz, L., Mermier, C. M., and Dalleck, L. C. (2016). Graded exercise testing protocols for the determination of VO(2)max: historical perspectives, progress, and future considerations. J. Sports Med. (Hindawi Publ. Corp.) 2016:3968393. doi: 10.1155/2016/3968393
Blair, S. N., and Brodney, S. (1999). Effects of physical inactivity and obesity on morbidity and mortality: current evidence and research issues. Med. Sci. Sports Exerc. 31(Suppl 11), S646–S662. doi: 10.1097/00005768-199911001-00025
Blair, S. N., Cheng, Y., and Holder, J. S. (2001). Is physical activity or physical fitness more important in defining health benefits? Med. Sci. Sports Exerc. 33(Suppl 6), S379–S399. doi: 10.1097/00005768-200106001-00007
Bradshaw, D. I., George, J. D., Hyde, A., LaMonte, M. J., Vehrs, P. R., Hager, R. L., et al. (2005). An accurate VO2max nonexercise regression model for 18-65-year-old adults. Res. Q. Exerc. Sport 76, 426–432. doi: 10.1080/02701367.2005.10599315
Bruce, R. A., Kusumi, F., and Hosmer, D. (1973). Maximal oxygen intake and nomographic assessment of functional aerobic impairment in cardiovascular disease. Am. Heart J. 85, 546–562. doi: 10.1016/0002-8703(73)90502-4
Camões, M., and Lopes, C. (2008). Dietary intake and different types of physical activity: full-day energy expenditure, occupational and leisure-time. Public Health Nutr. 11, 841–848. doi: 10.1017/s1368980007001309
Carnethon, M. R., Gidding, S. S., Nehgme, R., Sidney, S., Jacobs, D. R. Jr., and Liu, K. (2003). Cardiorespiratory fitness in young adulthood and the development of cardiovascular disease risk factors. JAMA 290, 3092–3100. doi: 10.1001/jama.290.23.3092
Castillo-Garzón, M. J., Ruiz, J. R., Ortega, F. B., and Gutiérrez, A. (2006). Anti-aging therapy through fitness enhancement. Clin. Interv. Aging 1, 213–220. doi: 10.2147/ciia.2006.1.3.213
Chen, H. L., Lee, P. F., Chang, Y. C., Hsu, F. S., Tseng, C. Y., Hsieh, X. Y., et al. (2020a). The association between physical fitness performance and subjective happiness among taiwanese adults. Int. J. Environ. Res. Public Health 17:3774. doi: 10.3390/ijerph17113774
Chen, P. H., Chen, W., Wang, C. W., Yang, H. F., Huang, W. T., Huang, H. C., et al. (2020b). Association of physical fitness performance tests and anthropometric indices in taiwanese adults. Front. Physiol. 11:583692. doi: 10.3389/fphys.2020.583692
Chrismas, B. C. R., Majed, L., and Kneffel, Z. (2019). Physical fitness and physical self-concept of male and female young adults in Qatar. PLoS One 14:e0223359. doi: 10.1371/journal.pone.0223359
Cruz-Jentoft, A. J., Baeyens, J. P., Bauer, J. M., Boirie, Y., Cederholm, T., Landi, F., et al. (2010). Sarcopenia: European consensus on definition and diagnosis: report of the European working group on Sarcopenia in older people. Age Ageing 39, 412–423. doi: 10.1093/ageing/afq034
del Pozo-Cruz, B., Gusi, N., Adsuar, J. C., del Pozo-Cruz, J., Parraca, J. A., and Hernandez-Mocholí, M. (2013). Musculoskeletal fitness and health-related quality of life characteristics among sedentary office workers affected by sub-acute, non-specific low back pain: a cross-sectional study. Physiotherapy 99, 194–200. doi: 10.1016/j.physio.2012.06.006
Eidson, C. A., Jenkins, G. R., Yuen, H. K., Abernathy, A. M., Brannon, M. B., Pung, A. R., et al. (2017). Investigation of the relationship between anthropometric measurements and maximal handgrip strength in young adults. Work 57, 3–8. doi: 10.3233/wor-172537
Erikssen, G. (2001). Physical fitness and changes in mortality: the survival of the fittest. Sports Med. 31, 571–576. doi: 10.2165/00007256-200131080-00001
Esco, M. R., Olson, M. S., and Williford, H. (2008). Relationship of push-ups and sit-ups tests to selected anthropometric variables and performance results: a multiple regression study. J. Strength Cond. Res. 22, 1862–1868. doi: 10.1519/JSC.0b013e318181fd03
Fleg, J. L., Morrell, C. H., Bos, A. G., Brant, L. J., Talbot, L. A., Wright, J. G., et al. (2005). Accelerated longitudinal decline of aerobic capacity in healthy older adults. Circulation 112, 674–682. doi: 10.1161/circulationaha.105.545459
Gil, Á, Martinez de Victoria, E., and Olza, J. (2015). Indicators for the evaluation of diet quality. Nutr. Hosp. 31(Suppl 3), 128–144. doi: 10.3305/nh.2015.31.sup3.8761
Granacher, U., Gollhofer, A., Hortobágyi, T., Kressig, R. W., and Muehlbauer, T. (2013). The importance of trunk muscle strength for balance, functional performance, and fall prevention in seniors: a systematic review. Sports Med. 43, 627–641. doi: 10.1007/s40279-013-0041-1
Jackson, A. W., Morrow, J. R. Jr., Brill, P. A., Kohl, H. W. III, Gordon, N. F., and Blair, S. N. (1998). Relations of sit-up and sit-and-reach tests to low back pain in adults. J. Orthop. Sports Phys. Ther. 27, 22–26. doi: 10.2519/jospt.1998.27.1.22
Jeong, D., Park, S., Kim, H., and Kwon, O. (2020). Association of carotenoids concentration in blood with physical performance in Korean adolescents: the 2018 National fitness award project. Nutrients 12:1821. doi: 10.3390/nu12061821
Katzmarzyk, P. T., Church, T. S., and Blair, S. N. (2004). Cardiorespiratory fitness attenuates the effects of the metabolic syndrome on all-cause and cardiovascular disease mortality in men. Arch. Intern. Med. 164, 1092–1097. doi: 10.1001/archinte.164.10.1092
Kim, J., Campbell, A. S., de Ávila, B. E., and Wang, J. (2019a). Wearable biosensors for healthcare monitoring. Nat. Biotechnol. 37, 389–406. doi: 10.1038/s41587-019-0045-y
Kim, S. W., Jung, S. W., Seo, M. W., Park, H. Y., and Song, J. K. (2019b). Effects of bone-specific physical activity on body composition, bone mineral density, and health-related physical fitness in middle-aged women. J. Exerc. Nutr. Biochem. 23, 36–42. doi: 10.20463/jenb.2019.0030
Liguori, G., and American College of Sports Medicine (2020). ACSM’s Guidelines For Exercise Testing and Prescription. Bltomore, MD: Lippincott Williams & Wilkins.
Lin, X., Zhang, X., Guo, J., Roberts, C. K., McKenzie, S., Wu, W. C., et al. (2015). Effects of exercise training on cardiorespiratory fitness and biomarkers of cardiometabolic health: a systematic review and meta-analysis of randomized controlled trials. J. Am. Heart Assoc. 4:e002014. doi: 10.1161/jaha.115.002014
Loncar-Turukalo, T., Zdravevski, E., Machado da Silva, J., Chouvarda, I., and Trajkovik, V. (2019). Literature on wearable technology for connected health: scoping review of research trends, advances, and barriers. J. Med. Internet Res. 21:e14017. doi: 10.2196/14017
Lopes, J., Grams, S. T., da Silva, E. F., de Medeiros, L. A., de Brito, C. M. M., and Yamaguti, W. P. (2018). Reference equations for handgrip strength: normative values in young adult and middle-aged subjects. Clin. Nutr. 37, 914–918. doi: 10.1016/j.clnu.2017.03.018
Mendes, R., Sousa, N., Themudo-Barata, J., and Reis, V. (2016). Impact of a community-based exercise programme on physical fitness in middle-aged and older patients with type 2 diabetes. Gac. Sanit. 30, 215–220. doi: 10.1016/j.gaceta.2016.01.007
Meredith, M. D., and Welk, G. (2010). Fitnessgram and Activitygram Test Administration Manual-Updated, 4th Edn. Champaign, IL: Human Kinetics.
Mier, C. M. (2011). Accuracy and feasibility of video analysis for assessing hamstring flexibility and validity of the sit-and-reach test. Res. Q. Exerc. Sport 82, 617–623. doi: 10.1080/02701367.2011.10599798
Mitsionis, G., Pakos, E. E., Stafilas, K. S., Paschos, N., Papakostas, T., and Beris, A. E. (2009). Normative data on hand grip strength in a Greek adult population. Int. Orthop. 33, 713–717. doi: 10.1007/s00264-008-0551-x
Morrow, J. R. Jr., Mood, D., Disch, J., and Kang, M. (2015). Measurement and Evaluation in Human Performance, 5E. Champaign, IL: Human kinetics.
Myers, J., Kaykha, A., George, S., Abella, J., Zaheer, N., Lear, S., et al. (2004). Fitness versus physical activity patterns in predicting mortality in men. Am. J. Med. 117, 912–918. doi: 10.1016/j.amjmed.2004.06.047
Norman, K., Stobäus, N., Gonzalez, M. C., Schulzke, J. D., and Pirlich, M. (2011). Hand grip strength: outcome predictor and marker of nutritional status. Clin. Nutr. 30, 135–142. doi: 10.1016/j.clnu.2010.09.010
Ortega, F. B., Ruiz, J. R., Castillo, M. J., and Sjöström, M. (2008). Physical fitness in childhood and adolescence: a powerful marker of health. Int. J. Obes. (Lond.) 32, 1–11. doi: 10.1038/sj.ijo.0803774
Park, H. Y., Jung, W. S., Hwang, H., Kim, S. W., Kim, J., and Lim, K. (2020). Predicting the resting metabolic rate of young and middle-aged healthy Korean adults: a preliminary study. Phys Act Nutr 24, 9–13. doi: 10.20463/pan.2020.0002
Pillsbury, L., Oria, M., and Pate, R. (2013). Fitness Measures and Health Outcomes in Youth. Washingdon, DC: The National Academic Press.
Ray, T., Choi, J., Reeder, J., Lee, S. P., Aranyosi, A. J., Ghaffari, R., et al. (2019). Soft, skin-interfaced wearable systems for sports science and analytics. Curr. Opin. Biomed. Eng. 9, 47–56. doi: 10.1016/j.cobme.2019.01.003
Ruiz, J. R., Castro-Piñero, J., España-Romero, V., Artero, E. G., Ortega, F. B., Cuenca, M. M., et al. (2011). Field-based fitness assessment in young people: the ALPHA health-related fitness test battery for children and adolescents. Br. J. Sports Med. 45, 518–524. doi: 10.1136/bjsm.2010.075341
Secchi, J. D., García, G. C., España-Romero, V., and Castro-Piñero, J. (2014). Physical fitness and future cardiovascular risk in argentine children and adolescents: an introduction to the ALPHA test battery. Arch. Argent Pediatr. 112, 132–140. doi: 10.5546/aap.2014.132
Seshadri, D. R., Drummond, C., Craker, J., Rowbottom, J. R., and Voos, J. E. (2017). Wearable devices for sports: new integrated technologies allow coaches, physicians, and trainers to better understand the physical demands of athletes in real time. IEEE Pulse 8, 38–43. doi: 10.1109/mpul.2016.2627240
Shenoy, S., Tyagi, B., Sandhu, J., and Sengupta, D. (2012). Development of non-exercise based VO2max prediction equation in college-aged participants in India. J. Sports Med. Phys. Fitness 52, 465–473.
Shepperd, M., and MacDonell, S. (2012). Evaluating prediction systems in software project estimation. Inform. Softw. Technol. 54, 820–827. doi: 10.1016/j.infsof.2011.12.008
Strandberg, T., Levälahti, E., Ngandu, T., Solomon, A., Kivipelto, M., Lehtisalo, J., et al. (2017). Health-related quality of life in a multidomain intervention trial to prevent cognitive decline (FINGER). Eur. Geriatr. Med. 8, 164–167. doi: 10.1016/j.eurger.2016.12.005
Warburton, D. E., Nicol, C. W., and Bredin, S. S. (2006). Health benefits of physical activity: the evidence. CMAJ 174, 801–809. doi: 10.1503/cmaj.051351
Wickramasinghe, K., Mathers, J. C., Wopereis, S., Marsman, D. S., and Griffiths, J. C. (2020). From lifespan to healthspan: the role of nutrition in healthy ageing. J. Nutr. Sci. 9:e33. doi: 10.1017/jns.2020.26
Williams, P. T. (2001). Physical fitness and activity as separate heart disease risk factors: a meta-analysis. Med. Sci. Sports Exerc. 33, 754–761. doi: 10.1097/00005768-200105000-00012
World Health Organization [WHO] (2010). Global Recommendations on Physical Activity for Health. Geneva: World Health Organization.
Keywords: health-related physical fitness, multiple linear regression, cardiorespiratory fitness, hand grip strength, muscular endurance
Citation: Kim S-W, Park H-Y, Jung H, Lee J and Lim K (2021) Estimation of Health-Related Physical Fitness Using Multiple Linear Regression in Korean Adults: National Fitness Award 2015–2019. Front. Physiol. 12:668055. doi: 10.3389/fphys.2021.668055
Received: 15 February 2021; Accepted: 16 April 2021;
Published: 13 May 2021.
Edited by:
Carlo Zancanaro, University of Verona, ItalyReviewed by:
Rute Santos, Laboratory for Applied Health Research (LabinSaúde), PortugalHamid Arazi, University of Guilan, Iran
Copyright © 2021 Kim, Park, Jung, Lee and Lim. This is an open-access article distributed under the terms of the Creative Commons Attribution License (CC BY). The use, distribution or reproduction in other forums is permitted, provided the original author(s) and the copyright owner(s) are credited and that the original publication in this journal is cited, in accordance with accepted academic practice. No use, distribution or reproduction is permitted which does not comply with these terms.
*Correspondence: Kiwon Lim, exercise@konkuk.ac.kr
†These authors have contributed equally to this work and share first authorship