
94% of researchers rate our articles as excellent or good
Learn more about the work of our research integrity team to safeguard the quality of each article we publish.
Find out more
ORIGINAL RESEARCH article
Front. Physiol. , 21 January 2021
Sec. Integrative Physiology
Volume 11 - 2020 | https://doi.org/10.3389/fphys.2020.583825
 Sarah A. Purcell1,2,3
 Michelle Mackenzie1Thiago G. Barbosa-Silva4,5Isabelle J. Dionne6,7Sunita Ghosh8Mario Siervo9Ming Ye10
 Carla M. Prado1*
Sarcopenic obesity is associated with several negative health outcomes. However, the prevalence of this condition – and the relationship to physical performance parameters – varies across definitions. The aim of this cross-sectional investigation was to describe the prevalence of sarcopenic obesity using different published definitions and their relationship with handgrip strength and walking speed in older Canadian adults. Individuals aged 65+ in the Canadian Longitudinal Study on Aging (n = 11,803; 49.6% male, 50.4% female) were included. Body composition was measured using dual X-ray absorptiometry. Sarcopenic obesity was defined using 29 definitions. Low handgrip strength was identified as < 27 kg in males and < 16 kg in females and poor physical performance was defined as gait speed ≤ 0.8 m/s. The prevalence of sarcopenic obesity ranged from 0.1 to 85.3% in males, and from 0 to 80.4% in females. Sarcopenic obesity was frequently associated with low handgrip strength (p < 0.05) in both males (14/17 definitions, 82.4%) and females (21/29 definitions, 72.4%). In very few definitions, sarcopenic obesity was associated with slow gait speed (males: 1/17 definitions [6.7%]; females: 2/29 [6.9%]). In conclusion, the prevalence of sarcopenic obesity varied greatly according to definitions and sarcopenic obesity was frequently associated with low handgrip strength.
Population aging and obesity are two of the greatest epidemiological trends occurring globally (Roubenoff, 2004). Currently, one in six Canadians (17.2%) is ≥ 65 years of age (Statistics Canada, 2019a); 28.0% of older Canadians have a body mass index (BMI) in the ‘obese’ category (≥ 30 kg/m2) and another 40.3% have a BMI in the ‘overweight’ category (≥ 25 kg/m2) (Statistics Canada, 2019b).
Both aging and obesity are associated with significant health problems. Morbidity of aging and obesity are both mediated in part through changes in body composition (i.e., the amounts of fat and lean tissues in the body). One such body composition alteration that occurs with senescence is decreased muscle mass. Although loss of muscle mass is an ubiquitous problem as one ages, negative consequences such as increased health care costs, physical impairment, disability, falls, fractures and frailty (Baumgartner et al., 1998; Bales and Ritchie, 2002; Janssen et al., 2004; Visser and Schaap, 2011) are only evident once a threshold of muscle loss is reached.
Low muscle mass may also occur with obesity (excess fat mass), a term called ‘sarcopenic obesity.’ This condition is a considerable public health problem with severe consequences (Roubenoff, 2004; Prado et al., 2012). The double-burden of low muscle mass and obesity may accentuate the risk of developing chronic degenerative diseases but, more importantly, it could increase the years of disability, which have a severe impact on the sustainability and efficiency of health initiatives across all levels of organizations (primary and secondary care, social support, public health and policy makers) (Roubenoff, 2004). In fact, there is evidence to suggest that individuals with sarcopenic obesity have worse morbidity, disability and mortality than either low muscle mass or obesity (Baumgartner et al., 2004; Schrager et al., 2007; Zhang et al., 2019). Moreover, obesity masks low muscle mass, making its diagnosis and identification of clinical consequences a challenge (Prado et al., 2012).
Despite the negative impact of these abnormal body composition phenotypes on the public health care system, there is no consensus on the most appropriate definition for sarcopenic obesity. Contrary to popular belief, the combination of definitions of ‘sarcopenia’ in older adults (muscle mass and function) with high BMI or adiposity is not widely accepted in the context of sarcopenic obesity. The lack of standardized criteria impacts awareness, resource allocation and the recognition of this condition as an important public health problem. Additionally, factors such as age, ethnicity, and geographical location all impact body composition (Lear et al., 2009; Silva et al., 2010), yet a comparison of the prevalence of sarcopenic obesity definitions has not been described in Canadians. Furthermore, which definitions of sarcopenic obesity most closely relate to strength or physical performance outcomes is unknown within this population. Therefore, the objective of the current investigation was to describe the prevalence of sarcopenic obesity using different published definitions in older Canadian adults. As an exploratory objective, we also characterized the relationship between each definition of sarcopenic obesity with handgrip strength and walking speed.
The present cross-sectional analysis used data from the Canadian Longitudinal Study on Aging (CLSA) (Raina et al., 2009; Kirkland et al., 2015). The CLSA is a large national cohort study of individuals age 45–85 that collects longitudinal data on several biological, medical, psychological, social, and economic aspects of health and disease. Individuals are randomly selected for inclusion based on age and sex strata via the Canadian Community Health Survey and provincial health care records. Individuals are included the CLSA cohort if they are between the ages of 45–85 years and able to read and speak in English or French. Those in long-term care facilities or with cognitive impairment that precludes informed consent at baseline are excluded. For the present analysis, only baseline data for males and females aged ≥ 65 years old who were part of the in-depth, nationwide cohort of the CLSA were included. Age, sex, comorbidities, and health behaviors were self-reported during an in-person interview. Participants also self-identified their ethnicity or cultural background their ancestors belonged. The following responses were considered ‘Caucasian’: Canadian, French, English, German, Scottish, Irish, Italian, Ukrainian, Dutch, Hebrew, Polish, Norwegian, Welsh, Swedish. Due to the known differences in body composition among different ethnicities (Heymsfield et al., 2016) and the small number of participants who self-identified as non-Caucasian ethnic backgrounds, only Caucasian participants were included in the present analysis.
Height and weight were measured using standard procedures during a visit to the nearest data collection site. Body weight was recorded using a 140-10 Digital Physician Scale (Rice Lake Weight Systems, Rice Lake, WI, United States) after removal of shoes, headwear, and excess layers of clothing. Height was measured with a Seca 213 stadiometer (Hamburg, Germany) to the nearest 0.1 centimeter. The average of two measures of height and weight were used. Body mass index was calculated from height and weight measurements and classified according to the World Health Organization cut-points (underweight < 18.5 kg/m2, normal weight 18.5–24.9 kg/m2, overweight 25.0–29.9 kg/m2, and obese ≥ 30.0 kg/m2) (World Health Organization, 2015).
Body composition was measured using whole body dual energy X-ray absorptiometry (DXA) Hologic Discovery ATM (Marlborough, MA, United States). The sum of lean soft tissue (LST) in both arms and legs was used as a measure of appendicular skeletal muscle mass (ASM; kg) and appendicular skeletal muscle index (ASMI; ASM [kg]/height [m2]) was calculated from this value. Although a more correct definition of this compartment would be appendicular LST as skeletal muscle is not directly measured (Heymsfield et al., 1990), we will use the common abbreviations (i.e. ASM and its derivatives) to avoid confusion with the originally published studies. Whole-body fat mass (FM) and LST including bone (fat-free mass, FFM) were also used for sarcopenic obesity assessment. Truncal fat mass (TrFM) from DXA results were also used for sarcopenic obesity definitions. Measures of body composition were expressed in absolute values (kg), adjusted for height or BMI, or as a percent of total body weight (e.g., FM [kg]/body weight [kg] x 100, percent body fat) according to selected definitions. For consistency, we referred to whole-body LST assessments as “muscle mass” assessments in this paper for simplicity.
Definitions of ‘sarcopenia’ within aging literature (i.e., primary sarcopenia) may require the coexistence of both low muscle mass and poor physical function or performance (Cruz-Jentoft et al., 2019). However, sarcopenic obesity has rarely been defined with physical function or performance parameters and there is no consensus that including other functional indices is the best approach for identifying this condition (Donini et al., 2019). Further, the International Classification of Disease, 10th Revision (ICD-10) code for sarcopenia (M62.84) does not specify how sarcopenia should be defined. Therefore, there is no consensus for sarcopenic obesity definition. As such, sarcopenic obesity in the current investigation was defined as concurrent low muscle mass (defined by several different definitions including LST, ASM, and FFM compartments and its derivatives) and obesity. Diagnostic criteria for sarcopenic obesity were adopted based on pre-defined body composition cut points of this condition, as well as individual definitions of low muscle mass (per previous sentence) and obesity according to a previous systematic literature search (Johnson Stoklossa et al., 2017). Although differences in body composition among ethnicities may exist, definitions were not excluded based on ethnicity to ensure our findings are inclusive and can inform future research regarding performance of each published definition, a similar approach to others (Batsis et al., 2013; Khor et al., 2020). Many previous publications that established sarcopenic obesity cut points were developed from individuals with a wide variety of ethnicities (Baumgartner et al., 1998, 2004; Newman et al., 2003; Levine and Crimmins, 2012; Prado et al., 2014; Batsis et al., 2015; Siervo et al., 2015).
Eleven studies that defined sarcopenic obesity based upon body composition derived from DXA were used in the present analysis (Baumgartner et al., 1998, 2004; Newman et al., 2003; Zoico et al., 2004; Bouchard et al., 2009; Kim et al., 2009; Levine and Crimmins, 2012; Prado et al., 2014; Batsis et al., 2015; Oh et al., 2015; Siervo et al., 2015). As many of these publications developed multiple definitions of sarcopenic obesity, a total of 29 definitions were applied to the CLSA sample.
Each definition of low muscle mass and obesity used sex-specific cut-points, except for those that defined obesity using BMI. Linear regression with ASM, height, FM, with (Kim et al., 2009) or without (Newman et al., 2003) age were used to determine low muscle mass prevalence using residuals. In this method, cutpoints were determined based on relative distance from the regression line; positive residuals indicate relatively higher ASM while lower residuals indicate relatively lower ASM.
Two publications (Zoico et al., 2004; Kim et al., 2009) calculated skeletal muscle percent as:
where ASM and body weight are in kilograms, age is in years and sex = 0 for female and 1 for male (Kim et al., 2002).
Abnormal body composition was also identified using centiles of FM:FFM and TrFM:ASM proposed by Siervo et al. (2015). Body composition phenotypes as proposed by Prado et al. (2014) (low adiposity/high muscularity, high adiposity/high muscularity, low adiposity/low muscularity, high adiposity/low muscularity) using deciles of ASMI and FM index were also explored. The prevalence of abnormal body composition phenotypes using the Prado et al. cut-points were described in more depth and across age groups because these definitions are specific for sex, age and BMI and were developed using a large sample of North Americans, who presumably have similar characteristics to individuals in the CLSA dataset.
Handgrip strength was measured using a digital grip dynamometer (Tracker Freedom JTECH Medical; Midvale, Utah, United States). Participants sat in a straight-backed chair with feet on the floor and upper arms close to the body with the elbow of the dominant hand at 90 degrees flexion. After a practice maximal squeeze of the dynamometer, participants completed three maximal squeezes with 15 s between each trial. The highest measure from the dominant hand was used in this analysis. Low handgrip strength was defined as < 16 kg in females and < 27 kg in males, in line with the updated recommendations proposed by the European Working Group on Sarcopenia in Older People (Cruz-Jentoft et al., 2019).
Participants completed a 4-meter gait speed test to assess physical performance. A practice trial was completed before each test. Participants were instructed to walk as fast as possible through a straight 4-meter path marked on the floor and asked to stop a few steps after the finish line. The time taken to complete the course was recorded using a stopwatch. Speed was calculated as the 4-meter length of the path divided by the time to complete the test (m/s). Slow gait speed was defined as < 0.8 m/s (Cruz-Jentoft et al., 2019).
Descriptive statistics were conducted to characterize subject demographics, anthropometrics, and body composition. For continuous variables such as age and BMI, mean ± standard deviation (SD) were reported and normality was assessed using the Anderson-Darling Normality test. For variables with discrete quantities, such as sex and binary outcomes (yes/no) for each body composition definition, frequencies and proportions were reported. No sampling or analytical weight were applied to our data. Differences in continuous variables between males and females were assessed using independent samples t-test. Pearson correlation was used to describe the relationship between body weight with muscle mass. Chi-square tests were used to describe the relationship between each definition of sarcopenic obesity with low handgrip strength (categorized into binary variables based on sex-specific cut-points) and slow gait speed. All analyses reported 2-sided p-values with significance levels of 0.05. STATA®14 (StataCorp LLC, College Station, TX) was used for data analysis.
A total of 11,803 adults ≥ 65 years old were included in the present analysis (n = 5,856, 49.6% males; n = 5,947, 50.4% females). Of those, 2,532 (21.5%) had Type II diabetes mellitus, 5,798 (49.1%) had hypertension, 2,269 (19.2%) had any type of heart disease, and 521 (4.4%) were current smokers. Most (n = 11,745, 99.5%) had measures of BMI, 11,196 (94.9%) had measures of body composition, 10,669 (90.4%) had measures of handgrip strength, and 11,655 (98.7%) had gait speed. Two individuals’ body composition data was excluded due to unfeasible values (i.e., LST greater than body weight). The average age of the entire sample was 73.1 ± 5.7 years and most individuals had a BMI in the World Health Organization-defined overweight (n = 5,057, 43.1%) or obese (n = 3,342, 28.5%) categories with a small proportion in considered underweight (n = 96, 0.1%). Most individuals reported being married or in a common law partnership (n = 7,354, 62.3%) and 21.1% (n = 2,489) reported a university degree or certificate above a bachelor’s degree. As expected, differences in height, weight, and body composition were apparent between males and females, Table 1.
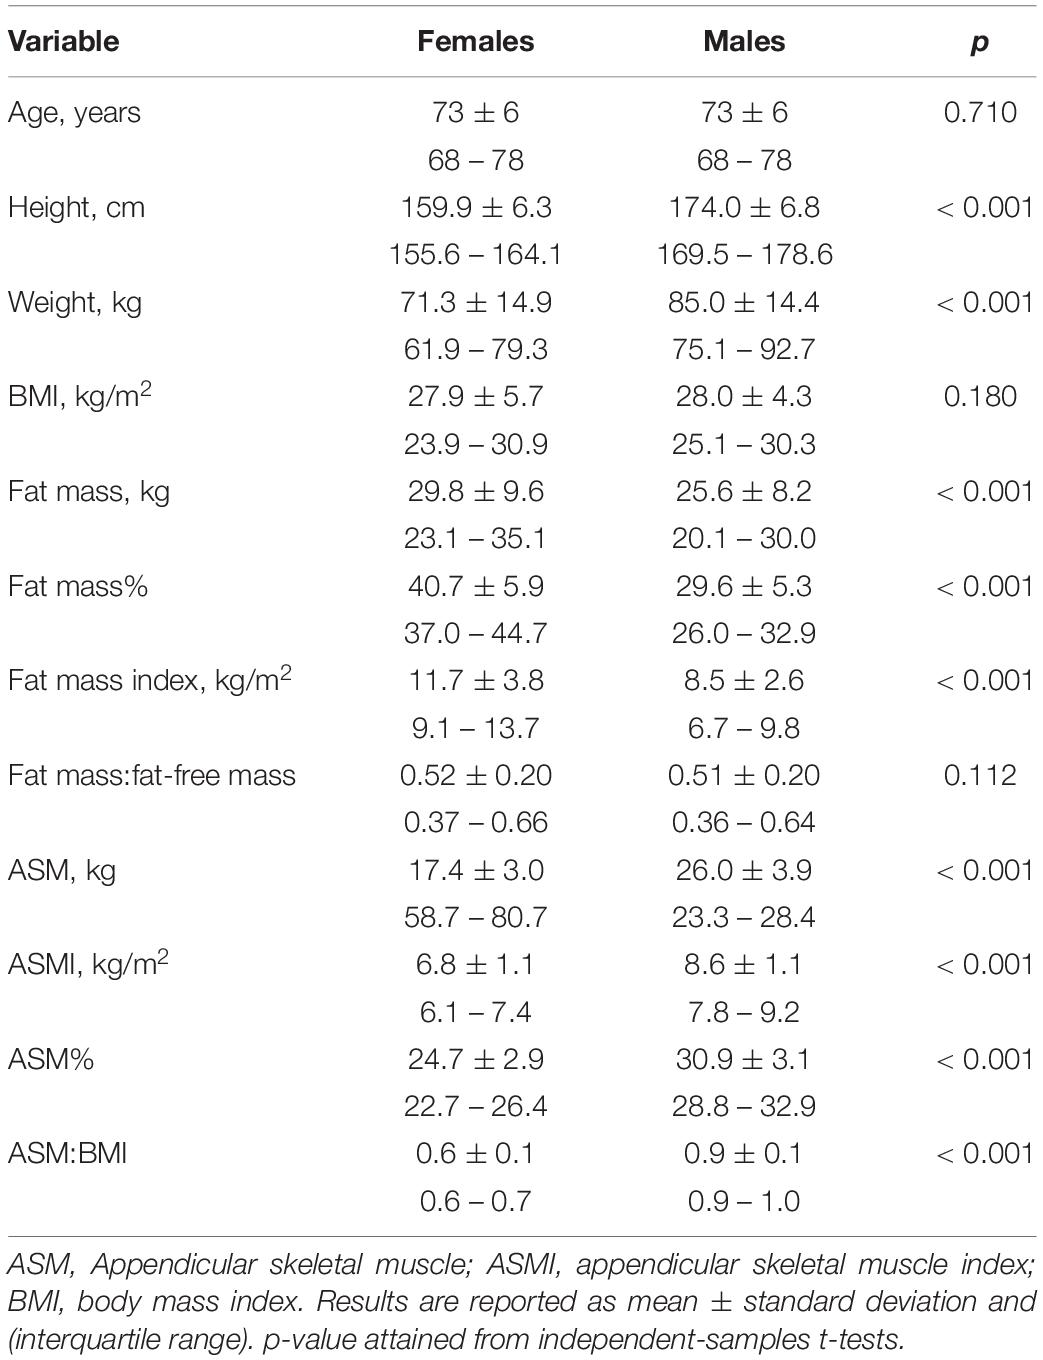
Table 1. Demographic, anthropometric, and body composition characteristics of 11,803 Caucasian Canadians ≥ 65 years old.
LST was positively correlated to body weight (in both sexes, r = 0.88, p < 0.001) and BMI (males: r = 0.69, p < 0.001; females: r = 0.72, p < 0.001). However, a wide variability in LST was observed across the body weight and BMI spectrum in both sexes, Figures 1A,B. For example, males with a BMI of 25.0 kg/m2 had LST ranging between 35.2 and 69.5 kg; likewise, females with a BMI of 35.0 kg/m2 had LST ranging from 33.9 to 62.0 kg.
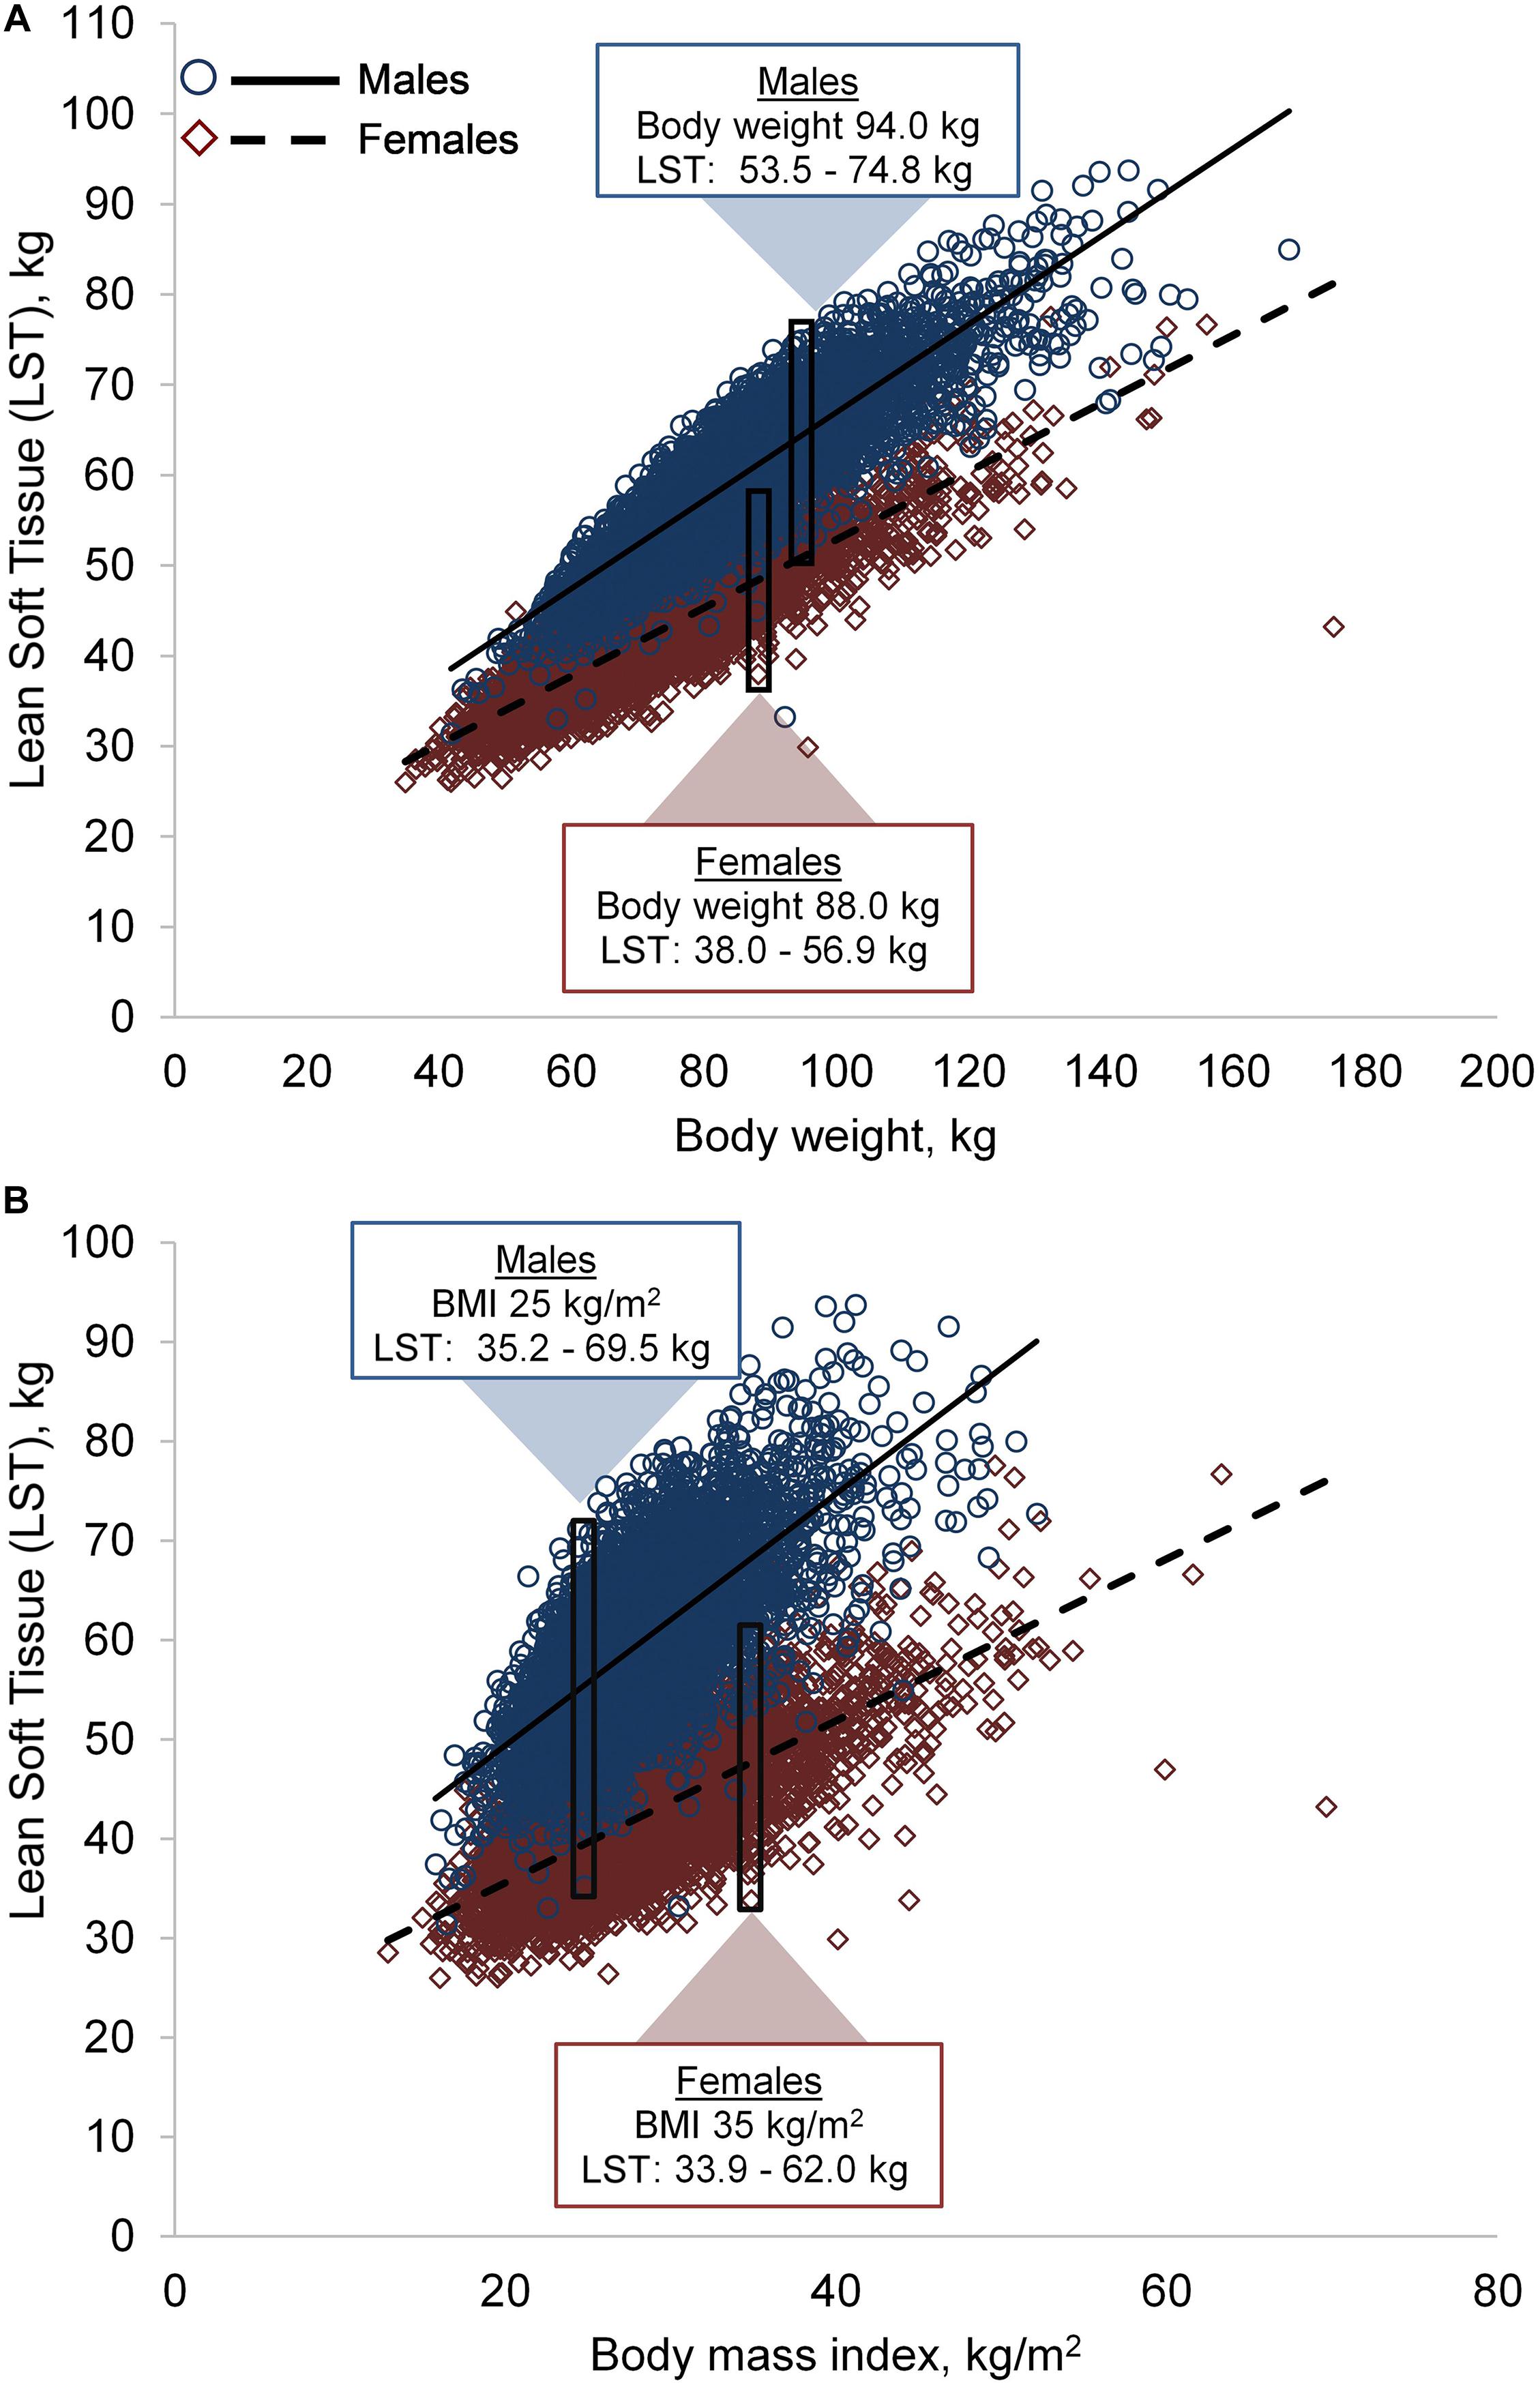
Figure 1. Variability in lean soft tissue (LST) by body weight (A) and body mass index (BMI) (B). Males, n = 5,585; females, n = 5,605. The rectangles and corresponding data are examples of LST variability in two individuals with similar body weight or BMI.
The prevalence of sarcopenic obesity using each definition are presented in Table 2. Prevalence of sarcopenic obesity ranged from 0.1% based on Newman et al. (2003) to 85.3% based on Kim et al. (2009) in males and 0% based on definitions from Batsis et al. and Zoico et al. (Newman et al., 2003; Zoico et al., 2004; Batsis et al., 2015) to 80.4% based on Kim et al. in females (Kim et al., 2009).
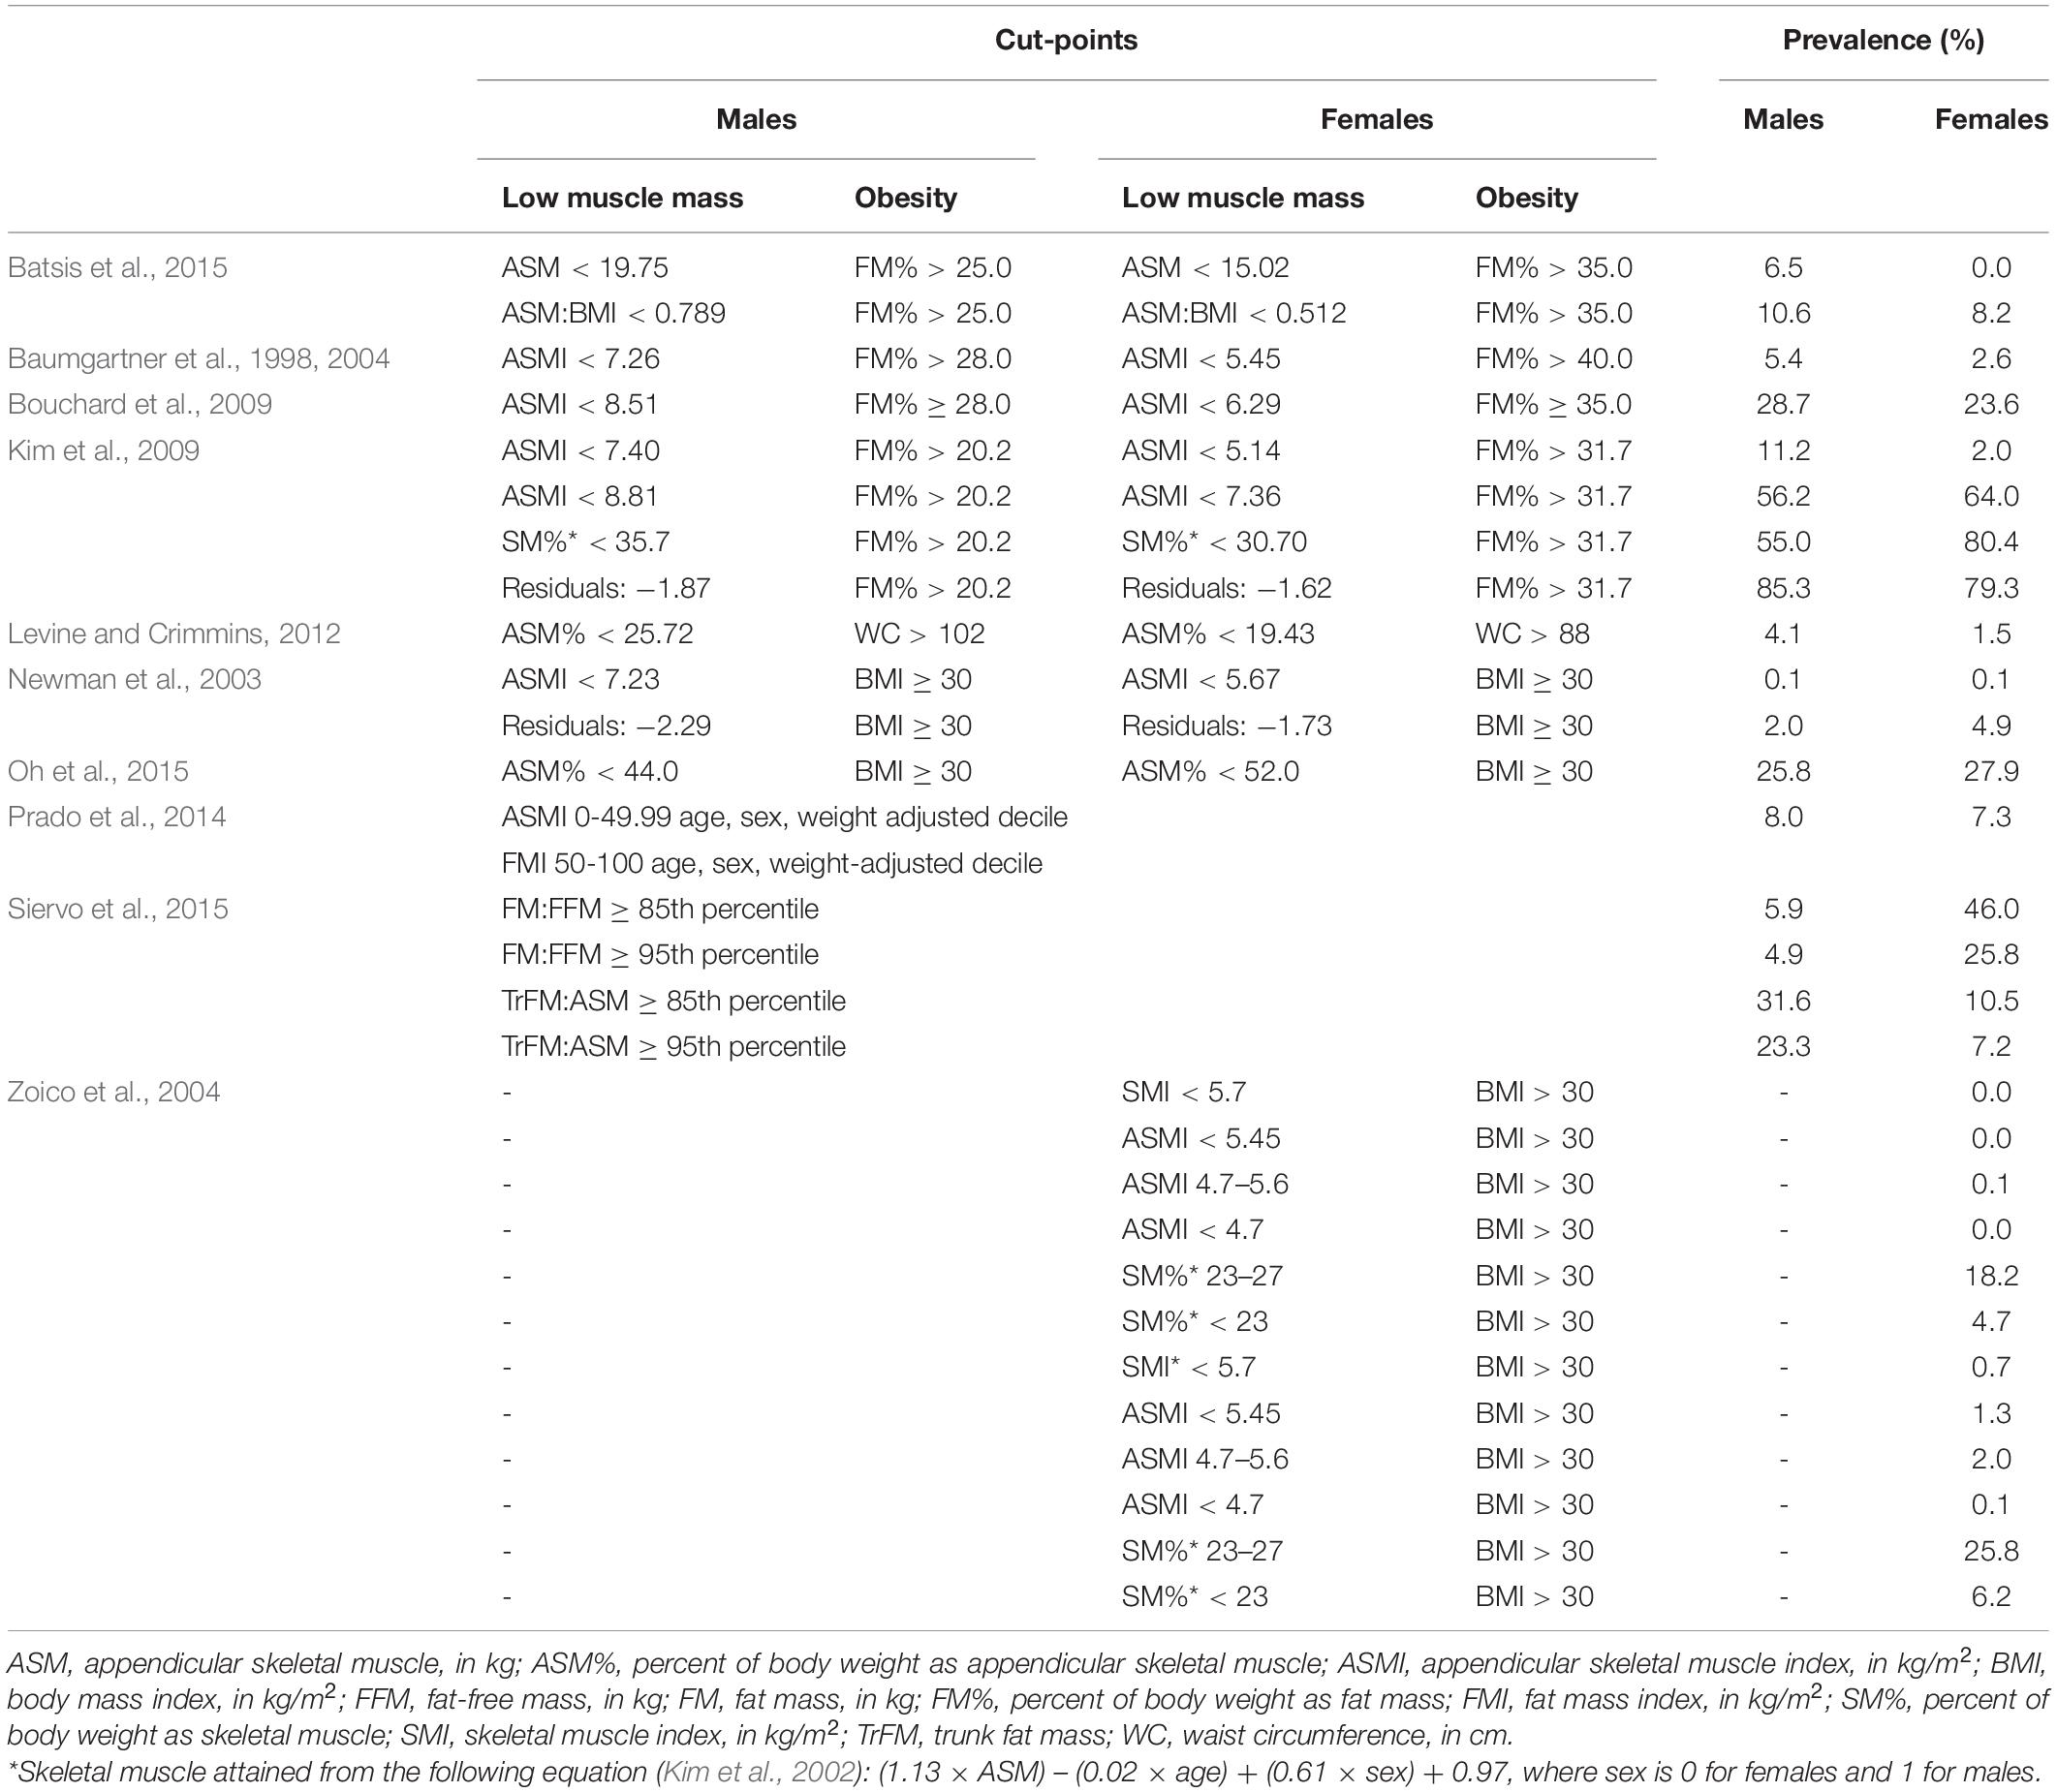
Table 2. Prevalence of sarcopenic obesity according to different criteria in n = 11,803 adults ≥ 65 years old.
Supplementary Table 1 includes the prevalence for each individual phenotype (depicting low muscle mass or obesity). In males, prevalence of low muscle mass ranged from 4.6% based on the definition from Levine and Crimmons (Levine and Crimmins, 2012) to 95.1% based on the definition from Oh et al. (2015). In females, low muscle mass prevalence ranged from 0.5% using cut-points from Zoico et al. (2004) to 94.0% using Oh et al. (2015). At least 27.2% of males and 29.7% of females had obesity based on the definition as BMI 30 kg/m2 or higher (Newman et al., 2003; Oh et al., 2015; Siervo et al., 2015). The prevalence of obesity was generally higher if using body composition assessments (i.e., FM or % FM) or waist circumference as opposed to BMI-based definitions.
The most prevalent body composition phenotype based on the framework proposed by Prado et al. (2014) was low adiposity and high muscularity (54.2% males, 45.0% females), followed by high adiposity and high muscularity (27.8% males, 33.2 females). High adiposity and low muscularity was present only in a minority of individuals (8.4% males, 7.8% females) and the prevalence of low adiposity and low muscle across all subgroups was higher than the prevalence of underweight (0.1%). However, the prevalence of this body composition phenotype increased across age groups, Figure 2.
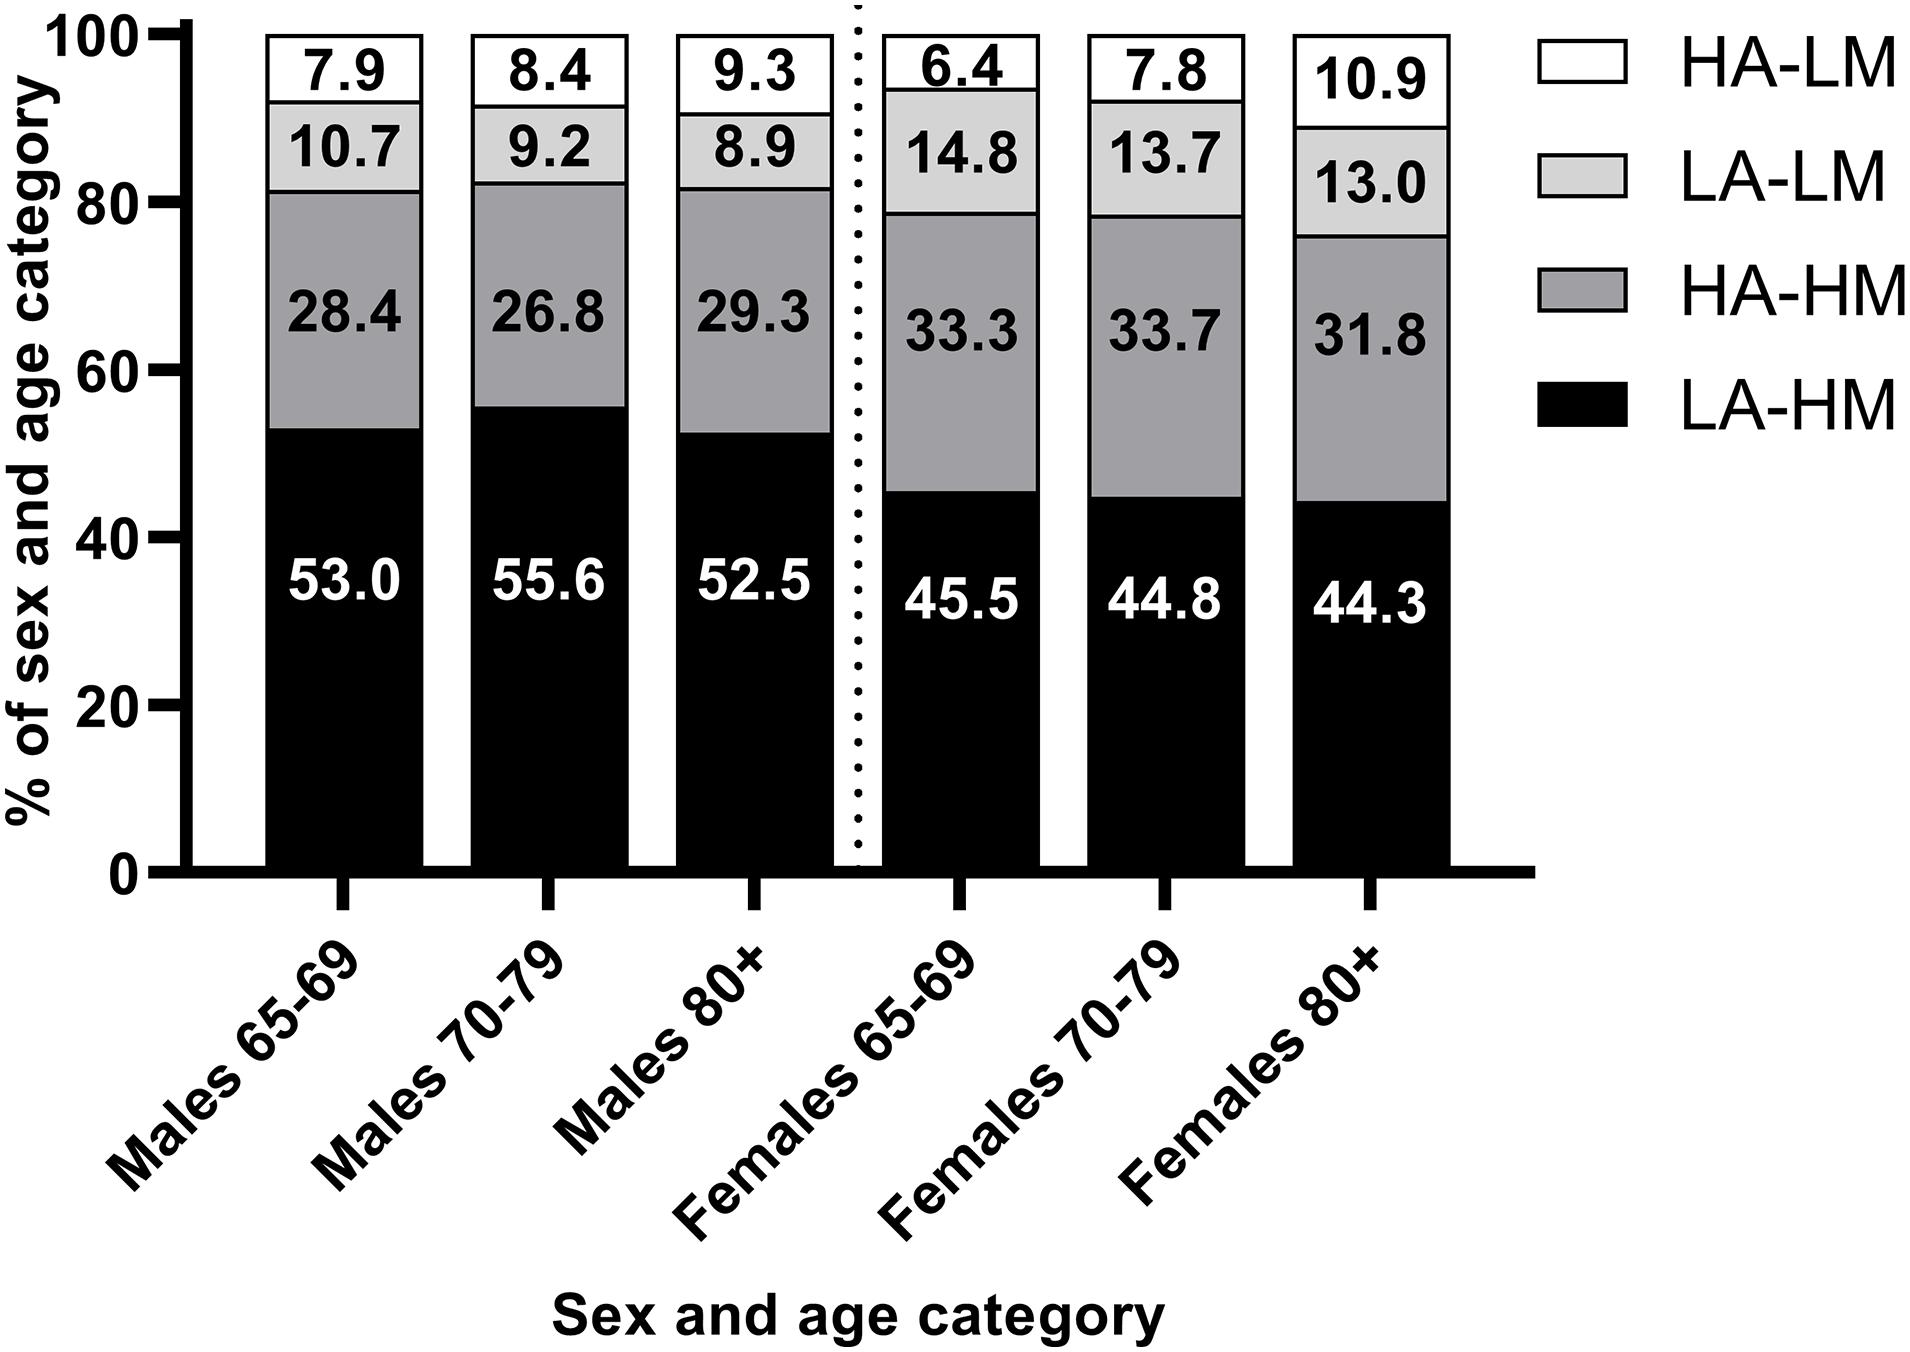
Figure 2. Prevalence of different body composition phenotypes by sex and age group. HA, high adiposity; LM, low muscularity; LA, low adiposity; LM, low muscularity. High and low adiposity and muscularity defined as > or < 50th decile of age-, sex-, weight-adjusted fat mass index (adiposity) and appendicular skeletal muscle index (muscularity) from Prado et al. (2014).
As shown in Table 3, there was a significant relationship between low handgrip strength and sarcopenic obesity from most definitions (males: 14/17 definitions [82.4%]; females: 21/29 definitions [72.4%]). In other words, individuals with sarcopenic obesity were more likely to have low handgrip strength than those without sarcopenic obesity. However, few definitions of sarcopenic obesity were related to slow gait speed (males: 1/17 definitions [6.7%]; females: 2/29 [6.9%]) (Newman et al., 2003; Zoico et al., 2004; Batsis et al., 2015).
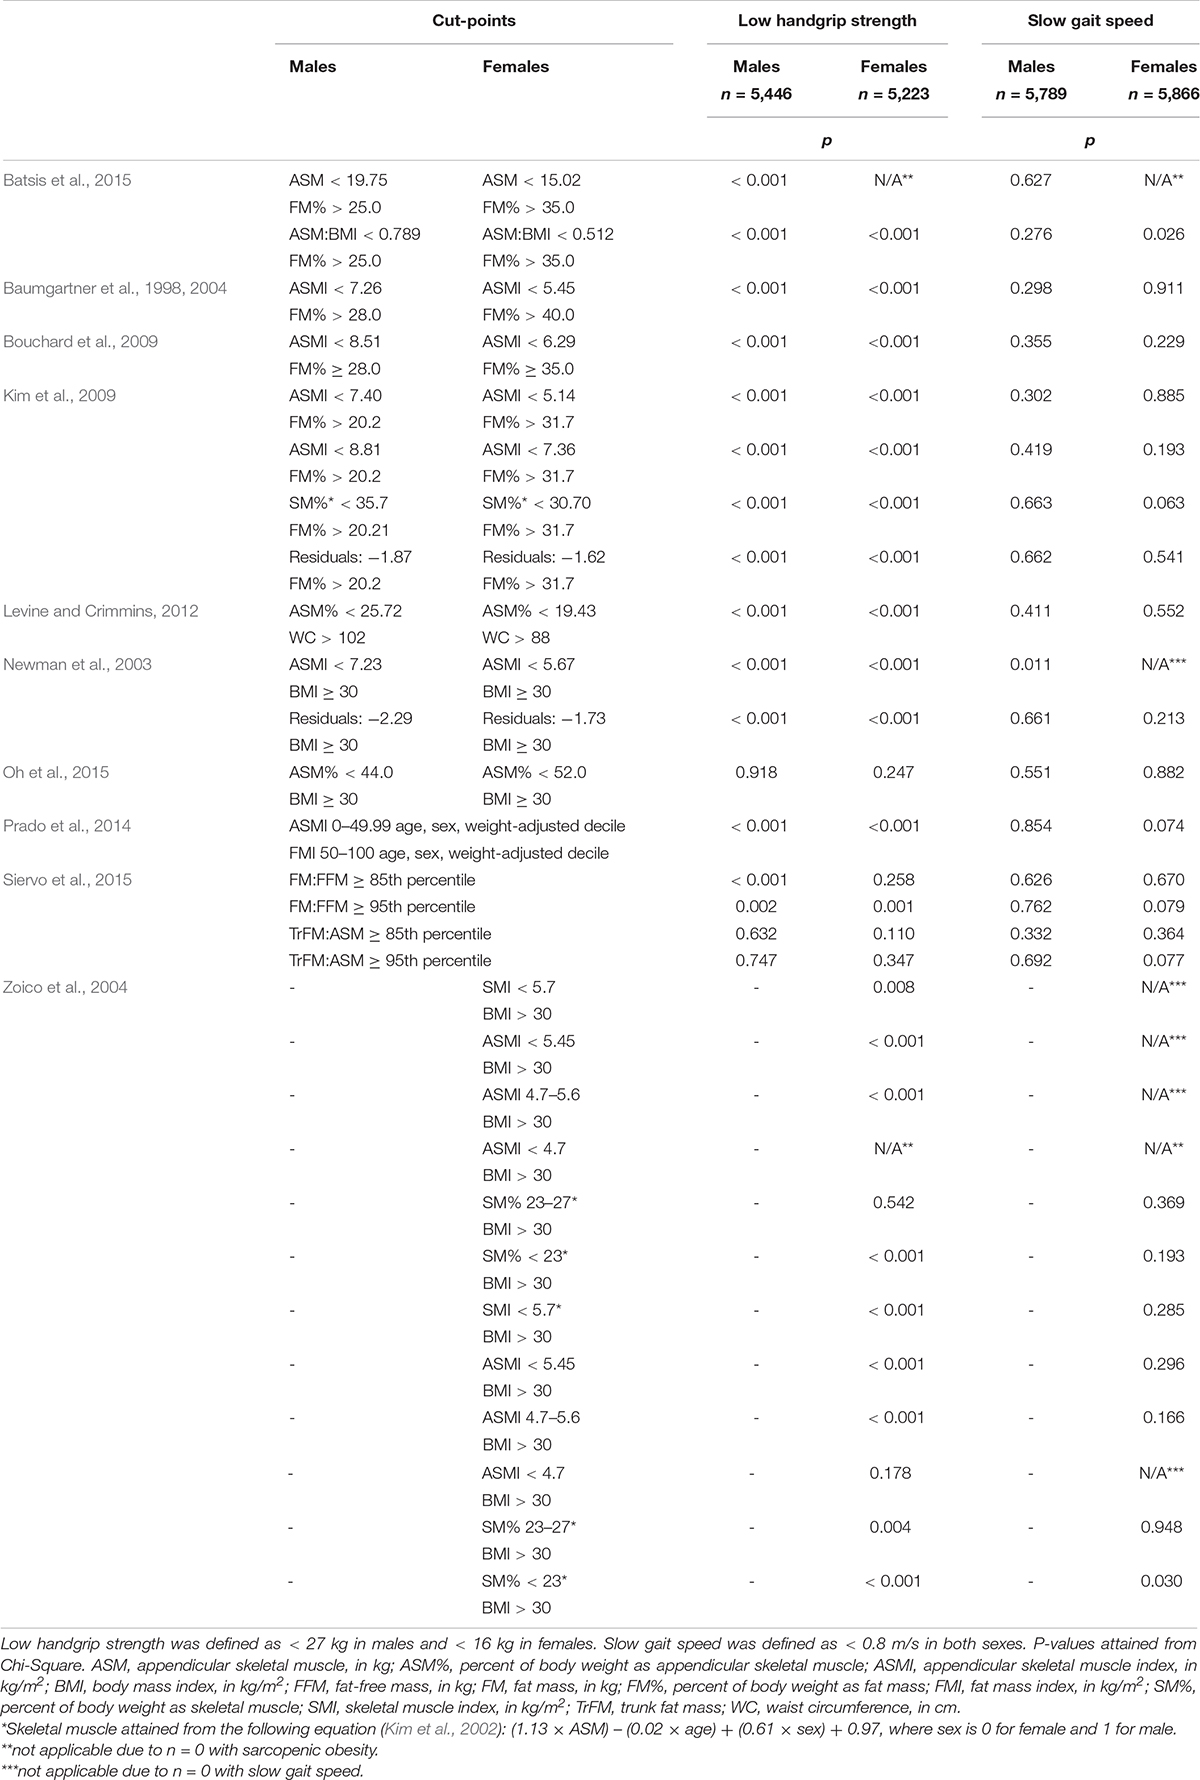
Table 3. Relationship of sarcopenic obesity (SO) definitions with handgrip strength and gait speed.
Identifying the most appropriate definition of sarcopenic obesity for a given population may help improve resource allocation, awareness of the condition, and prevention of physical performance decline in aging adults. This investigation compared definitions of sarcopenic obesity in a large cohort of older Canadian adults and explored the relationship of sarcopenic obesity with grip strength and gait speed. Our results revealed substantial heterogeneity among definitions, which resulted in varied prevalence of sarcopenic obesity in the CLSA cohort, ranging from approximately 0% to 85%. With stratification by age, sex, and BMI, sarcopenic obesity increased across age categories. Furthermore, sarcopenic obesity was frequently associated with low handgrip strength, but not slow gait speed.
In our study, sarcopenic obesity prevalence among older adults aged 65+ years in the CLSA cohort was substantially lower than previously reported in a similar group of individuals residing in the United States using a variety of definitions (Batsis et al., 2013). For example, using cut-points proposed by Baumgartner et al., the prevalence of sarcopenic obesity from our study was approximately 3-times lower in males and 5-times lower in females compared to those in the National Health and Nutrition Examination Survey (Batsis et al., 2013). Differences in prevalence may reflect true variation between Canadian and American geriatric populations or may be a consequence of inclusion of all ethnicities in the analysis by Batsis et al. (2013). Regardless, sarcopenic obesity prevalence is contingent upon the selected cut-point because our analysis and others (Batsis et al., 2013; Johnson Stoklossa et al., 2017; Donini et al., 2019) report high variations in the prevalence of this condition across various definitions.
Variation in the prevalence of abnormal body composition phenotypes may be partially explained by differences in reference populations and methods used to develop definitions for each individual condition (i.e., low muscle mass and obesity) and sarcopenic obesity. Aspects such as age and ethnicity affect body composition and the subsequent consensus of the optimal diagnostic definition. For example, the definition put forth by Kim et al. (2009) was developed using a dataset of Asian adults and, within the CLSA cohort, resulted in high rates of obesity and sarcopenic obesity. Generally, muscle mass is highest in African Americans, followed by Caucasians, Hispanics, and Asians, while percent body fat is highest among Asian subjects (Wang et al., 1994; Silva et al., 2010). Therefore, consideration of ethnicity in the selection of body composition definitions is ideal, although this was not possible in the present analysis due to the low number of subjects who self-identified with ethnicities other than Caucasian.
Slight differences in body composition cut-points also contribute to dissimilar prevalence rates of abnormal body composition phenotypes. For example, two comparable definitions of sarcopenic obesity proposed by Zoico et al. (2004) resulted in prevalence ranging from 6.2 to 25.8% using skeletal muscle percent < 23% versus 23–27%, respectively (both with FM% ≥ 42.9%). Such substantial variation from small differences in cut-points highlights the importance of selecting body composition definitions that are appropriate for specific individuals or populations and have reasonable specificity and sensitivity.
As exemplified here and elsewhere (Frankenfield et al., 2001) anthropometric-based measurements are modestly related to body composition. For example, LST (in which muscle mass is a main compartment) may vary up to almost two-times among males and females with the same BMI (Figure 1B). Several definitions of sarcopenic obesity use BMI to define obesity. However, these definitions consistently resulted in lower prevalence rates of obesity compared to those that used DXA-assessed FM. This pattern illustrates the poor sensitivity of anthropometric variables to detect body fat (Romero-Corral et al., 2008) and highlights the limited utility of body weight to characterize body composition. Notably, age-related loss of height and increased propensity toward central adiposity (which is associated with adverse cardiometabolic outcomes and is not captured by BMI) alter the relationship between FM and BMI (Batsis and Zagaria, 2018). A BMI that is considered ‘overweight’ (∼27.5 kg/m2) is associated with lower all-cause mortality in older adults (Winter et al., 2014). Therefore, traditional BMI cut points for obesity may be inappropriate in geriatric populations, although there is no consensus on what BMI cut-points are ideal. More accurate tools that are accessible in clinical settings are needed to facilitate early identification of abnormal body composition and develop strategies to mitigate muscle loss and FM gain in older individuals.
Using cut-points adjusted for age, sex, and BMI (Prado et al., 2014), the most common body composition phenotype was high muscularity-low adiposity. Notably, however, over 15% of both males and females had low muscularity across age groups. The prevalence of low muscularity-high adiposity was also higher among older males and females. Therefore, although fewer individuals had low muscle mass, a moderate proportion of older Canadians may be at risk for adverse outcomes associated with low muscle mass, which likely increases with senescence.
There is currently no evidence or consensus that physical function or performance outcomes should be incorporated into sarcopenic obesity definitions (Donini et al., 2019). We therefore examined handgrip strength and walking speed in relation to sarcopenic obesity as a hypothesis-generating, exploratory analysis. Interestingly, handgrip strength was frequently related to sarcopenic obesity, while this was not the case with walking speed. Low muscle mass is associated with increased risk of physical performance limitations in older adults, but this relationship may be dependent on low muscular strength (Visser et al., 2005). High adiposity may also be a stronger predictor of physical function limitations in older adults. For example, in the Nutrition as a Determinant of Successful Aging study, obesity (defined as ≥ 35% and ≥ 28% FM in females and males, respectively) was more strongly related to lower physical performance than low muscle mass among 904 community dwelling older adults (Bouchard et al., 2009). In other words, poor physical performance may only arise after the development of low muscle mass, reduced strength, or higher adiposity. Notably we used the generic term “muscle mass” to depict different compartments and its derivatives as mentioned earlier in this paper. Given the importance of handgrip strength in predicting deleterious health outcomes (Leong et al., 2015) and the ease of use in clinical settings, it may be used as a risk stratification tool to identify individuals with potentially low muscle mass (Cruz-Jentoft et al., 2019). Considering adults in the CLSA cohort were community dwelling adults, it is likely that body composition and strength in this cohort have not yet deteriorated to the point of negatively impacting gait speed [i.e., having ‘severe sarcopenia’(Cruz-Jentoft et al., 2019)]. Future investigations that are specifically designed to generate sarcopenic obesity definitions may consider using hand grip strength.
Although this is currently the largest investigation of sarcopenic obesity prevalence in older Canadian adults, some limitations should be considered when interpreting the presented findings. The CLSA cohort did not attain direct measurements of ethnicity; rather, we assumed ethnicity based on self-reported cultural background. In this study, we also only included individuals who self-reported as cultural backgrounds likely to be Caucasian ethnicity. However, body composition varies across ethnicities (Wang et al., 1994; Silva et al., 2010); as such, developing ethnicity-specific definitions of abnormal body composition is warranted. Studies that measured body composition using DXA were included due to the availability in the CLSA database and pervasive use of this technique within the literature. However, assessment of muscle mass as measured by novel methods (i.e., D3 creatine dilution) may more strongly relate to physical function parameters and should be investigated in the context of sarcopenic obesity in future investigations (Cawthon et al., 2018; Donini et al., 2019; Orwoll et al., 2020). In addition, walking acceleration was not accounted for in the 4-meter gait speed test, which may have increased the time taken to complete the assessment.
In conclusion, the identification of sarcopenic obesity (and its components, low muscle mass and obesity) is largely dependent on the selected definition among community-dwelling older Canadian adults. Furthermore, sarcopenic obesity often co-occurred with low grip strength but not slow gait speed in this population. These results highlight the importance of selecting an appropriate definition of abnormal body composition phenotypes and reinforces the need to develop population-specific criteria for sarcopenic obesity in older adults.
The datasets presented in this article are not readily available because the CLSA cannot share data to anyone or anywhere that has not been approved for use, to uphold the privacy and confidentiality of CLSA participants. However, data are available from the Canadian Longitudinal Study on Aging (www.clsa-elcv.ca) for researchers who meet the criteria for access to de-identified CLSA data. Requests to access the datasets should be directed to YWNjZXNzQGNsc2EtZWxjdi5jYQ==.
The studies involving human participants were reviewed and approved by Research Ethics Office at the University of Alberta. The patients/participants in the CLSA provided their written informed consent to participate in this study.
ID, MS, and CP contributed to conception and design of the study. CP acquired the data. SP and MY performed the analyses. SP wrote the first draft of the manuscript. All authors contributed to manuscript revision, read, and approved the submitted version.
This work was supported by a CIHR Catalyst Grant FRN 151279. CP is supported by a Canadian Institutes of Health Research (CIHR). New Investigator Salary Award and the Campus Alberta Innovates Program.
The authors declare that the research was conducted in the absence of any commercial or financial relationships that could be construed as a potential conflict of interest.
This research was made possible using the data collected by the Canadian Longitudinal Study on Aging (CLSA). Funding for the CLSA is provided by the Government of Canada through the Canadian Institutes of Health Research (CIHR) under grant reference: LSA 94473 and the Canada Foundation for Innovation. This research has been conducted using the Baseline Comprehensive v2.0, under Application ID 161004. The CLSA is led by Drs. Parminder Raina, Christina Wolfson, and Susan Kirkland.
The Supplementary Material for this article can be found online at: https://www.frontiersin.org/articles/10.3389/fphys.2020.583825/full#supplementary-material
Supplementary Table 1 | Prevalence of low muscle mass and obesity in the Canadian Longitudinal Study on Aging (n = 11,803 older adults ≥ 65 years old) according to different criteria.
Bales, C. W., and Ritchie, C. S. (2002). Sarcopenia, weight loss, and nutritional frailty in the elderly. Annu. Rev. Nutr. 22, 309–323. doi: 10.1146/annurev.nutr.22.010402.102715
Batsis, J. A., Barre, L. K., Mackenzie, T. A., Pratt, S. I., Lopez-Jimenez, F., and Bartels, S. J. (2013). Variation in the prevalence of sarcopenia and sarcopenic obesity in older adults associated with different research definitions: dual-energy X-ray absorptiometry data from the National Health and Nutrition Examination Survey 1999-2004. J. Am. Geriatr. Soc. 61, 974–980. doi: 10.1111/jgs.12260
Batsis, J. A., Mackenzie, T. A., Lopez-Jimenez, F., and Bartels, S. J. (2015). Sarcopenia, sarcopenic obesity, and functional impairments in older adults: National Health and Nutrition Examination Surveys 1999-2004. Nutr. Res. 35, 1031–1039. doi: 10.1016/j.nutres.2015.09.003
Batsis, J. A., and Zagaria, A. B. (2018). Addressing Obesity in Aging Patients. Med. Clin. North Am. 102, 65–85. doi: 10.1016/j.mcna.2017.08.007
Baumgartner, R. N., Koehler, K. M., Gallagher, D., Romero, L., Heymsfield, S. B., Ross, R. R., et al. (1998). Epidemiology of sarcopenia among the elderly in New Mexico. Am. J. Epidemiol. 147, 755–763.
Baumgartner, R. N., Wayne, S. J., Waters, D. L., Janssen, I., Gallagher, D., and Morley, J. E. (2004). Sarcopenic obesity predicts instrumental activities of daily living disability in the elderly. Obes. Res. 12, 1995–2004. doi: 10.1038/oby.2004.250
Bouchard, D. R., Dionne, I. J., and Brochu, M. (2009). Sarcopenic/obesity and physical capacity in older men and women: data from the Nutrition as a Determinant of Successful Aging (NuAge)-the Quebec longitudinal Study. Obesity 17, 2082–2088. doi: 10.1038/oby.2009.109
Cawthon, P. M., Orwoll, E. S., Peters, K. E., Ensrud, K. E., Cauley, J. A., Kado, D. M., et al. (2018). Strong Relation Between Muscle Mass Determined by D3-creatine Dilution, Physical Performance, and Incidence of Falls and Mobility Limitations in a Prospective Cohort of Older Men. J. Gerontol. A Biol. Sci. Med. Sci. 74, 844–852. doi: 10.1093/gerona/gly129
Cruz-Jentoft, A. J., Bahat, G., Bauer, J., Boirie, Y., Bruyère, O., Cederholm, T., et al. (2019). Sarcopenia: revised European consensus on definition and diagnosis. Age Ageing 48, 16–31. doi: 10.1093/ageing/afy169
Donini, L. M., Busetto, L., Bauer, J. M., Bischoff, S., Boirie, Y., Cederholm, T., et al. (2019). Critical appraisal of definitions and diagnostic criteria for sarcopenic obesity based on a systematic review. Clin. Nutr. 39, 2368–2388. doi: 10.1016/j.clnu.2019.11.024
Frankenfield, D. C., Rowe, W. A., Cooney, R. N., Smith, J. S., and Becker, D. (2001). Limits of body mass index to detect obesity and predict body composition. Nutrition 17, 26–30. doi: 10.1016/s0899-9007(00)00471-8
Heymsfield, S. B., Peterson, C. M., Thomas, D. M., Heo, M., and Schuna, J. M. Jr. (2016). Why are there race/ethnic differences in adult body mass index-adiposity relationships? A quantitative critical review. Obes. Rev. 17, 262–275. doi: 10.1111/obr.12358
Heymsfield, S. B., Smith, R., Aulet, M., Bensen, B., Lichtman, S., Wang, J., et al. (1990). Appendicular skeletal muscle mass: measurement by dual-photon absorptiometry. Am. J. Clin. Nutr. 52, 214–218. doi: 10.1093/ajcn/52.2.214
Janssen, I., Shepard, D. S., Katzmarzyk, P. T., and Roubenoff, R. (2004). The healthcare costs of sarcopenia in the United States. J. Am. Geriatr. Soc. 52, 80–85.
Johnson Stoklossa, C. A., Sharma, A. M., Forhan, M., Siervo, M., Padwal, R. S., and Prado, C. M. (2017). Prevalence of Sarcopenic Obesity in Adults with Class II/III Obesity Using Different Diagnostic Criteria. J. Nutr. Metab. 2017:7307618. doi: 10.1155/2017/7307618
Khor, E. Q., Lim, J. P., Tay, L., Yeo, A., Yew, S., Ding, Y. Y., et al. (2020). Obesity Definitions in Sarcopenic Obesity: Differences in Prevalence, Agreement and Association with Muscle Function. J. Frailty Aging 9, 37–43. doi: 10.14283/jfa.2019.28
Kim, J., Wang, Z., Heymsfield, S. B., Baumgartner, R. N., and Gallagher, D. (2002). Total-body skeletal muscle mass: estimation by a new dual-energy X-ray absorptiometry method. Am. J. Clin. Nutr. 76, 378–383. doi: 10.1093/ajcn/76.2.378
Kim, T. N., Yang, S. J., Yoo, H. J., Lim, K. I., Kang, H. J., Song, W., et al. (2009). Prevalence of sarcopenia and sarcopenic obesity in Korean adults: the Korean sarcopenic obesity study. Int. J. Obes. 33, 885–892. doi: 10.1038/ijo.2009.130
Kirkland, S. A., Griffith, L. E., Menec, V., Wister, A., Payette, H., Wolfson, C., et al. (2015). Mining a Unique Canadian Resource: The Canadian Longitudinal Study on Aging. Can. J. Aging 34, 366–377. doi: 10.1017/S071498081500029X
Lear, S. A., Kohli, S., Bondy, G. P., Tchernof, A., and Sniderman, A. D. (2009). Ethnic Variation in Fat and Lean Body Mass and the Association with Insulin Resistance. J. Clin. Endocrinol. Metab. 94, 4696–4702. doi: 10.1210/jc.2009-1030
Leong, D. P., Teo, K. K., Rangarajan, S., Lopez-Jaramillo, P., Avezum, A. J., Orlandini, A., et al. (2015). Prognostic value of grip strength: findings from the Prospective Urban Rural Epidemiology (PURE) study. Lancet 386, 266–273. doi: 10.1016/S0140-6736(14)62000-6
Levine, M. E., and Crimmins, E. M. (2012). The impact of insulin resistance and inflammation on the association between sarcopenic obesity and physical functioning. Obesity 20, 2101–2106. doi: 10.1038/oby.2012.20
Newman, A. B., Kupelian, V., Visser, M., Simonsick, E., Goodpaster, B., Nevitt, M., et al. (2003). Sarcopenia: alternative definitions and associations with lower extremity function. J. Am. Geriatr. Soc. 51, 1602–1609. doi: 10.1046/j.1532-5415.2003.51534.x
Oh, C., Jho, S., No, J.-K., and Kim, H.-S. (2015). Body composition changes were related to nutrient intakes in elderly men but elderly women had a higher prevalence of sarcopenic obesity in a population of Korean adults. Nutr. Res. 35, 1–6. doi: 10.1016/j.nutres.2014.07.018
Orwoll, E. S., Peters, K. E., Hellerstein, M., Cummings, S. R., Evans, W. J., and Cawthon, P. M. (2020). The Importance of Muscle Versus Fat Mass in Sarcopenic Obesity: A Re-evaluation Using D3-Creatine Muscle Mass Versus DXA Lean Mass Measurements. J. Gerontol. A Biol. Sci. Med. Sci. 75, 1362–1368. doi: 10.1093/gerona/glaa064
Prado, C. M. M., Siervo, M., Mire, E., Heymsfield, S. B., Stephan, B. C. M., Broyles, S., et al. (2014). A population-based approach to define body-composition phenotypes. Am. J. Clin. Nutr. 99, 1369–1377. doi: 10.3945/ajcn.113.078576
Prado, C. M. M., Wells, J. C. K., Smith, S. R., Stephan, B. C. M., and Siervo, M. (2012). Sarcopenic obesity: A Critical appraisal of the current evidence. Clin. Nutr. 31, 583–601. doi: 10.1016/j.clnu.2012.06.010
Raina, P. S., Wolfson, C., Kirkland, S. A., Griffith, L. E., Oremus, M., Patterson, C., et al. (2009). The Canadian longitudinal study on aging (CLSA). Can. J. 28, 221–229. doi: 10.1017/S0714980809990055
Romero-Corral, A., Somers, V. K., Sierra-Johnson, J., Thomas, R. J., Bailey, K. R., Collazo-Clavell, M. L., et al. (2008). Accuracy of Body Mass Index to Diagnose Obesity In the US Adult Population. Int. J. Obes. 32, 959–966. doi: 10.1038/ijo.2008.11
Roubenoff, R. (2004). Sarcopenic obesity: the confluence of two epidemics. Obes. Res. 12, 887–888. doi: 10.1038/oby.2004.107
Schrager, M. A., Metter, E. J., Simonsick, E., Ble, A., Bandinelli, S., Lauretani, F., et al. (2007). Sarcopenic obesity and inflammation in the InCHIANTI study. J. Appl. Physiol. 102, 919–925. doi: 10.1152/japplphysiol.00627.2006
Siervo, M., Prado, C. M., Mire, E., Broyles, S., Wells, J. C. K., Heymsfield, S., et al. (2015). Body composition indices of a load-capacity model: gender- and BMI-specific reference curves. Public Health Nutr. 18, 1245–1254. doi: 10.1017/S1368980014001918
Silva, A. M., Shen, W., Heo, M., Gallagher, D., Wang, Z., Sardinha, L. B., et al. (2010). Ethnicity-related skeletal muscle differences across the lifespan. Am. J. Human Biol. 22, 76–82. doi: 10.1002/ajhb.20956
Statistics Canada (2019a). Canada’s Population Estimates: Age and Sex, July 1, 2018. Available online at: https://www150.statcan.gc.ca/n1/daily-quotidien/190125/dq190125a-eng.htm (accessed June 17, 2019).
Statistics Canada (2019b). Table 13-10-0096-20 Body Mass Index, Overweight or Obese, Self-Reported, Adult, Age Groups (18 Years and Older). Canadian Community Health Survey - Annual Component. Available online at: https:// www150.statcan.gc.ca/t1/tbl1/en/tv.action?pid=1310009620 (accessed June 17, 2019).
Visser, M., Goodpaster, B. H., Kritchevsky, S. B., Newman, A. B., Nevitt, M., Rubin, S. M., et al. (2005). Muscle mass, muscle strength, and muscle fat infiltration as predictors of incident mobility limitations in well-functioning older persons. J. Gerontol. A Biol. Sci. Med. Sci. 60, 324–333. doi: 10.1093/gerona/60.3.324
Visser, M., and Schaap, L. A. (2011). Consequences of sarcopenia. Clin. Geriatr. Med. 27, 387–399. doi: 10.1016/j.cger.2011.03.006
Wang, J., Thornton, J. C., Russell, M., Burastero, S., Heymsfield, S., and Pierson, R. N. J. (1994). Asians have lower body mass index (BMI) but higher percent body fat than do whites: comparisons of anthropometric measurements. Am. J. Clin. Nutr. 60, 23–28. doi: 10.1093/ajcn/60.1.23
Winter, J. E., MacInnis, R. J., Wattanapenpaiboon, N., and Nowson, C. A. (2014). BMI and all-cause mortality in older adults: a meta-analysis. Am. J. Clin. Nutr. 99, 875–890. doi: 10.3945/ajcn.113.068122
Zhang, X., Xie, X., Dou, Q., Liu, C., Zhang, W., Yang, Y., et al. (2019). Association of sarcopenic obesity with the risk of all-cause mortality among adults over a broad range of different settings: a updated meta-analysis. BMC Geriatr. 19:183. doi: 10.1186/s12877-019-1195-y
Zoico, E., Di Francesco, V., Guralnik, J. M., Mazzali, G., Bortolani, A., Guariento, S., et al. (2004). Physical disability and muscular strength in relation to obesity and different body composition indexes in a sample of healthy elderly women. Int. J. Obes. Relat. Metab. Disord. 28, 234–241. doi: 10.1038/sj.ijo.0802552
Keywords: Geriatrics, community-dwelling older individuals, muscle strength, older people, physical function, body composition, CLSA
Citation: Purcell SA, Mackenzie M, Barbosa-Silva TG, Dionne IJ, Ghosh S, Siervo M, Ye M and Prado CM (2021) Prevalence of Sarcopenic Obesity Using Different Definitions and the Relationship With Strength and Physical Performance in the Canadian Longitudinal Study of Aging. Front. Physiol. 11:583825. doi: 10.3389/fphys.2020.583825
Received: 17 July 2020; Accepted: 21 December 2020;
Published: 21 January 2021.
Edited by:
Leonardo Alexandre Peyré-Tartaruga, Federal University of Rio Grande do Sul, BrazilReviewed by:
Elisa Villalobos, University of Edinburgh, United KingdomCopyright © 2021 Purcell, Mackenzie, Barbosa-Silva, Dionne, Ghosh, Siervo, Ye and Prado. This is an open-access article distributed under the terms of the Creative Commons Attribution License (CC BY). The use, distribution or reproduction in other forums is permitted, provided the original author(s) and the copyright owner(s) are credited and that the original publication in this journal is cited, in accordance with accepted academic practice. No use, distribution or reproduction is permitted which does not comply with these terms.
*Correspondence: Carla M. Prado, Y3ByYWRvQHVhbGJlcnRhLmNh; Y2FybGEucHJhZG9AdWFsYmVydGEuY2E=
Disclaimer: All claims expressed in this article are solely those of the authors and do not necessarily represent those of their affiliated organizations, or those of the publisher, the editors and the reviewers. Any product that may be evaluated in this article or claim that may be made by its manufacturer is not guaranteed or endorsed by the publisher.
Research integrity at Frontiers
Learn more about the work of our research integrity team to safeguard the quality of each article we publish.