
95% of researchers rate our articles as excellent or good
Learn more about the work of our research integrity team to safeguard the quality of each article we publish.
Find out more
ORIGINAL RESEARCH article
Front. Physiol. , 16 September 2020
Sec. Mitochondrial Research
Volume 11 - 2020 | https://doi.org/10.3389/fphys.2020.510600
This article is part of the Research Topic Mitochondrial Exchangers and Transporters in Cell Survival and Death View all 8 articles
 Gayathri K. Natarajan1†
 Lyall Glait1†‡
 Jyotsna Mishra1
 David F. Stowe1,2,3,4,5
 Amadou K. S. Camara1,2,3,6
 Wai-Meng Kwok1,3,6,7*
Mitochondrial Ca2+ handling is accomplished by balancing Ca2+ uptake, primarily via the Ru360-sensitive mitochondrial calcium uniporter (MCU), Ca2+ buffering in the matrix and Ca2+ efflux mainly via Ca2+ ion exchangers, such as the Na+/Ca2+ exchanger (NCLX) and the Ca2+/H+ exchanger (CHE). The mechanism of CHE in cardiac mitochondria is not well-understood and its contribution to matrix Ca2+ regulation is thought to be negligible, despite higher expression of the putative CHE protein, LETM1, compared to hepatic mitochondria. In this study, Ca2+ efflux via the CHE was investigated in isolated rat cardiac mitochondria and permeabilized H9c2 cells. Mitochondria were exposed to (a) increasing matrix Ca2+ load via repetitive application of a finite CaCl2 bolus to the external medium and (b) change in the pH gradient across the inner mitochondrial membrane (IMM). Ca2+ efflux at different matrix Ca2+ loads was revealed by inhibiting Ca2+ uptake or reuptake with Ru360 after increasing number of CaCl2 boluses. In Na+-free experimental buffer and with Ca2+ uptake inhibited, the rate of Ca2+ efflux and steady-state free matrix Ca2+ [mCa2+]ss increased as the number of administered CaCl2 boluses increased. ADP and cyclosporine A (CsA), which are known to increase Ca2+ buffering while maintaining a constant [mCa2+]ss, decreased the rate of Ca2+ efflux via the CHE, with a significantly greater decrease in the presence of ADP. ADP also increased Ca2+ buffering rate and decreased [mCa2+]ss. A change in the pH of the external medium to a more acidic value from 7.15 to 6.8∼6.9 caused a twofold increase in the Ca2+ efflux rate, while an alkaline change in pH from 7.15 to 7.4∼7.5 did not change the Ca2+ efflux rate. In addition, CHE activation was associated with membrane depolarization. Targeted transient knockdown of LETM1 in permeabilized H9c2 cells modulated Ca2+ efflux. The results indicate that Ca2+ efflux via the CHE in cardiac mitochondria is modulated by acidic buffer pH and by total matrix Ca2+. A mechanism is proposed whereby activation of CHE is sensitive to changes in both the matrix Ca2+ buffering system and the matrix free Ca2+ concentration.
Ca2+ handling in mitochondria is critical for cell survival. Recent research has focused on the role of mitochondria in dynamically regulating intracellular and steady-state free matrix Ca2+ ([mCa2+]ss) in response to increases in cytosolic Ca2+ (Duchen, 2000; Rizzuto et al., 2000; Csordás et al., 2012; Takeuchi et al., 2015; De Stefani et al., 2016). To achieve this, [mCa2+]ss is tightly maintained through mechanisms that balance Ca2+ uptake from the cytosol, Ca2+ buffering in the matrix and Ca2+ efflux from the mitochondria (Finkel et al., 2015; Giorgi et al., 2018).
Ca2+ transport from the cytosol across the outer mitochondrial membrane (OMM) occurs mainly through the voltage-dependent anion channel (VDAC), which allows movement of a variety of ions, including both influx and efflux of Ca2+ (Tan and Colombini, 2007; Camara et al., 2017). Ca2+ uptake across the inner mitochondrial membrane (IMM) occurs mainly through the mitochondrial Ca2+ uniporter (MCU). MCU allows a selective influx of Ca2+ down its electrochemical gradient and is blocked by ruthenium red (RuR) and Ru360 (Kirichok et al., 2004; Gunter and Sheu, 2009; Baughman et al., 2011; De Stefani et al., 2011). The putative mitochondrial ryanodine receptor (mRyR) is also thought to contribute to Ca2+ influx in cardiac mitochondria (Beutner et al., 2005; Tewari et al., 2014), though its exact role remains unclear. mRyR is reported to be most active at lower concentrations of Ca2+ than those favored by MCU, and it is inhibited by RuR (Gunter and Sheu, 2009). Inside the mitochondrial matrix, Ca2+ is buffered primarily by precipitating with inorganic phosphate compounds, allowing for the uptake of large amounts of Ca2+ without disrupting the mitochondrial membrane potential, ΔΨm (Starkov, 2010; Wei et al., 2012).
Several exchangers are involved in Ca2+ transport across the IMM. The mitochondrial Na+/Ca2+ exchanger (NCLX) is well-characterized as the dominant Ca2+ efflux mechanism in excitable cells (Palty et al., 2010; Blomeyer et al., 2013, 2016; Boyman et al., 2013) and is powered by the Na+ electrochemical gradient across the IMM to allow Ca2+ efflux, although it can also act as a Li+/Ca2+ exchanger. The NCLX has been recently identified as a possible drug target for treating heart disease, specifically to protect against cardiac hypertrophy and sudden cardiac death (Luongo et al., 2017; Liu et al., 2018). The other putative Ca2+ efflux pathway, the Ca2+/H+ exchanger (CHE) is less studied and consequently, less understood. Early work indicated that a Na+-independent Ca2+ efflux (NICE) exists in both excitable and non-excitable tissues (Rizzuto et al., 1987). The contribution of this Ca2+ efflux mechanism, attributed to CHE, is suggested to be tissue-specific, with more activity in liver mitochondria (contributing up to 80% of total Ca2+ efflux), compared to cardiac mitochondria (<20% of total Ca2+ efflux) (Fiskum and Lehninger, 1979; Nicholls and Crompton, 1980; Rizzuto et al., 1987).
The recent discovery of the Letm1 gene that is proposed to encode the CHE protein of the same name has provided some insights into the putative structure, function and mechanism of the NICE (Nowikovsky et al., 2012; Takeuchi et al., 2015; Austin and Nowikovsky, 2019; Li et al., 2019; Lin and Stathopulos, 2019). LETM1 (Leucine zipper-EF-hand containing transmembrane protein 1) was first described as a K+/H+ exchanger (KHE) in yeast mitochondria (Nowikovsky et al., 2004). Shortly after, a genome-wide RNAi screen of Drosophila predicted a Ca2+/H+ exchanger function for LETM1 (Jiang et al., 2009), which was reinforced by in vitro assays using isolated LETM1 reconstituted in liposomes (Tsai et al., 2014). Current evidence suggests that the LETM1 protein, in hexameric conformation, encodes for a CHE with electroneutral transport activity exchanging 1Ca2+ for 2H+ ions (Shao et al., 2016). However, questions regarding the primary function of LETM1 as a KHE or CHE are, as yet, unresolved and there is insufficient and conflicting evidence to confirm whether LETM1 as CHE contributes to Ca2+ uptake or Ca2+ efflux or is bidirectional (Ca2+ in/H+ out or H+ in/Ca2+ out) depending on the mitochondrial microenvironment (Jiang et al., 2013; Doonan et al., 2014; Tsai et al., 2014; Haumann et al., 2019).
The physiological significance of LETM1 as CHE was demonstrated in LETM1-deficient cell and animal models that exhibited impaired dynamics of Ca2+ uptake and efflux. For instance, LETM1 deletions have been linked to Wolf–Hirschhorn syndrome and heterozygous knockout mice show altered glucose regulation, reduced mitochondrial ATP production, and altered brain activity (Jiang et al., 2013). Furthermore, the potential involvement of LETM1 in K+ regulation and resulting regulation of mitochondrial Ca2+ may also have an impact on Na+ regulation and NCLX activity (Austin et al., 2017). LETM1 has been associated with delayed opening of the mitochondrial permeability transition pore (mPTP) in neurons lacking the PTEN-induced kinase 1 (PINK1), a condition that results in recessive familial Parkinson’s disease (Huang et al., 2017). However, such observations must be interpreted by taking into consideration that cation homeostasis may be altered and that any compensatory mechanisms may be unaccounted for. This leads to unanswered questions as to what regulates CHE activity in normal and dysfunctional mitochondria.
Previous studies have reported that CHE activity is more robust in hepatic mitochondria than in cardiac mitochondria, where the contribution of CHE to Ca2+ regulation is reportedly small (Crompton et al., 1977; Jurkowitz and Brierley, 1982; Gunter and Pfeiffer, 1990). Yet, expression of LETM1 protein in cardiac mitochondria is reported to be higher than in hepatic mitochondria (Uhlén et al., 2005; Fagerberg et al., 2014). In contrast to the accepted notion that CHE contributes little to Ca2+ regulation in cardiomyocytes, knockdown of LETM1 in rat neonatal cardiomyocytes decreased Ca2+ uptake as well as efflux (Doonan et al., 2014). Furthermore, a knockout of Slc8b1, the gene encoding NCLX in adult mice hearts decreased Ca2+ efflux by only 80% (Luongo et al., 2017), suggesting the presence and contribution of a significant Na+-independent efflux mechanism in adult ventricular cardiomyocytes. Thus, the expression density of LETM1 and its functional contribution to Ca2+ efflux as CHE appears to be discordant, suggesting that the factors affecting CHE activity are tissue-specific and hence warrant more investigation. Indeed, the higher expression of LETM1 in cardiac mitochondria suggests that, as CHE, it could be important in pH-sensitive conditions such as ischemia-reperfusion (IR) injury and provide a greater reserve capacity to modulate Ca2+ transport across the IMM.
To delineate the key modulators of CHE activity in cardiac mitochondria and the conditions under which CHE activity is enhanced, we (1) investigated the contribution of a NICE via CHE under basal conditions and (2) determined how changes in extra-matrix Ca2+ and/or pH modulate Ca2+ efflux via the CHE and intra-mitochondrial Ca2+ in isolated rat heart mitochondria. The results show that a basal NICE in cardiac mitochondria increases with extra-matrix acidification, indicating that H+ is a driving force for the exchanger. Furthermore, the rate of Ca2+ efflux was modulated by total matrix Ca2+ (mCa2+), indicating that Ca2+ efflux via CHE is modulated by both Ca2+ buffering and the [mCa2+]ss. In permeabilized H9c2 cells, the mitochondrial Ca2+ flux was modulated by targeted knockdown of LETM1. The results suggest that contribution of CHE in regulating matrix Ca2+ may be closely aligned with the Ca2+ retention capacity (CRC) of the mitochondria as well as changes in the extra-matrix pH.
All animal use was approved by the Medical College of Wisconsin Institutional Animal Care and Use Committee (IACUC).
All reagents and chemicals were purchased from Sigma-Aldrich (St. Louis, MO, United States) unless specified otherwise. Fluorescent dyes Fura-4F pentapotassium salt and Tetra Methyl Rhodamine (TMRM) were purchased from Life Technologies (Eugene, OR, United States). CGP37157 and Cyclosporine A (CsA) were purchased from Tocris Bioscience (Bristol, United Kingdom).
Hearts were harvested from Sprague Dawley rats (male, ∼ 300 g wt), anesthetized intraperitoneally with Inactin and heparin and sacrificed. After mincing the tissue in ice-cold isolation buffer (200 mM mannitol, 50 mM sucrose, 5 mM KH2PO4, 5 mM MOPS, 1 mM EGTA, 5 U/ml of protease (Bacillus licheniformis), and 0.1% BSA, with pH adjusted to 7.15 with KOH), the suspension was homogenized for 15 s. After further addition of 17 ml isolation buffer, the suspension was again homogenized for 15 s. Mitochondria were isolated using differential centrifugation as described before (Haumann et al., 2010; Agarwal et al., 2012; Blomeyer et al., 2013, 2016; Mishra et al., 2019). Briefly, the homogenized tissue was first centrifuged at 8000 g for 10 min at 4°C. The pellet was resuspended in new isolation buffer and centrifuged at 850 g for 10 min. The resulting supernatant was then centrifuged at 8000 g for 10 min. The pellet from the third spin was resuspended in 0.1 ml of cold isolation buffer and stored on ice for further use. Protein concentration of the mitochondrial suspension was determined using a DU800 spectrophotometer (Bradford Method). Fresh isolation buffer was added to the mitochondrial suspension to obtain the final desired concentration of 12.5 mg protein/ml.
The quality of the isolated mitochondria was confirmed by measuring RCI to assess respiration using an oxygraph (Strathkelvin). Isolated mitochondria (0.5 mg/ml) added to experimental buffer (130 mM KCl, 5 mM K2HPO4, 20 mM MOPS, and 0.1% BSA, with pH adjusted to 7.15 with KOH) were energized with 10 mM freshly prepared K+-succinate (pH 7.15) substrate, followed by addition of 250 μM freshly prepared ADP. RCI was calculated by dividing the state 3 respiration slope (after adding ADP) by the state 4 respiration slope (after total consumption of ADP). The RCI of the mitochondria used in experiments ranged between 3 and 7. These values are consistent with reported RCI values for rat cardiac mitochondria energized with Complex II substrate (Hunter et al., 2012).
Extra-matrix Ca2+ was measured as described before (Mishra et al., 2019) by monitoring changes in the fluorescent Ca2+-sensitive dye Fura-4F pentapotassium salt (Excitation 340/380 nm, emission detection 510 nm) mixed with experimental buffer and using a cuvette-based spectrophotometer (Photon Technology International Inc.). Fura-4F was dissolved in DMSO. For all protocols, 960 μl of experimental buffer (130 mM KCl, 5 mM K2HPO4, 20 mM MOPS, and 0.1% BSA, with pH adjusted to 7.15 with KOH) containing Fura-4F (1 μM) was added to a cuvette. 40 μl of mitochondrial suspension was then added (0.5 mg/ml) to the experimental buffer to yield a final EGTA concentration of 40 μM in solution. At 1 min, mitochondria were energized with 10 μl of freshly prepared 1M K+-succinate (pH = 7.15). Succinate was used as the substrate, since the CRC of cardiac mitochondria has been found to be greater when respiring on complex II substrate compared to that when respiring on complex I substrate [unpublished observations from our group and (Madungwe et al., 2016; Matsuura et al., 2017)]. 20 μM pulses of CaCl2 were added to increase extra-matrix Ca2+, first at 3 min and every 5 min thereafter. The mPTP was considered open when the extra-matrix Ca2+ started to increase greatly over time, indicating a large net Ca2+ efflux.
To reveal Ca2+ efflux, Ca2+ uptake and reuptake through the MCU was blocked with 1 μM Ru360 and any Ca2+ influx through mRyR was blocked with 1 μM RuR (Blomeyer et al., 2016). Ru360 and RuR were added to the buffer solution 20 s after the application of a CaCl2 bolus. In some experiments, mitochondrial Ca2+ uptake was preserved by delaying opening of the mPTP with 500 nM CsA or 250 μM ADP. In other experiments (Figure 3C), the total matrix Ca2+ reserve was revealed by the application of 4 μM Carbonyl cyanide-4-(trifluorophenyl)-hydrazone (FCCP), which is a potent uncoupler of oxidative phosphorylation, leading to inhibition of ATP synthesis and membrane depolarization.
For measuring free matrix Ca2+, isolated mitochondria suspended in isolation buffer (5 mg/ml) were incubated with 5 μM Fura-4 AM for 20 min in dark at room temperature with stirring followed by centrifugation at 8000 g for 10 min at 4°C. The resulting mitochondrial pellet was re-suspended in fresh isolation buffer to a final concentration of 12.5 mg/ml and stored in ice. Aliquots (0.5 mg protein) were used in experiments using similar protocols as described for extra-matrix Ca2+ measurements.
The effects of pH changes on the rate of Ca2+ efflux at steady-state was measured by addition of either HCl (final pH: 6.85 ± 0.05) or KOH (final pH: 7.45 ± 0.05) and monitoring changes in extra-matrix Ca2+. For all experiments in this series, mitochondria were energized with 10 mM K-succinate (at 60 s). CaCl2 boluses were added to the mitochondrial suspension at t = 180 s and t = 480 s and extra-matrix Ca2+ was allowed to reach a steady-state. The experiments then followed one of the following two protocols – in the first protocol, 1 μM Ru360 was added first (at 840 s), followed by either HCl or KOH (at 1200 s). In the second protocol, HCl or KOH was added first (at 840 s), followed by 1 μM Ru360.
Changes in ΔΨm were measured by ratiometric measurements of changes in the voltage-sensitive fluorescent dye, TMRM (Absorbance at 546 nm; emission at 573 nm) added to the experimental buffer to a final dye concentration of 1 μM.
Fluorescent Ratios (573 nm/546 nm) were measured and converted to estimated ΔΨm values against a calibration curve obtained using the method described in Scaduto and Grotyohann (1999). Briefly, fluorescence of TMRM dye (1 μM/ml of experimental buffer) was recorded before addition of mitochondria (0.5 mg/ml). K+-succinate (1 μM) and FCCP at concentrations (μM) 0, 0.25, 0.5, 1, 2, or 4 were added to the mitochondrial suspension. After 1 min, the fluorescence was recorded and the mixture was centrifuged at 8000 g for 5 min at 4°C to pellet the mitochondria. The concentration of TMRM remaining in the media ([TMRM]O) was calculated from a previously obtained fluorescence calibration assay by serial dilution of TMRM dye in experimental buffer. This value was subtracted from the initial amount of TMRM in the cuvette (before addition of mitochondria) to obtain the amount of TMRM associated with mitochondria ([TMRM]T). All concentration values were converted to a per mg basis. The concentration of free TMRM in the matrix ([TMRM]M) was calculated from the following equation:
Units are: [TMRM]T in (nmol/mg), (TMRM)M and (TMRM)O in (μl/mg), Ki and Ko are partition coefficients in (μl/mg).
ΔΨm was calculated using the Nernst equation
The calculated ΔΨm was plotted against the fluorescent ratio measured before centrifugation to obtain the final calibration curve (Supplementary Figure S1). The calibration curve used in this study was:
Values for Ki (0.5 μl/mg) and Ko (5 μl/mg) were estimated such that ΔΨm = ∼−180 mV in fully charged mitochondria when FCCP = 0 μM. The values of Ko and Ki were similar to the values of α (4.727) and ß (0.3799) obtained by Huang et al. (2007).
H9c2 cells (CRL-1446, American Type Culture Collection, Gaithersburg, MD, United States) were cultured in Dulbecco’s modified Eagle’s medium (DMEM; Gibco, Carlsbad, CA, United States) supplemented with 10% (vol/vol) FBS and 5% 100 U/ml Penicillin-Streptomycin mixture at 37°C and 5% CO2. Seventy to eighty percent confluent cells were transfected with 15 nM of either universal negative control siRNA or a pool of 3 LETM1-targeted siRNA duplexes (Mission siRNAs, Sigma-Aldrich, St. Louis, MO, United States) using the Lipofectamine RNAiMAX transfection reagent (Invitrogen, Waltham, MA, United States) and used for experiments 48 h post-transfection. Rat LETM1 siRNA sense sequences were: GAGGAAAUGGCCCUGAAGA, CUGUAUCACGAGAUCCCUA and CGGAUUUGUGCAG ACCUCU.
Total RNA was extracted from the siRNA-treated H9c2 cells using Trizol reagent (Invitrogen, Carlsbad, CA, United States). 1 μg of total RNA was converted to cDNA using random primers and SuperScript III First-Strand Synthesis System (Invitrogen, Carlsbad, CA, United States). mRNA levels of LETM1 were measured by quantitative real-time PCR (qRT-PCR) using the SYBR Mix ExTaq (Applied Biosystems, Waltham, MA, United States). GAPDH was used as an endogenous control to normalize gene expression levels. The primers used for the analysis are: Rat LETM1 5′–ATC CCTACATCATTGCTCATACTG–3′ (forward) and 5′–CCTC CTTTGCCACAATTTCTG–3′ (reverse); Rat GAPDH 5′–ATG ACTCTACCCACGGCAAG –3′ (forward) and 5′–GGAA GATGGTGATGGGTTTC–3′ (reverse). Relative expression was calculated using the ΔΔCT method.
H9c2 cells were lysed in RIPA lysis buffer (Invitrogen, Carlsbad, CA, United States), supplemented with 1 mM PMSF and 1% protease inhibitor cocktail (Sigma-Aldrich). Lysates were incubated on ice for 30 min followed by centrifugation at 17,000 g for 15 min at 4°C. The supernatant was collected and quantified using the bicinchoninic acid assay (Thermo Fisher Scientific). Proteins were resolved on 4–20% mini-PROTEAN TGX gels (BioRad) and transferred to nitrocellulose membranes (0.45 μm, BioRad). The membranes were blotted with the following antibodies: Letm1 (16024-1-AP; Proteintech), NCLX (ab83551; Abcam), MCU (14997; Cell Signaling Technology) and GAPDH (CB1001; Millipore). GAPDH was used as the loading control. The LI-COR infrared fluorescent mouse (925–68020) and rabbit (925–32211) secondary antibodies were used for visualization by a LI-COR Odyssey scanner. Band quantification (densitometry) was performed using ImageJ and Origin 8 software (OriginLab Corporation, Northampton, MA, United States).
Freshly dissociated wild-type (WT) or LETM1-siRNA treated (siLETM1) H9c2 cells were suspended in Ca2+-free Tyrode buffer (mM): 132 NaCl, 5 KCl, 10 HEPES, 5 Glucose, 1 MgCl2, pH = 7.4 (NaOH). For permeabilization, cells (1 × 10⁶ cells per experiment) were transferred to Buffer A (mM): 250 Sucrose, 100 HEPES, pH = 7.3 and incubated on ice for 10 min with 30 μg/ml digitonin (Sigma-Aldrich) in the presence of 20 μM EGTA and 1/200 EDTA-free protease inhibitor cocktail (Roche cOmplete via Sigma-Aldrich). The reaction was neutralized by addition of Buffer A and after centrifugation (500 g, RT, 5 min), the cells were resuspended in Na+-free experimental buffer. Experiments were performed in the presence of 1 μM Fura-4F penta potassium salt (to measure cytosolic Ca2+), 20 μM EGTA, 5 μM thapsigargin (to inhibit Ca2+ release from the sarcoplasmic reticulum) and 1M K+-Succinate (to energize complex II in mitochondria). As before, mitochondrial Ca2+ handling was observed by repetitive application of 5 μM CaCl2 boluses. Ca2+ efflux was revealed by the application of 1 μM Ru360 and the contribution of NCLX was eliminated by application of 2 μM CGP37157 (CGP) in the presence of Ru360.
Rate of change of [Ca2+]c (d[Ca2+]c/dt) was analyzed for the 4th CaCl2 bolus for the traces shown in Figure 8D. For WT, d[Ca2+]c/dt was estimated as the slope “m” (in units of RFU/s) of the linear equation, y = m*x + c, used to fit the [Ca2+]c response over 120 s following the application of the 4th CaCl2 bolus. For siLETM1, d[Ca2+]c/dt was estimated as the decay rate “τ” (in units of 1/s) of the single-exponential equation, y = y0 + a*exp(−x*τ), used to fit the [Ca2+]c response over 120 s following the application of the 4th CaCl2 bolus.
The protocols for all experiments are described in their respective figure legends.
Data analysis was performed using Matlab 2016b (Mathworks, Natick, MA, United States). Efflux rate was calculated by fitting a linear regression to the data from 5–120 s after adding the agent of interest (Ru360, RuR, CsA, ADP, HCl or KOH). Buffering rates in the presence of Ru360, Ru360 + ADP and Ru360 + CsA were calculated by fitting single-exponentials to the individual raw traces in Origin 2017 (OriginLab Corporation). Statistics were run using Student’s t-test, with p < 0.05 considered significant.
To monitor Ca2+ efflux with negligible contributions from NCLX, we exposed rat cardiac mitochondria, energized with K+-succinate, to bolus CaCl2 additions (20 μM) at 300 s intervals in Na+-free experimental buffer. Inhibition of Ca2+ reuptake with MCU-specific inhibitor, Ru360 (1 μM) just after a CaCl2 bolus revealed a net Ca2+ efflux, indicated by an increase in Ca2+ in the buffer solution (Figure 1A). Ru360 was applied at different time-points in the protocol, which correlated with the number of CaCl2 boluses added to the buffer. This allowed increasing amount of Ca2+ to be taken up and sequestered by the mitochondria, prior to revealing Ca2+ efflux. The Ca2+ efflux rate increased as the number of CaCl2 boluses increased, indicating that Ca2+ efflux was dependent on the amount of Ca2+ taken up by the mitochondria (Figure 1B). This is reflected in the cumulative amount of added Ca2+ at the time of Ru360 application (Figure 1B, lower panel). Interestingly, the Ca2+ efflux rate measured after Ru360 addition at 1400 s (following four CaCl2 boluses), approached the Ca2+ efflux rate observed upon opening of the mPTP at the same time in control (Figure 1A, black trace and Figure 1B, black circle). Since these experiments were conducted in Na+-free experimental conditions, the contribution of the NCLX or the Na+/H+ exchanger to the observed Ca2+ efflux can be ruled out. Thus, the results confirm the presence of a Na+-independent Ca2+ efflux that is revealed in the absence of Ca2+ reuptake via the MCU and in the absence of Ca2+ efflux via the NCLX. The results also show that the rate of the observed Ca2+ efflux is in direct proportion to the total matrix Ca2+. At very high total matrix Ca2+, near to the maximal (CRC) of the mitochondria, the NICE rate appeared to approach the rate of Ca2+ release observed during the irreversible opening of mPTP.
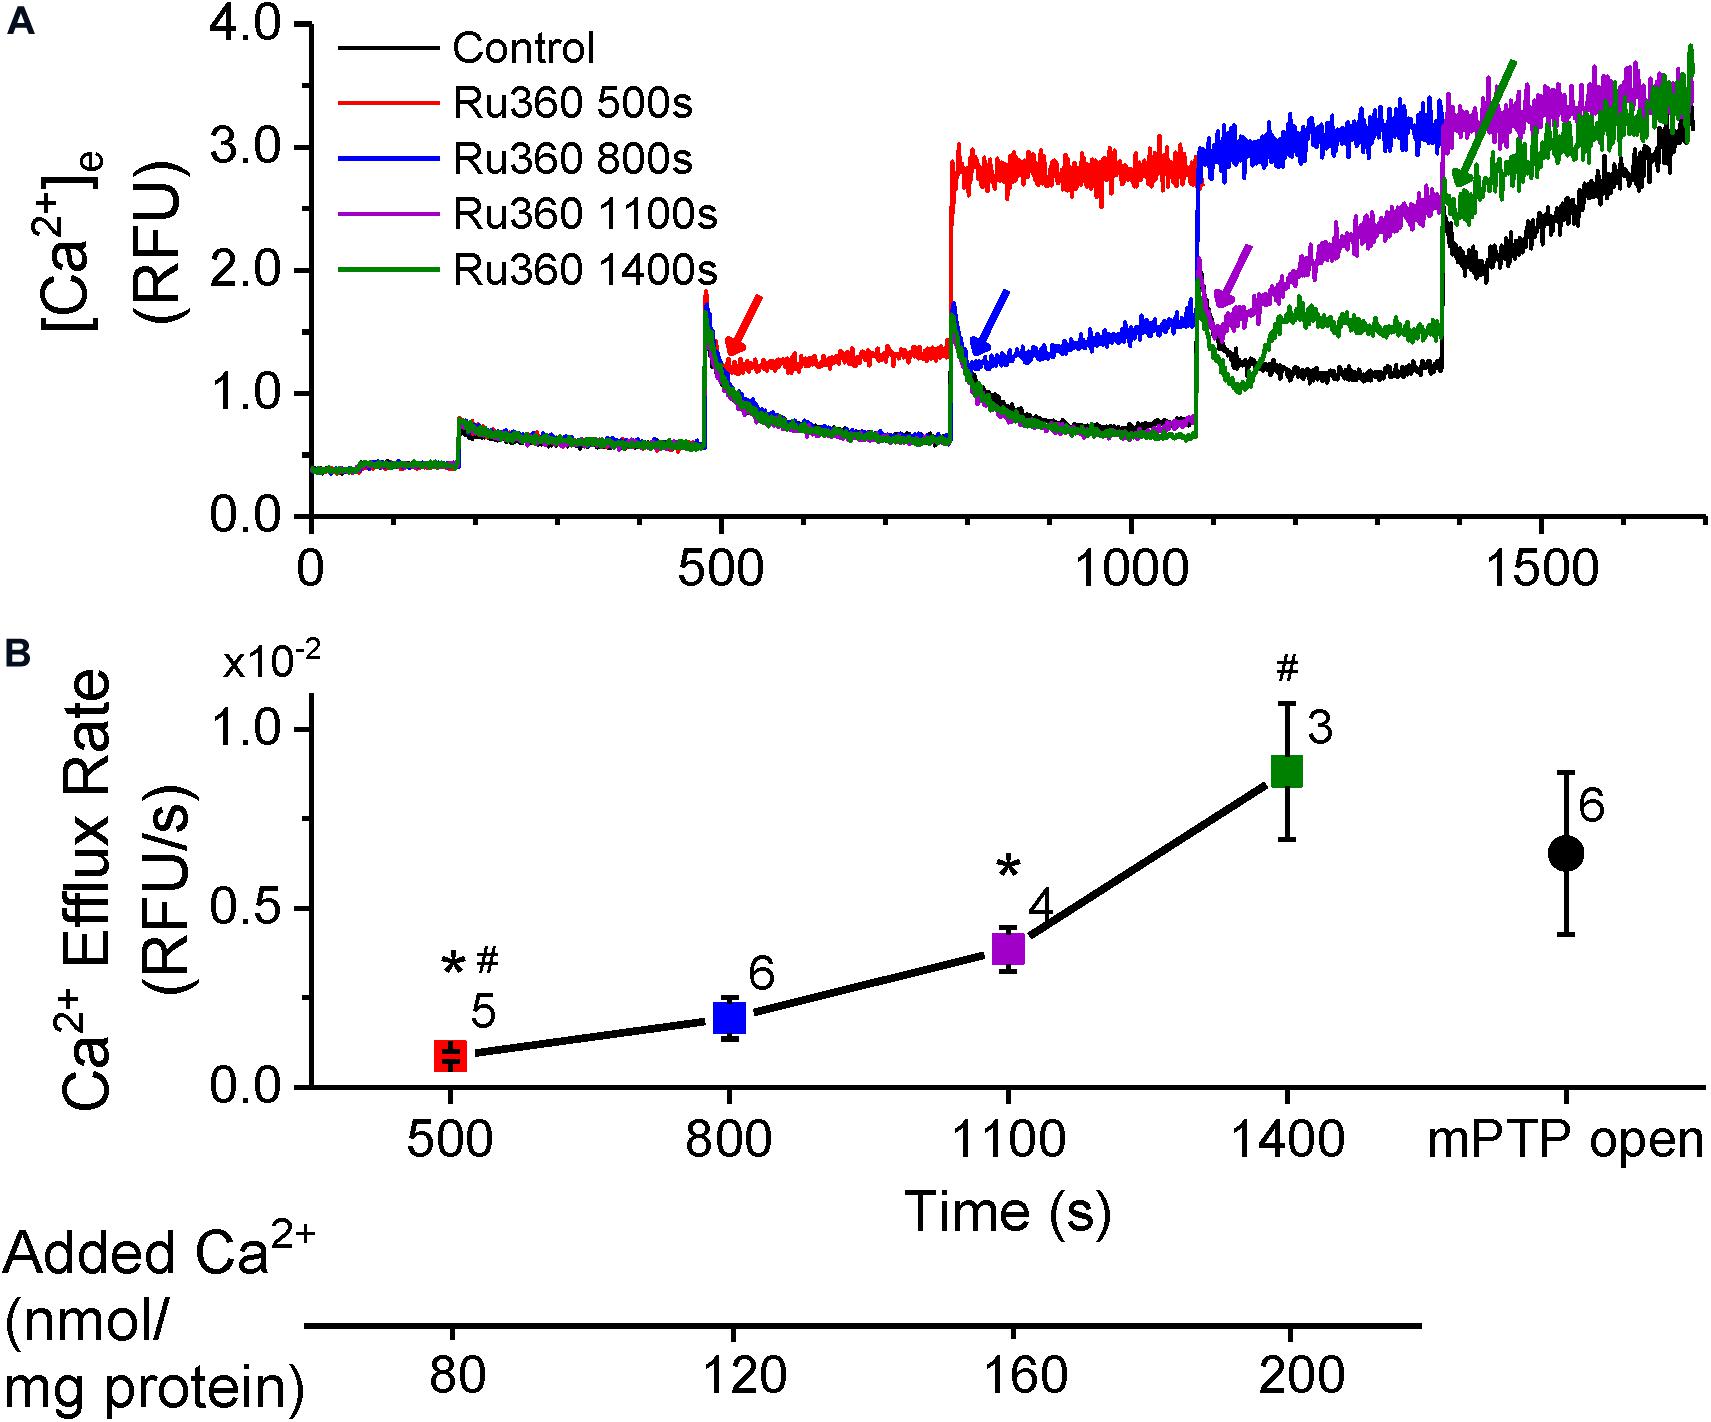
Figure 1. Ca2+-efflux increases with total matrix Ca2+. (A) Extra-matrix Ca2+ measured as relative fluorescence changes in Na+-free experimental buffer loaded with the Ca2+-sensitive ratiometric dye Fura-4F. 20 μM CaCl2 pulses were added first at 180 s and at every 300 s thereafter, in the absence (control, black trace) or the presence of MCU-inhibitor Ru360 (1 μM) added at different times as follows: red trace – 500 s; blue trace – 800 s; purple trace – 1110 s; green trace – 1400 s. Times of addition of Ru360 are indicated by color-matched arrows. (B) Efflux rates obtained from the slope values (m) calculated from fits (y = m*x + c) to the linear phase of Ca2+ efflux from 5 s to 1 min after addition of 1 μM Ru360 in each trace in (A). Symbol colors correspond to the trace colors and conditions as specified in (A). The efflux rate for Control (black circle) was obtained by fitting the equation (y = e–(x–t)/τ + m*x + c) to changes in Ca2+ when mPTP opens (1380 s onward in control in A). Numbers besides symbols denote the number of experiments for each data point. The scale below the X-axis shows the cumulative Ca2+ added before the corresponding time-point of efflux rate calculation. *, # indicates significant difference (p < 0.05) between indicated pairs.
Movement of Ca2+ from the cytosol and into the matrix is dictated by the membrane potential (ΔΨm, ∼−180 mV, negative inside the matrix) across the IMM (Bernardi and Azzone, 1983) and by the free (unbound) Ca2+ concentration gradient between the intra- and extra-matrix compartments. In functioning mitochondria, ΔΨm and the Ca2+ gradient is maintained by regulating the free matrix Ca2+ concentration at a steady state (m[Ca2+]ss) via well-balanced mechanisms of Ca2+ uptake, efflux and buffering (Rizzuto et al., 2000; Nicholls, 2005; Finkel et al., 2015; Giorgi et al., 2018; Mishra et al., 2019). We recently showed that [mCa2+]ss is maintained and returns to the same steady-state value between two bolus Ca2+ additions, thereby preserving ΔΨm and the Ca2+ gradient and promoting a robust Ca2+ uptake, until buffering fails and leads to mPTP opening (Mishra et al., 2019). Under our experimental control conditions at pH 7.15 (Figure 1A), the steady-state Ca2+ levels just prior to applying CaCl2 boluses at t = 480 s, t = 780 s and t = 1080 s were similar and the peak Ca2+ fluorescence after application of the CaCl2 boluses were also similar. This suggests that if, as previously reported, the [mCa2+]ss is also similarly maintained between two successive CaCl2 pulses (Mishra et al., 2019), the Ca2+ efflux rate should also be maintained. Yet when Ca2+ uptake and any reuptake was inhibited with Ru360 at t = 500 s, t = 800 s and t = 1100 s respectively, the rate of Ca2+ efflux progressively increased from t = 500 to 800 s to 1100 s (Figure 1B). This suggests that the rate of Ca2+ efflux may be influenced by the amount of bound Ca2+ in the mitochondrial matrix. Hence, we measured changes in intra-matrix Ca2+ (Figure 2) using the same protocol as in Figure 1.
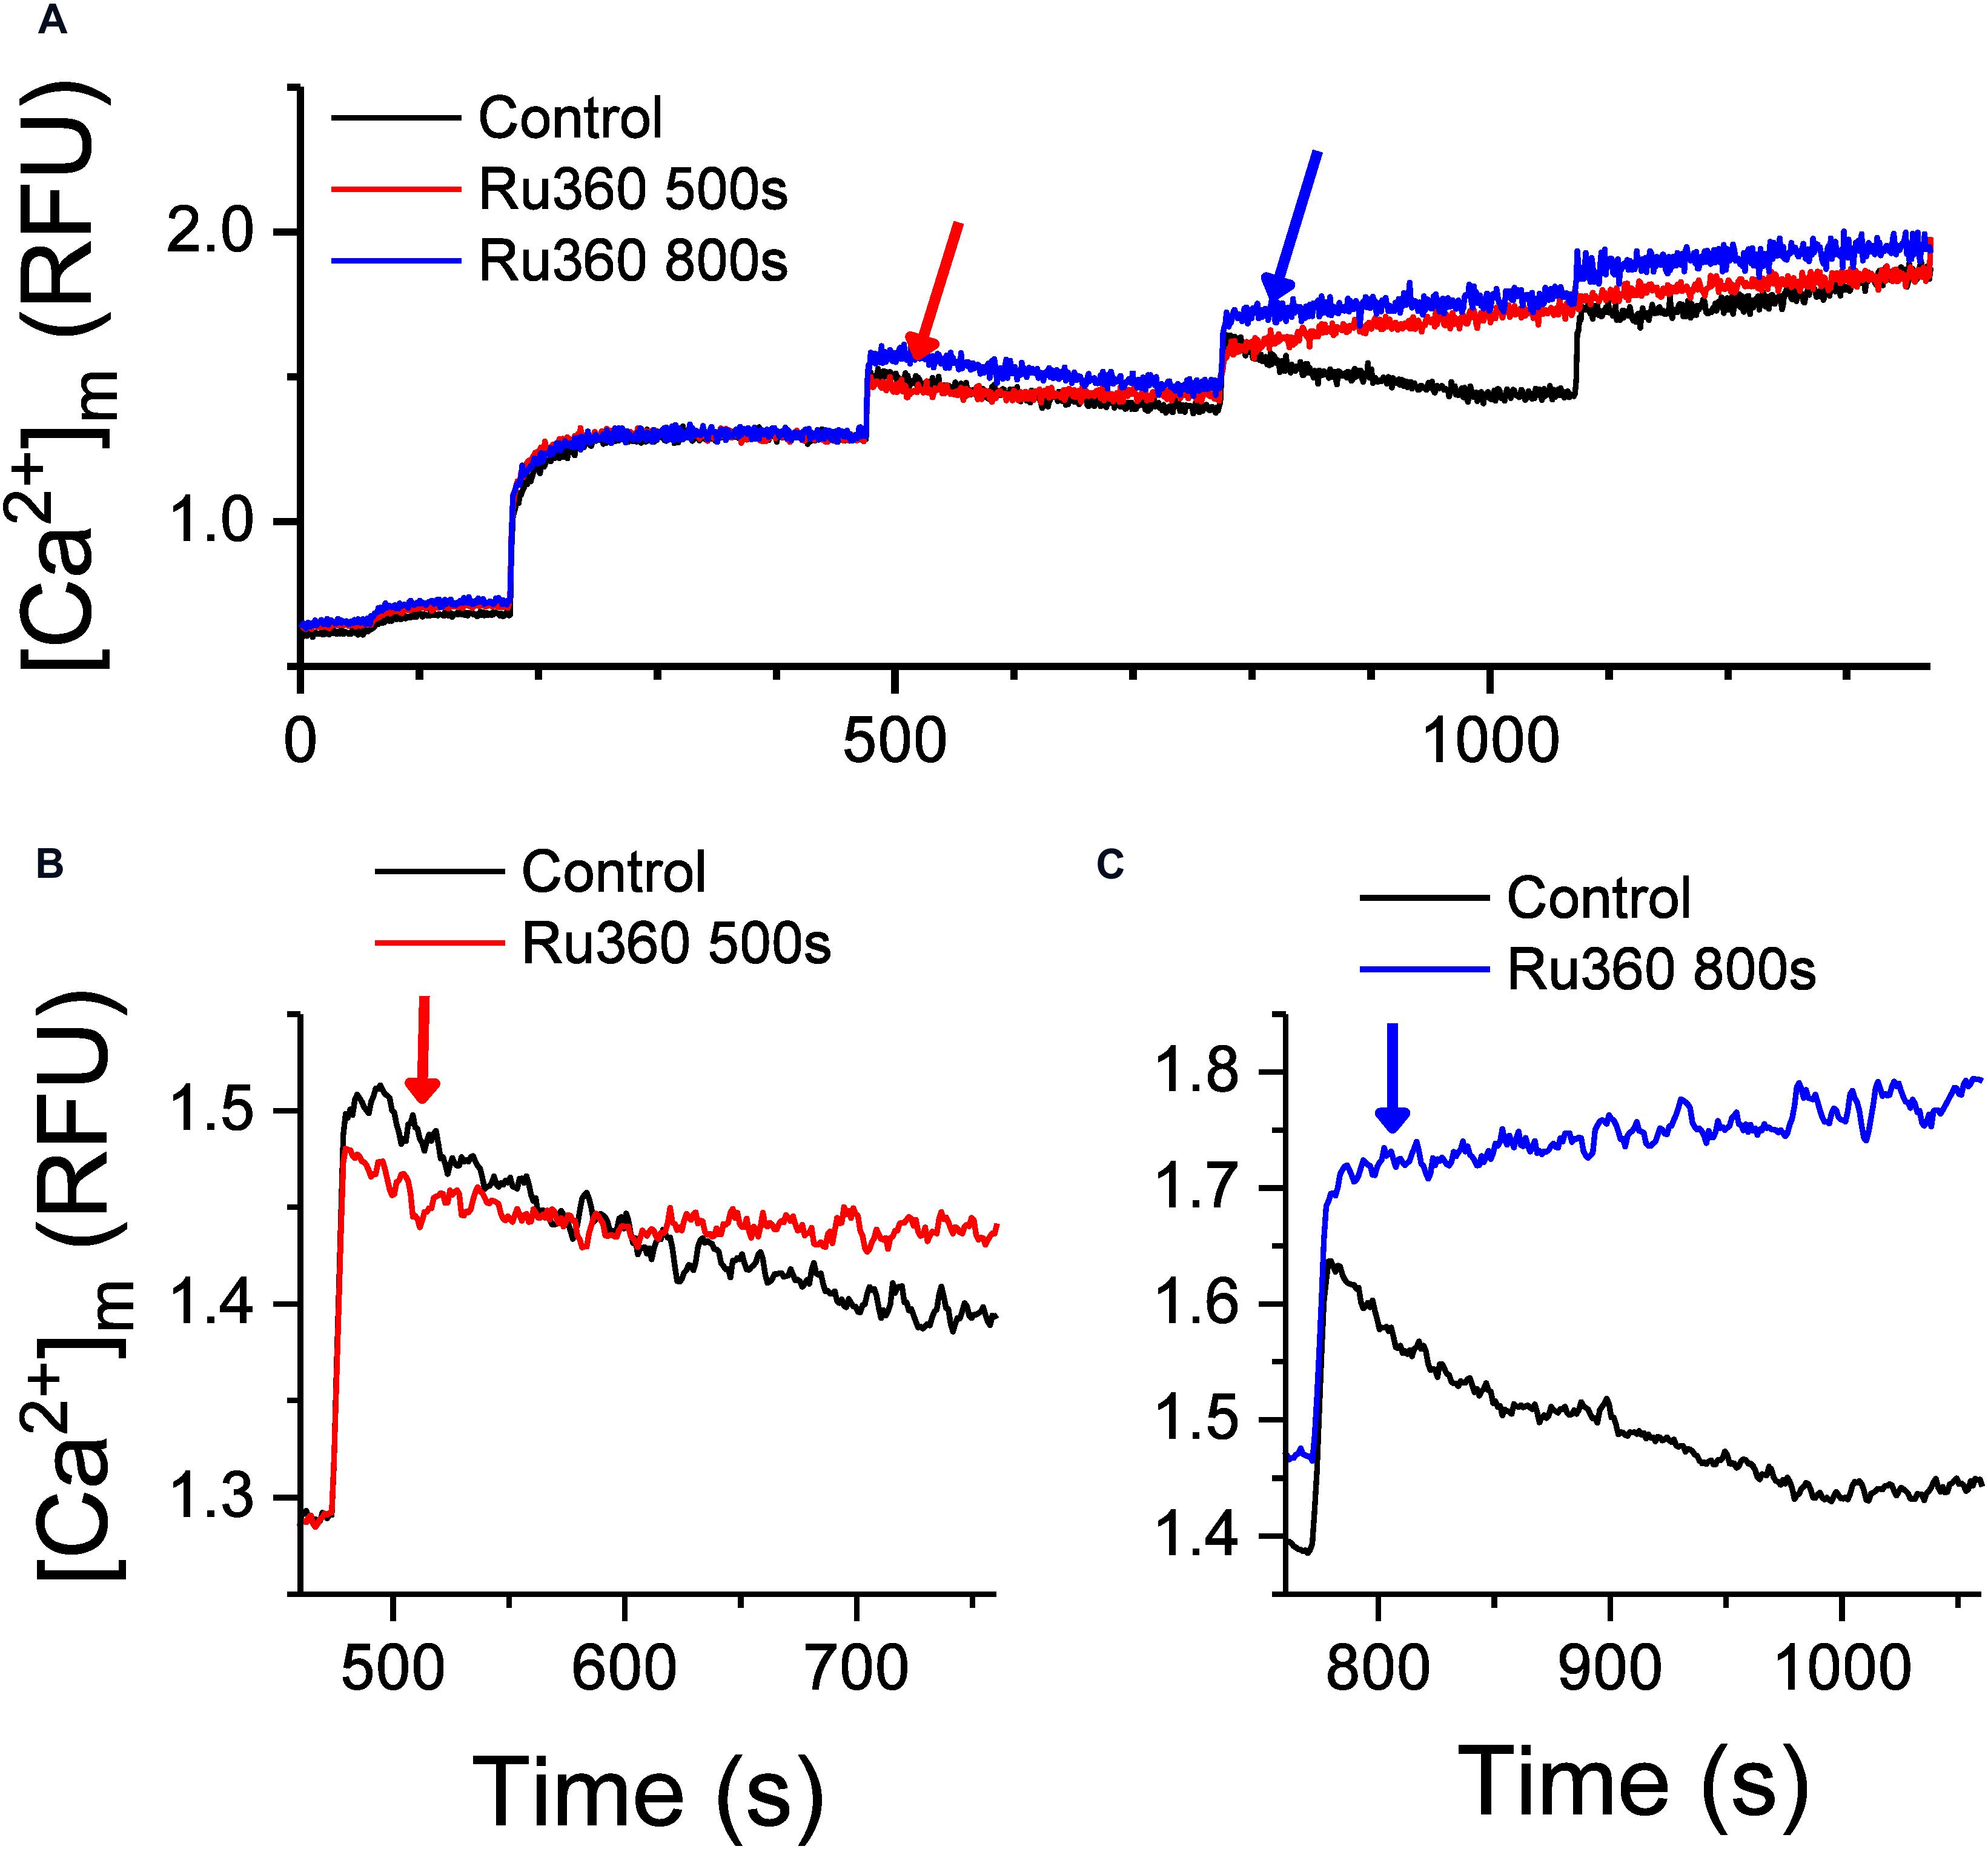
Figure 2. Inhibition of Ca2+ uptake regulates Ca2+ buffering and intra-matrix Ca2+. (A) Changes in intra-matrix Ca2+ in mitochondria isolated from rat hearts in response to 20 μM CaCl2 boluses in the absence (control, black) or presence of 1 μM Ru360 applied at 500 s (red) or 800 s (blue). (B,C) are expanded graphs of (A) to highlight the differences in the kinetics of Ca2+ buffering and steady state mCa2+ in response to application of Ru360.
Addition of the first 20 μM CaCl2 bolus increased matrix Ca2+ to a new [mCa2+]ss. Subsequent boluses induced a sharp rise in [Ca2+]m indicating rapid uptake via the MCU, which gradually decreases over time to [mCa2+]ss indicative of Ca2+ buffering, until the CRC was exceeded leading to pore opening (Figure 2A, Control, black trace). Upon application of Ru360 at t = 500 s, Ca2+ continued to be buffered, but the eventual [mCa2+]ss reached after 5 min was higher compared to control (Figure 2B, red versus black trace), indicating an altered equilibrium between buffered versus free [mCa2+]ss. Interestingly, when Ru360s was applied at t = 800 s, no more Ca2+ appeared to be buffered, instead there was a marked increase in [mCa2+]ss, suggesting a greater shift in the equilibrium between buffered versus [mCa2+]ss in the absence of Ca2+ uptake (Figure 2C, blue versus black trace). This greater increase in [mCa2+]ss also correlates with a greater rate of Ca2+ efflux observed in Figure 1 (blue trace). The effect of inhibiting Ca2+ uptake on [mCa2+]ss is thus dependent on the time at which the inhibition occurs, which also correlates with an increase in total matrix Ca2+and the increasing rates of Ca2+ efflux observed at the same time points. The results thus far suggest that the rate of Ca2+ efflux in the absence of Ca2+ uptake is reflective of the total Ca2+ accumulated inside the matrix at any given time.
We next tested whether agents that regulate Ca2+ buffering would affect the rate of Ca2+ efflux, using ADP and cyclosporine A (CsA), which have been reported to act as mitochondrial Ca2+ chelating/buffering agents. ADP is known to modulate [mCa2+]ss by increasing Ca2+ buffering (Haumann et al., 2010) and in a recent study, CsA was shown to delay mPTP opening by promoting Ca2+ buffering mechanisms and maintaining low [mCa2+]ss (Mishra et al., 2019). Both agents have been shown to also delay mPTP opening (Halestrap et al., 1997; Hausenloy et al., 2012; Sokolova et al., 2013; Haumann et al., 2019; Mishra et al., 2019). Figure 3 shows the effects of ADP and CsA on the rate of Ca2+ efflux as well as mPTP opening. As in Figure 1, application of Ru360 following a CaCl2 bolus addition revealed a Ca2+ efflux (Figure 3A, green trace). This efflux rate was significantly decreased by an application of 250 μM ADP, 20 s after the application of Ru360 (Figure 3A, red trace). A similar application of 500 nM CsA also decreased the rate of Ca2+ efflux (Figure 3B, blue trace) compared to that in the absence of CsA (Figure 3B, green trace). However, the decrease in Ca2+ efflux rate by CsA was significantly lower compared to that by ADP. The percent change in Ca2+ efflux rates are summarized in Figure 3C. Our results show that exogenous addition of Ca2+ chelators decreases the Ca2+ efflux rate from the mitochondria. Consistent with their effect on Ca2+ efflux rate, both ADP and CsA delayed mPTP opening, with ADP prolonging Ca2+ buffering and delaying mPTP opening much more than CsA (Figure 3D). Interestingly, prior to mPTP opening, both ADP and CsA, after application, returned the steady-state Ca2+ level to the same value (Figure 3D red and blue traces at t = 1680 s).

Figure 3. Effect of ADP and CsA on Ca2+-efflux and mPTP opening. (A–C) Representative raw traces of extra-matrix Ca2+ measured as relative fluorescence changes in Na+-free experimental buffer loaded with the Ca2+-sensitive ratiometric dye Fura-4F. 20 μM CaCl2 pulses were given at 180 and 480 s, followed by 1 μM Ru360 at 800 s (green trace), and (A) 250 μM ADP at 860 s or (B) 0.5 μM CsA at 860 s. (C) % change in the efflux rate before and after addition of 1 μM Ru360 (n = 9), 250 μM ADP (n = 6) or 0.5 μM CsA (n = 4). * indicates significant difference (p < 0.05) between indicated pairs. (D) Rescue of mPTP opening in Control (black trace) after addition of 250 μM ADP (red trace) or 0.5 μM CsA (blue trace).
The effect of Ru360, ADP and CsA on intra-matrix Ca2+ (Figure 4) was consistent with their respective effect on the Ca2+ efflux rate (Figure 3). Addition of Ru360 alone resulted in a higher [mCa2+]ss as before (Figure 2B). Following the addition of 250 μM ADP, 20 s after Ru360, there was a significant increase in the rate of Ca2+ buffering compared to Ru360 alone (rate of decay τ = 8.5 ± 0.3 s–1 in Ru360 + ADP versus τ = 18.3 ± 3.1 s–1 in Ru360 alone, p < 0.05, n = 3 for each condition), eventually reaching a lower [mCa2+]ss than Ru360, but the same [mCa2+]ss as in control (Figure 4A, red versus green and black traces). The faster rate of buffering and lower [mCa2+]ss correlates with the significantly decreased rate of Ca2+ efflux observed in Figure 3, indicating that agents that chelate Ca2+ decrease the CHE-mediated Ca2+ efflux.
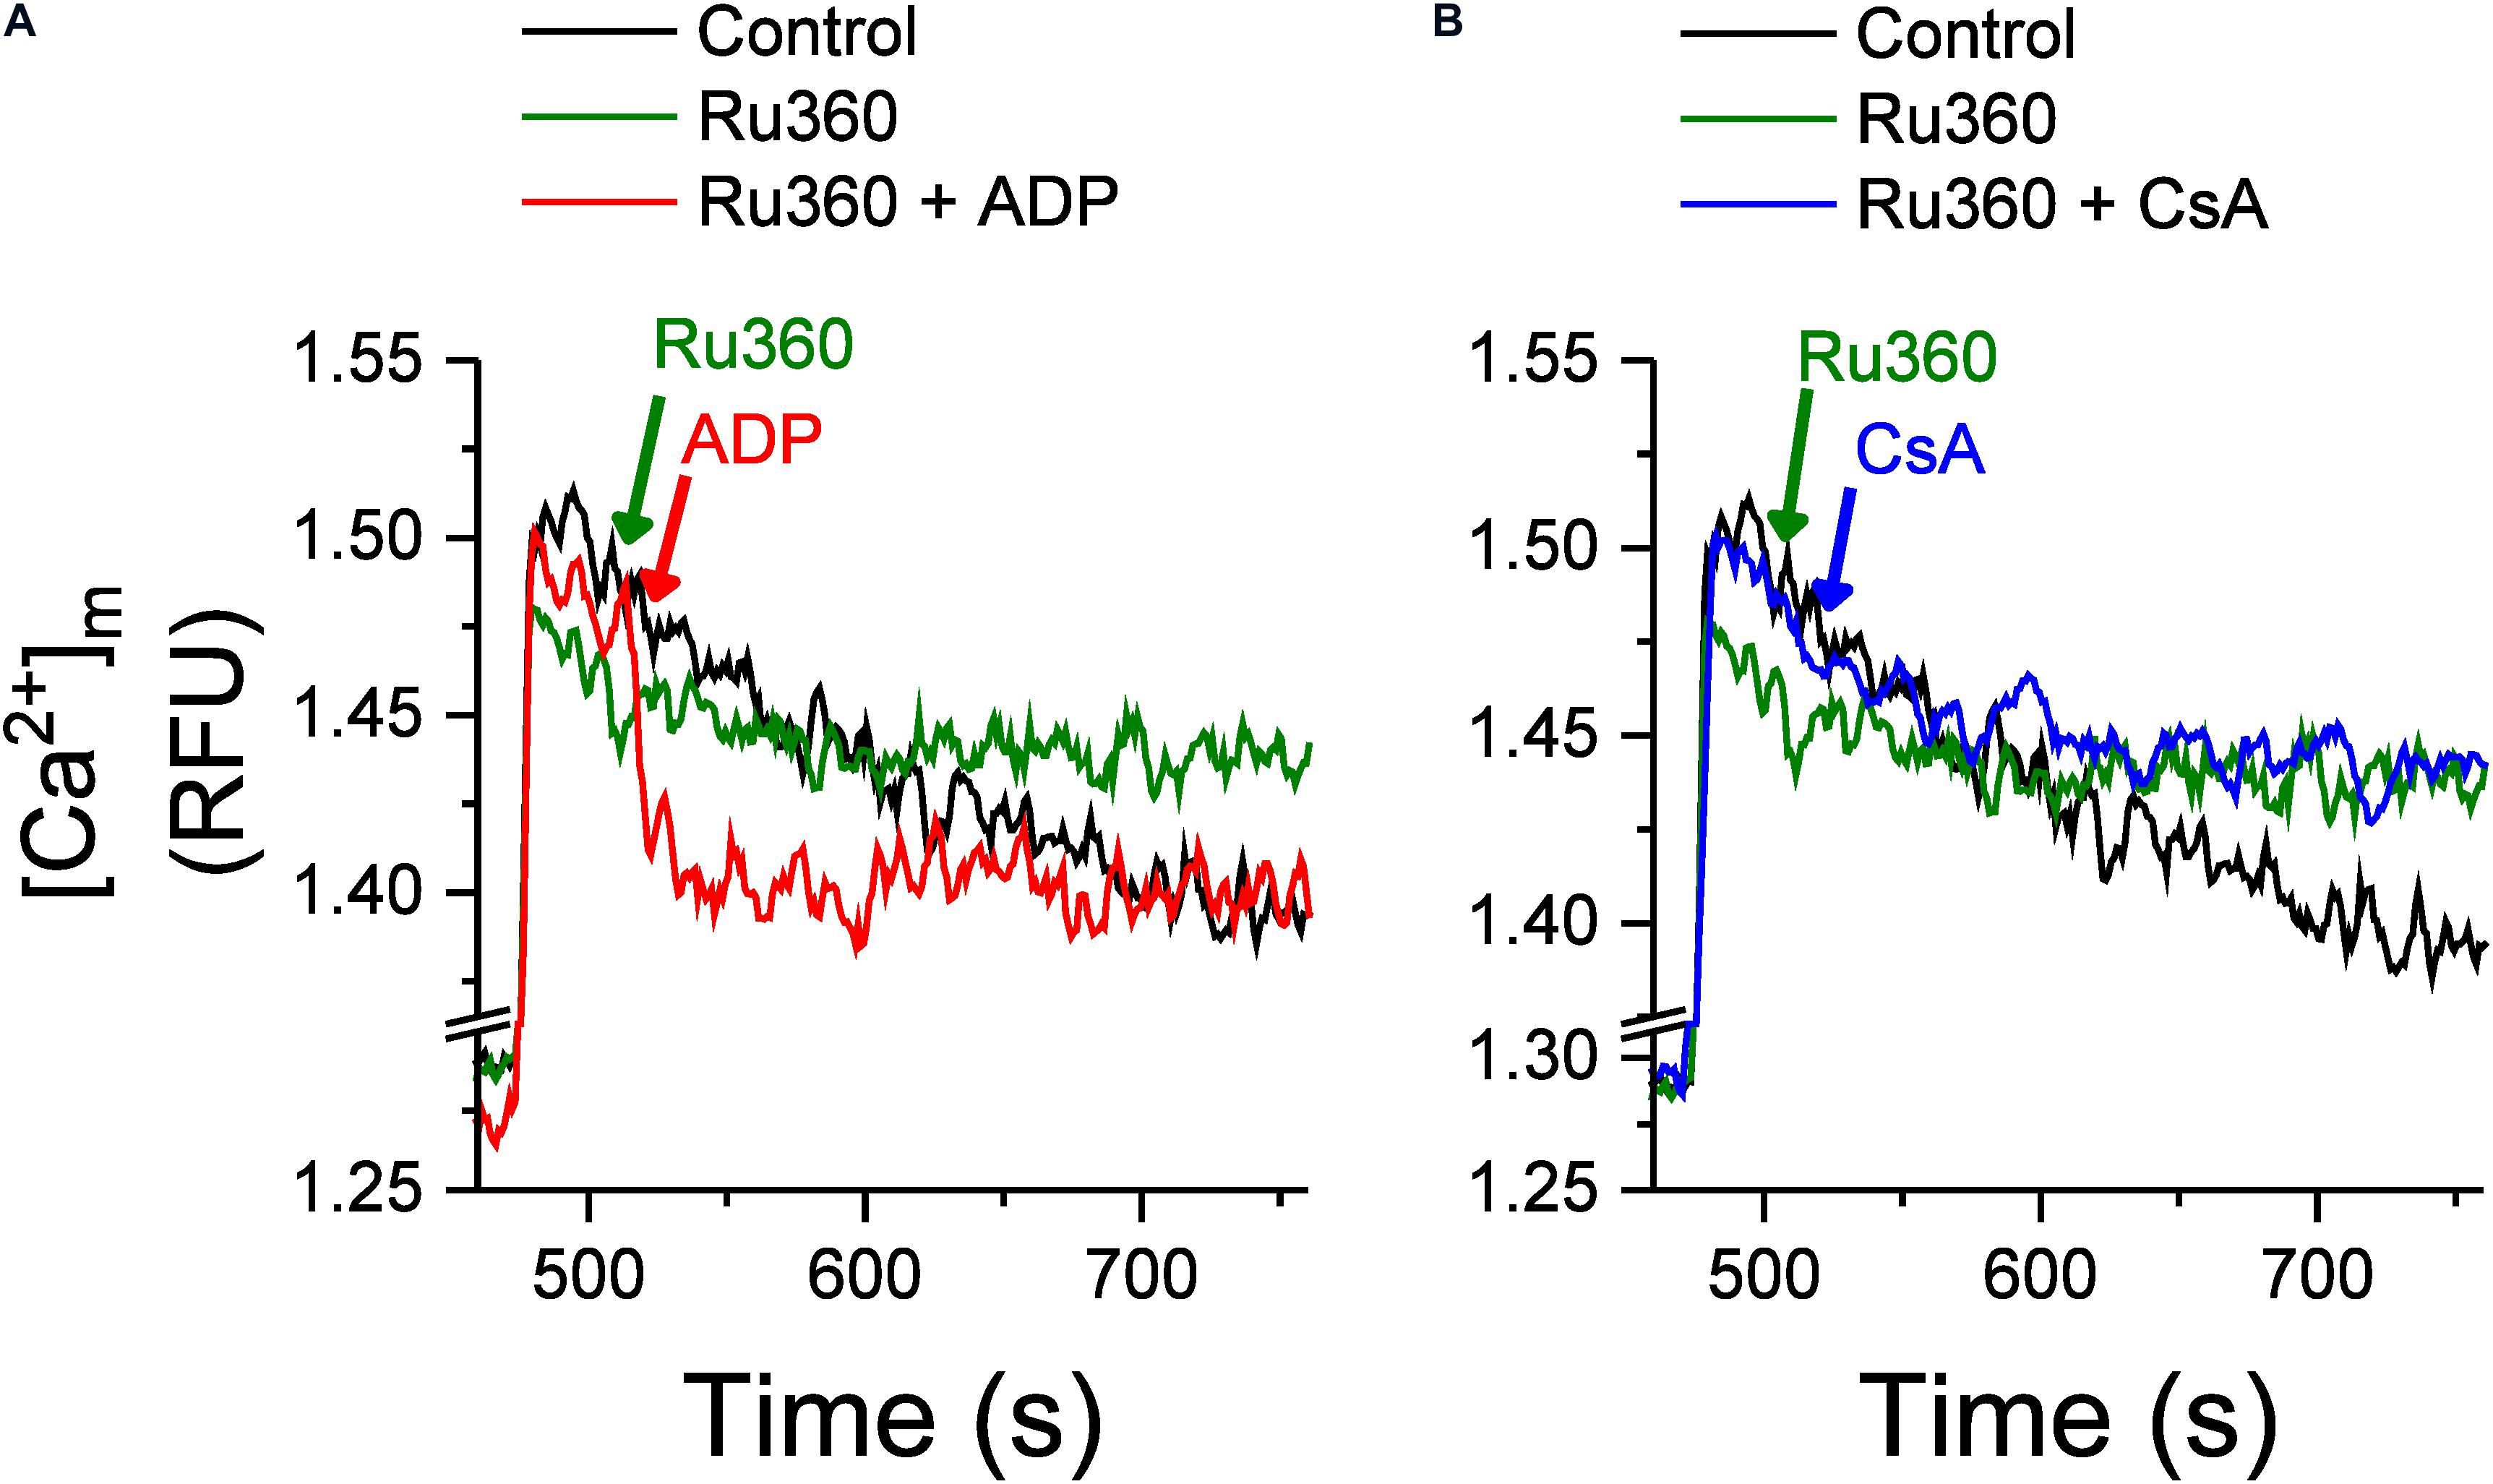
Figure 4. Effect of ADP and CsA on Ca2+ buffering and intra-matrix Ca2+. Changes in intra-matrix Ca2+ in mitochondria isolated from rat hearts in response to 20 μM CaCl2 bolus in the absence (control, black) or presence of 1 μM Ru360 applied at 500 s (green) followed by either (A) ADP (red) or (B) CsA (blue) at 520 s.
In contrast with the effect of ADP, the addition of 500 nM CsA, neither increased the rate of buffering (rate of decay τ = 21.1 ± 6.8 s–1 in Ru360 + CsA versus τ = 18.3 ± 3.1 s–1 in Ru360 alone, n = 3 for each condition) nor decreased the eventual [mCa2+]ss compared to control or Ru360 alone (Figure 4B), even though the rate of Ca2+ efflux was significantly decreased compared to Ru360 alone (Figure 3C).
In Figures 1, 3 above, a net Ca2+ efflux, revealed by inhibition of Ca2+ reuptake via MCU, increased with an increase in matrix Ca2+. Besides the MCU, putative mitochondrial ryanodine receptors (RyRs) may be involved in Ca2+ uptake (Altschafl et al., 2007; Tewari et al., 2014) and hence may modulate the rate of Ca2+ efflux. To evaluate this possibility, we used the same protocol as in Figure 1 and recorded Ca2+ uptake and efflux in the presence of MCU-specific inhibitor Ru360 (Figure 5A, black trace) and in the presence of ruthenium red (RuR), which inhibits both the MCU and RyRs (Figure 5A, red trace). No differences were observed in the rate of Ca2+ efflux between the two protocols, indicating that Ca2+ uptake via mRyRs did not affect the observed rate of Ca2+ efflux.
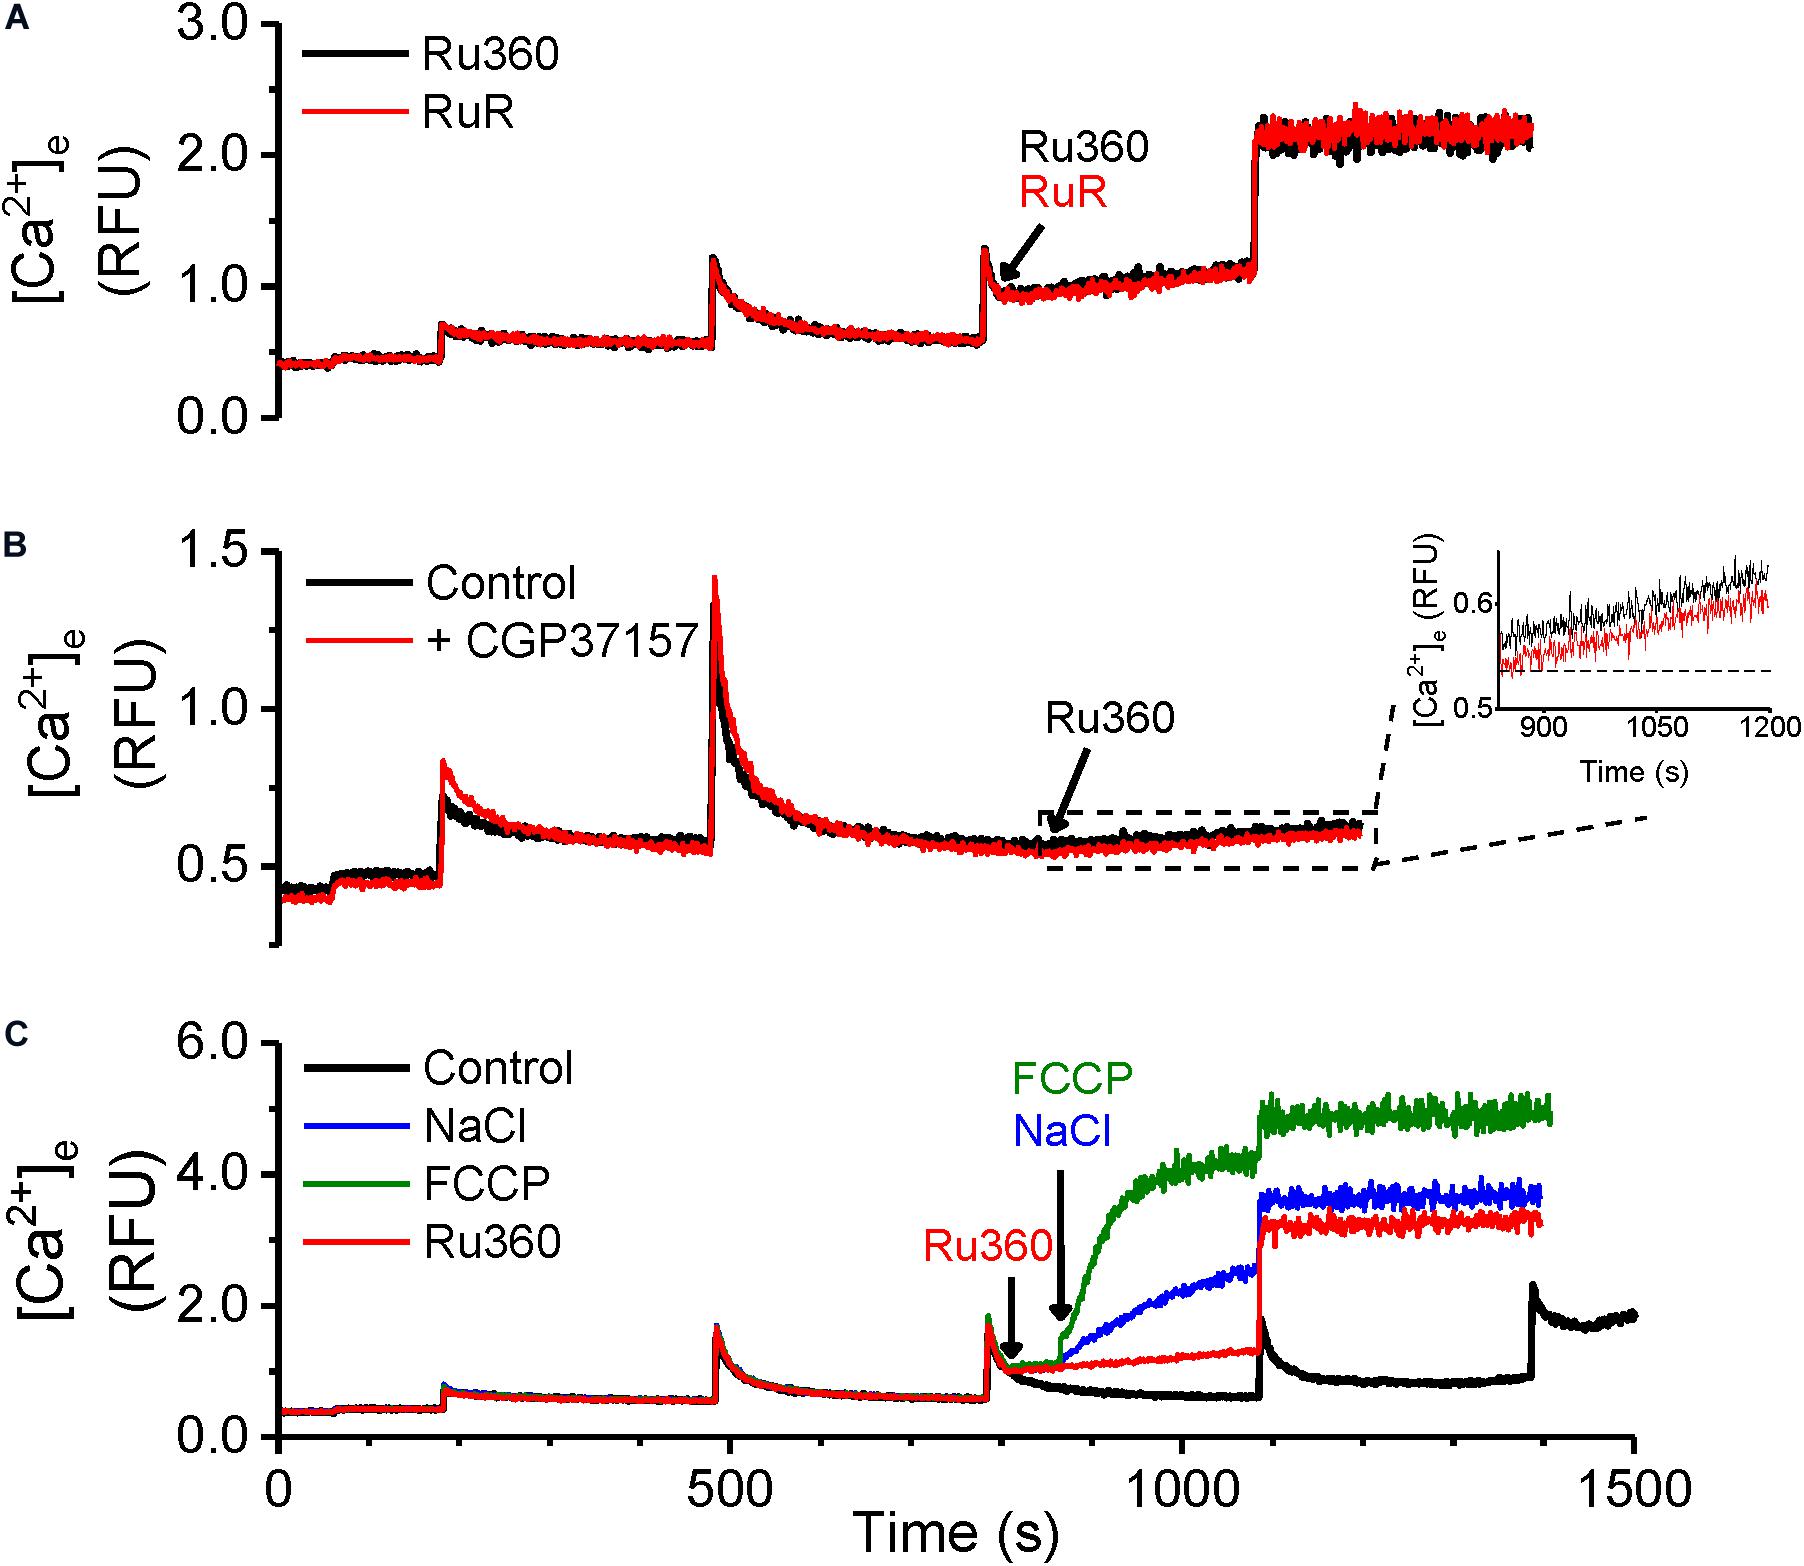
Figure 5. Ca2+-efflux is not modulated by mitochondrial RyRs or NCLX. (A–C) Representative raw traces of extra-matrix Ca2+ measured as relative fluorescence changes in Na+-free experimental buffer loaded with the Ca2+-sensitive ratiometric dye Fura-4F. (A) 20 μM CaCl2 pulses were given before and after addition of either 1 μM Ru360 (black trace) or 1 μM RuR, mRyR inhibitor Ruthenium Red (red trace). (B) 20 μM CaCl2 pulses were given at 180 and 480 s, followed by the addition of 1 μM Ru360 at 840 s in the absence (black trace) or the presence of NCLX inhibitor, CGP37157 (1 μM, red trace). Inset: Greater detail of traces enclosed by dashed box in (B) from t = 840 to 1200 s. (C) Control (black trace): 20 μM CaCl2 pulses were given at periodic intervals of 300 s until mPTP opening. Other traces: 20 μM CaCl2 pulses were given at 180, 480, and 780 s, followed by 1 μM Ru360 at 800 s (red trace), with further addition of 5 mM NaCl (blue trace), or 4 μM FCCP (green trace) at 820 s.
Since our results were obtained in Na+-free experimental conditions, the contribution of the Na2+ gradient driven Ca2+ efflux via NCLX was obviated. However, it does not rule out a contribution of the NCLX operating in reverse mode to import Ca2+ into the matrix (Samanta et al., 2018) and modulate Ca2+ efflux when MCU-dependent Ca2+ uptake is inhibited with Ru360. However, no difference in Ca2+ efflux rate was observed when Ru360 was applied after attaining steady state following a bolus addition of CaCl2 in the absence (Figure 5B, black trace) or presence (Figure 5B, red trace) of CGP, a specific inhibitor of mitochondrial NCLX. The Ca2+ efflux rate in control and in the presence of CGP was 2.3 × 10⁻⁴ ± 5.1 × 10⁻⁴ RFU/s in control versus 2.4 × 10⁻⁴ ± 2.7 × 10⁻⁵ RFU/s in the presence of CGP (Figure 5B inset). These results confirm that, under our experimental conditions, the Ca2+ efflux rate was independent of modulation by mRyR and NCLX activity and could be solely attributed to the activity of the cardiac mitochondrial CHE.
In contrast with the Na+-free environment, we also compared the functionality of NCLX with that of CHE, by adding NaCl to the mitochondrial suspension. As shown in Figure 5C, addition of 5 mM NaCl following the addition of Ru360 substantially increased Ca2+ efflux (Figure 5C, blue trace), indicative of NCLX activity. Depolarization induced by addition of FCCP led to a robust Ca2+ efflux, as expected (Figure 5C, green trace). These experiments further corroborate the conclusion that the Ca2+ efflux observed in Figures 1, 3 solely reflect the activation of cardiac mitochondrial CHE and this activity is modulated by total cumulative matrix Ca2+.
The CHE has been shown to function via the thermodynamically stable mechanism of driving Ca2+ transport using the H+ gradient in response to pH changes (Jiang et al., 2009; Tsai et al., 2014; Shao et al., 2016; Haumann et al., 2019). Our results thus far show that the Ca2+ efflux responds to changes in matrix Ca2+. We then investigated, whether the observed Ca2+ efflux is sensitive to pH changes. First, extra-matrix Ca2+ was allowed to reach a steady-state value following a bolus CaCl2 addition. This was followed by application of Ru360 to reveal a steady-state Ca2+ efflux (Figure 6A). Subsequently, a change in the pH of the external solution from the basal 7.15 ± 0.03 to a more acidic value of 6.85 ± 0.05 was induced by the addition of HCl. This resulted in an initial instantaneous jump in Ca2+ fluorescence, reflecting the aggregate of a decreased affinity of EGTA as well as the dye for Ca2+ in acidic pH (Lattanzio, 1990), followed by the continuation of the Ca2+ efflux at a higher rate, indicated by the increase in the slope of the Ca2+ efflux signal compared to the slope observed before addition of HCl (Figure 6A, red trace). The calculated rate of Ca2+ efflux was 2.4-fold greater after HCl addition (Figure 6C, Ru360 + HCl) compared to before (Figure 6C, Ru360 alone). When the pH was changed from the basal 7.15 ± 0.03 to a more alkaline pH 7.55 ± 0.05 by addition of KOH, there was an initial instantaneous decrease in fluorescence consistent with an increased affinity of EGTA and the dye to Ca2+. However, in contrast with the observation in acidic buffer pH, no further change in the rate of Ca2+ efflux was observed in alkaline buffer pH (Figure 6A, blue trace and Figure 6C, Ru360 + KOH).
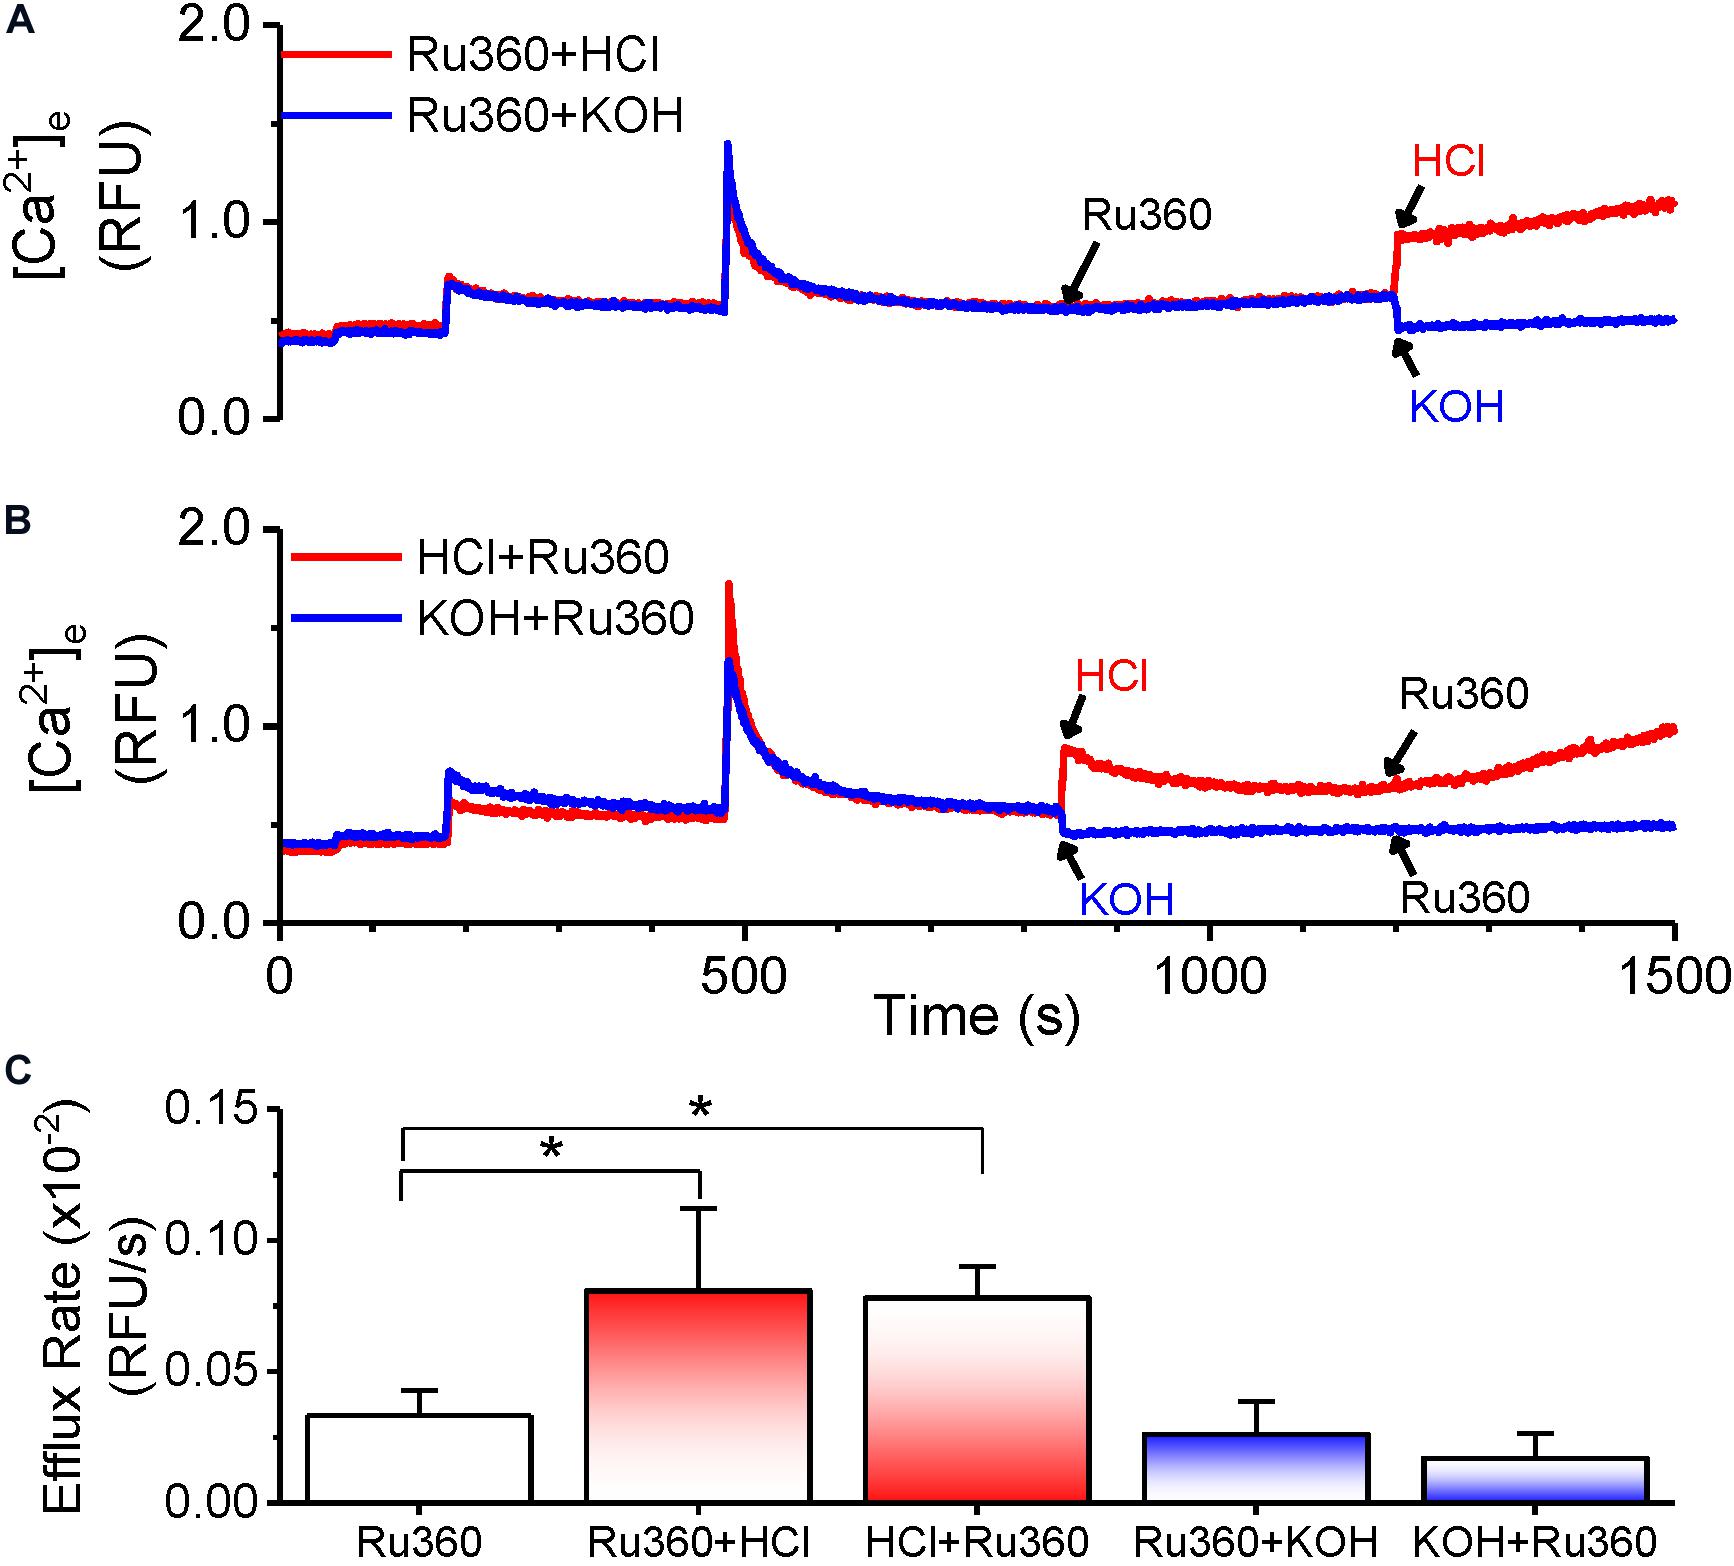
Figure 6. pH-dependent modulation of Ca2+-efflux rate. (A,B) Representative raw traces of extra-matrix Ca2+ measured as relative fluorescence intensity changes in Na+-free experimental buffer loaded with the Ca2+-sensitive ratiometric dye Fura-4F. 20 μM CaCl2 pulses were given at 180 and 480 s and allowed to reach steady state before applying different treatments as follows: (A) Addition of 1 μM Ru360 at 840 s followed by HCl (pH = 6.85 ± 0.05, red trace) or KOH (pH = 7.55 ± 0.05) at 1200 s (B) Addition of HCl (pH = 6.85 ± 0.05, red trace) or KOH (pH = 7.55 ± 0.05) at 840 s followed by 1 μM Ru360 at 1200 s. (C) Summary of efflux rates (m) calculated from fits (y = m*x + c) to the linear phase of Ca2+ efflux from 20 s to 1 min after the indicated intervention in (A,B).
We next reversed the order of application of HCl and Ru360 to first activate the CHE before inhibiting MCU-driven Ca2+ uptake. The rate of Ca2+ efflux observed upon addition of Ru360 was greater than that in Ru360 alone and not significantly different from the rate of Ca2+ efflux observed when HCl was applied after Ru360 (Figure 6B, red trace and Figure 6C, HCl + Ru360). Consistent with the effect observed in Figure 6A, reverse application of KOH first, followed by Ru360 did not change the rate of Ca2+ efflux (Figure 6B, blue trace and Figure 6C, KOH + Ru360).
The results here indicate that changes in extra-matrix pH, specifically changes that make it more acidic are able to modulate Ca2+ efflux and further confirm that the observed Ca2+ efflux is due to the activation of CHE by the proton gradient.
According to the chemiosmotic principle, Ca2+ uptake into the mitochondria is primarily regulated by the large ΔΨm, generated by the pumping of H+ ions by the electron transport chain. In contrast, Ca2+ efflux, initially characterized in liver mitochondria, was determined to be independent of ΔΨm (Pozzan et al., 1977; Gunter et al., 1983; Brand, 1985) and instead determined by the chemical gradient of the ions being transported across the IMM. The consensus opinion is that, in normal conditions, Ca2+ efflux matches Ca2+ influx to maintain a steady state [Ca2+]m and ΔΨm. In our study, application of Ru360 inhibited Ca2+ reuptake and revealed a Ca2+ efflux (Figures 1, 3, 5, 6), but caused little change in ΔΨm (Figure 7, red and blue traces at 840 s). This suggests that under basal conditions, Ca2+ efflux via the CHE does not directly impact ΔΨm. Repetitive bolus CaCl2 additions eventually depolarized ΔΨm (Figure 7, Control, black trace), which correlates to the times at which matrix CRC reached threshold for mPTP opening under similar experimental conditions (Figure 1, Control, black trace, t ≥ 1100 s). The observed depolarization also correlated with the times at which the rate of Ca2+ efflux via the CHE was increased as revealed in the presence of Ru360 (Figure 1B).
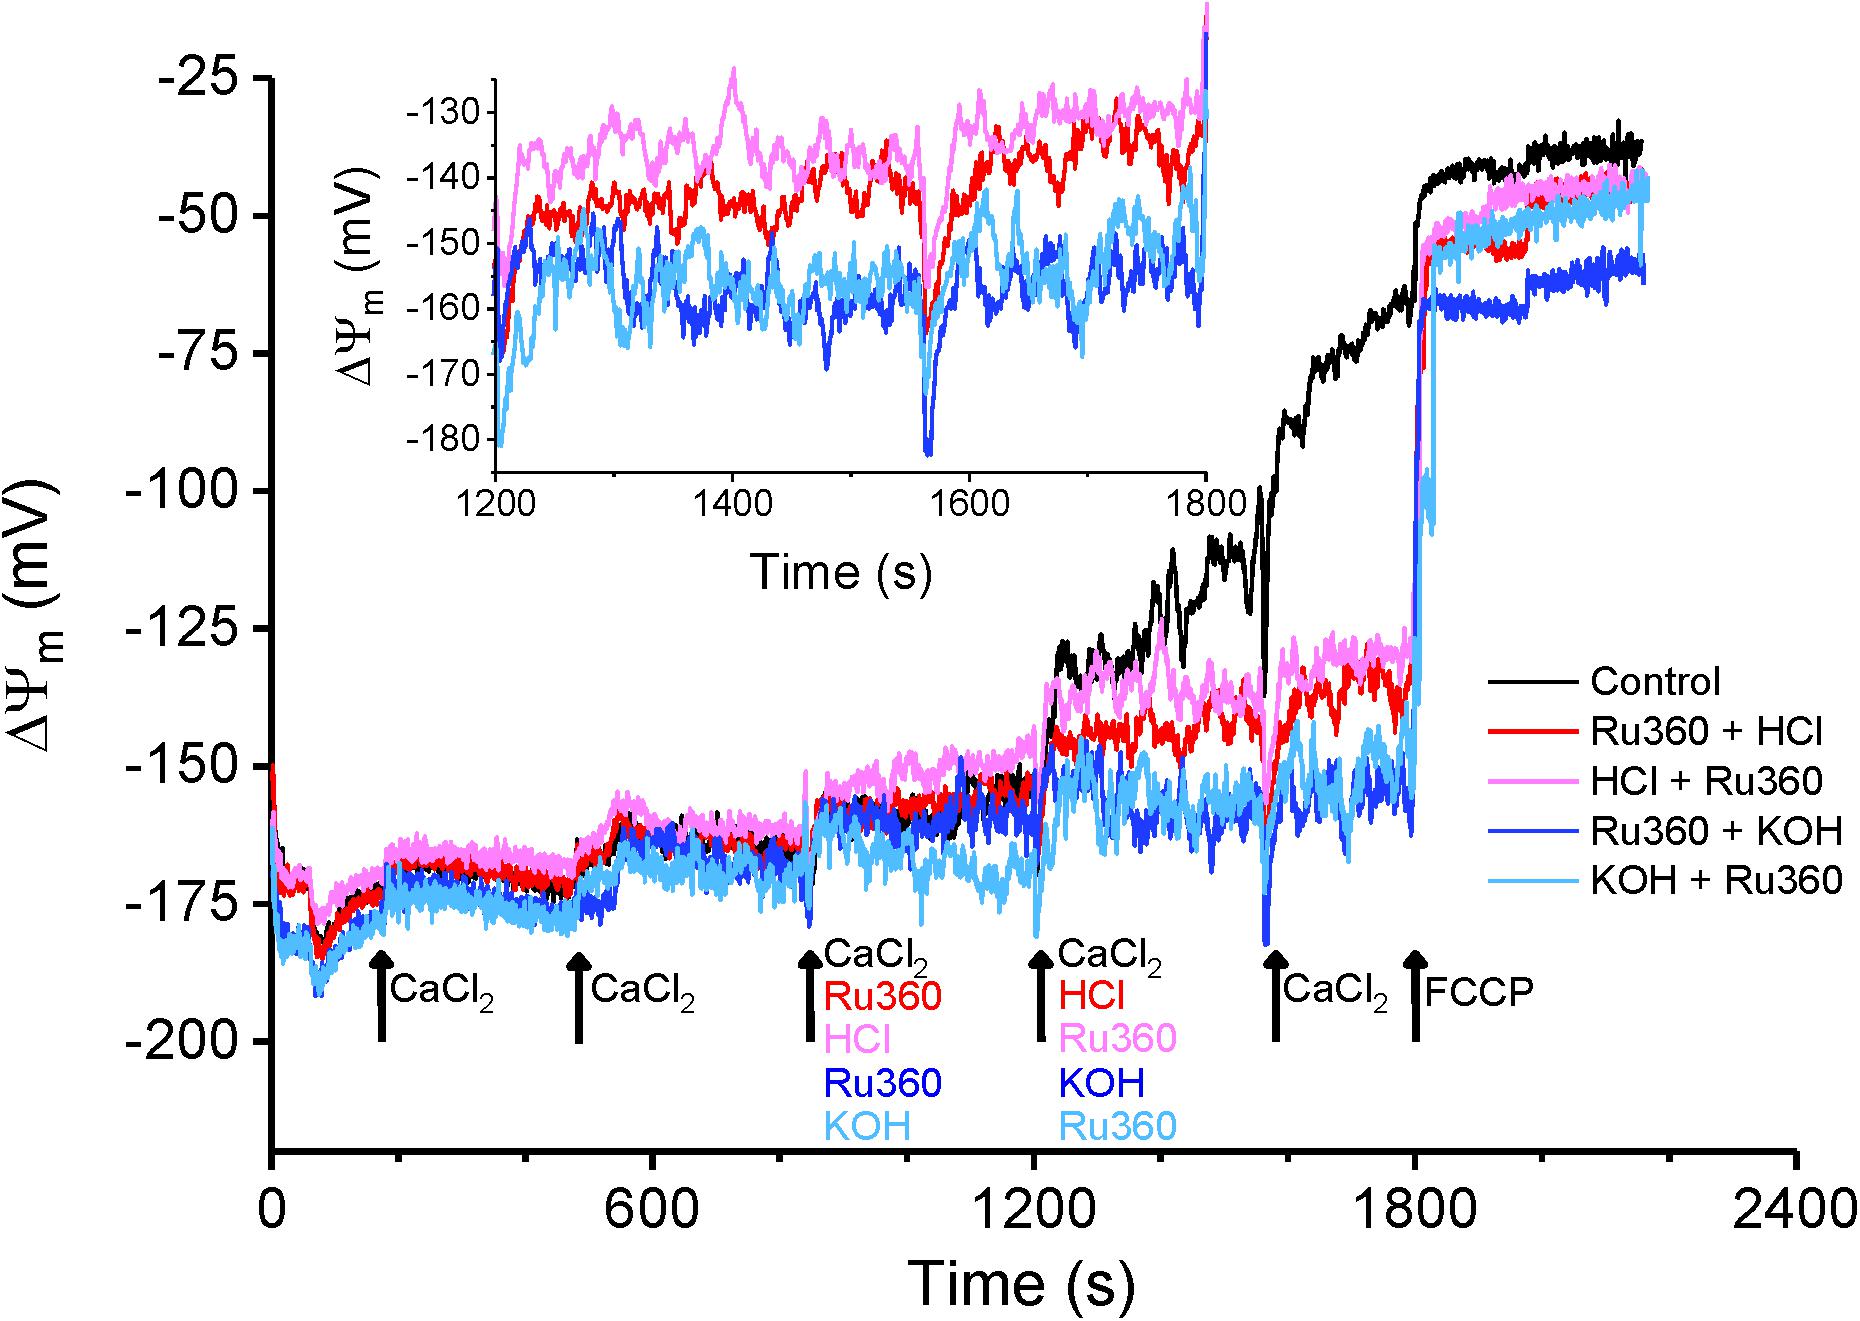
Figure 7. Membrane potential changes in response to acidic and basic pH. Average ΔΨm calculated as a function of TMRM intensity changes as described in section “Materials and Methods.” Membrane potential was evaluated for Control (black trace) and for interventions as indicated by arrows. For all traces, maximal depolarization was observed with the addition of 1 μM FCCP at t = 1800 s. Inset: Enhanced detail of the graph between 1200 and 1800 s shows a depolarization caused by a change to more acidic pH in the buffer solution.
In contrast, an extra-matrix pH change to a more acidic value in the presence of Ru360 (Figure 7, red trace at 1200 s) and application of Ru360 after a change to a more acidic buffer pH (Figure 7, pink trace at 1200 s) caused a small depolarization of ΔΨm = ∼20 mV (Figure 7 inset). Under these conditions, the mitochondria attained a new steady-state ΔΨm and this correlates with an increased rate of Ca2+ efflux observed in similar experimental conditions (Figure 6A, red trace and Figure 6B, red trace and Figure 6C, Ru360 + HCl and HCl + Ru360). The observation that in acidic buffer pH, ΔΨm is depolarized and the rate of Ca2+ efflux is increased is consistent with the activation of CHE due to an increase in the H+ gradient, as also reported by Haumann et al. (2019). It is interesting that acidic buffer pH increases Ca2+efflux rate and is associated with depolarization, while mCa2+-driven increase in Ca2+ efflux rate at physiological pH is associated with depolarization after the mitochondria reaches its maximum buffering capacity (Figure 7, Control, black trace). Taken together, our results show that changes in extra-matrix pH as well as increases in matrix Ca2+ modulate Ca2+ efflux via the CHE and both are associated with a depolarization of ΔΨm.
To verify whether the mCa2+ and H+-driven Ca2+ efflux is mediated by the putative CHE protein LETM1, we performed a transient targeted knockdown of LETM1 in H9c2 cardiac myoblasts (Figure 8). Transfection of H9c2 cells with a pool of siRNAs targeting LETM1 led to significant downregulation of LETM1 mRNA levels (0.12 ± 0.006-fold, Figure 8A) and protein expression (0.22 ± 0.005-fold, Figures 8B,C). No significant changes were observed in the expression of MCU and NCLX proteins (Supplementary Figure S2). Ca2+ dynamics were measured in permeabilized wild-type (WT) or LETM1 siRNA-treated (siLETM1) H9c2 cells energized with 10 mM K-Suc (Figure 8D). To eliminate ER/SR-mediated Ca2+ fluxes, 5 μM thapsigargin and 20 μM EGTA were added to the Na+-free experimental buffer. Upon repetitive application of 5 μM CaCl2 boluses, WT and siLETM1 H9c2 cells exhibited similar Ca2+ dynamics for the first three pulses. However, application of a fourth CaCl2 bolus induced a linear Ca2+-efflux in WT cells that was eliminated in siLETM1 H9c2 cells, indicating the presence of a LETM1-mediated Ca2+ efflux in the WT cells (Figure 8D). The rate of Ca2+ efflux in WT H9c2 cells was 0.11 × 10⁻² ± 4.39e-5 rfu/s. In contrast the Ca2+ dynamics for the 4th CaCl2 bolus in siLETM1 H9c2 cells exhibited an exponential decay with a rate constant of 0.018 ± 5.5e-4 sec–1 (Figure 8E). Since these studies were performed in Na+-free medium and inhibition with CGP did not change the Ru360-induced Ca2+ efflux rate in WT cells (Figure 8F), we conclude that any Ca2+ efflux mediated by NCLX was suppressed under our recording conditions.
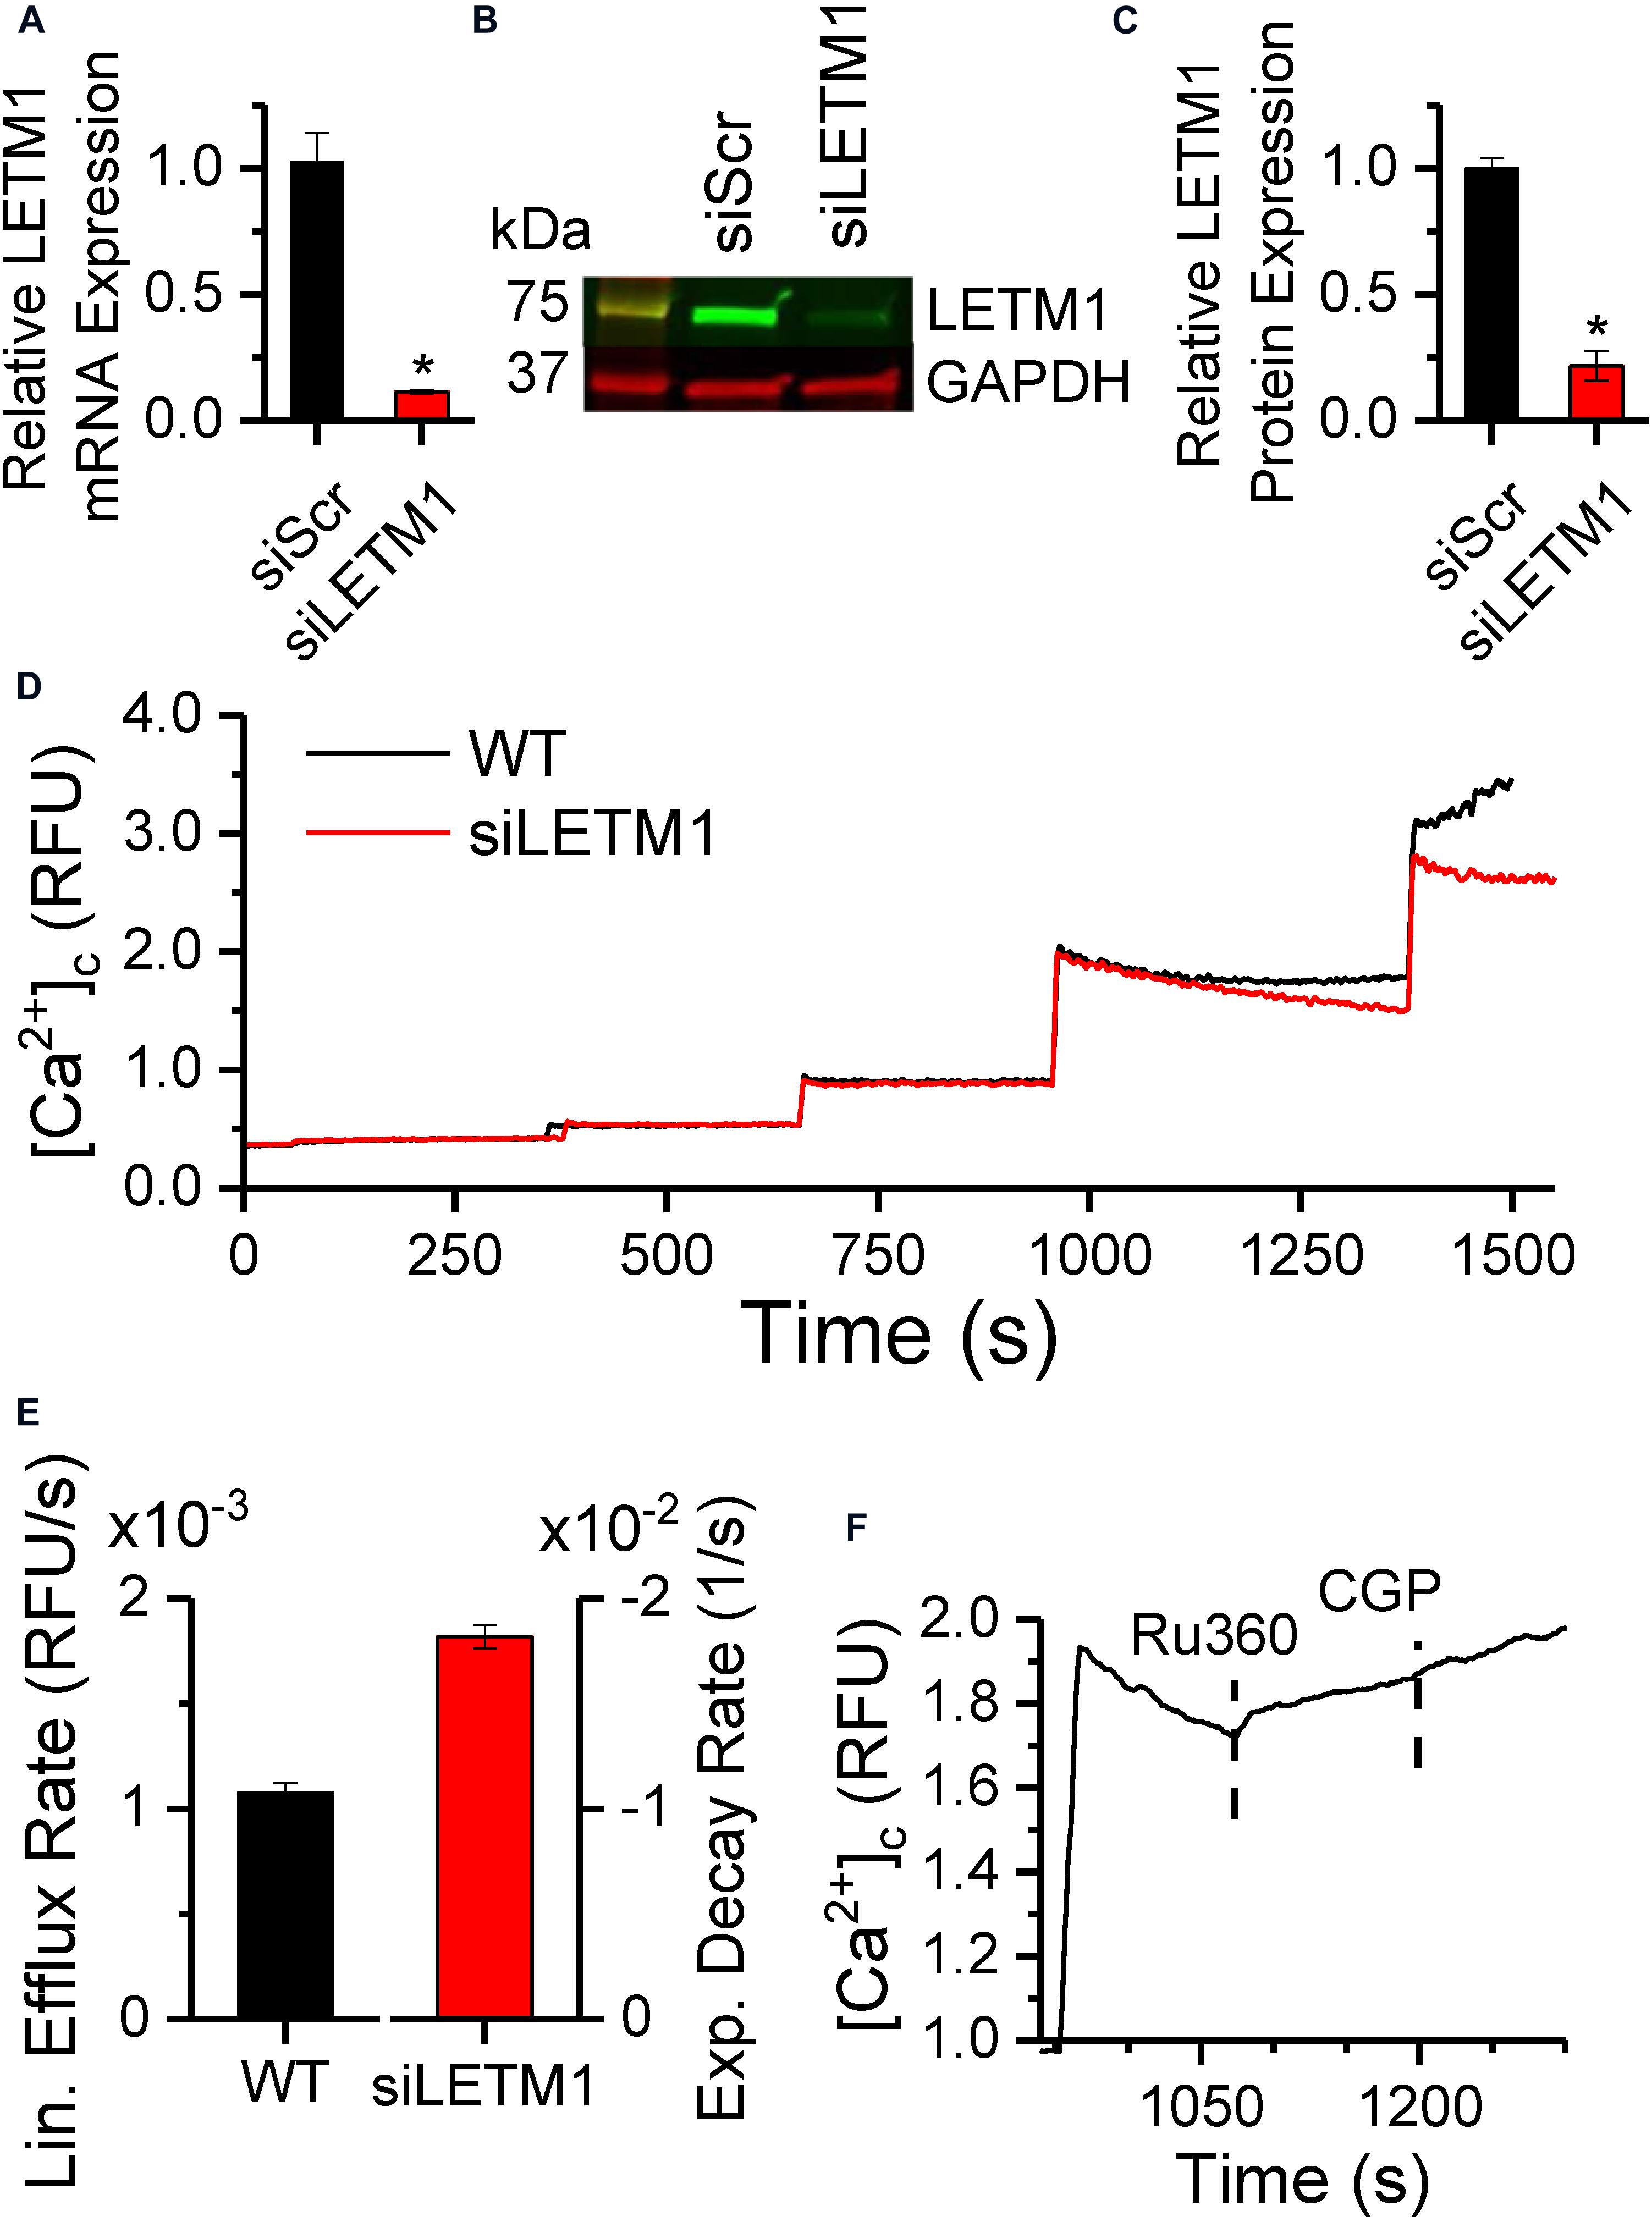
Figure 8. LETM1 knockdown modulates Ca2+ efflux in permeabilized H9c2 cells. (A) mRNA expression of LETM1 in H9c2 cells transiently transfected with scrambled (siScr) or LETM1 siRNA (siLETM1) for 48 h, normalized to the GAPDH mRNA level. (B) Representative immunoblot and (C) densitometric quantification of LETM1 protein expression in H9c2 cells treated with scrambled or LETM1 siRNA for 48 h, with GAPDH as loading control. Bars in (A,C) represent mean ± SEM (n = 3) relative to scrambled siRNA. *p < 0.0005 versus. control siRNA. (D) Changes in cytosolic Ca2+ in permeabilized WT H9c2 cells (black) or H9c2 cells transfected with LETM1 siRNAs (red), in response to 5 μM CaCl2 boluses when energized with 10 mM K-Succinate. (E) Rate of change of Ca2+ calculated using linear fits for Ca2+ efflux rate in WT and 1-exponential fits for the decay rate in [Ca2+]c in siLETM1 H9c2 cells following the 4th CaCl2 bolus in (D). Further details provided in section “Materials and Methods.” (F) Changes in cytosolic Ca2+ in permeabilized WT H9c2 cells in response to a 5 μM CaCl2 bolus followed by addition of 1 μM Ru360 and 2 μM CGP at the times indicated by dashed lines.
The novel findings of this study are that in cardiac mitochondria, inhibition of MCU-mediated Ca2+ uptake (1) reveals a Ca2+ efflux that is modulated by changes in matrix free Ca2+, Ca2+ buffering and pH, (2) increases the rate of Ca2+ efflux as well as free matrix Ca2+. (3) CHE activity is associated with depolarization of the mitochondrial membrane potential. (4) Ca2+ dynamics in H9c2 cells is modified in the absence of LETM1.
Earlier studies stipulated that Ca2+ uptake was balanced by Ca2+ efflux mechanisms to maintain [mCa2+]ss, since inhibition of MCU-dependent Ca2+ uptake by ruthenium red (RuR) or Ru360 had no effect on ΔΨm (De Stefani et al., 2016). Later studies showed that Ca2+ efflux via CHE occurs in a ΔΨm-independent manner and is instead powered by a ΔpH gradient across the IMM (Brand, 1985; Jiang et al., 2009; Tsai et al., 2014; Shao et al., 2016; Haumann et al., 2019). This study demonstrates a novel mechanism for the modulation of CHE-mediated Ca2+ efflux by Ca2+ buffering.
An intriguing observation is that Ru360 increased Ca2+ efflux as well as free matrix Ca2+ (Figure 2A) and this effect was enhanced at greater matrix Ca2+ loads (Figure 2B). With Ca2+ uptake inhibited and with an active Ca2+ efflux, it is expected that free matrix Ca2+ would decrease. Instead, whether due to a direct effect of Ru360 or due to a shifting equilibrium between Ca2+ uptake, efflux and buffering, the result is an increase in free matrix Ca2+ due to an apparent reduction in Ca2+ buffering. This notion is further bolstered by the effect of ADP, which increased the rate of Ca2+ buffering, leading to a decrease in free matrix Ca2+ and a decrease in the availability of Ca2+ to bind and activate the CHE. Together with the observations of extra-matrix Ca2+ changes (Figure 1), the results of our study suggest that Ca2+ efflux rate via CHE is determined by more than just a Ca2+ or pH gradient and is modulated by Ca2+ buffering as well.
CsA decreased the rate of Ca2+ efflux, but to a lesser extent than ADP and without decreasing free matrix Ca2+ or increasing Ca2+ buffering. Although the underlying mechanism is unclear, that CsA decreased the Ca2+ efflux rate via diminished flickering of the mPTP pore cannot be excluded.
The CHE is encoded by the mitochondrial protein LETM1 (Jiang et al., 2009; Doonan et al., 2014; Tsai et al., 2014; Shao et al., 2016), although it was first identified as a KHE responsible for mitochondrial dysmorphism in patients with the Wolf-Hirschhorn syndrome (Nowikovsky et al., 2004). Questions exist regarding the assembly and stoichiometry of CHE formation and the mechanism by which LETM1 regulates mitochondrial Ca2+ and/or K+ flux. However, in vitro systems have established that LETM1 includes one or more EF-hands in its sequence and conducts its exchanger activity via the thermodynamically stable mechanism of driving Ca2+ transport using the H+ gradient in response to pH changes. Our study in isolated mitochondria suggests that in addition to changes in pH (Figure 6), the CHE is also modulated by total matrix Ca2+ (Figures 1–4). These observations receive support from whole-cell studies, where a transient knockdown of the putative CHE protein, LETM1, changed the dynamics of Ca2+ efflux in permeabilized H9c2 cells (Figure 8).
Our observations lead us to propose a novel three-way dynamic relationship between CHE activation, Ca2+ buffering and matrix Ca2+ whereby the activation of CHE depends on how much Ca2+ is accessible to bind to the CHE protein, either through changes in matrix free Ca2+ or buffered Ca2+ (Figure 9). According to this scheme, on the one hand, Ca2+ efflux via the CHE would increase under conditions where Ca2+ buffering decreases/fails or matrix steady-state free Ca2+ increases (for instance, due to increased Ca2+ uptake or reduced Ca2+ efflux via NCLX), leading to more Ca2+ to bind to CHE. On the other hand, processes that increase Ca2+ buffering or decrease the matrix free Ca2+ (through reduced Ca2+ uptake or greater efflux via NCLX) would decrease Ca2+ efflux via the CHE by making less Ca2+ accessible to bind to CHE. Such a scheme would explain the effect of ADP on the Ca2+ efflux rate. Under conditions where matrix Ca2+ is maintained at a steady state, if ADP sequesters more Ca2+, less free Ca2+ would be available to bind to CHE, leading to decreased activity of the exchanger and subsequently, reduced Ca2+ efflux. The reverse would be true when, at near buffering capacity, less Ca2+ would be buffered and more Ca2+ would be available to bind to CHE and increase the rate of Ca2+ efflux. Additional experiments would be needed to confirm this notion.
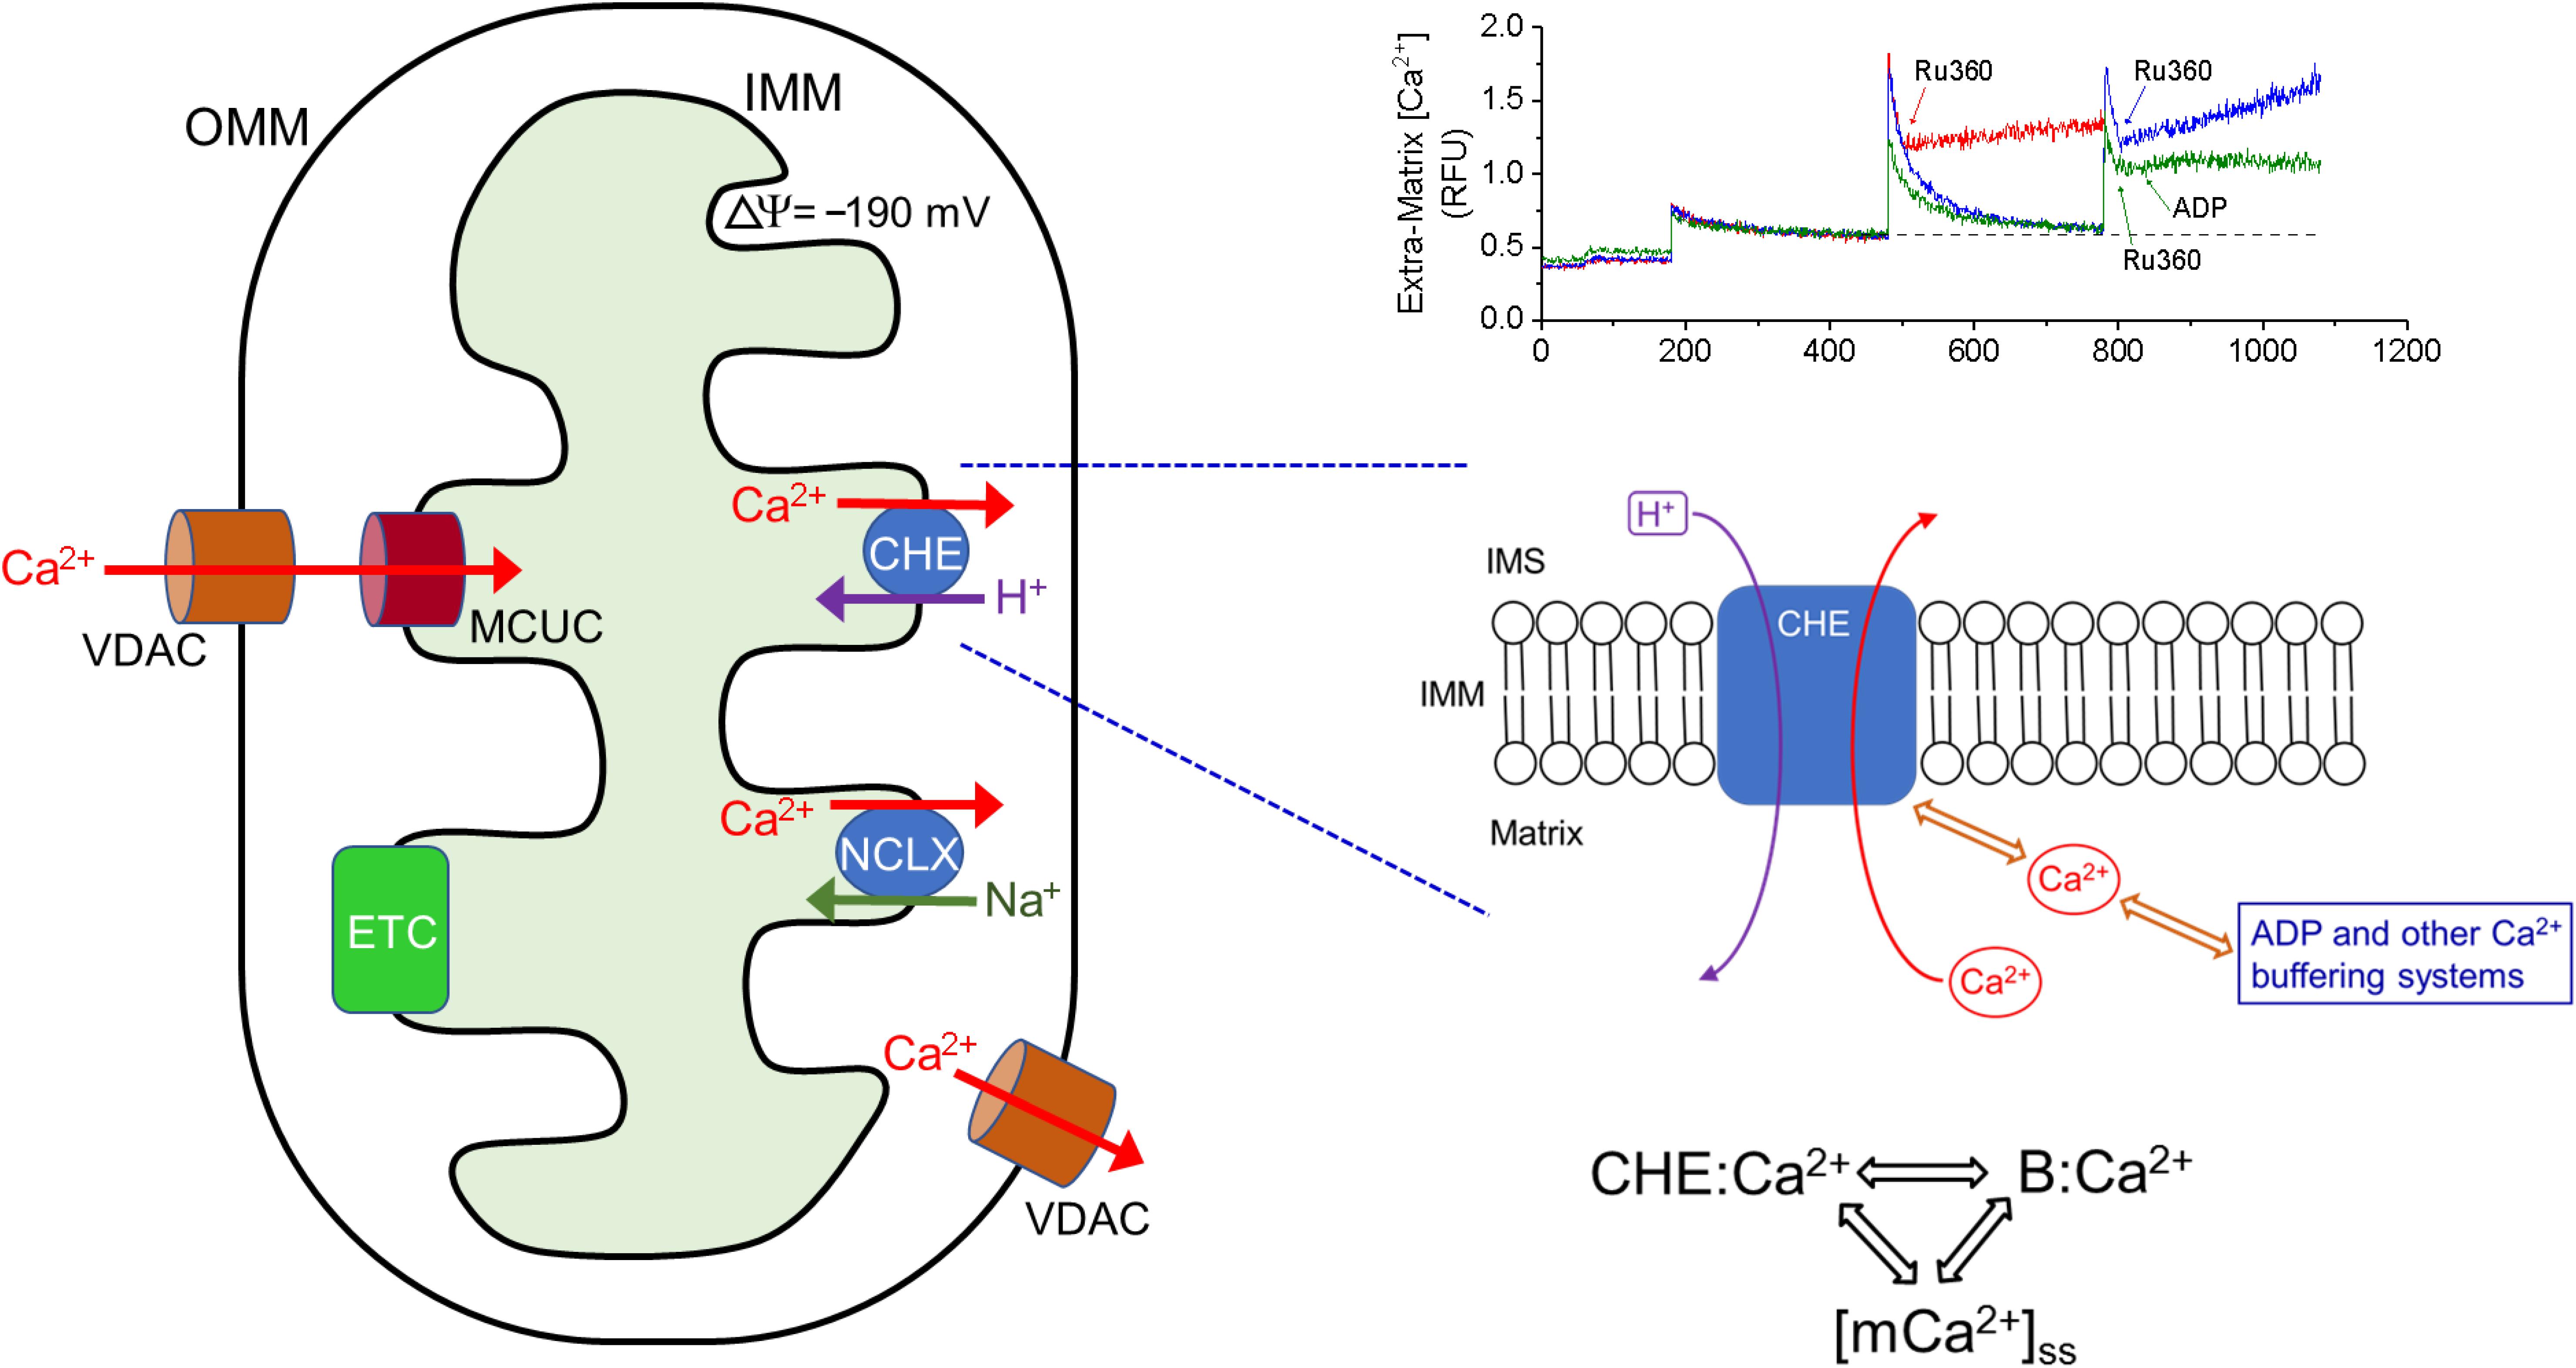
Figure 9. Ca2+ efflux via CHE is sensitive to total matrix Ca2+. Left: Representation of the principal influx and efflux pathways of mitochondrial Ca2+. OMM: Outer Mitochondrial Membrane, VDAC: Voltage-Dependent Anion Channel, IMM: Inner Mitochondrial Membrane, ETC: Electron Transport Chain, MCUC: Mitochondrial Calcium Uniporter Complex, NCLX: Na+-Ca2+-Li3+-Exchanger, CHE: Ca2+/H+ Exchanger. Bottom Right: Proposed scheme for the activation of CHE by total matrix Ca2+. Ca2+ efflux rate via CHE activation may be modulated by both the free steady-state matrix Ca2+ and by the amount of Ca2+ bound to other matrix buffering agents. By this scheme, the rate of Ca2+ efflux via CHE will increase as steady state matrix Ca2+ increases or when buffering capacity is exceeded. CHE:Ca2+ denotes Ca2+ bound to the CHE protein, B:Ca2+ denotes Ca2+ bound to matrix buffering agents such as ADP, [mCa2+]ss denotes steady-state matrix free Ca2+ concentration. Top Right: Superimposed traces of extra-matrix Ca2+, adapted from Figure 1A, showing the different rates of Ca2+ efflux, when Ru360 is applied after addition of one Ca2+ bolus (red) or two CaCl2 boluses (blue) or two CaCl2 boluses and addition of ADP 20 s after Ru360 (green). In all three cases, the starting baseline Ca2+ was the same and the applied CaCl2 bolus was the same.
It is also to be noted that in our study, which uses mitochondria from rat heart, ADP is more effective in delaying mPTP opening, whereas Mishra et al. (2019) reported a significantly greater effect of CsA in delaying mPTP opening compared to ADP in mitochondria from guinea pig heart. The species-specific modulation of Ca2+ buffering and delay in mPTP opening by CsA and ADP suggests that, the mechanisms that regulate CHE activity will also be similarly impacted by tissue-specific and species-specific differences.
Acidic buffer pH (between 6.8 and 6.9 pH units) depolarized the IMM and increased the rate of Ca2+ efflux (Figures 6, 7). In experiments, where HCl was added before Ru360, a small increase in Ca2+ was evoked by acidic pH change (Figure 6B, red trace), which may be attributed to the aggregate of a decreased affinity of EGTA as well as the dye for Ca2+ in acidic pH (Lattanzio, 1990). This is followed by a modest Ca2+ uptake (Figure 6B, red trace), during which the membrane potential gradually depolarizes (Figure 7, pink trace, from 840 to 1200 s). As the membrane potential settles to a new depolarized value, there is no more uptake and the extra-matrix Ca2+ attains a steady-state. Alkaline buffer pH (between 7.4 and 7.5 pH units), on the other hand, did not have an effect, which may be attributed to the fact that the extra-matrix pH was similar to previously reported values of matrix pH (∼ 7.6) (Poburko et al., 2011), so that there is a negligible pH gradient across the IMM. On the other hand, the increase in Ca2+ efflux and membrane depolarization in acidic buffer pH is consistent with other reports that CHE activity is powered by the dissipation of cross-matrix pH gradient generated by the electron transport chain (Brand, 1985; Tsai et al., 2014; Shao et al., 2016; Haumann et al., 2019). It suggests the possibility that CHE activity may not be electroneutral, as is generally accepted and has been suggested by previous studies (Pozzan et al., 1977; Brand, 1985; Tsai et al., 2014). However, it is also possible that the depolarization induced by acidic buffer pH may involve other pH-dependent mechanisms that have not been the focus of this study and need to be explored in future studies. Nevertheless, the finding that acidic extra-matrix pH increases the rate of Ca2+ efflux via the CHE, indicates that under ischemic conditions, cardiac mitochondrial CHE may play a role in Ca2+ efflux to avoid mitochondrial Ca2+ overloading (Haumann et al., 2010). The reported higher expression of the CHE protein in cardiac mitochondria compared to hepatic mitochondria may reflect a reserve capacity under pathophysiological conditions.
The current study shows that the CHE activity is stimulated in response to two triggers: (1) a pH gradient across the IMM and (2) changes in matrix Ca2+, including matrix free Ca2+ and Ca2+ buffering. The results point to a previously unattributed unique involvement of CHE with the Ca2+ handling capacity of mitochondria. Understanding how CHE activity is associated with mitochondrial Ca2+ handling will have implications for pathophysiological conditions such as ischemia/reperfusion injury.
All datasets generated for this study are included in the article/Supplementary Material.
The animal study was reviewed and approved by the Medical College of Wisconsin Institutional Animal Care and Use Committee.
W-MK, AC, and LG designed the initial study. LG, GN, and JM performed the experiments, analyzed the data, and prepared the figures. LG, GN, JM, DS, AC, and W-MK were involved in critical interpretation and discussion of the results, and wrote and edited the manuscript. All authors have read and approved the final version of the manuscript.
Funding for this work was provided, in part, by NIH R01 HL131673 and NHLBI Training Grant T35 HL072483.
The authors declare that the research was conducted in the absence of any commercial or financial relationships that could be construed as a potential conflict of interest.
We kindly acknowledge James Heisner for technical assistance.
The Supplementary Material for this article can be found online at: https://www.frontiersin.org/articles/10.3389/fphys.2020.510600/full#supplementary-material
Agarwal, B., Camara, A. K. S., Stowe, D. F., Bosnjak, Z. J., and Dash, R. K. (2012). Enhanced charge-independent mitochondrial free Ca2+ and attenuated ADP-induced NADH oxidation by isoflurane: implications for cardioprotection. Biochim. Biophys. Acta 1817, 453–465. doi: 10.1016/j.bbabio.2011.11.011
Altschafl, B. A., Beutner, G., Sharma, V. K., Sheu, S.-S., and Valdivia, H. H. (2007). The mitochondrial ryanodine receptor in rat heart: a pharmaco-kinetic profile. Biochim. Biophys. Acta 1768, 1784–1795. doi: 10.1016/j.bbamem.2007.04.011
Austin, S., and Nowikovsky, K. (2019). LETM1: essential for Mitochondrial Biology and Cation Homeostasis? Trends Biochem. Sci. 44, 648–658. doi: 10.1016/j.tibs.2019.04.002
Austin, S., Tavakoli, M., Pfeiffer, C., Seifert, J., Mattarei, A., De Stefani, D., et al. (2017). LETM1-mediated K+ and Na+ homeostasis regulates mitochondrial Ca2+ efflux. Front. Physiol. 8:839. doi: 10.3389/fphys.2017.00839
Baughman, J. M., Perocchi, F., Girgis, H. S., Plovanich, M., Belcher-Timme, C. A., Sancak, Y., et al. (2011). Integrative genomics identifies MCU as an essential component of the mitochondrial calcium uniporter. Nature 476, 341–345. doi: 10.1038/nature10234
Bernardi, P., and Azzone, G. F. (1983). Regulation of Ca2+ Efflux in Rat Liver Mitochondria. Eur. J. Biochem. 134, 377–383. doi: 10.1111/j.1432-1033.1983.tb07578.x
Beutner, G., Sharma, V. K., Lin, L., Ryu, S.-Y., Dirksen, R. T., and Sheu, S.-S. (2005). Type 1 ryanodine receptor in cardiac mitochondria: transducer of excitation–metabolism coupling. Biochim. Biophys. Acta 1717, 1–10. doi: 10.1016/j.bbamem.2005.09.016
Blomeyer, C. A., Bazil, J. N., Stowe, D. F., Dash, R. K., and Camara, A. K. S. (2016). Mg2+ differentially regulates two modes of mitochondrial Ca2+ uptake in isolated cardiac mitochondria: implications for mitochondrial Ca2+ sequestration. J. Bioenerg. Biomembr. 48, 175–188. doi: 10.1007/s10863-016-9644-9641
Blomeyer, C. A., Bazil, J. N., Stowe, D. F., Pradhan, R. K., Dash, R. K., and Camara, A. K. S. (2013). Dynamic buffering of mitochondrial Ca2+ during Ca2+ uptake and Na+-induced Ca2+ release. J. Bioenerg. Biomembr. 45, 189–202. doi: 10.1007/s10863-012-9483-9487
Boyman, L., Williams, G. S. B., Khananshvili, D., Sekler, I., and Lederer, W. J. (2013). NCLX: the Mitochondrial Sodium Calcium Exchanger. J. Mol. Cell Cardiol. 59, 205–213. doi: 10.1016/j.yjmcc.2013.03.012
Brand, M. D. (1985). Electroneutral efflux of Ca2+ from liver mitochondria. Biochem. J. 225, 413–419. doi: 10.1042/bj2250413
Camara, A. K. S., Zhou, Y., Wen, P.-C., Tajkhorshid, E., and Kwok, W.-M. (2017). Mitochondrial VDAC1: a key gatekeeper as potential therapeutic target. Front. Physiol. 8:460. doi: 10.3389/fphys.2017.00460
Crompton, M., Künzi, M., and Carafoli, E. (1977). The Calcium-Induced and Sodium-Induced Effluxes of Calcium from Heart Mitochondria. Eur. J. Biochem. 79, 549–558. doi: 10.1111/j.1432-1033.1977.tb11839.x
Csordás, G., Várnai, P., Golenár, T., Sheu, S.-S., and Hajnóczky, G. (2012). Calcium transport across the inner mitochondrial membrane: molecular mechanisms and pharmacology. Mol. Cell. Endocrinol. 353, 109–113. doi: 10.1016/j.mce.2011.11.011
De Stefani, D., Raffaello, A., Teardo, E., Szabò, I., and Rizzuto, R. (2011). A forty-kilodalton protein of the inner membrane is the mitochondrial calcium uniporter. Nature 476, 336–340. doi: 10.1038/nature10230
De Stefani, D., Rizzuto, R., and Pozzan, T. (2016). Enjoy the Trip: calcium in mitochondria back and forth. Annu. Rev. Biochem. 85, 161–192. doi: 10.1146/annurev-biochem-060614-34216
Doonan, P. J., Chandramoorthy, H. C., Hoffman, N. E., Zhang, X., Cárdenas, C., Shanmughapriya, S., et al. (2014). LETM1-dependent mitochondrial Ca2+ flux modulates cellular bioenergetics and proliferation. FASEB J. 28, 4936–4949. doi: 10.1096/fj.14-256453
Duchen, M. R. (2000). Mitochondria and calcium: from cell signalling to cell death. J. Physiol. 529, 57–68. doi: 10.1111/j.1469-7793.2000.00057.x
Fagerberg, L., Hallström, B. M., Oksvold, P., Kampf, C., Djureinovic, D., Odeberg, J., et al. (2014). Analysis of the human tissue-specific expression by genome-wide integration of transcriptomics and antibody-based proteomics. Mol. Cell. Proteom. 13, 397–406. doi: 10.1074/mcp.M113.035600
Finkel, T., Menazza, S., Holmström, K. M., Parks, R. J., Liu, J., Sun, J., et al. (2015). The Ins and Outs of Mitochondrial Calcium. Circ. Res. 116, 1810–1819. doi: 10.1161/CIRCRESAHA.116.305484
Fiskum, G., and Lehninger, A. L. (1979). Regulated release of Ca2+ from respiring mitochondria by Ca2+ /2H+ antiport. J. Biol. Chem. 254, 6236–6239.
Giorgi, C., Marchi, S., and Pinton, P. (2018). The machineries, regulation and cellular functions of mitochondrial calcium. Nat. Rev. Mol. Cell Biol. 19, 713–730. doi: 10.1038/s41580-018-0052-58
Gunter, T. E., Chace, J. H., Puskin, J. S., and Gunter, K. K. (1983). Mechanism of sodium independent calcium efflux from rat liver mitochondria. Biochemistry 22, 6341–6351. doi: 10.1021/bi00295a046
Gunter, T. E., and Pfeiffer, D. R. (1990). Mechanisms by which mitochondria transport calcium. Am. J. Physiol. 258, C755–C786. doi: 10.1152/ajpcell.1990.258.5.C755
Gunter, T. E., and Sheu, S.-S. (2009). Characteristics and possible functions of mitochondrial Ca2+ transport mechanisms. Biochim. Biophys. Acta 1787, 1291–1308. doi: 10.1016/j.bbabio.2008.12.011
Halestrap, A. P., Connern, C. P., Griffiths, E. J., and Kerr, P. M. (1997). Cyclosporin A binding to mitochondrial cyclophilin inhibits the permeability transition pore and protects hearts from ischaemia/reperfusion injury. Mol. Cell. Biochem. 174, 167–172. doi: 10.1007/978-1-4615-6111-8_25
Haumann, J., Camara, A. K. S., Gadicherla, A. K., Navarro, C. D., Boelens, A. D., Blomeyer, C. A., et al. (2019). Slow Ca2+ Efflux by Ca2+ /H+ Exchange in Cardiac Mitochondria Is Modulated by Ca2+ Re-uptake via MCU, Extra-Mitochondrial pH, and H+ Pumping by FOF1-ATPase. Front. Physiol. 9:1914. doi: 10.3389/fphys.2018.01914
Haumann, J., Dash, R. K., Stowe, D. F., Boelens, A. D., Beard, D. A., and Camara, A. K. S. (2010). Mitochondrial Free [Ca2+ ] Increases during ATP/ADP Antiport and ADP Phosphorylation: exploration of Mechanisms. Biophys. J. 99, 997–1006. doi: 10.1016/j.bpj.2010.04.069
Hausenloy, D., Boston-Griffiths, E., and Yellon, D. (2012). Cyclosporin A and cardioprotection: from investigative tool to therapeutic agent. Br. J. Pharmacol. 165, 1235–1245. doi: 10.1111/j.1476-5381.2011.01700.x
Huang, E., Qu, D., Huang, T., Rizzi, N., Boonying, W., Krolak, D., et al. (2017). PINK1-mediated phosphorylation of LETM1 regulates mitochondrial calcium transport and protects neurons against mitochondrial stress. Nat. Commun. 8, 1–11. doi: 10.1038/s41467-017-01435-1431
Huang, M., Camara, A. K. S., Stowe, D. F., Qi, F., and Beard, D. A. (2007). Mitochondrial Inner Membrane Electrophysiology Assessed by Rhodamine-123 Transport and Fluorescence. Ann. Biomed. Eng. 35, 1276–1285. doi: 10.1007/s10439-007-9265-9262
Hunter, J. C., Machikas, A. M., and Korzick, D. H. (2012). Age-dependent reductions in mitochondrial respiration are exacerbated by calcium in the female rat heart. Gender Med. 9, 197–206. doi: 10.1016/j.genm.2012.04.001
Jiang, D., Zhao, L., and Clapham, D. E. (2009). Genome-wide RNAi screen identifies Letm1 as a mitochondrial Ca2+ /H+ antiporter. Science 326, 144–147. doi: 10.1126/science.1175145
Jiang, D., Zhao, L., Clish, C. B., and Clapham, D. E. (2013). Letm1, the mitochondrial Ca2+ /H+ antiporter, is essential for normal glucose metabolism and alters brain function in Wolf-Hirschhorn syndrome. Proc. Natl. Acad. Sci. U.S.A. 110, E2249–E2254. doi: 10.1073/pnas.1308558110
Jurkowitz, M. S., and Brierley, G. P. (1982). H+-dependent efflux of Ca2+ from heart mitochondria. J. Bioenerg. Biomembr. 14, 435–449. doi: 10.1007/BF00743069
Kirichok, Y., Krapivinsky, G., and Clapham, D. E. (2004). The mitochondrial calcium uniporter is a highly selective ion channel. Nature 427, 360–364. doi: 10.1038/nature02246
Lattanzio, F. A. (1990). The effects of pH and temperature on fluorescent calcium indicators as determined with Chelex-100 and EDTA buffer systems. Biochem. Biophys. Res. Commun. 171, 102–108. doi: 10.1016/0006-291X(90)91362-V
Li, Y., Tran, Q., Shrestha, R., Piao, L., Park, S., Park, J., et al. (2019). LETM1 is required for mitochondrial homeostasis and cellular viability (Review). Mol. Med. Rep. 19, 3367–3375. doi: 10.3892/mmr.2019.10041
Lin, Q.-T., and Stathopulos, P. B. (2019). Molecular Mechanisms of Leucine Zipper EF-Hand Containing Transmembrane Protein-1 Function in Health and Disease. Int. J. Mol. Sci. 20:286. doi: 10.3390/ijms20020286
Liu, T. C.-Y., Tang, X.-M., Duan, R., Ma, L., Zhu, L., and Zhang, Q.-G. (2018). “The Mitochondrial Na+/Ca2+ Exchanger is Necessary but Not Sufficient for Ca2+ Homeostasis and Viability,” in Oxygen Transport to Tissue XL Advances in Experimental Medicine and Biology, eds O. Thews, J. C. LaManna, and D. K. Harrison (Cham: Springer International Publishing), 281–285. doi: 10.1007/978-3-319-91287-5_45
Luongo, T. S., Lambert, J. P., Gross, P., Nwokedi, M., Lombardi, A. A., Shanmughapriya, S., et al. (2017). The mitochondrial Na+/Ca2+ exchanger is essential for Ca2+ homeostasis and viability. Nature 545, 93–97. doi: 10.1038/nature22082
Madungwe, N. B., Zilberstein, N. F., Feng, Y., and Bopassa, J. C. (2016). Critical role of mitochondrial ROS is dependent on their site of production on the electron transport chain in ischemic heart. Am. J. Cardiovasc. Dis. 6, 93–108.
Matsuura, T. R., Bartos, J. A., Tsangaris, A., Shekar, K. C., Olson, M. D., Riess, M. L., et al. (2017). Early Effects of Prolonged Cardiac Arrest and Ischemic Postconditioning during Cardiopulmonary Resuscitation on Cardiac and Brain Mitochondrial Function in Pigs. Resuscitation 116, 8–15. doi: 10.1016/j.resuscitation.2017.03.033
Mishra, J., Davani, A. J., Natarajan, G. K., Kwok, W.-M., Stowe, D. F., and Camara, A. K. S. (2019). Cyclosporin A Increases Mitochondrial Buffering of Calcium: an Additional Mechanism in Delaying Mitochondrial Permeability Transition Pore Opening. Cells 8:1052. doi: 10.3390/cells8091052
Nicholls, D. G. (2005). Mitochondria and calcium signaling. Cell Calcium 38, 311–317. doi: 10.1016/j.ceca.2005.06.011
Nicholls, D. G., and Crompton, M. (1980). Mitochondrial calcium transport. FEBS Lett. 111, 261–268. doi: 10.1016/0014-5793(80)80806-80804
Nowikovsky, K., Froschauer, E. M., Zsurka, G., Samaj, J., Reipert, S., Kolisek, M., et al. (2004). The LETM1/YOL027 Gene Family Encodes a Factor of the Mitochondrial K+ Homeostasis with a Potential Role in the Wolf-Hirschhorn Syndrome. J. Biol. Chem. 279, 30307–30315. doi: 10.1074/jbc.M403607200
Nowikovsky, K., Pozzan, T., Rizzuto, R., Scorrano, L., and Bernardi, P. (2012). The Pathophysiology of LETM1. J. Gen. Physiol. 139, 445–454. doi: 10.1085/jgp.201110757
Palty, R., Silverman, W. F., Hershfinkel, M., Caporale, T., Sensi, S. L., Parnis, J., et al. (2010). NCLX is an essential component of mitochondrial Na+/Ca2+ exchange. Proc. Natl. Acad. Sci. U.S.A. 107, 436–441. doi: 10.1073/pnas.0908099107
Poburko, D., Santo-Domingo, J., and Demaurex, N. (2011). Dynamic Regulation of the Mitochondrial Proton Gradient during Cytosolic Calcium Elevations. J. Biol. Chem. 286, 11672–11684. doi: 10.1074/jbc.M110.159962
Pozzan, T., Bragadin, M., and Azzone, G. F. (1977). Disequilibrium between steady-state Ca2+ accumulation ratio and membrane potential in mitochondria. Pathway and role of Ca2+ efflux. Biochemistry 16, 5618–5625. doi: 10.1021/bi00644a036
Rizzuto, R., Bernardi, P., Favaron, M., and Azzone, G. F. (1987). Pathways for Ca2+ efflux in heart and liver mitochondria. Biochem. J. 246, 271–277. doi: 10.1042/bj2460271
Rizzuto, R., Bernardi, P., and Pozzan, T. (2000). Mitochondria as all-round players of the calcium game. J. Physiol. 529, 37–47. doi: 10.1111/j.1469-7793.2000.00037.x
Samanta, K., Mirams, G. R., and Parekh, A. B. (2018). Sequential forward and reverse transport of the Na+ Ca2+ exchanger generates Ca2+ oscillations within mitochondria. Nat. Commun. 9, 1–10. doi: 10.1038/s41467-017-02638-2632
Scaduto, R. C., and Grotyohann, L. W. (1999). Measurement of Mitochondrial Membrane Potential Using Fluorescent Rhodamine Derivatives. Biophys. J. 76, 469–477. doi: 10.1016/S0006-3495(99)77214-77210
Shao, J., Fu, Z., Ji, Y., Guan, X., Guo, S., Ding, Z., et al. (2016). Leucine zipper-EF-hand containing transmembrane protein 1 (LETM1) forms a Ca2+ /H+ antiporter. Sci. Rep. 6:34174. doi: 10.1038/srep34174
Sokolova, N., Pan, S., Provazza, S., Beutner, G., Vendelin, M., Birkedal, R., et al. (2013). ADP protects cardiac mitochondria under severe oxidative stress. PLoS One 8:e83214. doi: 10.1371/journal.pone.0083214
Starkov, A. A. (2010). The molecular identity of the mitochondrial Ca2+ sequestration system. FEBS J. 277, 3652–3663. doi: 10.1111/j.1742-4658.2010.07756.x
Takeuchi, A., Kim, B., and Matsuoka, S. (2015). The destiny of Ca2+ released by mitochondria. J. Physiol. Sci. 65, 11–24. doi: 10.1007/s12576-014-0326-327
Tan, W., and Colombini, M. (2007). VDAC closure increases calcium ion flux. Biochim. Biophys. Acta 1768, 2510–2515. doi: 10.1016/j.bbamem.2007.06.002
Tewari, S. G., Camara, A. K. S., Stowe, D. F., and Dash, R. K. (2014). Computational analysis of Ca2+ dynamics in isolated cardiac mitochondria predicts two distinct modes of Ca2+ uptake. J. Physiol. 592, 1917–1930. doi: 10.1113/jphysiol.2013.268847
Tsai, M.-F., Jiang, D., Zhao, L., Clapham, D., and Miller, C. (2014). Functional reconstitution of the mitochondrial Ca2+ /H+ antiporter Letm1. J. Gen. Physiol. 143, 67–73. doi: 10.1085/jgp.201311096
Uhlén, M., Björling, E., Agaton, C., Szigyarto, C. A.-K., Amini, B., Andersen, E., et al. (2005). A Human Protein Atlas for Normal and Cancer Tissues Based on Antibody Proteomics. Mol. Cell. Proteom. 4, 1920–1932. doi: 10.1074/mcp.M500279-MCP200
Keywords: CHE, Ca2+/H+ exchanger, LETM1, calcium retention capacity, total matrix Ca2+, cardiac mitochondria, pH gradient, Ca2+ efflux
Citation: Natarajan GK, Glait L, Mishra J, Stowe DF, Camara AKS and Kwok W-M (2020) Total Matrix Ca2+ Modulates Ca2+ Efflux via the Ca2+/H+ Exchanger in Cardiac Mitochondria. Front. Physiol. 11:510600. doi: 10.3389/fphys.2020.510600
Received: 07 November 2019; Accepted: 13 August 2020;
Published: 16 September 2020.
Edited by:
Gyorgy Hajnoczky, Thomas Jefferson University, United StatesReviewed by:
Shanmughapriya Santhanam, Penn State Milton S. Hershey Medical Center, United StatesCopyright © 2020 Natarajan, Glait, Mishra, Stowe, Camara and Kwok. This is an open-access article distributed under the terms of the Creative Commons Attribution License (CC BY). The use, distribution or reproduction in other forums is permitted, provided the original author(s) and the copyright owner(s) are credited and that the original publication in this journal is cited, in accordance with accepted academic practice. No use, distribution or reproduction is permitted which does not comply with these terms.
*Correspondence: Wai-Meng Kwok, d21rd29rQG1jdy5lZHU=
†These authors have contributed equally to this work
‡Present address: Lyall Glait, Department of Medicine, University of Illinois at Chicago, Chicago, IL, United States
Disclaimer: All claims expressed in this article are solely those of the authors and do not necessarily represent those of their affiliated organizations, or those of the publisher, the editors and the reviewers. Any product that may be evaluated in this article or claim that may be made by its manufacturer is not guaranteed or endorsed by the publisher.
Research integrity at Frontiers
Learn more about the work of our research integrity team to safeguard the quality of each article we publish.