 Dong Jia
 Xue-Lian Li
 Gang Hou
 Xiao-Ming Zhou
94% of researchers rate our articles as excellent or good
Learn more about the work of our research integrity team to safeguard the quality of each article we publish.
Find out more
ORIGINAL RESEARCH article
Front. Physiol. , 30 April 2020
Sec. Computational Physiology and Medicine
Volume 11 - 2020 | https://doi.org/10.3389/fphys.2020.00420
The aim of this study was to build a formula to predict short-term prognosis using main pulmonary artery (MPA) parameters reconstructed from computed tomographic pulmonary angiography in non-high-risk acute pulmonary embolism (PE) patients. After reconstructing the MPA and its centerline, the MPA, the right and left pulmonary artery inlet, and the MPA outlet plane were differentiated to measure the cross-sectional area (CSA), the maximal diameter and the hydraulic diameter. The MPA bifurcation area, volume and angle were measured. MPA dilation was defined as >29 mm at the transverse section plane. The patients were randomly divided into a training set and a validation set. A least absolute shrinkage and selection operator (LASSO) logistic regression algorithm was used to build a predictive formula. The performances of the predictive formula from LASSO were tested by the area under the receiver operating characteristic curve (AUC) and precision-recall (PR) curve with 10-fold cross-validation. The clinical utility was assessed by decision curve analysis (DCA). In total, 296 patients were enrolled and randomly divided (50:50) into a training set and a validation set. The LASSO predictive formula (lambda.1SE) was as follows: 0.92 × MPA bifurcation area + 0.50 × MPA outlet hydraulic diameter + 0.10 × MPA outlet CSA. The AUCs of the predictive formula were 0.860 (95% CI: 0.795–0.912) and 0.943 (95% CI: 0.892–0.975) in the training set and validation set, respectively. The LASSO predictive formula had a higher average area under the PR curve than MPA dilation (0.71 vs. 0.23 in the training set and 0.55 vs. 0.23 in the validation set) and added a net benefit in clinical utility by DCA. Integration of MPA outlet CSA, hydraulic diameter, and bifurcation area with the LASSO predictive formula as a novel weighting method facilitated the prediction of poor short-term prognosis within 30 days after hospital admission in non-high-risk acute PE patients.
- Identifying non-high-risk acute PE patients with a poor short-term prognosis is an effective method to decrease mortality.
- MPA size evaluated by computed tomographic pulmonary angiography is a potential predictor for short-term prognosis, but the predictive ability is limited at the transverse section.
- Further analysis of the MPA size by measuring the MPA outlet hydraulic diameter, the outlet CSA and the main pulmonary bifurcation area could facilitate the prediction of poor short-term prognosis in non-high-risk acute PE patients.
- There were good discrimination abilities after building a predictive formula by the correlative parameters together with MPA dilation in the training set and the validation set (area under the receiver operating characteristic curve: 0.860, 95% CI: 0.795–0912 vs. 0.943, 95% CI: 0.892–0.975; PR curve: 0.71 vs. 0.23 and 0.55 vs. 0.23, respectively). The predictive formula also added a net benefit in clinical utility.
The high-risk group of acute pulmonary artery (PE) patients exhibits greater than 50% mortality with identifiable hypotension characteristics. Reperfusion treatment is essential for treating high-risk acute PE patients (Cok et al., 2013). However, the mortality of non-high-risk acute PE patients who are hemodynamically stable remains at 1–10% in the short term (Becattini et al., 2014). Furthermore, identifying non-high-risk acute PE patients with a poor short-term prognosis is difficult but is an effective method to decrease mortality (Konstantinides et al., 2014).
Currently, there are different strategies for predicting the short prognosis of non-high-risk acute PE patients, such as simplified pulmonary embolism severity (s-PESI), which is useful for the identification of low-risk patients (Lankeit, 2017), and Bova scores, which are reported to miss the diagnosis of some adverse events in short-term follow-up (Fernandez et al., 2015). Computed tomography pulmonary angiography (CTPA) may be a way to improve a prediction. However, the parameters are numerous and miscellaneous. The elevated right ventricular overload caused by pulmonary hypertension (PH) is the main cause of poor short-term prognosis (Lagos-Carvajal et al., 2015). Mechanical obstruction, the release of inflammatory factors and reflex hypoxemia are all involved in the pathophysiology of acute PE (Aviram et al., 2016; Jia et al., 2017). The main pulmonary artery (MPA) cannot react to inflammation and hypoxemia but reflects total PH severity due to its high sensitivity to pressure (Aviram et al., 2011). MPA size evaluated by CTPA (Aviram et al., 2015) is considered a potential predictor of short-term prognosis (Gutte et al., 2017; Beenen et al., 2018). However, there is controversy regarding the short-term prognosis and the MPA size as evaluated by MPA trunk dilation at the transverse section (Seon et al., 2011; Oz et al., 2015; Beenen et al., 2018). At the transverse plane, measurement of the MPA diameter does not represent the MPA size due to tissue compression and good resilience and flexibility of the MPA (Malhotra et al., 2016). Therefore, evaluating only definitional MPA may be insufficient for predicting short-term prognosis. Under PH, the MPA cross-sectional area (CSA), diameters and the sharpness of MPA inevitably change; the MPA bifurcation section is stable and not overly influenced by the cardiac cycle (Schievano et al., 2011), which may be a novel but stable predictor of acute PE short-term prognosis. We propose that evaluating the MPA CSA, hydraulic diameter, maximal diameter and MPA bifurcation size on CTPA may be a superior method of predicting short-term prognosis. To validate this hypothesis, a predictive formula was developed for predicting short-term prognosis at 30 days; internal validation was used to confirm the stabilization of the predictive formula (Moons et al., 2015).
This retrospective study was conducted at two research centers (Shengjing Hospital of China Medical University and First Hospital of China Medical University) between May 2014 and Oct 2018. Data from 391 non-high-risk acute PE patients (systolic blood pressure ≥90 mmHg, a systolic pressure drop by <40 mmHg and a systolic pressure drop ≥40 mmHg for ≤15 min) (Konstantinides et al., 2014) were initially collected. Patients who were ≥18 years of age and diagnosed with acute PE by CTPA were included. In total, 95 patients were excluded according to the following exclusion criteria: (1) 17 patients lacked CTPA data; (2) 5 patients received reperfusion therapy before CTPA; (3) 10 patients had cor pulmonale; (4) 2 patients had a malignancy; (5) 13 patients had a previous clear diagnosis of heart failure; (6) 2 patients were pregnant; and (7) 46 patients were without echocardiography, cardiac troponin I (cTnI), N-terminal pro-brain natriuretic peptide (NT-pro BNP) or echocardiography. After further screening, 296 patients were ultimately enrolled (see Figure 1).
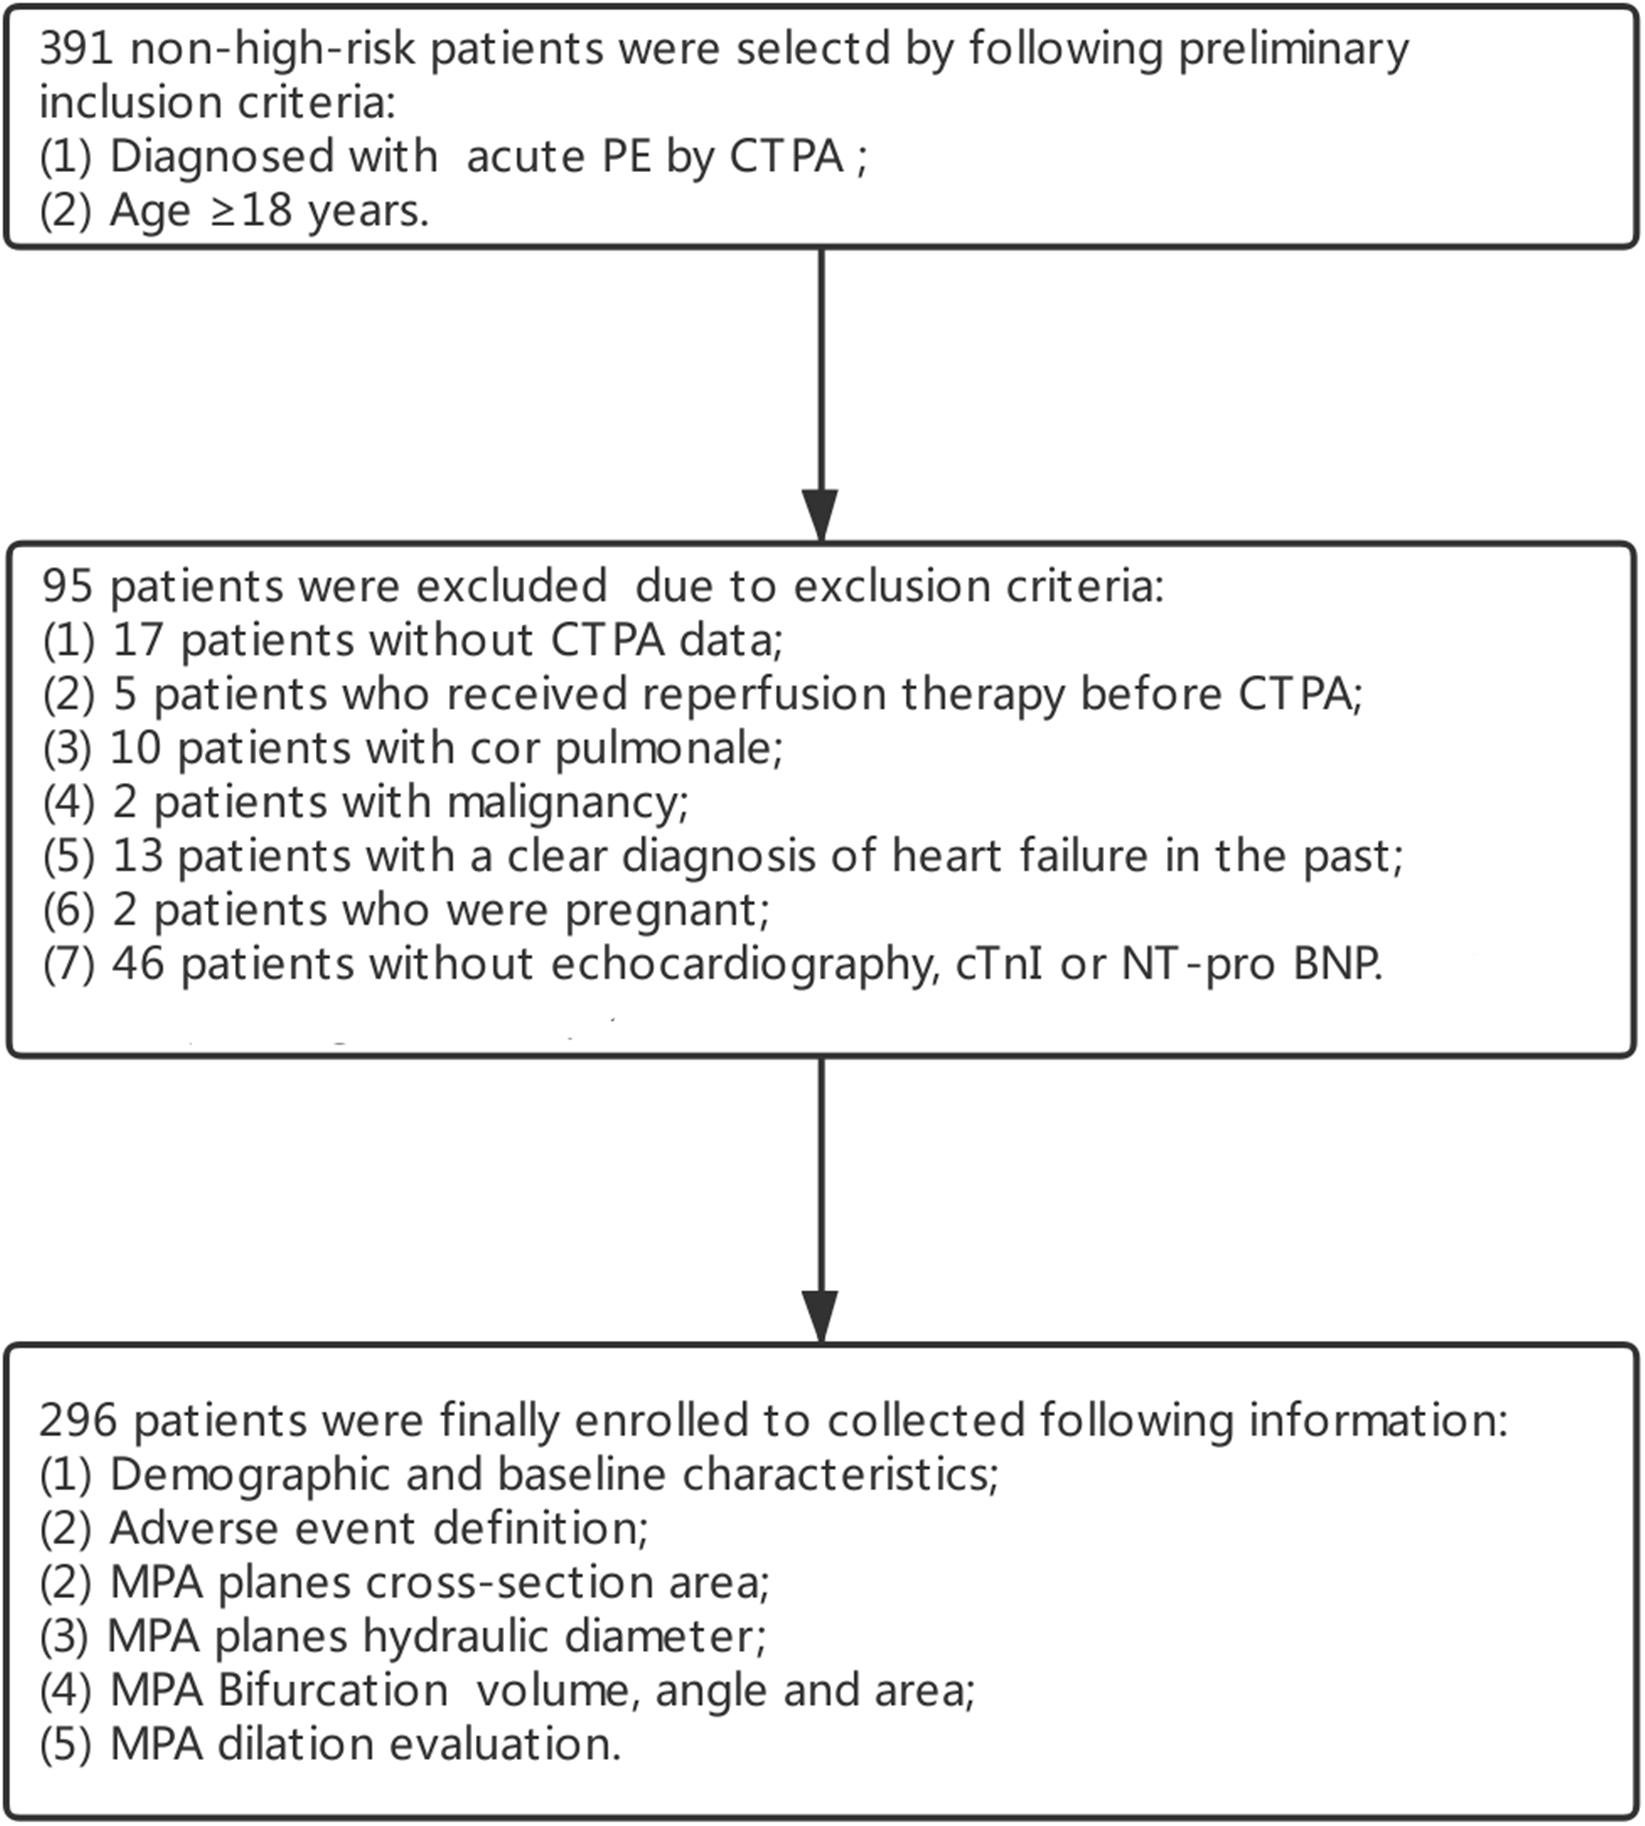
Figure 1. Flow chart of patient inclusion and exclusion.
The enrolled patients were randomly divided (50:50) into a training set and a validation set (see Figure 2). To identify a standard short-term prognosis, adverse events were determined within 30 days after admission to the hospital. Adverse events (+) were defined as the occurrence of one of the following events: death; cardiopulmonary resuscitation; endotracheal intubation; vasopressor requirement for systemic hypotension (more than 5 μg per kilogram); or reperfusion treatment to save the patient’s life (Hariharan et al., 2016). Patients without the events listed above were classified as adverse events (−). Adverse events (+)/(−) were used for grouping.
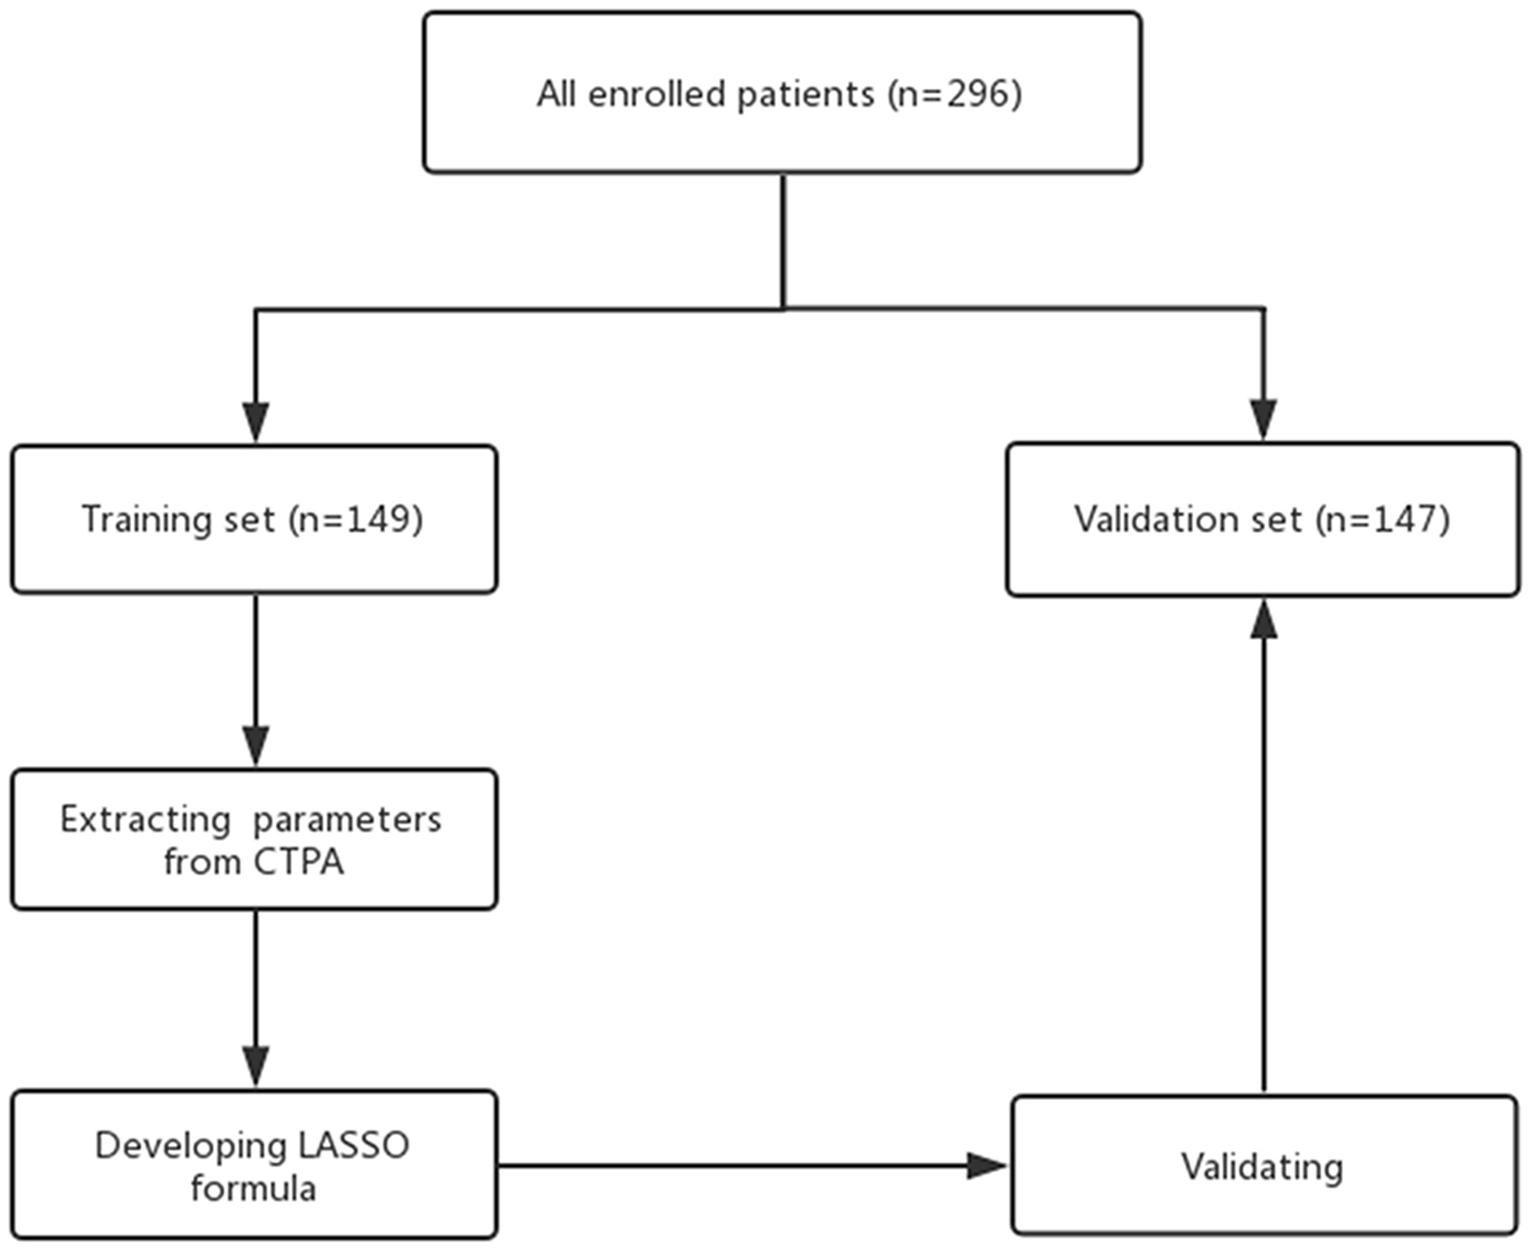
Figure 2. Flow chart of the validation process.
All enrolled patients were divided into the intermediate-high-risk group, intermediate-low-risk group and low-risk group by right ventricular dysfunction (RVD) by echocardiography, cTnI and NT-pro BNP (Konstantinides et al., 2014). cTnI > 0.04 μg/l (normal range 0 ∼ 0.04 μg/l) was defined as cTnI (+); otherwise, patients were classified as cTnI (−) (Binder et al., 2005). NT-pro BNP (+) was defined as NT-pro BNP ≥ 600 pg/ml (normal range ≤300 pg/ml); otherwise, patients were classified as NT-pro BNP (−) (Konstantinides et al., 2014).
Computed tomography pulmonary angiography (CTPA) was performed using a 64 detector-row scanner (Aquilion KV-120; Toshiba Medical Systems Corporation). The parameters were as follows: 380 mA; 120 kV; and a 1-mm reconstruction section thickness from the thoracic inlet to the upper abdomen. An iodinated non-ionic contrast agent (100 ml) was injected into the antecubital vein at a rate of 4 ml/s with an automatic dual-tube high-pressure injector (Ulrich REF XD 2051, Ulrich Medical GmbH).
Main pulmonary artery parameters were reconstructed and measured using Mimics Medical software (version 19.0, Mimics Medical software). The detail procedure was shown in Supplementary Videos 1, 2. The centerline was determined based on the reconstructed MPA. Measurement planes were selected perpendicular to the centerline as follows: MPA inlet plane; MPA outlet plane; right pulmonary artery (RPA) inlet plane; and left pulmonary artery (LPA) inlet plane. The method of selecting planes was described by Schievano et al. (2011). At the four selected planes, the CSA, hydraulic diameter and maximal diameter were measured perpendicular to the long-axis of the pulmonary artery (Choi et al., 2015). The hydraulic diameter was measured as 4 × (CSA)/(circumference of the cross section), referring to the study by Louis et al. (2013). In addition, MPA dilation was evaluated by measuring the MPA diameter at the transverse section plane (dichotomized at 29 mm as baseline) and was defined as (+)/(−), referring to the study by Beenen et al. (2018). The MPA bifurcation section, which is defined as the MPA outlet plane and the RPA and LPA inlet planes, is stable across different cardiac cycles (Schievano et al., 2011). The volume of this section was measured and recorded as the MPA bifurcation volume. The area of the three plane linked center points on the centerline was calculated at two dimensions and recorded as the MPA bifurcation area (Das et al., 2015). The angle of the triangle of linked center points toward the MPA was calculated and recorded as the MPA bifurcation angle (see Figures 3A–G).
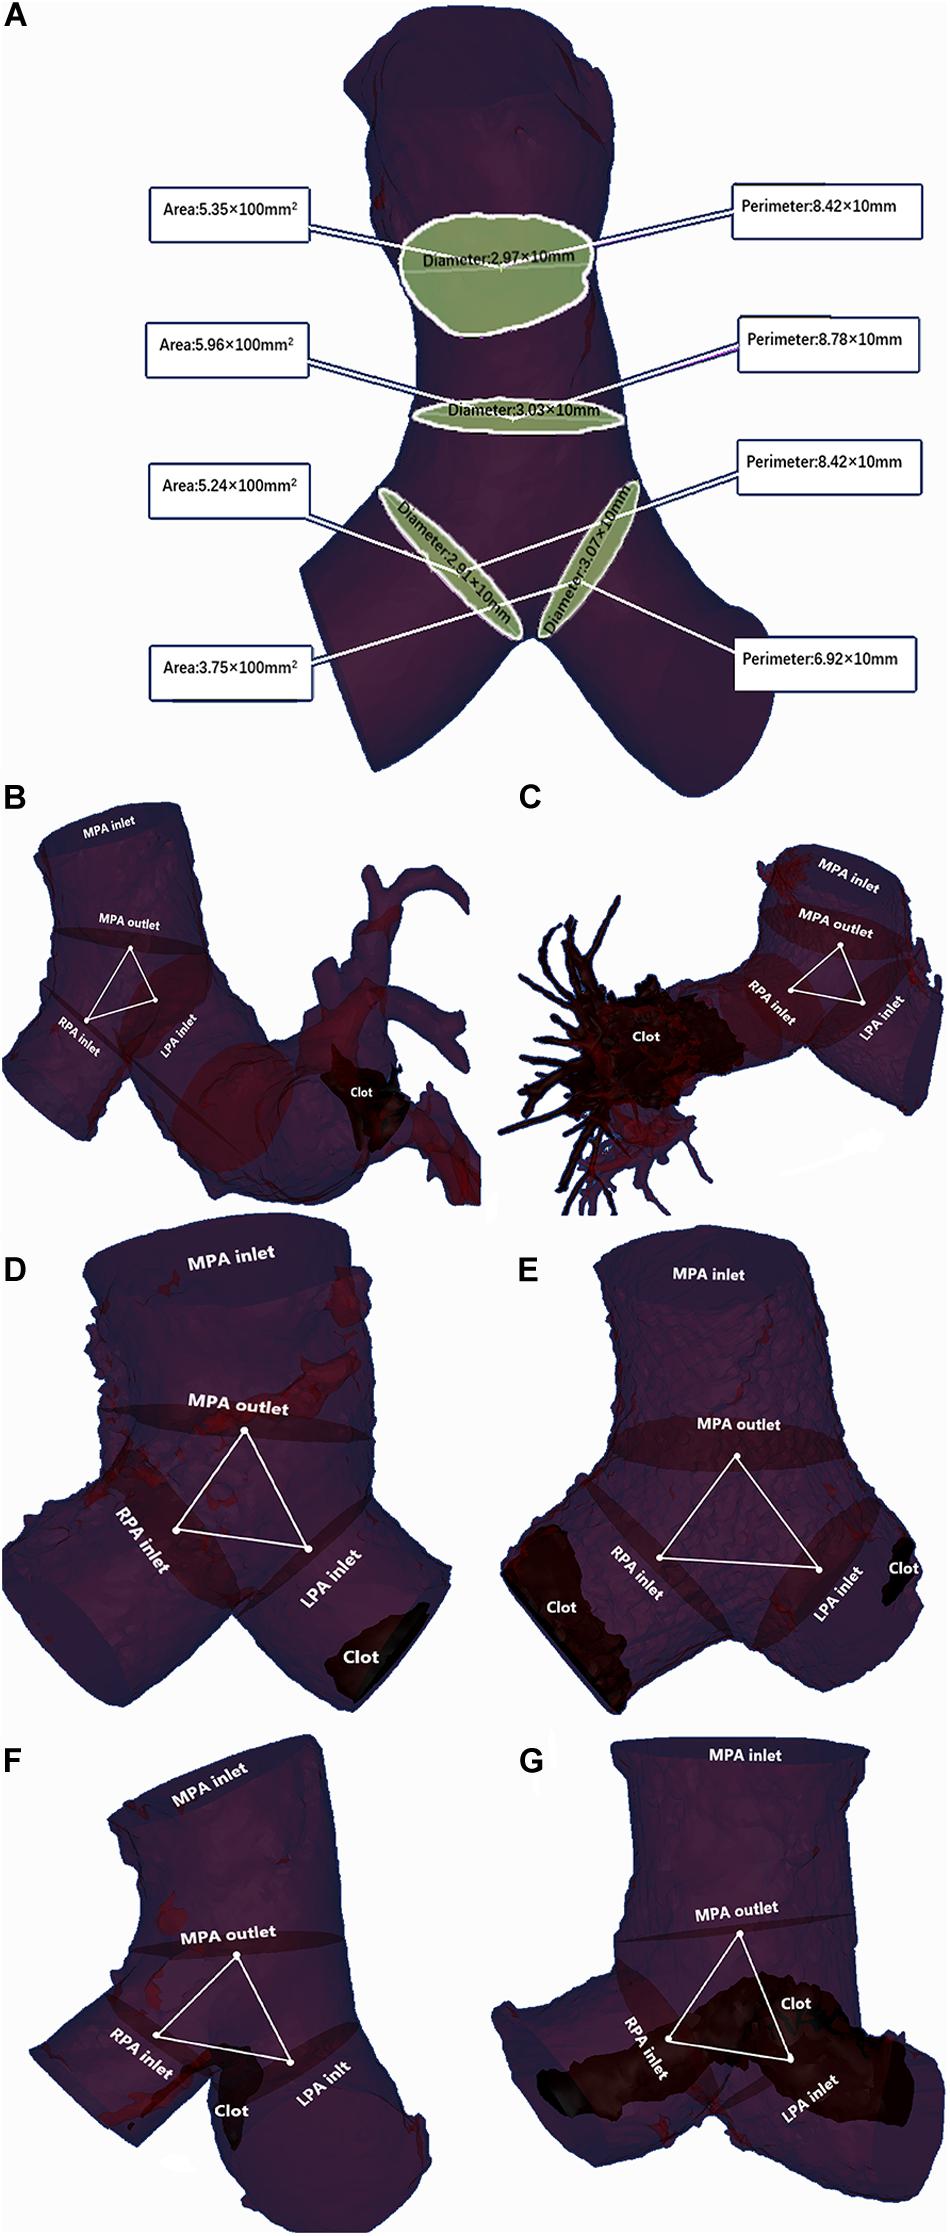
Figure 3. Two examples of MPA parameter measurements. (A) The area, perimeter and maximal diameter were measured at the MPA inlet plane, MPA outlet plane, RPA inlet plane and LPA inlet plane. The hydraulic diameter was calculated as the ratio of area to the perimeter of the corresponding plane. (B) A 48-year-old female without adverse events and with a clot in the peripheral pulmonary artery: MPA inlet CSA = 6.37 × 100 mm2; MPA outlet CSA = 7.68 × 100 mm2; LPA inlet CSA = 3.52 × 100 mm2; RPA inlet CSA = 3.31 × 100 mm2; MPA inlet maximal diameter = 1.97 × 10 mm; MPA outlet maximal diameter = 2.04 × 10 mm; LPA inlet maximal diameter = 3.01 × 10 mm; RPA inlet maximal diameter = 1.62 × 10 mm; MPA inlet hydraulic diameter = 2.86 × 10 mm; MPA outlet hydraulic diameter = 2.94 × 10 mm; LPA inlet hydraulic diameter = 2.04 × 10 mm; RPA inlet hydraulic diameter = 1.97 × 10 mm; MPA bifurcation area = 0.84 × 100 mm2; MPA bifurcation angle = 168.35°; MPA bifurcation volume = 9.21 × 1000 mm3. The LASSO formula score = 3.01. (C) A 59-year-old female with adverse events and a clot in the peripheral pulmonary artery: MPA inlet CSA = 11.79 × 100 mm2; MPA outlet CSA = 13.04 × 100 mm2; LPA CSA = 6.09 × 100 mm2; RPA inlet CSA = 7.56 × 100 mm2; MPA inlet maximal diameter = 3.11 × 10 mm; MPA outlet maximal diameter = 3.45 × 10 mm; LPA inlet maximal diameter = 2.48 × 10 mm; RPA inlet maximal diameter = 2.66 × 10 mm; MPA inlet hydraulic diameter = 2.71 × 10 mm; MPA outlet hydraulic diameter = 3.40 × 10 mm; LPA inlet hydraulic diameter = 2.23 × 10 mm; RPA inlet hydraulic diameter = 2.23 × 10 mm; MPA bifurcation area = 5.78 × 100 mm2; MPA bifurcation angle = 162.86°; MPA bifurcation volume = 19.53 × 1000 mm3. The LASSO formula score = 8.32. (D) An 80-year-old female without adverse events and with a clot in the MPA: MPA inlet CSA = 6.72 × 100 mm2; MPA outlet CSA = 6.74 × 100 mm2; LPA inlet CSA = 4.59 × 100 mm2; RPA inlet CSA = 4.63 × 100 mm2; MPA inlet maximal diameter = 2.43 × 10 mm; MPA outlet maximal diameter = 2.58 × 10 mm; LPA inlet maximal diameter = 2.06 × 10 mm; RPA inlet maximal diameter = 2.00 × 10 mm; MPA inlet hydraulic diameter = 2.80 × 10 mm; MPA outlet hydraulic diameter = 2.88 × 10 mm; LPA inlet hydraulic diameter = 2.27 × 10 mm; RPA inlet hydraulic diameter = 2.42 × 10 mm; MPA bifurcation area = 0.79 × 100 mm2; MPA bifurcation angle = 131.70°; MPA bifurcation volume = 9.69 × 1000 mm3. The LASSO formula score = 2.84. (E) An 80-year-old female with adverse events and a clot in the MPA: MPA inlet CSA = 12.86 × 100 mm2; MPA outlet CSA = 15.04 × 100 mm2; LPA CSA = 6.60 × 100 mm2; RPA inlet CSA = 6.95 × 100 mm2; MPA inlet maximal diameter = 3.76 × 10 mm; MPA outlet maximal diameter = 4.19 × 10 mm; LPA inlet maximal diameter = 2.56 × 10 mm; RPA inlet maximal diameter = 2.85 × 10 mm; MPA inlet hydraulic diameter = 3.67 × 10 mm; MPA outlet hydraulic diameter = 4.15 × 10 mm; LPA inlet hydraulic diameter = 2.80 × 10 mm; RPA inlet hydraulic diameter = 2.77 × 10 mm; MPA bifurcation area = 4.07 × 100 mm2; MPA bifurcation angle = 172.35°; MPA bifurcation volume = 40.93 × 1,000 mm3. The LASSO formula score = 7.32. (F) A 49-year-old male without adverse events and with a saddle clot: MPA inlet CSA = 8.19 × 100 mm2; MPA outlet CSA = 9.34 × 100 mm2; LPA inlet CSA = 5.64 × 100 mm2; RPA inlet CSA = 5.62 × 100 mm2; MPA inlet maximal diameter = 2.88 × 10 mm; MPA outlet maximal diameter = 2.86 × 10 mm; LPA inlet maximal diameter = 2.21 × 10 mm; RPA inlet maximal diameter = 2.70 × 10 mm; MPA inlet hydraulic diameter = 2.66 × 10 mm; MPA outlet hydraulic diameter = 2.76 × 10 mm; LPA inlet hydraulic diameter = 2.21 × 10 mm; RPA inlet hydraulic diameter = 2.59 × 10 mm; MPA bifurcation area = 0.88 × 100 mm2; MPA bifurcation angle = 165.11°; MPA bifurcation volume = 16.7 × 1000 mm3. The LASSO formula scores = 3.12. (G) A 69-year-old female with adverse events and a saddle clot: MPA inlet CSA = 85.41 × 100 mm2; MPA outlet CSA = 11.72 × 100 mm2; LPA CSA = 45.43 × 100 mm2; RPA inlet CSA = 46.89 × 100 mm2; MPA inlet maximal diameter = 3.17 × 10 mm; MPA outlet maximal diameter = 3.69 × 10 mm; LPA inlet maximal diameter = 2.16 × 10 mm; RPA inlet maximal diameter = 2.40 × 10 mm; MPA inlet hydraulic diameter = 3.11 × 10 mm; MPA outlet hydraulic diameter = 3.45 × 10 mm; LPA inlet hydraulic diameter = 2.31 × 10 mm; RPA inlet hydraulic diameter = 2.52 × 10 mm; MPA bifurcation area = 5.57 × 100 mm2; MPA bifurcation angle = 160.06°; MPA bifurcation volume = 13.20 × 1,000 mm3. The LASSO formula score = 8.02.
Quantitative variables with normal distributions were expressed as the means ± standard deviations (SDs), and differences were analyzed with Student’s t-test. Patient sex was expressed as a categorical variable (male/female), and differences were analyzed with the χ2 test in a univariate analysis. The histogram was used to exhibit the distribution plots of quantitative variables. First, the sample was randomly divided (50:50). The least absolute shrinkage and selection operator (LASSO) logistic regression algorithm, which is suitable for the regression of high-dimensional data and interactive data analysis (Wu et al., 2017), was conducted by 10-fold cross-validation with penalty parameter tuning based on minimum criteria and 1 standard error of the minimum criteria (the 1-SE criteria) in the training set. With the LASSO method, coefficients of unimportant variables are dropped to zero, while important variables are retained to reduce the overfitting (Zhang and Hong, 2017). A formula with scores as the predictability was developed using selected features that were weighted by their respective LASSO coefficients to predict the endpoint in the training set. The predictive ability of the formula was also calculated in the validation set. The receiver operating characteristic (ROC) curve analysis was conducted to further evaluate the predictive performance of the formula score for predicting the adverse events of the non-high-risk PE patients and for determining the optimal cut-off based on the Youden index (Hanley and McNeil, 1982). Performance abilities of the models for predicting adverse events were compared by calculating the area under the ROC curve (ROC-AUC). The difference in predictive ability between the predictive formula and MPA dilation based on the ROC-AUC was determined using the DeLong test (DeLong et al., 1988). Due to the low morbidity of the adverse events in the non-high-risk PE population, a precision-recall (PR) curve with 10-fold cross-validation was also conducted to evaluate the predictability of the model (Feng et al., 2019). Decision curve analysis (DCA) was calculated to evaluate clinical usefulness by quantifying the net benefits in two sets (Wu et al., 2017). A value of p < 0.05 was considered significant. The statistical analysis was performed with R software version 3.3.21 and MedCalc statistical software (version 15.8, Belgium).
In total, 296 patients were enrolled after screening. The average age was 60.55 ± 14.46 years. A total of 34 patients (14 males/20 females) were considered adverse events (+) and were grouped into the adverse event (+) group, while 262 patients (118 males/144 females) were considered adverse events (−) and were grouped into the adverse events (−) group. The average ages of participants in the adverse events (+) and (−) groups were 59.23 ± 13.71 and 60.71 ± 14.57 years, respectively. MPA inlet CSA, outlet CSA, inlet hydraulic diameter, outlet hydraulic diameter, RPA inlet CSA, LPA inlet CSA, RPA inlet hydraulic diameter, LPA inlet hydraulic diameter, and MPA bifurcation area and volume in the adverse events (+) group were significantly higher than those in the adverse events (−) group (p < 0.001). The MPA bifurcation angle of patients in the adverse events (+) group was significantly higher than that of patients in the adverse events (−) group (p = 0.004). The ratio of MPA dilation (+), RVD (+), NT-pro BNP (+), and cTnI (+) in the adverse events (+) group were all higher than those in the adverse events (−) group (all, p < 0.001) (Table 1 and Supplementary Figure S1).
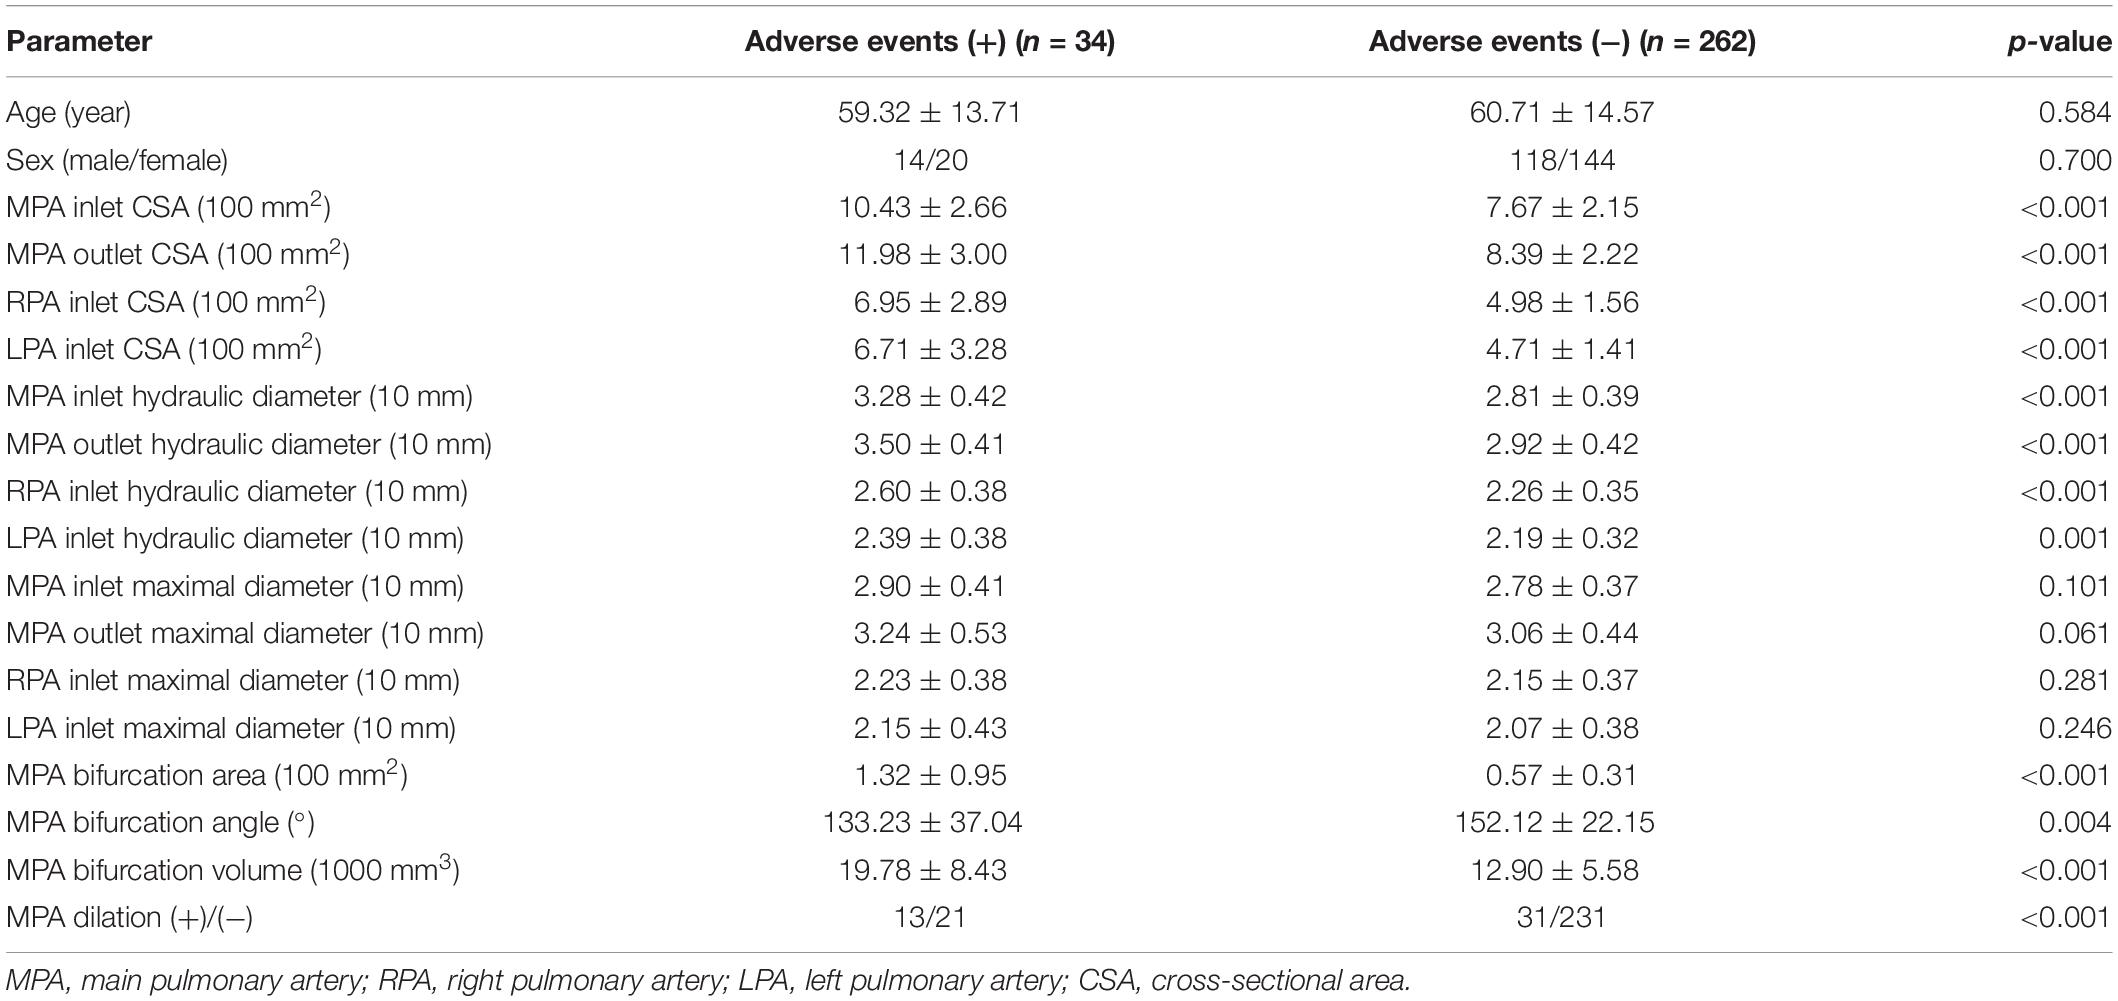
Table 1. Comparison of parameters between adverse events (+) patients and adverse events (−) patients.
After randomly grouping the patients, 150 (72 males/78 females) were included in the training set, and 146 (60 males/86 females) were included in the validation set for internal validation. The average ages were 60.25 ± 14.49 years and 60.97 ± 14.46, respectively. There were no differences between the training set and the validation set (Table 2).
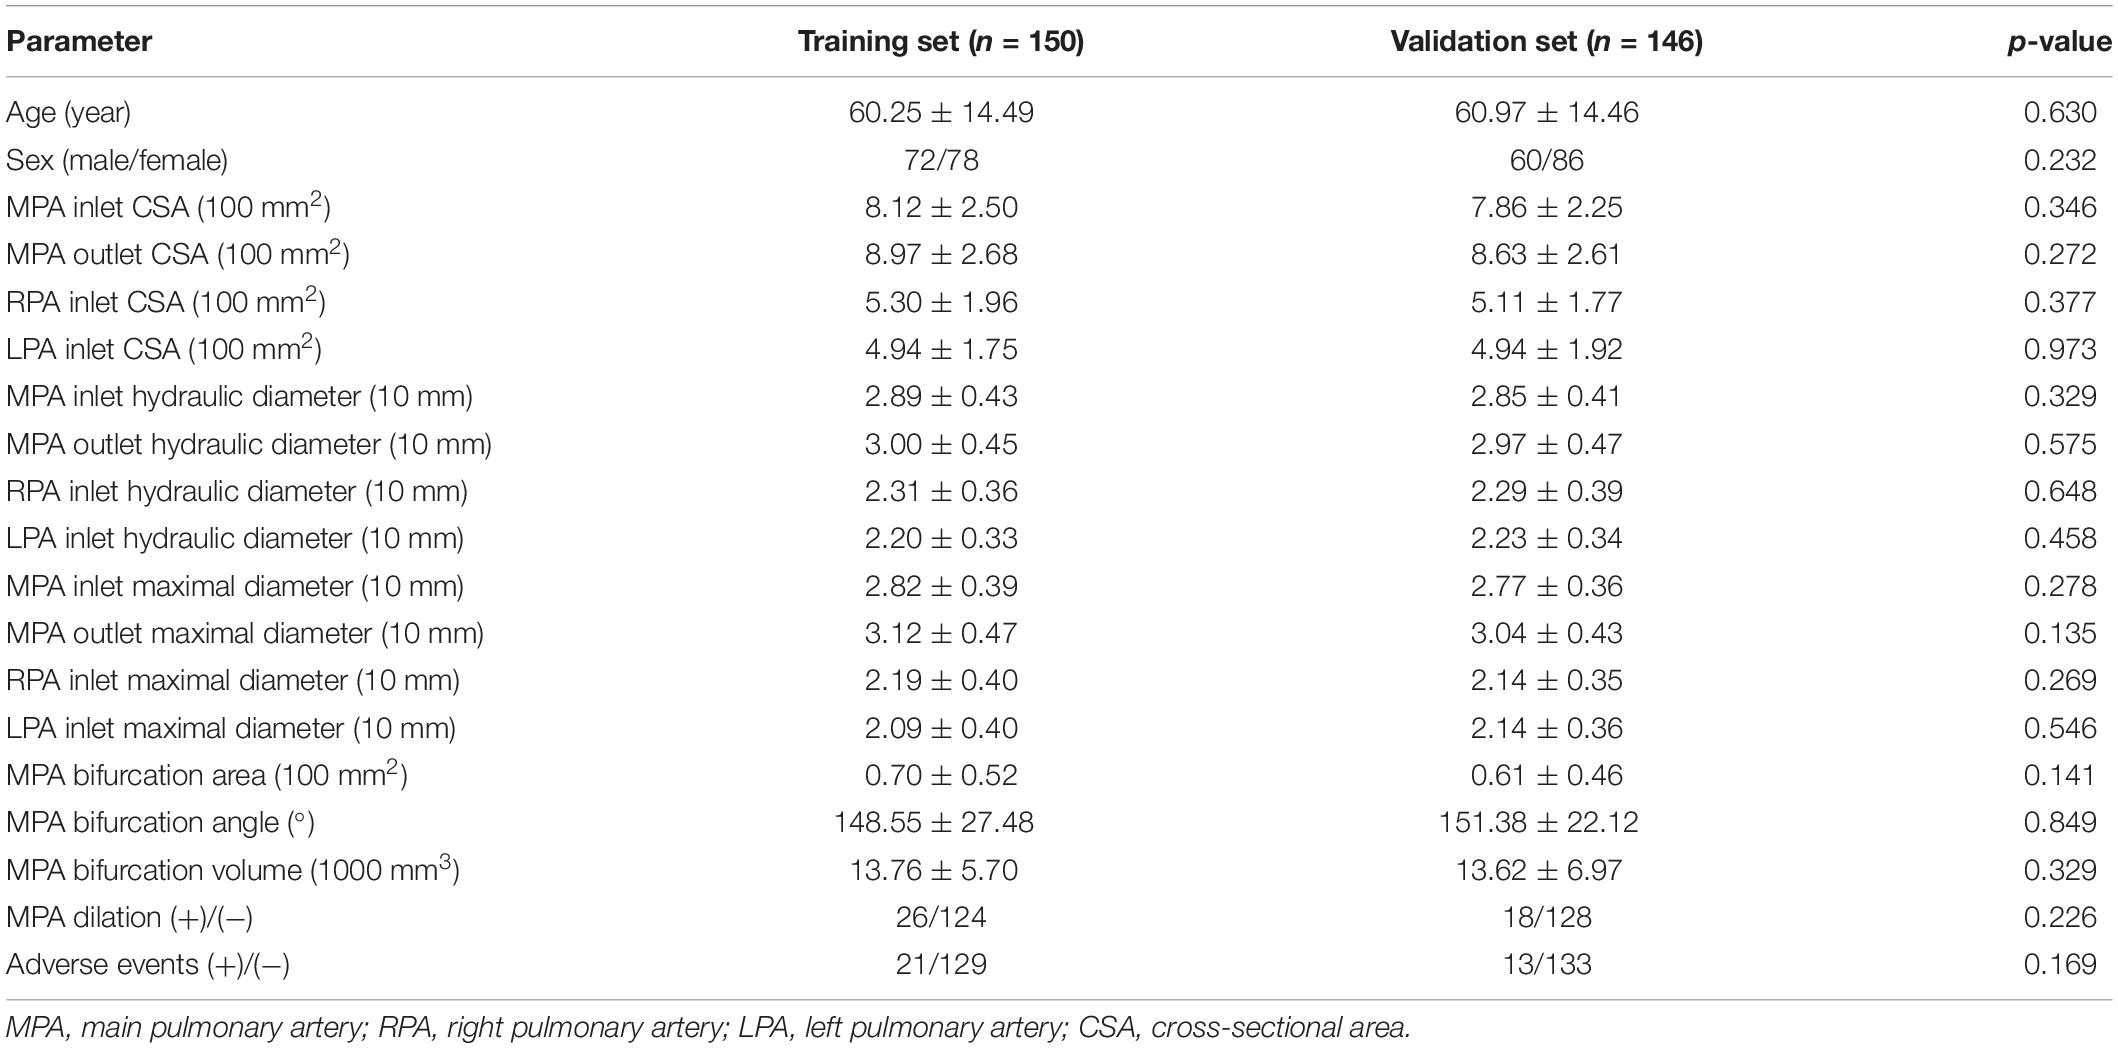
Table 2. Comparison of parameters between the training set and the validation set after random grouping.
A total of 56 patients (25 males/31 females) were sorted into the intermediate-high-risk group, 83 patients (33 males/50 females) were sorted into the intermediate-low-risk group, and 153 patients (74 males and 83 females) were included in the low-risk group. The average ages were 61.46 ± 12.91, 61.47 ± 13.67, and 59.70 ± 15.39 years, respectively (Table 3).
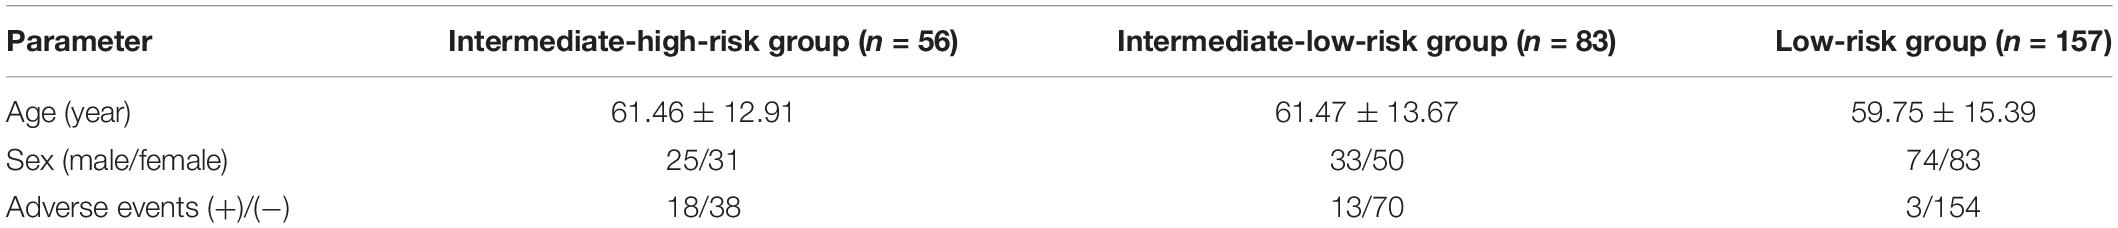
Table 3. Risk stratification groups for all enrolled patients.
A total of 150 patients were included in the training set. A total of 21 (9 males/12 females) patients experienced adverse events (+), and 129 (63 males/66 females) patients did not experience adverse events (−). The average ages were 59.52 ± 11.54 and 60.26 ± 14.95 years, respectively (Table 4).
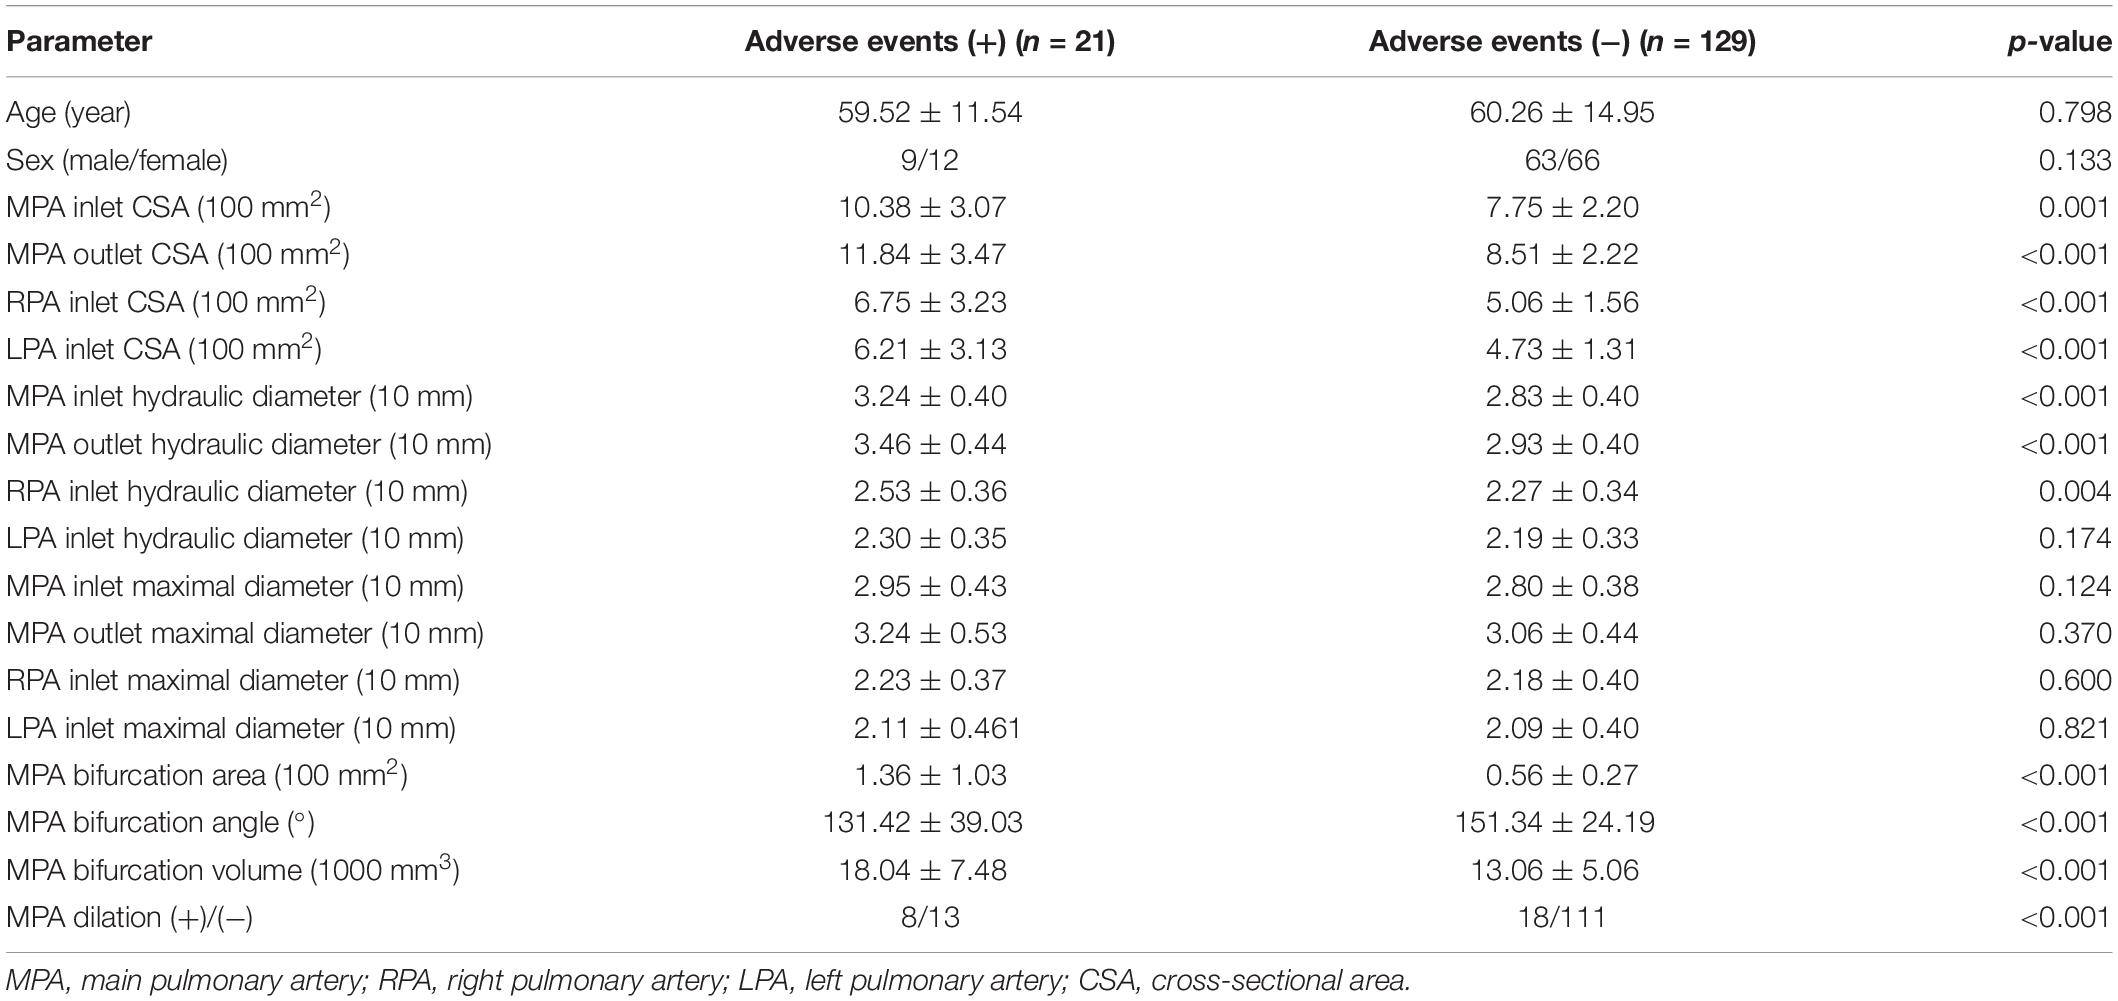
Table 4. Comparison of parameters between adverse events (+) patients and adverse events (−) patients in the training set.
Three radiomic features of MPA parameters with non-zero coefficients were used in the LASSO logistic regression model (the 1-SE criteria) in the training set (see Figure 4). The building of the LASSO mathematical model is shown in Supplementary Figure S2. The formula for calculating the score was as follows: score = 0.92 × MPA bifurcation area + 0.50 × MPA outlet hydraulic diameter + 0.10 × MPA outlet CSA (Figure 4). The ROC-AUC for predicting adverse events in the training set was 0.860 (95% CI: 0.795–0.912, p < 0.001). Calculating the score using the formula in the validation set of patients revealed that the ROC-AUC for predicting adverse events was 0.943 (95% CI: 0.892–0.975, p < 0.001). There was good discrimination in the training and validation sets (Figures 5A,B).
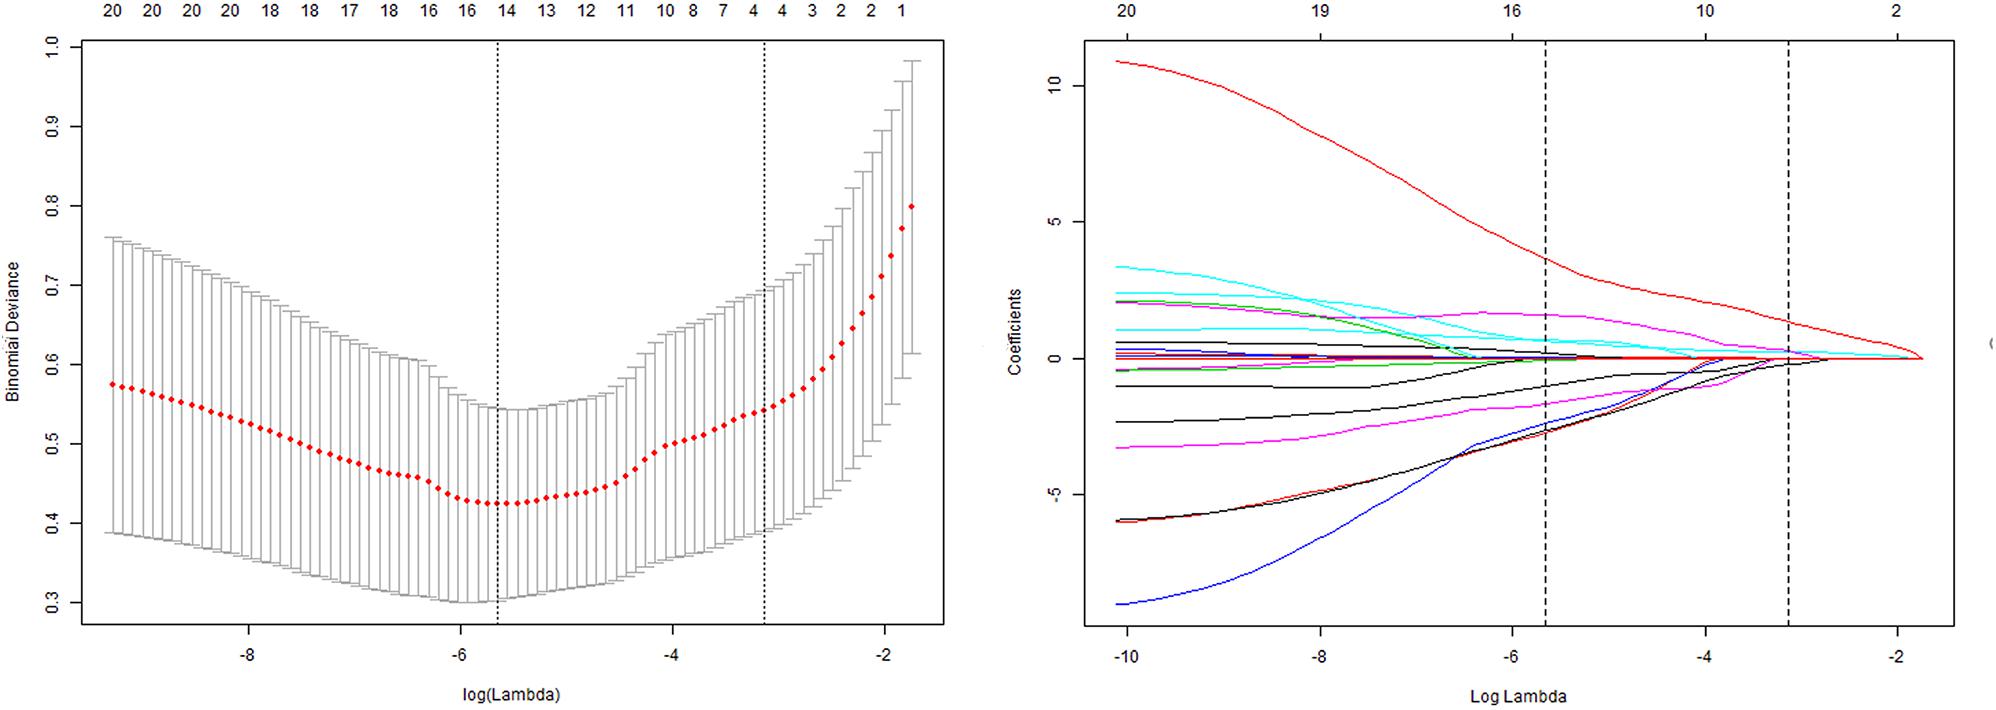
Figure 4. Tuning parameter (lambda) selection in the LASSO model by using 10-fold cross-validation via minimum criteria and 1 standard error of the minimum criteria. Dotted vertical lines were drawn at the optimal values by using the minimum criteria and 1 standard error of the minimum criteria (the 1-SE criteria). The model with the 1-SE criteria was selected. The lambda value of 0.0668, with log (lambda) = –2.70. The model coefficient trendlines of 21 radiomic features; 3 radiomic features were finally included. The formula built by LASSO logistics regression was as follows: score = 0.92 × MPA bifurcation area + 0.50 × MPA outlet hydraulic diameter + 0.10 × MPA outlet CSA.
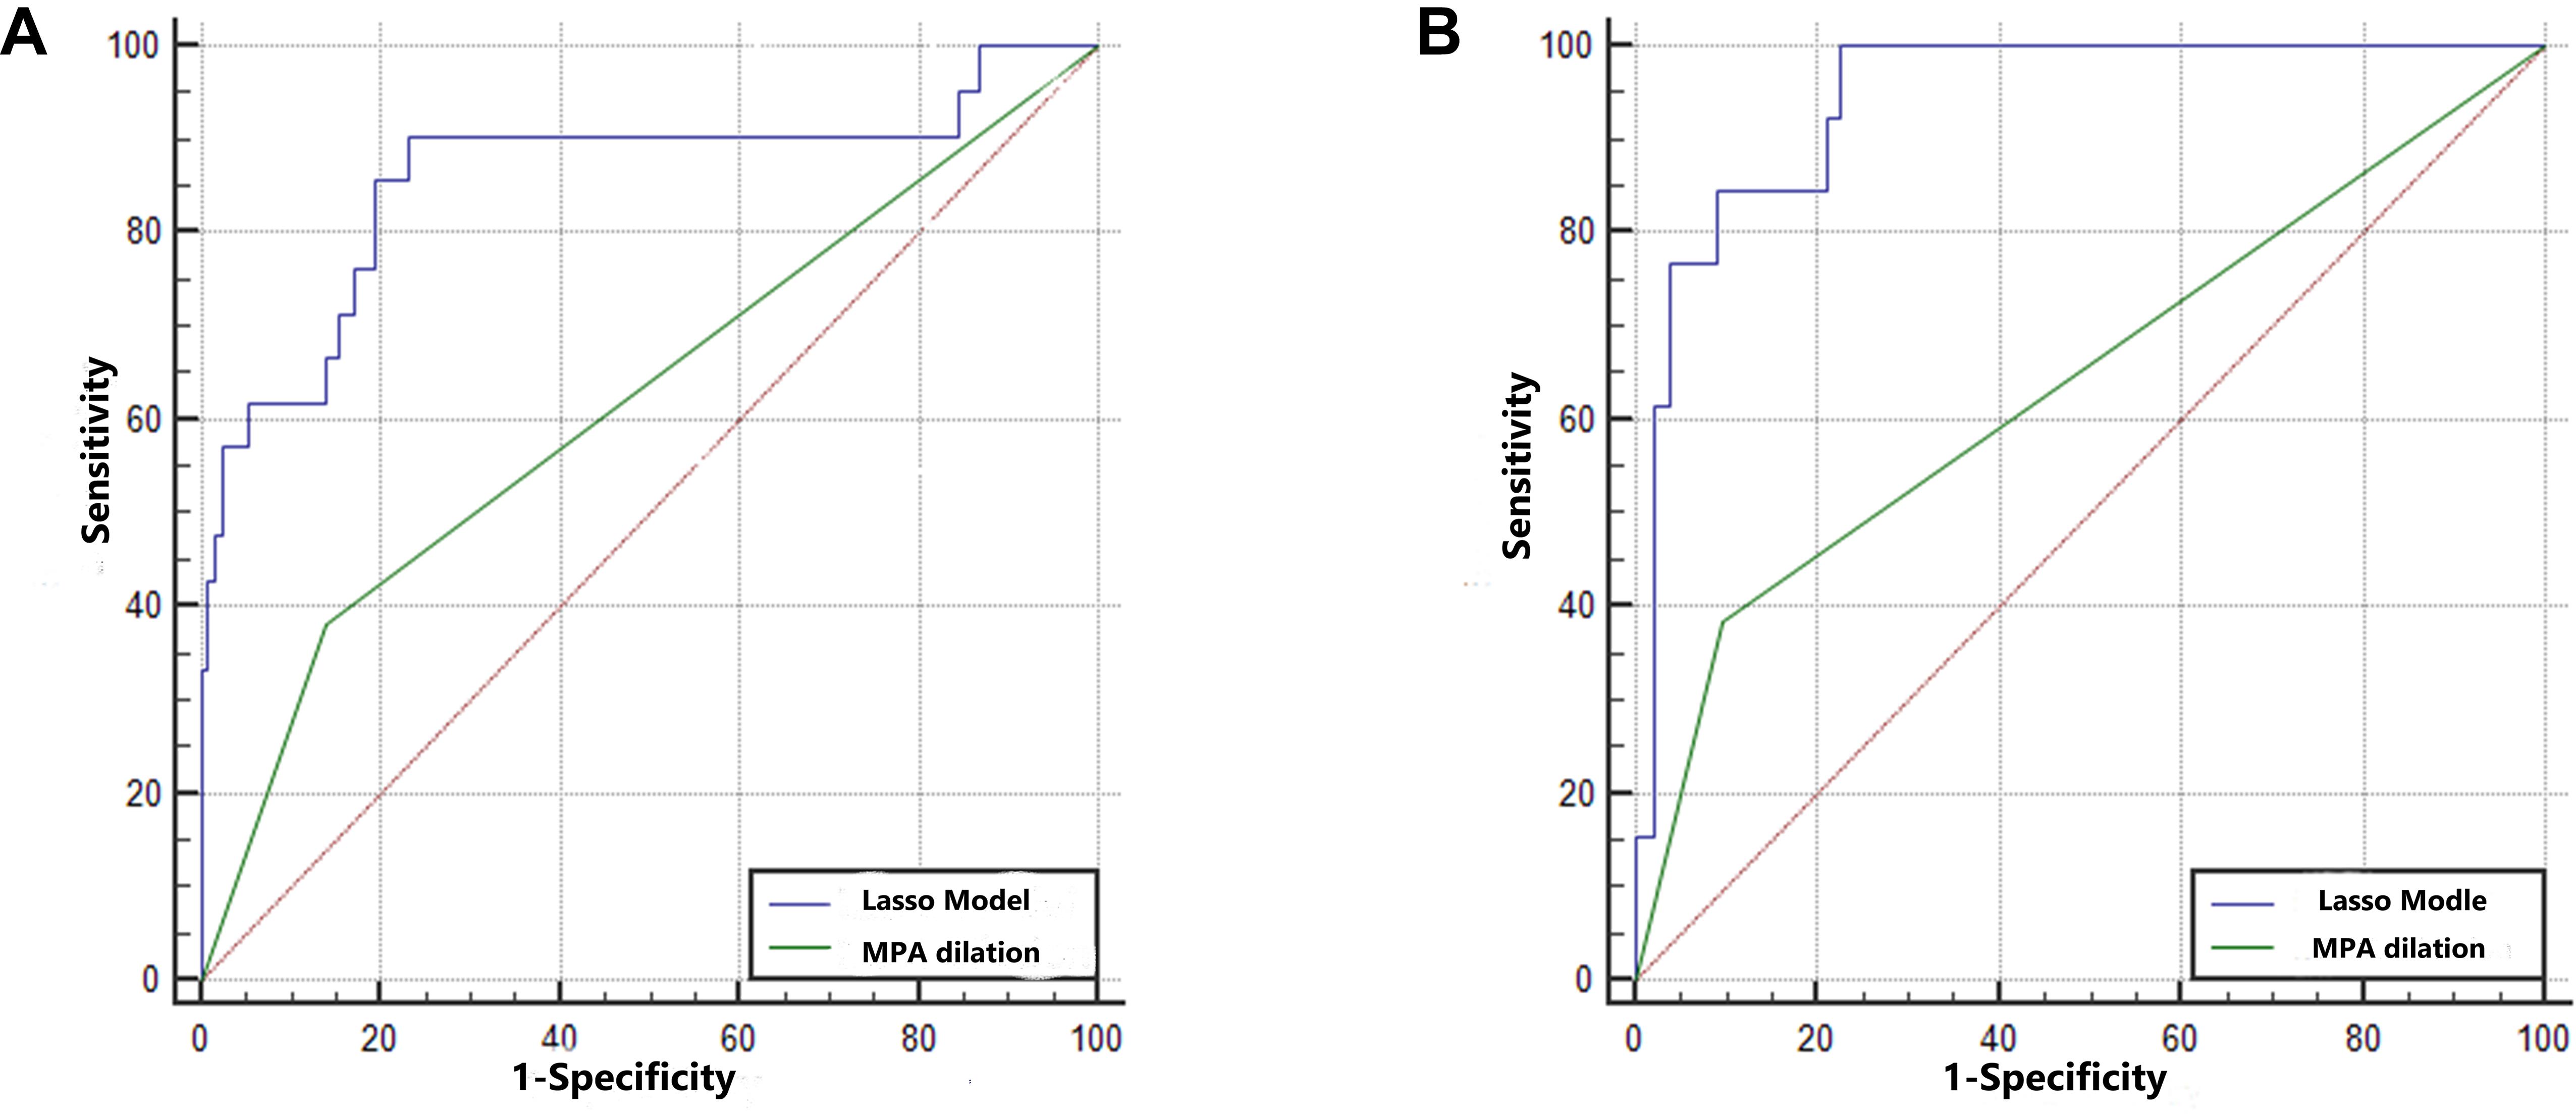
Figure 5. The predictive ability of the training set and validation set. (A) The AUCs in the training set were 0.860 (95% CI: 0.795–0.912) and 0.621 (95% CI: 0.538–0.699). The difference between the predictive formula and the MPA dilation measurement was 0.240 (95% CI: 0.115–0.364, p < 0.001). (B) The AUCs in the validation set were 0.887 (95% CI: 0.892–0.975) and 0.643 (95% CI: 0.560–0.721). The difference between the predictive formula and the MPA dilation measurement was 0.300 (95% CI: 0.164–0.436, p < 0.001).
In the training set, the ROC-AUC of MPA dilation, which was measured as the MPA diameter at the transverse section plane, for predicting adverse events was 0.621 (95% CI: 0.538–0.699, p < 0.001). The difference between the predictive formula and ROC-AUC of MPA dilation was 0.240 (95% CI: 0.115–0.364, p < 0.001). In the validation set, the ROC-AUC of MPA dilation for predicting adverse events was 0.643 (95% CI: 0.560–0.721, p < 0.001). The difference between the predictive formula and the ROC-AUC of MPA dilation was 0.300 (95% CI: 0.164–0.436, p < 0.001). The predictive ability of the formula was superior to that of the MPA dilation measurement for both the training set and validation set. In addition, for predicting adverse events, the predictive formula was substantially better than the MPA dilation measurement at the transverse section in the PR curve of the training set and validation set (mean precision: 0.71 vs. 0.23 and 0.55 vs. 0.23, respectively) (Supplementary Figure S3). DCA revealed that the predictive formula added more net benefit than the MPA dilation measurement for predicting adverse events in the training set and validation set (range between 0.04 and 1.00 and 0.01 and 0.55, respectively) (Supplementary Figure S4).
Determining ways to use CTPA to predict acute PE prognosis is a popular topic. Evaluating MPA size may be the most effective method for predicting short-term prognosis. However, the predictive ability is still poor, especially at 30 days (Beenen et al., 2018). Further analyzing the MPA morphology in detail to improve identification is essential. By analyzing MPA morphology in detail and building a LASSO predictive formula, we proposed an improved identification method for predicting short-term prognosis. After dividing the patients randomly, an internal validation set was used to confirm the legitimacy of the predictive formula. There were good discriminatory abilities in the training set and the validation set. The technique was also superior to the predictive ability of evaluating only MPA dilation (dichotomizing at 29 mm by MPA trunk diameter).
When PE is triggered, MPA does not dilate as a circle due to good resilience and flexibility and tissue compression. Therefore, measuring only the MPA dilation diameter at the transverse section is not accurate enough. Referring to the deformation and dilation under the increased pressure in airway bifurcation (Liu et al., 2013) and the identical blood flow rate in the MPA bifurcation section (Das et al., 2015), even in cases of PH (Barker et al., 2015), the MPA bifurcation section could be considered an integral section; the shear stress could reflect the pressure in this section. We proposed that measuring the MPA bifurcation angle, area and volume might also be useful for predicting the prognosis of acute PE. We evaluated the area of MPA bifurcation by linking the three center points among MPA bifurcation on the centerline. The elevated right ventricular overload caused by PH was the main cause of poor short-term prognosis (Lagos-Carvajal et al., 2015). This increasing overload can cause the location center point on the MPA outlet plane to shift toward the MPA inlet plane (Schievano et al., 2011), and the location of the centerline on the LPA and RPA shifts toward the two sides. As a result, the MPA bifurcation area based on the centerline increases accordingly. This pathophysiological process caused by PH explains the correlation between adverse events and MPA bifurcation area. In addition, MPA bifurcation angle may not correlate with adverse events due to the trilateral lengthening of the MPA bifurcation triangle simultaneously when PH occurs. The MPA bifurcation volume was also not a predictor of adverse events due to inhomogeneity and the varying morphology of the MPA bifurcation.
After reconstruction, the area and maximal diameter were measured easily by splitting along the centerline (Schievano et al., 2011). The deformation of the MPA was also a non-negligible factor as a reaction to the increasing PH value. Therefore, we proposed that MPA deformation, maximal diameter, CSA and MPA bifurcation size might also correlate with short-term prognosis at four easily identified planes. The results of our study revealed that MPA outlet CSA and hydraulic diameter were correlated to adverse events. The change in MPA CSA was correlative to acute PE prognosis, which represented the efficacy of the pressure on the MPA (Tian et al., 2014). As a tubular structure with high elasticity and low resistance, MPA morphology deforms due to PH. The hydraulic diameter is a parameter for evaluating this deformation by balancing the CSA and perimeter (Louis et al., 2013). CSA and hydraulic diameter were only correlative to adverse events at the outlet plane of the MPA. Less interference and restriction at the MPA outlet plane than at other planes might explain this result (Schievano et al., 2011). Simultaneously, the MPA outlet plane was easier to differentiate than the other planes.
Based on the abovementioned physiopathological considerations, we evaluated MPA morphology in patients in the training set as a potential tool to predict adverse events. MPA outlet CSA, hydraulic diameter and MPA bifurcation area were included in a LASSO predictive formula in the training set, and it showed good discriminatory ability. To confirm its applicability, we continued to evaluate the predictive ability of the formula in the validation set. By bringing the three parameters into the formula and calculating the scores, this predictive formula also showed good discriminatory ability in the validation set. The good discriminatory ability in both the training set and the validation set revealed that the formula was stable. It takes about 5 min to complete all parameter measurements, which is practical in the clinic.
Thus, based on the results of the current study, we employed the more responsive and measurement-stable index of MPA outlet CSA, hydraulic diameter, and bifurcation area on CTPA, which is better than the traditional MPA trunk dilation measurement at the transverse section with better receptivity and less deformation due to the tissue compression and good resilience and flexibility of the MPA, and built a LASSO predictive formula as a novel weighting method. This method provides an independent, practical and rapid prediction, with only three parameters involved in the evaluation, immediately after the definite diagnosis of PE after CTPA. In addition, the clinical benefits associated with the use of this LASSO predictive formula are greater than those of the traditional method.
However, several factors limited the strength of our findings: the retrospective research design limited the strength of the results of our study, as did the small number of adverse events. Choosing internal validation by a random splitting also limited the statistical strength. The formula in our results needs further validation. Our study revealed that the weight ratio of the MPA bifurcation area was the highest in the formula, but it was still not enough to validate the superiority of MPA outlet hydraulic diameter compared with MPA dilation trunk diameter due to the small size of our study.
Integrating MPA outlet CSA, hydraulic diameter, and bifurcation area with a LASSO predictive formula as a novel weighting method could facilitate the prediction of poor short-term prognosis within 30 days after hospital admission in non-high-risk acute PE patients; this strategy is superior to the use of the MPA dilation diameter in this prediction. Among the three parameters involved, MPA bifurcation area weighed the most markedly.
The datasets generated for this study are available on request to the corresponding author.
The studies involving human participants were reviewed and approved by Medical Science Research Ethics Committee of the First Affiliated Hospital of China Medical University. Written informed consent for participation was not required for this study in accordance with the national legislation and the institutional requirements.
DJ, X-MZ, and GH helped to plan the study, collected the data, and wrote the manuscript. DJ and X-LL helped to analyzed the data. All authors confirmed that they have had full access to data and contributed to drafting of the manuscript.
This work was supported by the Natural Science Foundation of Liaoning Province (2018011494-301), which was supported by the Liaoning Provincial Department of Science and Technology. This work was also supported by the “345 Science Supporting Foundation” and “Clinical Study Supporting Foundation” of Shengjing Hospital, China Medical University.
The authors declare that the research was conducted in the absence of any commercial or financial relationships that could be construed as a potential conflict of interest.
The Supplementary Material for this article can be found online at: https://www.frontiersin.org/articles/10.3389/fphys.2020.00420/full#supplementary-material
FIGURE S1 | The histograms of quantitative variables for the exhibition of distribution plots. (A) Age; (B) MPA inlet maximal diameter; (C) MPA inlet CSA; (D) MPA inlet hydraulic diameter; (E) MPA outlet maximal diameter; (F) MPA outlet CSA; (G) MPA outlet hydraulic diameter; (H) RPA inlet maximal diameter; (I) RPA inlet CSA; (J) LPA inlet hydraulic diameter; (K) MPA bifurcation area; (L) MPA bifurcation angle; (M) MPA bifurcation volume.
FIGURE S2 | The selection of the LASSO mathematical model. Two LASSO predictive models were conducted by 10-fold cross-validation based on minimum criteria (lambda.min criteria) and 1 standard error criteria (the 1-SE criteria) in the training set. Formula 1 (the 1-SE criteria): Select lambda = lambda.1se: 0.0668 (−2.7065). Variables selected: formula for calculating the score (not including intercept): 0.10 × MPA outlet CSA + 0.92 × MPA bifurcation area + 0.50 × MPA outlet hydraulic diameter, in which three parameters were involved. Formula 2 (lambda.min) formula for calculating the score (not including intercept): 0.27 × MPA outlet CSA + 1.92 × MPA bifurcation area + 2.01 × MPA outlet hydraulic diameter −0.45 × Left-planet hydraulic diameter −1.17 × MPA outlet maximal diameter − 0.53 × Right-planet hydraulic diameter − 0.44 × LPA inlet maximal diameter, in which severe parameters were involved. The detail procedure for the measurement of the index in Formula 1 and Formula 2 was shown in Supplementary Videos 1, 2, respectively. Good predictability was achieved in the LASSO mathematical model by each formula. In the training set, the ROC-AUC was 0.897 (95% CI: 0.837–0.941, p < 0.05) and 0.860 (95% CI: 0.795–0.912, p < 0.05). More parameters (7 parameters) were involved in formula 2, and twice the time as that consumed by formula 1 (3 parameters) was required. Thus, we chose formula 1 (the 1-SE criteria) with the similar predictability but fewer parameters as the prediction method, which might work as a potential and practical tool in clinical practice.
FIGURE S3 | The precision-recall (PR) curve of the training set and validation set for predicting the adverse events of the non-high-risk PE patients. The predictive formula was strongly better than that of evaluating the MPA dilation at the transverse section in the PR curve of the training set and validation set for predicting adverse events (mean precision: 0.71 vs. 0.23 and 0.55 vs. 0.23, respectively). (A) PR curve in training set; (B) PR curve in validation set. Redline is shown to indicate LASSO model; Greenline is shown to indicate MPA dilation. MPA dilation was evaluated by measuring MPA diameter at the transverse section plane (dichotomized at 29 mm as baseline) and was defined as (+)/(−) on CTPA.
FIGURE S4 | The decision curve analysis (DCA) showed that utilizing the predictive formula for predicting adverse events added a net benefit both in the training set and in the validation set (range between 0.04 and 1.00 and 0.01 and 0.55, respectively). (A) DCA in the training set; (B) DCA in the validation set.
Aviram, G., Shmueli, H., Adam, S. Z., Bendet, A., Ziv-Baran, T., Steinvil, A., et al. (2015). Pulmonary hypertension: a nomogram based on CT pulmonary angiographic data for prediction in patients without pulmonary embolism. Radiology 277, 236–246. doi: 10.1148/radiol.15141269
Aviram, G., Soikher, E., Bendet, A., Shmueli, H., Ziv-Baran, T., Amitai, Y., et al. (2016). Prediction of mortality in pulmonary embolism based on left atrial volume measured on ct pulmonary angiography. Chest 149, 667–675. doi: 10.1378/chest.15-0666
Aviram, G., Steinvil, A., Berliner, S., Rosen, G., Sosna, J., Man, A., et al. (2011). The association between the embolic load and atrial size in acute pulmonary embolism. J. Thromb. Haemost. 9, 293–299. doi: 10.1111/j.1538-7836.2010.04130.x
Barker, A. J., Roldan-Alzate, A., Entezari, P., Shah, S. J., Chesler, N. C., Wieben, O., et al. (2015). Four-dimensional flow assessment of pulmonary artery flow and wall shear stress in adult pulmonary arterial hypertension: results from two institutions. Magn. Reson. Med. 73, 1904–1913. doi: 10.1002/mrm.25326
Becattini, C., Agnelli, G., Germini, F., and Vedovati, M. C. (2014). Computed tomography to assess risk of death in acute pulmonary embolism: a meta-analysis. Eur. Respir. J. 43, 1678–1690. doi: 10.1183/09031936.00147813
Beenen, L. F. M., Bossuyt, P., Stoker, J., and Middeldorp, S. (2018). Prognostic value of cardiovascular parameters in CT Pulmonary Angiography in patients with acute pulmonary embolism. Eur. Respir. J. 52:1702611. doi: 10.1183/13993003.02611-2017
Binder, L., Pieske, B., Olschewski, M., Geibel, A., Klostermann, B., Reiner, C., et al. (2005). N-terminal pro-brain natriuretic peptide or troponin testing followed by echocardiography for risk stratification of acute pulmonary embolism. Circulation 112, 1573–1579. doi: 10.1161/CIRCULATIONAHA.105.552216
Choi, S., Hoffman, E. A., Wenzel, S. E., Castro, M., Fain, S. B., Jarjour, N. N., et al. (2015). Quantitative assessment of multiscale structural and functional alterations in asthmatic populations. J. Appl. Physiol. 118, 1286–1298. doi: 10.1152/japplphysiol.01094.2014
Cok, G., Tasbakan, M. S., Ceylan, N., Bayraktaroglu, S., and Duman, S. (2013). Can we use CT pulmonary angiography as an alternative to echocardiography in determining right ventricular dysfunction and its severity in patients with acute pulmonary thromboembolism? Jpn. J. Radiol. 31, 172–178. doi: 10.1007/s11604-012-0164-6
Das, A., Wansapura, J. P., Gottliebson, W. M., and Banerjee, R. K. (2015). Methodology for implementing patient-specific spatial boundary condition during a cardiac cycle from phase-contrast MRI for hemodynamic assessment. Med. Image Anal. 19, 121–136. doi: 10.1016/j.media.2014.09.001
DeLong, E. R., DeLong, D. M., and Clarke-Pearson, D. L. (1988). Comparing the areas under two or more correlated receiver operating characteristic curves: a nonparametric approach. Biometrics 44, 837–845.
Feng, J. Z., Wang, Y., Peng, J., Sun, M. W., Zeng, J., and Jiang, H. (2019). Comparison between logistic regression and machine learning algorithms on survival prediction of traumatic brain injuries. J. Crit. Care 54, 110–116. doi: 10.1016/j.jcrc.2019.08.010
Fernandez, C., Bova, C., Sanchez, O., Prandoni, P., Lankeit, M., Konstantinides, S., et al. (2015). Validation of a model for identification of patients at intermediate to high risk for complications associated with acute symptomatic pulmonary embolism. Chest 148, 211–218. doi: 10.1378/chest.14-2551
Gutte, H., Mortensen, J., Mork, M. L., Kristoffersen, U. S., Jensen, C. V., Petersen, C. L., et al. (2017). Non-ECG-gated CT pulmonary angiography and the prediction of right ventricular dysfunction in patients suspected of pulmonary embolism. Clin. Physiol. Funct. Imaging 37, 575–581. doi: 10.1111/cpf.12325
Hanley, J. A., and McNeil, B. J. (1982). The meaning and use of the area under a receiver operating characteristic (ROC) curve. Radiology 143, 29–36. doi: 10.1148/radiology.143.1.7063747
Hariharan, P., Dudzinski, D. M., Rosovsky, R., Haddad, F., MacMahon, P., Parry, B., et al. (2016). Relation among clot burden, right-sided heart strain, and adverse events after acute pulmonary embolism. Am. J. Cardiol. 118, 1568–1573. doi: 10.1016/j.amjcard.2016.08.025
Jia, D., Liu, F., Zhang, Q., Zeng, G. Q., Li, X. L., and Hou, G. (2017). Rapid on-site evaluation of routine biochemical parameters to predict right ventricular dysfunction in and the prognosis of patients with acute pulmonary embolism upon admission to the emergency room. J. Clin. Lab. Anal. 32:e22362. doi: 10.1002/jcla.22362
Konstantinides, S. V., Torbicki, A., Agnelli, G., Danchin, N., Fitzmaurice, D., Galie, N., et al. (2014). 2014 ESC guidelines on the diagnosis and management of acute pulmonary embolism. Eur. Heart J. 35, 3033–3069. doi: 10.1093/eurheartj/ehu283
Lagos-Carvajal, A. P., Teixeira-Neto, F. J., Becerra-Velasquez, D. R., Diniz, M. S., Klein, A. V., Rocha, T. L., et al. (2015). Adrenomedullin induces pulmonary vasodilation but does not attenuate pulmonary hypertension in a sheep model of acute pulmonary embolism. Life Sci. 139, 139–144. doi: 10.1016/j.lfs.2015.08.013
Lankeit, M. (2017). Always think of the right ventricle, even in “low-risk” pulmonary embolism. Eur. Respir. J. 50:1702386. doi: 10.1183/13993003.02386-2017
Liu, X., Chen, D. Z., Tawhai, M. H., Wu, X., Hoffman, E. A., and Sonka, M. (2013). Optimal graph search based segmentation of airway tree double surfaces across bifurcations. IEEE Trans. Med. Imaging 32, 493–510. doi: 10.1109/TMI.2012.2223760
Louis, B., Papon, J. F., Croce, C., Caillibotte, G., Sbirlea-Apiou, G., Coste, A., et al. (2013). Frictional resistance sheds light on the multicomponent nature of nasal obstruction: a combined in vivo and computational fluid dynamics study. Respir. Physiol. Neurobiol. 188, 133–142. doi: 10.1016/j.resp.2013.05.024
Malhotra, R., Dhakal, B. P., Eisman, A. S., Pappagianopoulos, P. P., Dress, A., Weiner, R. B., et al. (2016). Pulmonary vascular distensibility predicts pulmonary hypertension severity, exercise capacity, and survival in heart failure. Circ. Heart Fail. 9:e003011. doi: 10.1161/CIRCHEARTFAILURE.115.003011
Moons, K. G., Altman, D. G., Reitsma, J. B., Ioannidis, J. P., Macaskill, P., Steyerberg, E. W., et al. (2015). Transparent Reporting of a multivariable prediction model for Individual Prognosis or Diagnosis (TRIPOD): explanation and elaboration. Ann. Intern. Med. 162, W1–W73. doi: 10.7326/M14-0698
Oz, I. I., Altinsoy, B., Serifoglu, I., Sayin, R., Buyukuysal, M. C., Erboy, F., et al. (2015). Evaluation of right atrium-to-right ventricle diameter ratio on computed tomography pulmonary angiography: prediction of adverse outcome and 30-day mortality. Eur. J. Radiol. 84, 2526–2532. doi: 10.1016/j.ejrad.2015.08.019
Schievano, S., Capelli, C., Young, C., Lurz, P., Nordmeyer, J., Owens, C., et al. (2011). Four-dimensional computed tomography: a method of assessing right ventricular outflow tract and pulmonary artery deformations throughout the cardiac cycle. Eur. Radiol. 21, 36–45. doi: 10.1007/s00330-010-1913-5
Seon, H. J., Kim, K. H., Lee, W. S., Choi, S., Yoon, H. J., Ahn, Y., et al. (2011). Usefulness of computed tomographic pulmonary angiography in the risk stratification of acute pulmonary thromboembolism. Comparison with cardiac biomarkers. Circ. J. 75, 428–436. doi: 10.1253/circj.cj-10-0361
Tian, L., Kellihan, H. B., Henningsen, J., Bellofiore, A., Forouzan, O., Roldan-Alzate, A., et al. (2014). Pulmonary artery relative area change is inversely related to ex vivo measured arterial elastic modulus in the canine model of acute pulmonary embolization. J. Biomech. 47, 2904–2910. doi: 10.1016/j.jbiomech.2014.07.013
Wu, S., Zheng, J., Li, Y., Yu, H., Shi, S., Xie, W., et al. (2017). A radiomics nomogram for the preoperative prediction of lymph node metastasis in bladder cancer. Clin. Cancer Res. 23, 6904–6911. doi: 10.1158/1078-0432.CCR-17-1510
Keywords: computed tomography angiography, pulmonary embolism, pulmonary artery, pulmonary hypertension, main pulmonary artery bifurcation
Citation: Jia D, Li X-L, Hou G and Zhou X-M (2020) A Novel Predictive Method Incorporating Parameters of Main Pulmonary Artery Bifurcation for Short-Term Prognosis in Non-high-risk Acute Pulmonary Embolism Patients. Front. Physiol. 11:420. doi: 10.3389/fphys.2020.00420
Received: 10 September 2019; Accepted: 07 April 2020;
Published: 30 April 2020.
Edited by:
Joseph L. Greenstein, Johns Hopkins University, United StatesReviewed by:
Guanghao Sun, The University of Electro-Communications, JapanCopyright © 2020 Jia, Li, Hou and Zhou. This is an open-access article distributed under the terms of the Creative Commons Attribution License (CC BY). The use, distribution or reproduction in other forums is permitted, provided the original author(s) and the copyright owner(s) are credited and that the original publication in this journal is cited, in accordance with accepted academic practice. No use, distribution or reproduction is permitted which does not comply with these terms.
*Correspondence: Gang Hou, aG91Z2FuZ2NtdUAxNjMuY29t; Xiao-Ming Zhou, emhvdXhtY211QDE2My5jb20=
Disclaimer: All claims expressed in this article are solely those of the authors and do not necessarily represent those of their affiliated organizations, or those of the publisher, the editors and the reviewers. Any product that may be evaluated in this article or claim that may be made by its manufacturer is not guaranteed or endorsed by the publisher.
Research integrity at Frontiers
Learn more about the work of our research integrity team to safeguard the quality of each article we publish.