 Leigh M. Seccombe
 Matthew J. Peters1,2
 Claude S. Farah
- 1Thoracic Medicine, Concord Hospital, Sydney, NSW, Australia
- 2Faculty of Medicine and Health, Sydney University, Camperdown, NSW, Australia
- 3The Woolcock Institute of Medical Research, Sydney, NSW, Australia
Objective: Lung mechanics using the forced oscillation technique (FOT) is suggested to be equivalent and more sensitive in determining exercise-induced bronchoconstriction (EIB) than spirometry. Dynamic alterations in minute ventilation (VE) may affect this measurement. We investigated changes in FOT parameters post exercise challenge (EC) in people with asthma as compared to spirometry. The rate of recovery and any effect of raised VE following exercise on FOT parameters were also assessed.
Method: Airway resistance (R5) and reactance (X5) at 5 Hz and VE were measured prior to forced expiratory volume in 1 s (FEV1) before and up to 20 min after a standard EC in people with asthma and healthy controls. Airway hyperresponsiveness to the hyperosmolar mannitol test was measured in the asthmatic subjects within 1 week of the EC. Baseline and sequential measures were assessed using repeated measures ANOVA and Pearson’s correlation. Group demographics and recovery data were compared using an unpaired t test.
Results: Subjects with current asthma (n = 19, mean ± SD age 28 ± 6 years) and controls (n = 10, 31 ± 5 years) were studied. Baseline FEV1, R5, X5, and VE were similar between groups (p > 0.09). Airway hyperresponsiveness was present in 12/19 asthmatic subjects. The EC max % change of R5 and X5 correlated with FEV1 (r > 0.90) and were only different to controls in those with asthma that responded by FEV1 criteria (p < 0.01). EC recovery of R5 was similar to FEV1; however, X5 was greater (p = 0.03). Elevated VE post EC did not affect the % change in FOT parameters across all subjects (p > 0.3). R5 and X5 were highly sensitive in determining a positive EC response (80–86%), but X5 was more specific (93 vs. 80%).
Conclusion: FOT parameters tracked with forced maneuvers and were not influenced by increased ventilation following an exercise challenge designed to elicit EIB. FOT identified EIB similarly to spirometry in patients with asthma.
Introduction
Exercise-induced bronchoconstriction (EIB) describes increased sensitivity to exercise stimuli that cause airway narrowing via airway smooth muscle contraction (Joos et al., 2003). Commonly associated with asthma, the presence and degree of EIB can be assessed in the laboratory using an exercise challenge test (EC), a stimulus that releases inflammatory mediators (Anderson et al., 1982; Weiler et al., 2016) via osmotic and thermal effects of respiratory water loss (Anderson et al., 1982).
Traditionally an EC is assessed using forced expiratory volume in 1 s (FEV1), where a ≥ 10% decline from baseline is considered positive (Parsons et al., 2013). Measurement is dependent on the patient’s ability to perform maximal and repeatable efforts, which may be challenging for some and may independently alter airway resistance. The required deep inhalation is known to alter airway caliber in those with airway hyperresponsiveness, affecting airway resistance and therefore the sensitivity of FEV1 to detect EIB. In addition, other lung volume-related responses (such as hyperinflation) are not detectable by spirometry.
The use of oscillometry methods such as the forced oscillation technique (FOT) or the impulse oscillometry system can measure total respiratory system impedance encompassing the resistive, elastic, and inertial properties of the airways (Oostveen et al., 2003). Increased airway resistance and more negative reactance have been identified in those with airway obstruction defined by spirometry and provide an insight into the behavior of the airway tree such as reduced airway caliber and increased ventilation inhomogeneity. A previous study using the impulse oscillometry system during EC in adults with probable EIB (Evans et al., 2005) established the technique as repeatable, clinically relevant and to correlate with spirometry. FOT is performed during tidal breathing, which eliminates the need for forced maximal maneuvers required during spirometry. As such, the test is well tolerated by patients and suitable for serial measurement as required during a challenge test. The increasing availability of commercial FOT devices highlights the need to define the utility and any limitation to the adoption of this lung function modality in the clinical setting.
The impact of the increased minute ventilation (VE) and any change in the operating lung volume on FOT parameters during the challenge test has not been previously studied. Such patient factors could affect the reliability of the test. Dynamic hyperinflation has been previously described in both healthy subjects and those with airway hyperresponsiveness (Anderson et al., 1972). It is also known that FOT parameters are dependent on lung volume when measured in a resting steady state condition (Oostveen et al., 2003; Milne et al., 2019). As such, clinical practice recommendations suggest that measurement should be performed with the patient breathing at functional residual capacity. A stable respiratory rate, and consequently VE, is also recommended due to concern that an increased respiratory rate could affect signal-to-noise. Both of these factors, however, cannot be controlled following an exercise test since the test is associated with increased VE and measurement is inherently not performed during steady state.
We hypothesized that measures of airway mechanics using FOT are sensitive in detecting EIB in comparison to forced maneuvers and are not confounded by the post exercise increase in VE. The aim of this investigation was (1) to compare changes in FOT and spirometry parameters post EC in people with asthma and healthy controls and (2) to investigate the rate of recovery and any effect of raised VE following exercise on FOT parameters.
Methods
Subjects and Study Design
This was a prospective study that was reviewed and approved by the Sydney Local Health District Human Ethics Review Board (HREC/15/CRGH/266, NSW, Australia) with written informed consent obtained from all subjects in accordance with the Declaration of Helsinki. Some data have been previously published in part (Seccombe et al., 2018).
Subjects with asthma were recruited from a hospital-based airways disease clinic. A standard definition of current asthma was used; prior clinician diagnosis of asthma and symptoms or use of asthma medications within the last 12 months was used. All subjects were not permitted to have an upper respiratory tract infection within the past 4 weeks, any known cardiac disease or claustrophobia. Prior to all tests, subjects were asked to abstain from caffeine and exercise for at least 4 h, long-acting beta-agonists and/or inhaled corticosteroids for at least 48 h, tiotropium bromide or antihistamines for at least 72 h, and short-acting beta agonists for at least 12 h (Anderson and Kippelen, 2013). Healthy age matched controls (±1 SD of the mean age of the study group) who had no history of lung or cardiac disease were recruited for comparison via community advertisement.
At the initial visit, all subjects with asthma performed a mannitol challenge to determine the presence of airway hyperresponsiveness. At the second visit (which was within 1 week of the first visit), subjects sequentially completed the asthma control test, exhaled nitric oxide measurement and an exercise challenge designed to elicit EIB (EC). All tests were performed by experienced Scientific Officers in an accredited laboratory. All lung function measurement devices were successfully calibrated incorporating ambient conditions prior to each test.
Experimental Procedures
Mannitol Challenge
A mannitol challenge (Aridol™, Pharmaxis, Frenchs Forest, NSW, Australia) was performed according to Anderson et al. (1997). The dose protocol consisted of 0, 5, 10, 20, 40, 80, 160, 160, and 160 mg mannitol delivered via osmohaler. Three FEV1 maneuvers were performed 60 s after each dose, and the highest was compared to that measured after the 0-mg capsule to calculate the percent decrease. The challenge was terminated when a 15% decrease in FEV1 was measured or a total cumulative dose of 635 mg had been given. Airway hyperresponsiveness to mannitol was defined as a 15% fall in FEV1 to a provoking cumulative dose of 635 mg or less (PD15).
Asthma Control Test
Asthma control was determined using the patient-based five-item Asthma Control Test survey (Nathan et al., 2004). The subject completed the survey independently from the Scientific Officer, a score ≥ 20 indicates well controlled asthma.
Exhaled Nitric Oxide
Exhaled nitric oxide was measured (CLD-88sp, Ecomedics, Dürnten, Switzerland) before any forced respiratory maneuvers according to consensus guidelines (American Thoracic Society and European Respiratory Society, 2005). Following a full inhalation of zero nitric oxide (scrubbed) room air, the patient was instructed to exhale at 50 ± 5 ml s−1 until a plateau was measured. The recorded value was the mean of two values within 5% or mean of three values within 10% of each other. A value >25 ppb was regarded as elevated.
Exercise Challenge Test
An EC designed to elicit EIB was performed according to American Thoracic Society recommendations (Parsons et al., 2013). Subjects breathed room air on a cycle ergometer (VIAsprint 150p, Ergoline, Bitz, Germany) with a nose clip in situ. Continuous breath-by-breath gas analysis was measured, while the subject breathed through a mouthpiece connected to a metabolic cart (Oxycon Pro, Jaeger, Hoechberg, Germany). VE was continuously monitored to ensure workload was titrated to elicit a target greater than 60% of the subjects estimated maximal voluntary ventilation (calculated as baseline FEV1 × 40) (Anderson and Kippelen, 2013; Parsons et al., 2013). The target workload was estimated using a validated algorithm and ramped over 3–4 min to achieve the target VE for more than 4–5 min (Crapo et al., 2000).
Lung Function Measurements
FOT and then spirometry were performed prior to (baseline) and at 3-, 5-, 10-, 15- and 20-min post exercise.
Forced Oscillation Technique
Respiratory system impedance to derive resistance (R5) and reactance (X5) at 5 Hz was assessed using the standardized FOT recommendations (Oostveen et al., 2003) (tremoFlo software build 1.0.40.38, Thorasys, Montreal, Canada). Measurements were collected during 30-s of tidal breathing with the subject seated upright and with cheeks supported. Acceptability included at least three breaths free from artifact due to occlusion, leak or drift, or extreme (>5 SD of mean) or negative resistance. The mean value generated from each measurement by the software was recorded.
Spirometry
Spirometry to derive FEV1 and forced vital capacity was measured according to American Thoracic Society/European Respiratory society guidelines (Miller et al., 2005) (Easy on-PC, ndd Medical Technologies, Zurich, Switzerland). The highest values of two repeatable, from three acceptable, efforts were recorded. Reference values were derived from the Global Lung Initiative (Quanjer et al., 2012).
Data Analysis
The primary measures of lung function were R5, X5, and FEV1 collected at each time point. EC response was expressed as the maximum fall in these values from baseline following exercise as a percentage of the baseline (pre-exercise) value. A ≥10% fall in FEV1 was considered positive (Parsons et al., 2013) and defined as “EC-positive.” The values at the 20-min time point following EC as a percentage of the baseline were used to assess and compare the rate of recovery. At each time point, VE was calculated from the product of mean tidal volume and the mean respiratory rate measured during the 30 s FOT recording.
Statistical Analysis
Specialist statistical advice was received. Statistical analysis was performed using SPSS Statistics version 25 (IBM Corporation, Armonk, NY, USA) and graphs prepared using GraphPad Prism 7 (GraphPad Software Inc., La Jolla, California, USA). Values for FEV1 post exercise that remained higher than the pre-exercise value were censored as 0% fall and sequential FEV1, R5, X5, and VE post EC as % change from baseline was compared across groups using a repeated measures ANOVA. A one-tailed Pearson’s correlation investigated any association between R5, X5, FEV1, and VE (including subdivisions of tidal volume and respiratory rate). Receiver operating characteristic curves were used to detect sensitivity and specificity for detecting a positive response to the EC as determined by FEV1 using FOT parameters. Group demographics, EC% maximum change, and recovery data were compared using an unpaired t test. Data are expressed as mean ± SD unless otherwise stated. A p < 0.05 was considered significant.
Results
Subjects and Baseline Lung Function Characteristics
Nineteen subjects with current asthma and 10 controls were studied. There were no differences in baseline demographics between groups (Table 1). Most patients with asthma were mildly symptomatic with an ACT score of 19.7 ± 4.3 and had elevated exhaled nitric oxide (52 ± 46 ppb) as compared to controls (21 ± 13 ppb) that did not reach significance (p = 0.06) (Table 2). At baseline, two thirds (12/19) of subjects with asthma had a normal FEV1/forced vital capacity ratio (above the lower limit of normal), and only one was mildly obstructed with a FEV1 below 80% of predicted. Two thirds (12/19) of subjects demonstrated airway hyperresponsiveness to mannitol with a PD20FEV1M of 165 ± 129 mg.
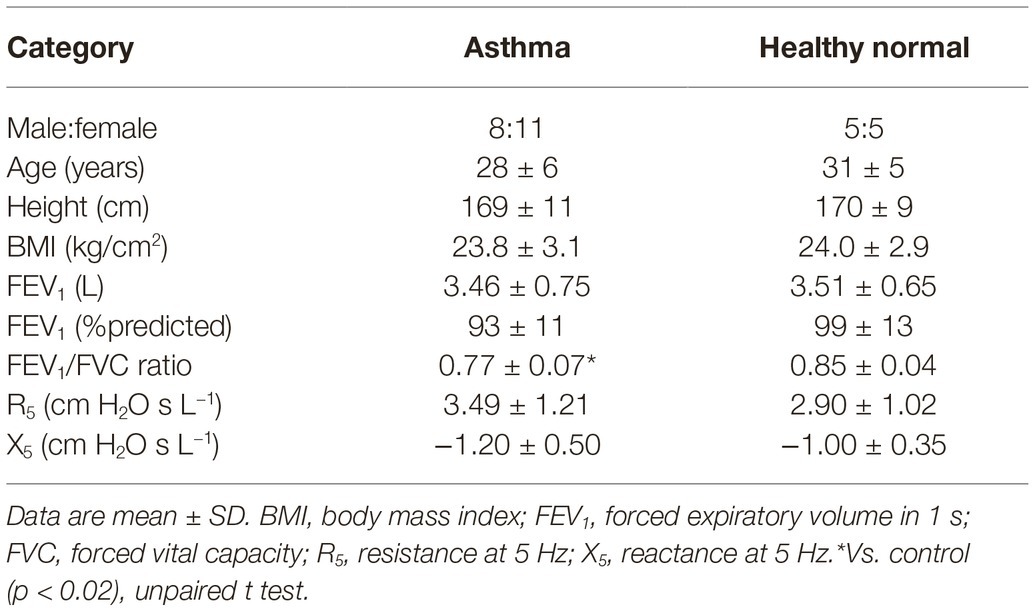
Table 1. Subject baseline characteristics.
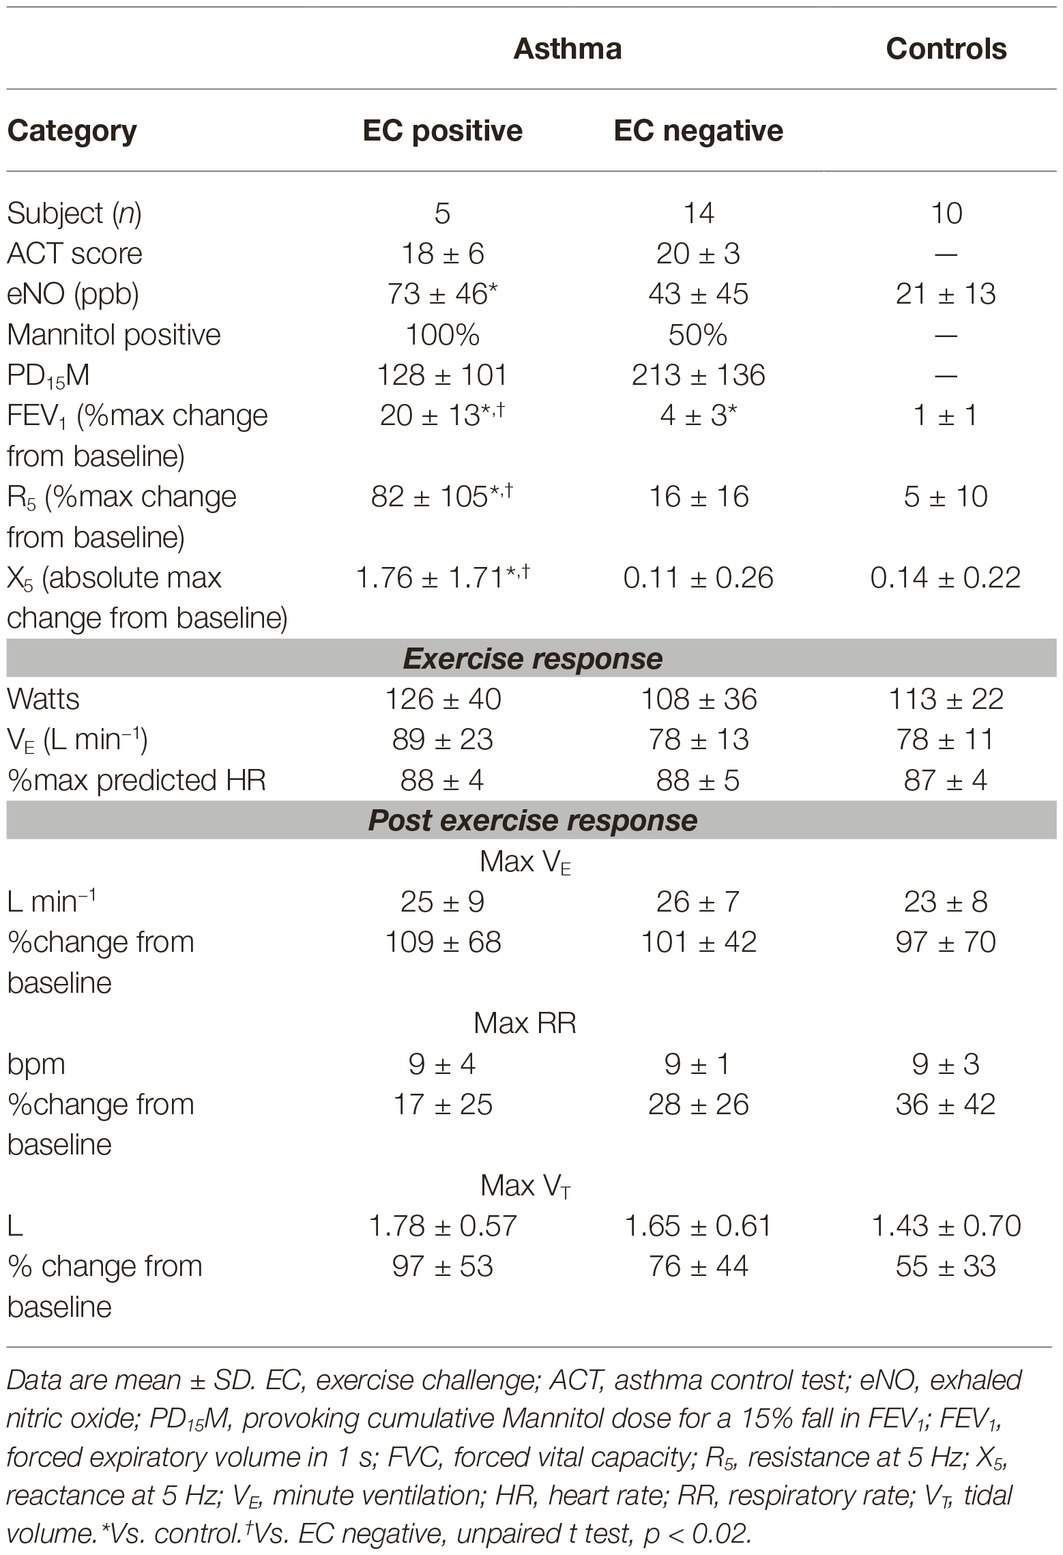
Table 2. Lung function and exercise response.
Exercise Challenge Test
Laboratory ambient conditions were 49 ± 12% relative humidity and 22 ± 1°C. Average VE measured during the EC was 81 ± 15 L min−1 that equated with 59 ± 6% of the estimated maximal voluntary ventilation, corresponding with an average heart rate of 87 ± 4% predicted maximum. There was no difference between groups in the exercise response, including ventilatory parameters during or following exercise (Table 2).
Five of the 19 subjects with asthma were EC positive. The R5 and X5 responses following EC were different in this group (max %change 92 ± 100% and 178 ± 188%) as compared to EC-negative asthma and healthy normal subjects (max %change 7 ± 7% and 16 ± 14%, p < 0.02) (Figure 1). The % recovery to baseline from maximum change at 20 min post EC was greater for X5 (p = 0.03) but similar between R5 and FEV1 (65 ± 21%, 43 ± 35%, and 26 ± 16%, respectively). Following EC, max % change FEV1 correlated with R5 (r = 0.92, p = 0.001) and X5 (r = 0.91, p = 0.001) across all subjects.
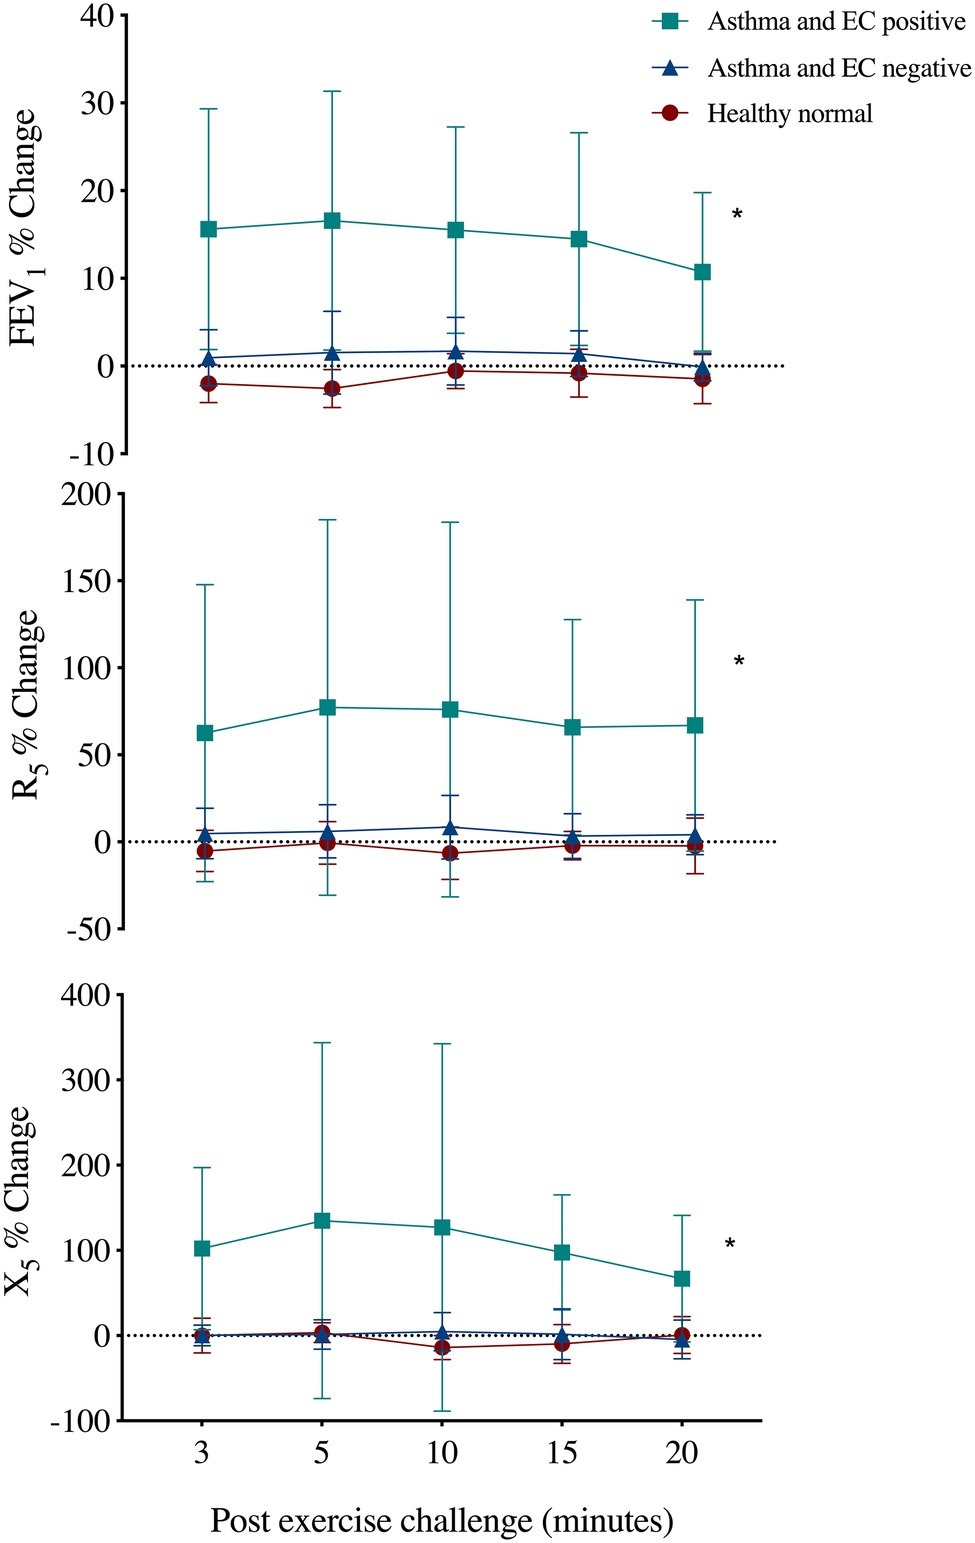
Figure 1. Mean ± SD percent change from baseline in forced expiratory volume in 1 s (FEV1), respiratory resistance (R5), and reactance (X5) at 5 Hz following an exercise challenge test in 19 subjects with current asthma that responded by FEV1 criteria (EC positive asthma, n = 5), did not respond (EC negative asthma, n = 14) and 10 healthy normals. *Repeated measures ANOVA, p < 0.02.
VE was significantly elevated post EC (24.6 ± 7.3 L) as compared to baseline (12.6 ± 3.5 L, p = 0.0001), with a max change of 101 ± 55%. This was via a significant increase in both tidal volume (72 ± 43% max change) and respiratory rate (29 ± 32% max change) (p < 0.0001). The change in ventilatory parameters did not relate to the % change R5 (Figure 2) or X5 across all subjects or in those that were EC positive (r < 0.4, p > 0.1). The ventilatory responses during and following exercise were similar between groups (Table 2).
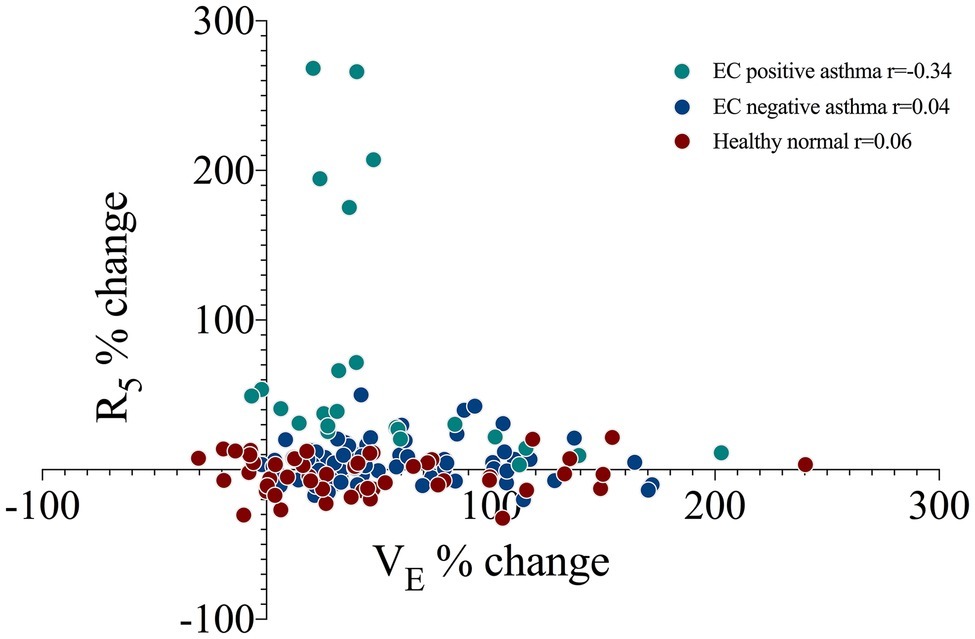
Figure 2. The correlation between minute ventilation (VE) and airway resistance at 5 Hz (R5) as a percent change from baseline at four sequential time points following an exercise challenge in 19 subjects with current asthma that responded by spirometry criteria (EC positive asthma, n = 5), did not respond (EC negative asthma, n = 14) and 10 healthy normals. r, Pearson’s correlation.
The sensitivity and specificity of R5 and X5 to detect a positive response to the EC as determined by FEV1 are presented in Figure 3. R5 had a sensitivity and specificity of 80 and 86%, X5 had a sensitivity and specificity of 80 and 93%, respectively. A cut-off of 27% increase in R5 and 47% decrease in X5 yielded optimal sensitivity and specificity for a positive response as detected using FEV1.
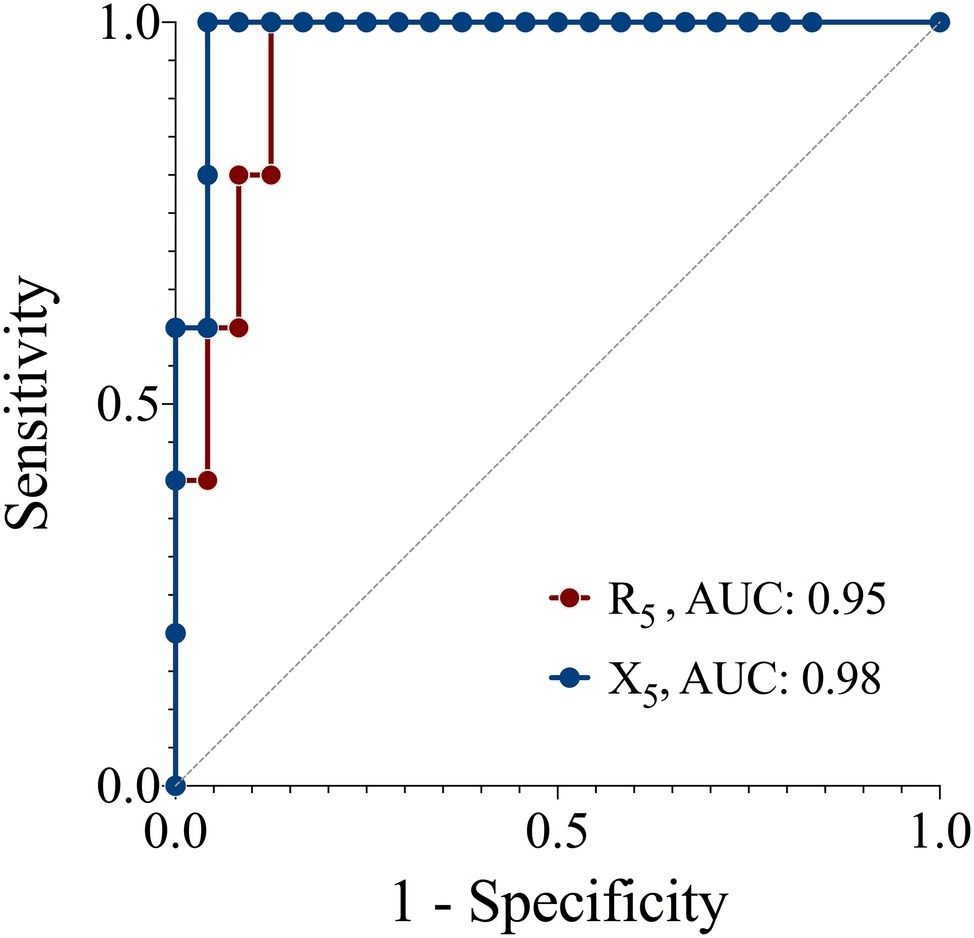
Figure 3. Receiver operator characteristic curves of the sensitivity and specificity of resistance (R5) and reactance (X5) at 5 z for detecting a positive response to an exercise challenge by spirometry criteria. Reference (solid line), AUC, area under the curve.
Discussion
In patients with asthma, measurement of respiratory system impedance using the FOT identified EIB during an exercise challenge when compared to the accepted FEV1 criteria. Furthermore, the change in resistance and reactance was not unduly influenced by the change in VE or respiratory rate following exercise. The results support the measurement of EIB in the laboratory using FOT as an alternative to spirometry.
The potential effect of raised respiratory rate or VE post exercise has not been previously addressed. Standard FOT measurement requires quiet spontaneous resting breathing at functional residual capacity (Oostveen et al., 2003), yet variable changes in this value post exercise and/or due to bronchoconstriction can potentially alter measures of impedance (Anderson et al., 1972; van den Elshout et al., 1990). A single previous publication reported similar strong agreement between spirometry and impedance measured with impulse oscillometry system in an uncontrolled group of adult subjects with probable EIB (Evans et al., 2005). We felt it important to determine any influence of alterations in VE, either via respiratory rate or tidal volume post EC, on repeated FOT measures. VE remained highly elevated following exercise during the data collection period, predominately from an expansion of tidal volume. This was similarly seen across groups of those with responsive asthma, non-responsive asthma and healthy controls. Reassuringly, there was no relationship between the FOT parameters of interest and VE, respiratory rate or tidal volume.
FOT is highly sensitive to changes in airway function during an exercise challenge test. The change in resistance and reactance following the EC predictably tracked with the change in FEV1. There was a clear separation in these measurements between subjects that were responsive according to the accepted FEV1 cut-off as compared to non-responsive asthma and control subjects. Indeed, both R5 and X5 were highly sensitive and specific for a positive EC. The optimal derived cut-offs for R5 and X5 to detect a 10% fall in FEV1 were 27 and 47%, respectively. Interestingly, these bronchoconstrictor cut-off values are similar in magnitude to previously published cut-offs for bronchodilator reversibility (32% change for R5 and 44% change for X5) (Oostveen et al., 2013).
The observation that changes in resistance related closely to changes in FEV1 is physiologically consistent since both measurements are influenced by airway caliber. Reactance, on the other hand, relates to the stiffness of the respiratory system as measured during tidal breathing and is dependent on the volume of accessible lung during the measurement (Milne et al., 2019). The development of bronchoconstriction during a challenge test results in a more heterogeneous lung with physiologically different lung units and more disparate time constants contributing to the overall impedance measured at the mouth. Hence, the more negative reactance that develops during challenge tests is likely a reflection of the narrowing and/or airway closure that develops in the distal airways.
The change in reactance and resistance during a challenge test provides physiologically relevant insights into airway behavior. It is noteworthy that reactance recovered faster than resistance or FEV1 post exercise. We hypothesize that this early recovery in X5 may reflect early functional recovery in the distal airway compartment before a measured improvement is seen in the indices that reflect more proximal airway caliber. The exact mechanisms are beyond the scope of this study but likely reflect a complex interaction of changes in the small airway caliber, altered transmural forces, and parenchymal tethering. Data collection in this study was terminated at 20-min post EC as recommended by clinical guidelines. Though not the primary objective of this study, a longer period may have allowed for further analysis of the time-dependent recovery of the various parameters.
Reassuringly, all subjects with a positive EC response using FEV1 criteria also exhibited a change using FOT. This indicates that FOT measurement can be safely performed during these tests without concerns for unrecognized bronchoconstriction.
There are some limitations to our study. Large variability was seen in the EC responders in R5 and X5; however, this was similarly observed with FEV1, and the changes were strongly correlated. As the EC is not a “dose response” challenge, inter-subject variability in airway response across a broad selection of subjects with “current asthma” is not unexpected (Anderson et al., 2010). The higher than ideal ambient humidity of the laboratory, though still within the acceptable range (Crapo et al., 2000), may have contributed to an underestimation of EIB. Nevertheless, this should not confound the current results since the analysis compared the various lung function parameters during the EC irrespective of the severity of EIB. The maximal inhalation required prior to the measurement of FEV1 can alter airway resistance, and it follows that FOT measured during tidal breathing may be more sensitive in detecting EIB. While FOT was measured prior to spirometry at all time points, it is important to repeat this study with and without FEV1 measurement as a validation study to determine repeatability of the test and confirm cut-off thresholds. Our cohort has small subject numbers, but the results are novel using a commercially available FOT device and suggest that FOT may be a clinically appropriate lung function measurement during a challenge test. Clearly, there is a need to derive clinically relevant cut points for more widespread uptake of FOT during challenge testing.
In conclusion, our results show that FOT measures detected bronchial reactivity to exercise as defined by a change in FEV1. Importantly, the FOT values are not confounded acutely by the raised minute ventilation post exercise. Hence, FOT measurement may be an alternative lung function test for the assessment of exercise-induced bronchoconstriction. It could be most useful in subjects who cannot perform spirometry to a satisfactory standard in the period after exercise or in whom deep breath-induced bronchoconstriction or bronchodilatation is problematic.
Data Availability Statement
The datasets generated for this study are available on request to the corresponding author.
Ethics Statement
The studies involving human participants were reviewed and approved by Sydney Local Health District Human Ethics Review Board. The patients/participants provided their written informed consent to participate in this study.
Author Contributions
LS and CF contributed conception and design of the study. LS and LB performed data collection. LS organized the database and performed the statistical analysis. LS and CF wrote the first draft of the manuscript. All authors contributed to manuscript revision, read and approved the submitted version.
Funding
Health and Safety Branch, Fire and Rescue New South Wales provided partial funding support. The conduct of the research and preparation of the article was independent from the funder.
Conflict of Interest
The authors declare that the research was conducted in the absence of any commercial or financial relationships that could be construed as a potential conflict of interest.
Abbreviations
EIB, exercise-induced bronchoconstriction; EC, exercise challenge test; FEV1, forced expiratory volume in 1 s; FOT, forced oscillation technique; R5, resistance at 5 Hz; VE, minute ventilation; X5, reactance at 5 Hz.
References
American Thoracic Society and European Respiratory Society (2005). ATS/ERS recommendations for standardized procedures for the online and offline measurement of exhaled lower respiratory nitric oxide and nasal nitric oxide, 2005. Am. J. Respir. Crit. Care Med. 171, 912–930. doi: 10.1164/rccm.200406-710ST
Anderson, S. D., Brannan, J., Spring, J., Spalding, N., Rodwell, L. T., Chan, K., et al. (1997). A new method for bronchial-provocation testing in asthmatic subjects using a dry powder of mannitol. Am. J. Respir. Crit. Care Med. 156, 758–765. doi: 10.1164/ajrccm.156.3.9701113
Anderson, S. D., and Kippelen, P. (2013). Assessment of EIB: what you need to know to optimize test results. Immunol. Allergy Clin. N. Am. 33, 363–380, viii. doi: 10.1016/j.iac.2013.02.006
Anderson, S. D., Mcevoy, J. D., and Bianco, S. (1972). Changes in lung volumes and airway resistance after exercise in asthmatic subjects. Am. Rev. Respir. Dis. 106, 30–37. doi: 10.1164/arrd.1972.106.1.30
Anderson, S. D., Pearlman, D. S., Rundell, K. W., Perry, C. P., Boushey, H., Sorkness, C. A., et al. (2010). Reproducibility of the airway response to an exercise protocol standardized for intensity, duration, and inspired air conditions, in subjects with symptoms suggestive of asthma. Respir. Res. 11:120. doi: 10.1186/1465-9921-11-120
Anderson, S. D., Schoeffel, R. E., Follet, R., Perry, C. P., Daviskas, E., and Kendall, M. (1982). Sensitivity to heat and water loss at rest and during exercise in asthmatic patients. Eur. J. Respir. Dis. 63, 459–471.
Crapo, R. O., Casaburi, R., Coates, A. L., Enright, P. L., Hankinson, J. L., Irvin, C. G., et al. (2000). Guidelines for methacholine and exercise challenge testing-1999. This official statement of the American Thoracic Society was adopted by the ATS Board of directors, July 1999. Am. J. Respir. Crit. Care Med. 161, 309–329. doi: 10.1164/ajrccm.161.1.ats11-99
Evans, T. M., Rundell, K. W., Beck, K. C., Levine, A. M., and Baumann, J. M. (2005). Airway narrowing measured by spirometry and impulse oscillometry following room temperature and cold temperature exercise. Chest 128, 2412–2419. doi: 10.1378/chest.128.4.2412
Joos, G. F., O'connor, B., Anderson, S. D., Chung, F., Cockcroft, D. W., Dahlen, B., et al. (2003). Indirect airway challenges. Eur. Respir. J. 21, 1050–1068. doi: 10.1183/09031936.03.00008403
Miller, M. R., Hankinson, J., Brusasco, V., Burgos, F., Casaburi, R., Coates, A., et al. (2005). Standardisation of spirometry. Eur. Respir. J. 26, 319–338. doi: 10.1183/09031936.05.00034805
Milne, S., Jetmalani, K., Chapman, D. G., Duncan, J. M., Farah, C. S., Thamrin, C., et al. (2019). Respiratory system reactance reflects communicating lung volume in chronic obstructive pulmonary disease. J. Appl. Physiol. 126, 1223–1231. doi: 10.1152/japplphysiol.00503.2018
Nathan, R. A., Sorkness, C. A., Kosinski, M., Schatz, M., Li, J. T., Marcus, P., et al. (2004). Development of the asthma control test: a survey for assessing asthma control. J. Allergy Clin. Immunol. 113, 59–65. doi: 10.1016/j.jaci.2003.09.008
Oostveen, E., Boda, K., Van Der Grinten, C. P., James, A. L., Young, S., Nieland, H., et al. (2013). Respiratory impedance in healthy subjects: baseline values and bronchodilator response. Eur. Respir. J. 42, 1513–1523. doi: 10.1183/09031936.00126212
Oostveen, E., Macleod, D., Lorino, H., Farre, R., Hantos, Z., Desager, K., et al. (2003). The forced oscillation technique in clinical practice: methodology, recommendations and future developments. Eur. Respir. J. 22, 1026–1041. doi: 10.1183/09031936.03.00089403
Parsons, J. P., Hallstrand, T. S., Mastronarde, J. G., Kaminsky, D. A., Rundell, K. W., Hull, J. H., et al. (2013). An official American Thoracic Society clinical practice guideline: exercise-induced bronchoconstriction. Am. J. Respir. Crit. Care Med. 187, 1016–1027. doi: 10.1164/rccm.201303-0437ST
Quanjer, P. H., Stanojevic, S., Cole, T. J., Baur, X., Hall, G. L., Culver, B. H., et al. (2012). Multi-ethnic reference values for spirometry for the 3-95-years age range: the global lung function 2012 equations. Eur. Respir. J. 40, 1324–1343. doi: 10.1183/09031936.00080312
Seccombe, L. M., Buddle, L., Brannan, J. D., Peters, M. J., and Farah, C. S. (2018). Exercise-induced bronchoconstriction with firefighting contained breathing apparatus. Med. Sci. Sports Exerc. 50, 327–333. doi: 10.1249/MSS.0000000000001424
van den Elshout, F. J., Van De Woestijne, K. P., and Folgering, H. T. (1990). Variations of respiratory impedance with lung volume in bronchial hyper reactivity. Chest 98, 358–364. doi: 10.1378/chest.98.2.358
Keywords: airway resistance, exercise-induced bronchoconstriction, airway reactance, asthma, respiratory function
Citation: Seccombe LM, Peters MJ, Buddle L and Farah CS (2019) Exercise-Induced Bronchoconstriction Identified Using the Forced Oscillation Technique. Front. Physiol. 10:1411. doi: 10.3389/fphys.2019.01411
Edited by:
Peter Michael Lalley, University of Wisconsin School of Medicine and Public Health, United StatesReviewed by:
Karen Peebles, Macquarie University, AustraliaIliya Amaza, The University of Iowa, United States
Copyright © 2019 Seccombe, Peters, Buddle and Farah. This is an open-access article distributed under the terms of the Creative Commons Attribution License (CC BY). The use, distribution or reproduction in other forums is permitted, provided the original author(s) and the copyright owner(s) are credited and that the original publication in this journal is cited, in accordance with accepted academic practice. No use, distribution or reproduction is permitted which does not comply with these terms.
*Correspondence: Leigh M. Seccombe, bGVpZ2guc2VjY29tYmVAaGVhbHRoLm5zdy5nb3YuYXU=; bGVpZ2guc2VjY29tYmVAc3N3YWhzLm5zdy5nb3YuYXU=