 Nobuyuki Kudomi1,2
 Kari K. Kalliokoski1
 Vesa J. Oikonen1Chunlei Han1
 Jukka Kemppainen1,3Hannu T. Sipilä1Juhani Knuuti1,3
 Ilkka H. A. Heinonen1,3,4*
- 1Turku PET Centre, University of Turku, Turku, Finland
- 2Department of Medical Physics, Faculty of Medicine, Kagawa University, Kagawa, Japan
- 3Department of Clinical Physiology and Nuclear Medicine, University of Turku and Turku University Hospital, Turku, Finland
- 4Rydberg Laboratory of Applied Sciences, University of Halmstad, Halmstad, Sweden
Aims: Simultaneous measurement of right (RV) and left ventricle (LV) myocardial blood flow (MBF), oxygen extraction fraction (OEF), and oxygen consumption (MVO2) non-invasively in humans would provide new possibilities to understand cardiac physiology and different patho-physiological states.
Methods: We developed and tested an optimized novel method to measure MBF, OEF, and MVO2 simultaneously both in the RV and LV free wall (FW) using positron emission tomography in healthy young men at rest and during supine bicycle exercise.
Results: Resting MBF was not significantly different between the three myocardial regions. Exercise increased MBF in the LVFW and septum, but MBF was lower in the RV compared to septum and LVFW during exercise. Resting OEF was similar between the three different myocardial regions (~70%) and increased in response to exercise similarly in all regions. MVO2 increased approximately two to three times from rest to exercise in all myocardial regions, but was significantly lower in the RV during exercise as compared to septum LVFW.
Conclusion: MBF, OEF, and MVO2 can be assessed simultaneously in the RV and LV myocardia at rest and during exercise. Although there are no major differences in the MBF and OEF between LV and RV myocardial regions in the resting myocardium, MVO2 per gram of myocardium appears to be lower the RV in the exercising healthy human heart due to lower mean blood flow. The presented method may provide valuable insights for the assessment of MBF, OEF and MVO2 in hearts in different pathophysiological states.
Introduction
Myocardial blood flow (MBF), oxygen extraction fraction (OEF) and metabolic rate of oxygen (MVO2) may be non-invasively assessed using 15O-water (O) and 15O-oxygen (15O2) with positron emission tomography (PET) (Iida et al., 1988, 1991, 1992, 1996; Yamamoto et al., 1996; Hermansen et al., 1998). The technique used for MBF and MVO2 calculation utilizes the single tissue compartment model, and its validity has been confirmed in several studies (Huang et al., 1985; Iida et al., 1988, 1991, 1992, 1996, 2000a; Yamamoto et al., 1996; Hermansen et al., 1998; Choi et al., 1999; Watabe et al., 2005). A unique feature of this technique is that the model incorporates the concept of the perfusable tissue fraction (PTF), which allows correction in MBF and thus also in MVO2 computation for partial volume effect (PVE) due to cardiac wall motion and the thin ventricular wall relative to the intrinsic spatial resolution of a PET scanner used (Iida et al., 1988, 1991).
For the left ventricle (LV) myocardium, validated techniques have been published to measure MBF and PTF applying dynamic O PET scan (Watabe et al., 2005). The MBF measurements of the right ventricle (RV) are challenging with all imaging techniques due to complex shape of the chamber, thin wall, and its rapid motion. A technique to obtain non-invasive and direct measurement of quantitative MBF, PTF, and subsequent OEF and MVO2 in the RV together with the LV would be of importance, as it could for instance open up new insights for the evaluation of initiation, progression, and effectiveness of the treatments of various pathological states that not only affect LV but also often the RV (Voelkel et al., 2006). RV coronary perfusion and oxygen consumption are the major determinants of its function (Voelkel et al., 2006), and to the best of our knowledge MBF, OEF, and MVO2 in the human RV have been measured only in pulmonary hypertensive patients (Bokhari et al., 2011; Wong et al., 2011a,b,c), but never in healthy human subjects and also never simultaneously compared against to those of LV. Furthermore, in previous studies analyses to estimate RV blood curve were performed without corrections for PVE and spillover from surrounding myocardium to cavity (Wong et al., 2011a,b,c), which would be critical sources of possible errors.
Along these lines, the present study aimed to measure MBF, OEF and MVO2 in healthy human subjects in LV and RV myocardia simultaneously at rest and during exercise by developing a novel analysis method, which allows simultaneous computation of MBF and PTF in RV as well as LV walls from dynamic O PET scan data and also to measure OEF and MVO2 from steady-state 15O2 scan data. Validity of the present method was tested by (1) comparing quantitative MBF values with those by the previous method which applied RV region of interest (ROI) based time activity curve (TAC) instead of RV blood TAC (Hermansen et al., 1998), (2) comparing MBF value in LV free wall (FW) myocardium at rest with during supine cycling exercise conditions, and (3) comparing PTF obtained from O scan data with myocardial extravascular density from transmission scan data (Iida et al., 2000b). The validity was additionally tested by (4) comparing LV and RV blood volume values obtained from the O and from C15O scan data.
Materials and Methods
RV Blood TAC Formula
To obtain the RV blood TAC, two factors of PVE in RV region of interest (ROI) TAC and spill-over effect from surrounding myocardial wall and adjacent organs are required to be corrected. Similar to the formulation for LV blood TAC, CA, L(t) (Iida et al., 1988), the formula for venous blood TAC in right ventricle, CV, R(t), was obtained as Equation (5) in the section Appendix A.
Subjects
Healthy young men (n = 15, age 30 ± 5 years, height 179 ± 5 cm, weight 75 ± 7 kg, and maximal oxygen consumption 40 ± 5 mL/kg/min) were studied. The subjects were healthy as determined by health questionnaire and physical examination by a doctor in addition to pre-ECG and cardiac echocardiography evaluation. The subjects were not under any medication and were normotensive non-smokers with no history of hypercholesterolemia and no family history of coronary disease. The purpose, nature and potential risks were verbally explained to the subjects before they gave their written informed consent to participate. The study was performed according to the Declaration of Helsinki and was approved by the Ethical Committee of the Hospital District of South-Western Finland.
PET Experiments
PET acquisition was carried out in 2D mode. The PET methods and protocols are explained in detail in our previous study (Heinonen et al., 2014). Briefly, after the transmission scan, scans were undertaken with O bolus injection, C15O inhalation, and 15O2 continuous inhalation at the resting condition. Then, during exercise with supine cycling (100 Watts), scans with those were repeated. Due to problems in 15O2 or C15O tracer production, three subjects were missing the 15O2 or C15O scans and the present data are reported in 12 subjects.
Data Processing
Images were reconstructed by the OSEM method using a Hann filter with a cut-off frequency of 4.6 mm. All data sets for same subjects were resliced using the same set of parameters. ROIs were drawn on LV and RV regions and LV and RV ROI TACs were obtained. ROIs for the left ventricle free wall (LVFW), septum and RV wall were also drawn and their TACs were extracted. Then the LV blood TAC, CA, L(t), was estimated using the previous method [Equation (3) in the section Appendix A] (Iida et al., 1988). The RV blood curve, CV, R(t), was estimated by using the present developed formulae [Equation (5) in the section Appendix A].
To generate MBF, PTF, and VB, L and VB, R images with Equation (7) in the section Appendix B, we applied obtained CA, L(t) and CV, R(t): N-method, thus those allow correction for spillover into the LV and RV myocardial walls (Hermansen et al., 1998). Details of the computation method are described in the section Appendix B. Also, the RV ROI curve instead of CV, R(t) was used for computing the those images: H-method (Hermansen et al., 1998). The blood volume image (VB) was also computed using the C15O scan data. The extravascular tissue density (Dev) [Equation (8) in the section Appendix B] (Iida et al., 1992), and perfusable tissue index (PTI) (Iida et al., 1992; Silva et al., 1992; Herrero et al., 1995), are computed using the VB and reconstructed transmission image data. Using the obtained MBF and PTF, then, OEF and MVO2 in the LVFW, septal and RV wall regions were computed by applying the previously developed formulae (Iida et al., 1996; Yamamoto et al., 1996; Lubberink et al., 2010; Heinonen et al., 2014).
Statistical Analysis
Data are shown as mean ± SD across subjects. The Student's paired t-test was used for the comparison of changes in basic hemodynamical variables from rest to exercise, and comparison between N- and H-methods. Two-way ANOVA for repeated measures was performed to assess the effects of exercise and regional differences in myocardial circulatory variables.
Results
Basic hemodynamic variables at rest and during exercise are shown in Table 1. Exercise increased heart rate, systolic blood pressure, diastolic blood pressure, and thus as a result also the mean arterial pressure and rate pressure product.
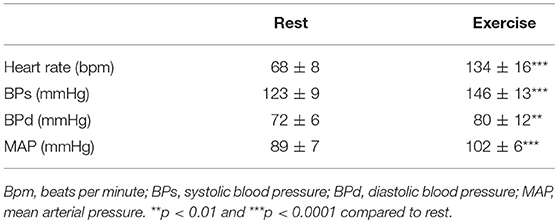
Table 1. Hemodynamical variables at rest and during exercise obtained simultaneously with PET scanning.
Figure 1 shows representative TACs from LV and RV chamber regions, LV and RV myocardial regions, and estimated CA, L(t) and CV, R(t), respectively. The TACs in the right regions appear earlier than those in the left, reflecting that O was infused into vein and thus firstly passed through RV and then continue via pulmonary circulation into LV. The estimated RV blood curve, CV, R(t), is higher in scale and less dispersed than left one, CA, L(t).
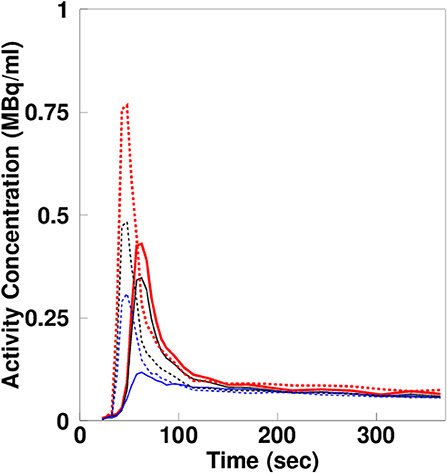
Figure 1. Estimated left and right ventricle blood curves, extracted left and right ventricle curves, and left and right myocardial activity curves.
Figure 2 shows a representative view of MBF in one of the subjects at the resting condition by the N- and H-methods. The MBF in LVFW, septal and RV walls can be seen in the figure, and the shape and contrast are similar in the LV region between N- and H-methods. Figure 3 compares PTF images by the N- and H-methods, and Dev image. The LVFW, septal and RV wall can be seen in the images, and in LVFW region, the shape and contrast are similar to those by the H-method, and in RV wall PTF seems lower in H-method. Also, shape in PTF is similar to the Dev image. Blood volume images are shown in Figure 4. The left and right ventricle regions are clearly separated in VB, L and VB, R images. The VB, L+VB, R image by the N-method is similar to the VB image by the C15O scan method, however, that seems higher in RV region in the H-method.
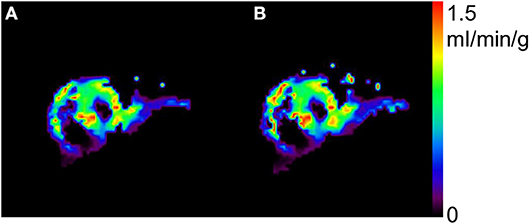
Figure 2. Representative view of myocardial blood flow by the present N- (A) and previous H-methods (B).
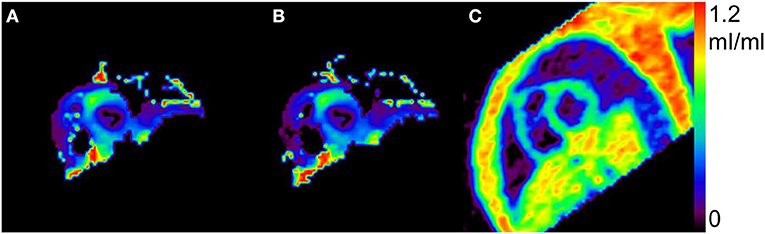
Figure 3. Representative view of perfusable tissue fraction by the present N- (A), the previous H-methods (B), and extravascular tissue density Dev (C).
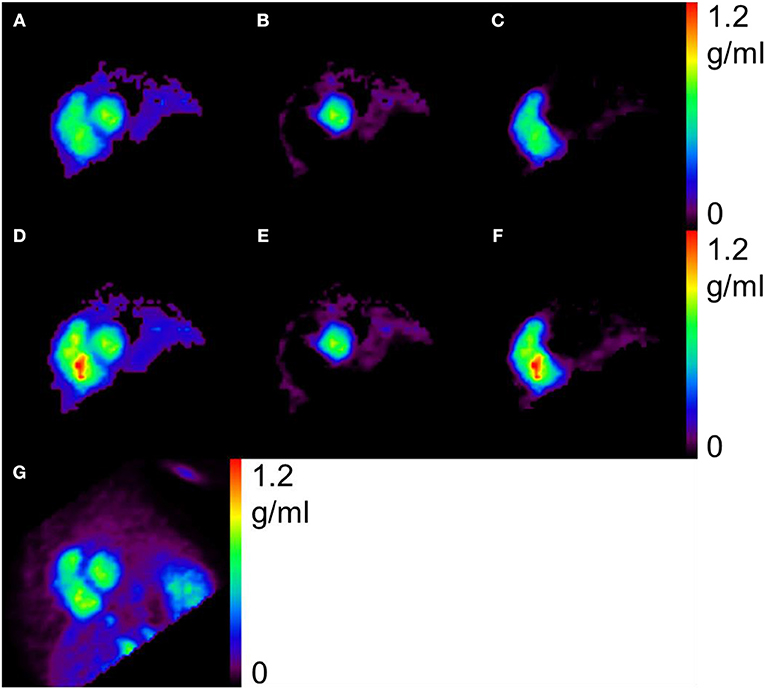
Figure 4. Representative view of blood volume, by the present N- (A–C), the previous H-methods (D–F), and C15O scan (G). The left (B,E) and right (C,F) ventricles are clearly separated and the blood volume (A) as a sum of (B) and (C) is similar to that by the C15O scan (G).
Quantitative values of MBF, PTF, Dev, and PTI are summarized in Table 2, those of blood volumes are in Table 3, and OEF and MVO2 in Table 4. The MBF and PTF values based on the N- and H-methods were not significantly different in any of the myocardial regions. There were however significant differences between PTF and Dev for all regions. Regression analysis showed however correlation between PTF and Dev for all LVFW (r = 0.71, P < 0.001), septum (r = 0.72, P < 0.001) and RV wall (r = 0.67, P < 0.001) (Figure 5. The corresponding PTI values in resting condition were between 0.6–0.7. For the blood volume values, there were no significant differences between N-method and C15O scan method, either in LV and RV (Table 3).
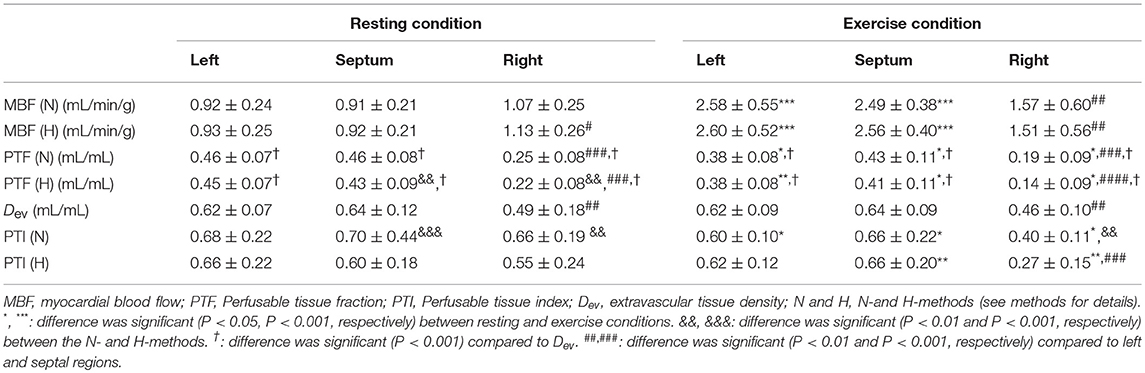
Table 2. Parameters in myocardial region calculated using the N- and H-methods (n = 12).
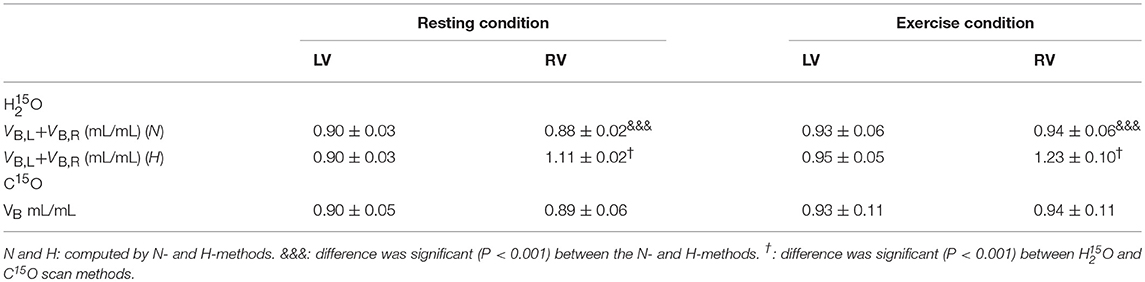
Table 3. Blood volume values in ventricle region estimated from the present N- and H- methods, and the C15O scan method (n = 12).
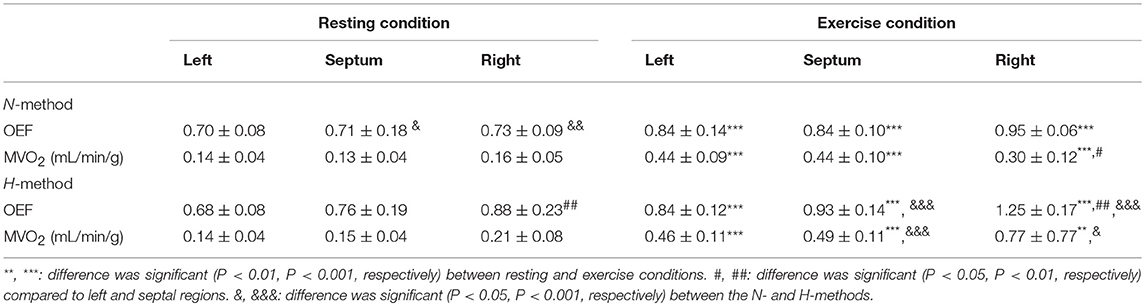
Table 4. Oxygen extraction fraction (OEF) and myocardial oxygen consumption (MVO2) in different myocardial regions calculated using the N- and H-methods (n = 12).
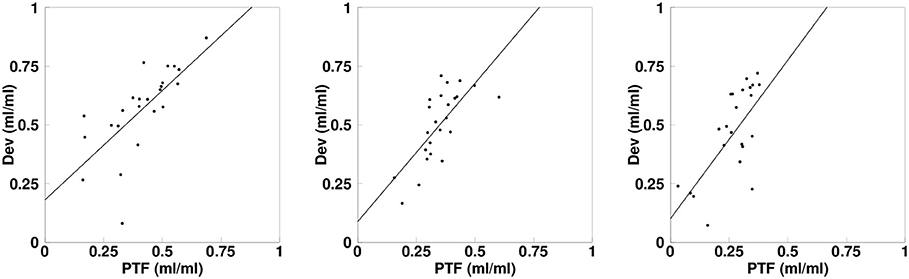
Figure 5. Linear regressions depicting the correlation between the perfusable tissue fraction (PTF) and the extravascular tissue density (Dev) values for LV (L), septum (S), and RV (R). The solid lines show the regressions.
The MBF was similar in all myocardial regions at rest based on the newly developed N-method. Exercise increased MBF significantly in the LVFW and septum, but MBF was significantly lower in the RV as compared to the LVFW and the septum (Table 2). Resting OEF was similar in all regions (Table 4) and OEF increased in response to exercise in all regions being the highest in the RV wall (Table 4). MVO2 increased two to three times from rest to exercise, but MVO2 was significantly lower in the RV as compared to the two other myocardial regions during exercise (Table 4). Finally, myocardial vascular resistance decreased from rest to exercise in all ventricular regions (P = 0.01), but was always higher in the RV (127 ± 37 at rest and 109 ± 96 mmHg/mL/min/g during exercise) compared to the LVFW myocardium (101 ± 25 at rest and 61 ± 32 mmHg/mL/min/g during exercise, P = 0.010) and the septum (95 ± 19 at rest and 72 ± 39 mmHg/mL/min/g during exercise, P = 0.015), which did not differ from each other (P = 0.99).
Discussion
In the present study, we developed and tested a method which allowed estimating RV blood TAC with taking into account PVE and spillover effect, to simultaneously generate quantitative MBF and PTF images for RV and LV myocardial regions using O PET data. Subsequently, OEF and MVO2 were computed using 15O2 PET data applying the obtained MBF and PTF. The present result showed that the MBF values estimated were similar between the present N-method and the previously established H-method (Hermansen et al., 1998). The obtained PTF values by the N-method were also similar to those analyzed by the H-method (Hermansen et al., 1998). Comparison in PTF and Dev by the regression analysis showed tight correlations for all LVFW, septal and RV myocardial regions. The obtained blood volume values were not significantly different neither in LV nor RV between by the present N-method and the CO scan method. These findings suggest that the MBF and MVO2 values for both RV and LV myocardial regions are feasible to quantify and assess by the present method, and as such, the method could provide valuable insights for several cardiovascular disease states that affect either both, or primarily the right ventricle (Mertens and Friedberg, 2010).
In the present study, the obtained MBF values by the N-method were similar to those analyzed by the H-method (Hermansen et al., 1998), and similar also to the previously obtained mean values ranging from 0.8 to 1.2 mL/min/g in resting condition (Huang et al., 1985; Iida et al., 1988, 1991, 1992, 1996; Silva et al., 1992; Hermansen et al., 1998; Lubberink et al., 2010). Those results indicate the validity of the present MBF computation technique. The obtained PTF values by the N-method in the LVFW were also similar to those analyzed by the H-method (Hermansen et al., 1998). For the septal and RV wall region, the PTF values were slighty lower in the H-method but especially as compared to Dev (Table 2). The difference was likely due to the difference of height between in RV blood TAC and in RV ROI TAC as shown in Figure 1. RV blood TAC was estimated with taking into account PVE and spillover effect from RV ROI TAC and was thus higher than RV ROI TAC. When RV ROI TAC was applied for the computation, blood volume in the RV was overestimated, being >1.0 mL/mL and was significantly higher than that obtained by the CO scan method. Subsequently, the subtraction on RV blood TAC in RV wall region was excessive, and therefor PTF estimated was smaller. Then the estimated OEF was higher than one in the H-method, which is not physiological. The present N-method OEF and MVO2 values for the RV myocardium were computed along with the previously demonstrated method developed for LV with applying MBF and PTF (Iida et al., 1996; Yamamoto et al., 1996), implementing correction for the PVE and spillover effect due to cardiac and respiratory motion, and the thin ventricular wall relative to the intrinsic spatial resolution of a PET scanner used (Iida et al., 1988, 1991). Those facts suggest that when quantitatively imaging the MBF, OEF, and MVO2 in myocardial region, it would be critical to apply the PVE and spillover effect correction to obtain RV blood curve.
PTF values in the LVFW and septal walls obtained in the study were smaller than those in the previous studies (Iida et al., 1991, 1992, 1996; Hermansen et al., 1998) This could be due to different size of ROI drawn on those regions, namely we intentionally drawn larger size of ROI in LV region in this study for validating MBF computation method in thinner RV wall. When we drew smaller size of ROI in septum region, PTF values estimated were 0.74 ± 0.08 mL/mL which is similar to the previous studies (Iida et al., 1991, 1992, 1996; Hermansen et al., 1998). Comparison in PTF and Dev by the regression analysis however showed tight correlations for all LVFW, septal and RV wall: r = 0.87, r = 0.67, and r = 0.56, respectively. The PTF estimates density of myocardium and thus allows the partial volume correction. The Dev is also a measure of density of myocardium [Equation (8) in the section Appendix B] (Iida et al., 1991). We found, however, a significant difference between PTF and Dev, and that the PTI values, which is ratio between them (Iida et al., 1991; Silva et al., 1992; Herrero et al., 1995), were not close to 1.0 but around 0.7. A previous simulation study demonstrated that the decrease of PTI from 1 to 0.75 is due to heterogeneity and shape of input function (Herrero et al., 1995). As mentioned, the size of ROI in the present study was larger and this could have enhanced the degree of heterogeneity. Those factors may affect the present PTI values to be smaller than 1. As a whole, however, the tight regional correlations and smaller value of PTI identical to the previous demonstration suggest quantitative accuracy of the present approach (Herrero et al., 1995).
For the quantitative computation of MBF in the RV myocardium, application of the RV blood TAC after spillover and PVE correction was crucial and the model for the RV blood TAC was obtained by remodeling the previous method for the LV (Iida et al., 1992). The validity of the RV blood TAC was tested by comparing generated VB in addition to MBF, and PTF as above. Blood volume in both ventricular regions can be feasibly obtained by the C15O scan data (Watabe et al., 2005), and that was also estimated using the O scan analysis by Harms et al. (2011). We also estimated the blood volume from the O scan data in both LV and RV to test the validity of the present method for the RV blood TAC by comparing the volume between the two O and C15O methods. The obtained blood volume values were not significantly different neither in LV nor RV. The LV and RV were clearly separated in the generated VB, L and VB, R images, suggesting reliability of the estimated RV blood TAC. A possible method to obtain the right blood TAC could be to use the RV ROI TAC (Hermansen et al., 1998), however, estimated blood volume in RV was significantly larger than that by the CO scan method, and furthermore the values were larger than 1 mL/mL (Table 3; Figure 3). Those also suggest that PVE correction is critical for the RV blood TAC, as far as a PET scanner with high spatial resolution is not used (Mertens and Friedberg, 2010).
Physiological Considerations
It is very important to make it possible to measure RV myocardial parameters such as MBF, OEF and MVO2 non-invasively, because they are major determinant of RV function (Klima et al., 1999), which in turn is compromised in many patophysiological states (Voelkel et al., 2006). Based on the animal studies, RV MBF is typically 50–90% lower than that in the LV (Zong et al., 2005). In resting swine whose heart would be the closest to human heart, RV MBF is 70–90% of LV MBF (Duncker and Bache, 2008). However, our present PET MBF findings suggest that RV blood flow in humans is similar to that in the LV and septum. However, largely based on canine studies, but also one swine study (Schwartz et al., 1994), one feature of the RV myocardium compared to left one has been considered to be its markedly lower oxygen extraction fraction (40–50%) and subsequent metabolic rate (Klima et al., 1999; Zong et al., 2005; Duncker and Bache, 2008). In contrast, we observed that RV myocardial OEF tended to be higher than that in the LV, especially during exercise. Species difference is the most likely explanation for this difference. In fact, one previous human PET study has already reported that RV myocardial oxygen extraction appears to be much higher than observed in animals (Wong et al., 2011b), although that study was performed in pulmonary hypertensive patients and not in healthy human subjects. The current study reports for the first time that the normal myocardial oxygen extraction might be higher in healthy humans than previously found in animal studies.
It is well-established that RV MBF increases during exercise as a direct function of heart rate (Klima et al., 1999; Zong et al., 2005). In animal studies it has been found that RV MBF increases relatively more and can even exceed MBF in the LV at heavy exercise, as oxygen consumption increases relatively more secondary to the marked increase in pulmonary artery pressure close to maximal exercise intensity (Klima et al., 1999; Duncker and Bache, 2008). However, at lower exercise intensities, as also applied in the present study, pulmonary pressure remains close to resting values, while LV systolic pressure increases. Theoretically, this physiological background could lead to the situation that MBF, OEF as well as MVO2 increase relatively more in the LV than in septal and RV myocardial regions. Interestingly, in accordance with this idea we found in the present study that MVO2 computed by the newly developed N-method was significantly lower in the RV during exercise as compared to LVFW and septum, due to its lower blood flow. This is also in line with animal studies in which blunted RV myocardial blood flow response and large enhancement in oxygen extraction and consumption has been observed in response to exercise (Klima et al., 1999; Duncker and Bache, 2008). This has been at least in part explained by exaggerated α-adrenergic vasoconstrictor influence on the right ventricular vasculature (Klima et al., 1999). Interestingly, we also found in the present study that myocardial vascular resistance was higher in the RV compared to both LV and septal myocardia, which together with lower blood flow and resulting higher myocardial blood mean transit time is plausible mechanism to contribute to higher oxygen extraction in RV especially during exercise (Heinonen et al., 2014). Altogether, as the direct sampling of oxygen content in human RV myocardium is extremely difficult, the present technique would allow unique access to evaluate human RV blood flow and metabolic demand quantitatively, and has potential to provide mechanistic insights to numerous pathological states in terms of right ventricle (Iida et al., 2000b; Voelkel et al., 2006).
Limitations
Due to the large amount of variables and methods comparisons and thus analyses burden to obtain even these results, only one researcher observed and analyzed the images. Thus, no intra- or inter-observer variation was documented in the present study, which should be addressed in the future studies. Further, no comprehensive echocardiographic analyses were also performed in the current study. Information of especially RV wall thicknesses could provide further insights especially in the pathophysiological states on the relation of structural aspects with these PET-derived circulatory and oxygen metabolism related variables.
Summary and conclusions
In conclusion, this study presents a method to obtain MBF image, and OEF and MVO2 values simultaneously for both LV and RV myocardia using O and 15O2 tracers and PET imaging. In addition we showed that the method developed was feasible in quantitative assessment of MBF, OEF and MVO2 in humans, at rest and physiologically challenging exercise condition. As such, the application of the method and model could provide valuable insights for the assessments of perfusion and various pathological states affecting RV (Mertens and Friedberg, 2010), such as in pulmonary hypertension, which possesses great challenges for the right ventricle.
Ethics Statement
This study was carried out in accordance with recommendations of Ethics Committee of Hospital District of South-West Finland with written informed consent from all subjects. All subjects gave written informed consent in accordance with the Declaration of Helsinki. The protocol was approved By the Ethics Committee of the Hospital District of South-West Finland.
Author Contributions
All authors listed have made a substantial, direct and intellectual contribution to the work, and approved it for publication.
Funding
The study was conducted within the Center of Excellence in Molecular Imaging in Cardiovascular and Metabolic Research supported by the Academy of Finland, University of Turku, Turku University Hospital and Abo Academy. The study was further supported by grants from Sigrid Juselius Foundation and JSPS KAKENHI (C), Grant Number 26460728 2014–2016 (NK), The Finnish Cardiovascular Foundation, and The Finnish Diabetes Research Foundation.
Conflict of Interest Statement
The authors declare that the research was conducted in the absence of any commercial or financial relationships that could be construed as a potential conflict of interest.
Acknowledgments
We thank the technical staff of the Turku PET Center for the efforts and skills dedicated to this project.
Supplementary Material
The Supplementary Material for this article can be found online at: https://www.frontiersin.org/articles/10.3389/fphys.2019.00741/full#supplementary-material
References
Boellaard, R., Knaapen, P., Rijbroek, A., Luurtsema, G. J., and Lammertsma, A. A. (2005). Evaluation of basis function and linear least squares methods for generating parametric blood flow images using 15O-water and Positron Emission Tomography. Mol. Imaging Biol. 7, 273–285. doi: 10.1007/s11307-005-0007-2
Bokhari, S., Raina, A., Rosenweig, E. B., Schulze, P. C., Bokhari, J., Einstein, A. J., et al. (2011). PET imaging may provide a novel biomarker and understanding of right ventricular dysfunction in patients with idiopathic pulmonary arterial hypertension. Circ. Cardiovasc. Imaging 4, 641–647. doi: 10.1161/CIRCIMAGING.110.963207
Choi, Y., Huang, S. C., Hawkins, R. A., Kim, J. Y., Kim, B. T., Hoh, C. K., et al. (1999). Quantification of myocardial blood flow using 13N-ammonia and PET: comparison of tracer models. J. Nucl. Med. 40, 1045–1055.
Duncker, D. J., and Bache, R. J. (2008). Regulation of coronary blood flow during exercise. Physiol. Rev. 88, 1009–1086. doi: 10.1152/physrev.00045.2006
Harms, H. J., de Haan, S., Knaapen, P., Allaart, C. P., Lammertsma, A. A., and Lubberink, M. (2011). Parametric images of myocardial viability using a single 15O-H2O PET/CT scan. J. Nucl. Med. 52, 745–749. doi: 10.2967/jnumed.110.085431
Heinonen, I., Kudomi, N., Kemppainen, J., Kiviniemi, A., Noponen, T., Luotolahti, M., et al. (2014). Myocardial blood flow and its transit time, oxygen utilization, and efficiency of highly endurance-trained human heart. Basic Res. Cardiol. 109:413. doi: 10.1007/s00395-014-0413-1
Hermansen, F., Rosen, S. D., Fath-Ordoubadi, F., Kooner, J. S., Clark, J. C., Camici, P. G., et al. (1998). Measurement of myocardial blood flow with oxygen-15 labelled water: comparison of different administration protocols. Eur. J. Nucl. Med. 25, 751–759. doi: 10.1007/s002590050279
Herrero, P., Staudenherz, A., Walsh, J. F., Gropler, R. J., and Bergmann, S. R. (1995). Heterogeneity of myocardial perfusion provides the physiological basis of perfusable tissue index. J. Nucl. Med. 36, 320–327.
Huang, S. C., Schwaiger, M., Carson, R. E., Carson, J., Hansen, H., Selin, C., et al. (1985). Quantitative measurement of myocardial blood flow with oxygen-15 water and positron computed tomography: an assessment of potential and problems. J. Nucl. Med. 26, 616–625.
Iida, H., Kanno, I., Takahashi, A., Miura, S., Murakami, M., Takahashi, K., et al. (1988). Measurement of absolute myocardial blood flow with O and dynamic positron-emission tomography strategy for quantification in relation to the partial-volume effect. Circulation 78, 104–115. doi: 10.1161/01.CIR.78.1.104
Iida, H., Rhodes, C. G., Araujo, L. I., Yamamoto, Y., Silva, R., Maseri, A., et al. (1996). Noninvasive quantification of regional myocardial metabolic rate for oxygen by use of 15O2 inhalation and positron emission tomography. Theory, error analysis, and application in humans. Circulation 94, 792–807. doi: 10.1161/01.CIR.94.4.792
Iida, H., Rhodes, C. G., Silva, R., Yamamoto, Y., Araujo, L. I., Maseri, A., et al. (1991). Myocardial tissue fraction: correction for partial volume effects and measure of tissue viability. J. Nucl. Med. 32, 2169–2175.
Iida, H., Rhodes, G. C., Silva, R., Araujo, L. I., Bloomfield, P., Lammertsma, A. A., et al. (1992). Use of the left ventricular time-activity curve as a noninvasive input function in dynamic oxygen-15-water positron emission tomography J. Nucl. Med. 33, 1669–1677.
Iida, H., Tamura, Y., Kitamura, K., Bloomfield, P. M., Eberl, S., and Ono, Y. (2000b). Histochemical correlates of 15O-water-perfusable tissue fraction in experimental canine studies of old myocardial infarction. J. Nucl. Med. 41, 1737–1745.
Iida, H., Yokoyama, I., Agostini, D., Banno, T., Kato, T., Ito, K., et al. (2000a). Quantitative assessment of regional myocardial blood flow using oxygen-15-labelled water and positron emission tomography: a multicentre evaluation in Japan. Eur. J. Nucl. Med. 27, 192–201. doi: 10.1007/s002590050026
Klima, U. P., Guerrero, J. L., and Vlahakes, G. J. (1999). Myocardial perfusion and right ventricular function. Ann. Thorac. Cardiovasc. Surg. 5, 74–80.
Koeppe, R. A., Holden, J. E., and Ip, W. R. (1985). Performance comparison of parameter estimation techniques for the quantitation of local cerebral blood flow by dynamic positron computed tomography. J. Cereb. Blood Flow Metab. 5, 224–234. doi: 10.1038/jcbfm.1985.29
Lubberink, M., Harms, H. J., Halbmeijer, R., de Haan, S., Knaapen, P., and Lammertsma, A. A. (2010). Low-dose quantitative myocardial blood flow imaging using 15O-water and PET without attenuation correction. J. Nucl. Med. 51, 575–580. doi: 10.2967/jnumed.109.070748
Mertens, L. L., and Friedberg, M. K. (2010). Imaging the right ventricle–current state of the art. Nat. Rev. Cardiol. 7, 551–563. doi: 10.1038/nrcardio.2010.118
Schwartz, G. G., Greyson, C. R., Wisneski, J. A., Garcia, J., and Steinman, S. (1994). Relation among regional O2 consumption, high-energy phosphates, and substrate uptake in porcine right ventricle. Am. J. Physiol. 266, H521–H530. doi: 10.1152/ajpheart.1994.266.2.H521
Silva, R., Yamamoto, Y., Rhodes, C. G., Iida, H., Nihoyannopoulos, P., Davies, G. J., et al. (1992). Preoperative prediction of the outcome of coronary revascularization using positron emission tomography. Circulation 86, 1738–1742. doi: 10.1161/01.CIR.86.6.1738
Voelkel, N. F., Quaife, R. A., Leinwand, L. A., Barst, R. J., McGoon, M. D., Meldrum, D. R., et al. (2006). Right ventricular function and failure: report of a National Heart, Lung, and Blood Institute working group on cellular and molecular mechanisms of right heart failure. Circulation 114, 1883–1891. doi: 10.1161/CIRCULATIONAHA.106.632208
Watabe, H., Jino, H., Kawachi, N., Teramoto, N., Hayashi, T., Ohta, Y., et al. (2005). Parametric imaging of myocardial blood flow with 15O-water and PET using the basis function method. J. Nucl. Med. 46, 1219–1224.
Wong, Y. Y., Raijmakers, P. G., Knaapen, P., Lubberink, M., Ruiter, G., Marcus, J. T., et al. (2011c). Supine-exercise-induced oxygen supply to the right myocardium is attenuated in patients with severe idiopathic pulmonary arterial hypertension. Heart 97, 2069–2074. doi: 10.1136/heartjnl-2011-300237
Wong, Y. Y., Ruiter, G., Lubberink, M., Raijmakers, P. G., Knaapen, P., Marcus, J. T., et al. (2011b). Right ventricular failure in idiopathic pulmonary arterial hypertension is associated with inefficient myocardial oxygen utilization. Circ. Heart Fail. 4, 700–706. doi: 10.1161/CIRCHEARTFAILURE.111.962381
Wong, Y. Y., Westerhof, N., Ruiter, G., Lubberink, M., Raijmakers, P., Knaapen, P., et al. (2011a). Systolic pulmonary artery pressure and heart rate are main determinants of oxygen consumption in the right ventricular myocardium of patients with idiopathic pulmonary arterial hypertension. Eur. J. Heart Fail. 13, 1290–1295. doi: 10.1093/eurjhf/hfr140
Yamamoto, Y., Silva, R., Rhodes, C. G., Iida, H., Lammertsma, A. A., Jones, T., et al. (1996). Noninvasive quantification of regional myocardial metabolic rate of oxygen by 15O2 inhalation and positron emission tomography. Experimental validation. Circulation 94, 808–816. doi: 10.1161/01.CIR.94.4.808
Zong, P., Tune, J. D., and Downey, H. F. (2005). Mechanisms of oxygen demand/supply balance in the right ventricle. Exp. Biol. Med. 230, 507–519. doi: 10.1177/153537020523000801
Glossary
MBF Myocardial blood flow
OEF Oxygen extraction fraction
MVO2 Metabolic rate of oxygen
PET Positron emission tomography
H215O 15O labeled water
15O2 15O labeled oxygen
PTF perfusable tissue fraction
PVE partial volume effect
LV Left ventricle
FW Free wall
LVFW Left ventricle free wall
ROI region of interest
TAC time activity curve
N-method a method for RV-MBF computation developed in the present study
H-method a method for RV-MBF computation developed in the previous study (Hermansen et al., 1998)
CA,L(t) LV blood TAC
CV,R(t) the venous blood TAC in right ventricle
CT,R(t) True myocardial tissue TAC
DR(t) ROI TAC in the right ventricle (Bq/mL)
Dm,R(t) ROI TAC in RV myocardial region (Bq/mL)
fR RV myocardial blood flow
βR recovery coefficient in RV myocardial ROI (0.0 < βR < 1.0)
γR spillover fraction in RV myocardial ROI (0.0 < γR < 1.0)
αR PTF (g/mL)
Dev Extravascular tissue density
VB,L LV blood volume
VB,R RV blood volume
VB Blood volume
PTI Perfusable tissue index
Keywords: positron emission tomography, myocardial blood flow, myocardial oxygen metabolism, right ventricle, left ventricle
Citation: Kudomi N, Kalliokoski KK, Oikonen VJ, Han C, Kemppainen J, Sipilä HT, Knuuti J and Heinonen IHA (2019) Myocardial Blood Flow and Metabolic Rate of Oxygen Measurement in the Right and Left Ventricles at Rest and During Exercise Using 15O-Labeled Compounds and PET. Front. Physiol. 10:741. doi: 10.3389/fphys.2019.00741
Received: 12 November 2018; Accepted: 28 May 2019;
Published: 19 June 2019.
Edited by:
Alberto Giannoni, Gabriele Monasterio Tuscany Foundation (CNR), ItalyReviewed by:
Ichiro Sakuma, Hokko Memorial Hospital, JapanDario Genovesi, Gabriele Monasterio Tuscany Foundation (CNR), Italy
Copyright © 2019 Kudomi, Kalliokoski, Oikonen, Han, Kemppainen, Sipilä, Knuuti and Heinonen. This is an open-access article distributed under the terms of the Creative Commons Attribution License (CC BY). The use, distribution or reproduction in other forums is permitted, provided the original author(s) and the copyright owner(s) are credited and that the original publication in this journal is cited, in accordance with accepted academic practice. No use, distribution or reproduction is permitted which does not comply with these terms.
*Correspondence: Ilkka H. A. Heinonen, aWxra2EuaGVpbm9uZW5AdXR1LmZp