 Spencer Murphy1
 Matthew Durand2
 Francesco Negro3
 Dario Farina4
 Sandra Hunter5
 Brian Schmit1
 David Gutterman6
 Allison Hyngstrom1,5*
- 1Integrative Neural Engineering and Rehabilitation Laboratory, Department of Biomedical Engineering, Marquette University, Milwaukee, WI, United States
- 2Department of Physical Medicine and Rehabilitation, Medical College of Wisconsin, Milwaukee, WI, United States
- 3Department of Clinical and Experimental Sciences, Università degli studi di Brescia, Brescia, Italy
- 4Department of Bioengineering, Imperial College London, London, United Kingdom
- 5Department of Physical Therapy, Marquette University, Milwaukee, WI, United States
- 6Cardiovascular Center, Medical College of Wisconsin, Milwaukee, WI, United States
We quantified the relationship between the change in post-contraction blood flow with motor unit firing rates and metrics of fatigue during intermittent, sub-maximal fatiguing contractions of the knee extensor muscles after stroke. Ten chronic stroke survivors (>1-year post-stroke) and nine controls participated. Throughout fatiguing contractions, the discharge timings of individual motor units were identified by decomposition of high-density surface EMG signals. After five consecutive contractions, a blood flow measurement through the femoral artery was obtained using an ultrasound machine and probe designed for vascular measurements. There was a greater increase of motor unit firing rates from the beginning of the fatigue protocol to the end of the fatigue protocol for the control group compared to the stroke group (14.97 ± 3.78% vs. 1.99 ± 11.90%, p = 0.023). While blood flow increased with fatigue for both groups (p = 0.003), the magnitude of post-contraction blood flow was significantly greater for the control group compared to the stroke group (p = 0.004). We found that despite the lower magnitude of muscle perfusion through the femoral artery in the stroke group, blood flow has a greater impact on peripheral fatigue for the control group; however, we observed a significant correlation between change in blood flow and motor unit firing rate modulation (r2 = 0.654, p = 0.004) during fatigue in the stroke group and not the control group (r2 = 0.024, p < 0.768). Taken together, this data showed a disruption between motor unit firing rates and post-contraction blood flow in the stroke group, suggesting that there may be a disruption to common inputs to both the reticular system and the corticospinal tract. This study provides novel insights in the relationship between the hyperemic response to exercise and motor unit firing behavior for post-stroke force production and may provide new approaches for recovery by improving both blood flow and muscle activation simultaneously.
Introduction
In addition to baseline weakness, individuals with stroke can have decreased ability to generate on-going sub-maximal forces during activities, such as walking, that require repeated activation of muscles and this can limit function. For example, individuals with stroke have decreased walking endurance (Dean et al., 2001; Lloyd-Jones et al., 2009; Iosa et al., 2012), and have changes in walking kinematics and kinetics over short distances (Chen and Patten, 2008; Jonkers et al., 2009). In addition, slow walking speeds in people with stroke are associated with greater fatigability of lower limb muscles (Rybar et al., 2014). Despite the functional implications, mechanisms of neuromuscular fatigue (the acute, exercise-induced reduction in the ability to generate force) post-stroke are not well studied.
In healthy individuals and people with stroke, fatigability of muscles can be quantified as a reduction in maximal strength or power or the inability to maintain a submaximal force during ongoing contractions (Enoka and Duchateau, 2008). Fatigability of muscles can originate from factors which limit the nervous system’s ability to excite muscle tissue (central fatigue) or from factors that interfere with muscle contractile properties (peripheral fatigue) (Gandevia, 2001; Enoka and Duchateau, 2008; Hunter, 2018). Central fatigue is often quantified through estimates of voluntary activation using the superimposed twitch technique (Allen et al., 1995; Gandevia et al., 1996; Shield and Zhou, 2004). In response to fatiguing contractions, central fatigue is shown as an increase in the amplitude of a superimposed twitch (SIT) force during a maximal effort contraction. At baseline (Horstman et al., 2008) and after fatigue (Knorr et al., 2011; Bowden et al., 2014), individuals with stroke have decreased ability to voluntarily activate musculature fully even with maximal efforts. Electrophysiological studies using transcranial magnetic stimulation have shown this may be due to a loss of excitatory descending drive most likely caused by the stroke-related lesions to the motor cortex (Foltys et al., 2003; Jang et al., 2017; Peters et al., 2017). Based on studies showing decreased excitability in descending motor pathways, it is not surprising that recent evidence suggests that in people with stroke, central fatigue is a more significant contributor to fatigability of the paretic leg muscles than for the non-paretic legs and healthy controls (Riley and Bilodeau, 2002; Hu et al., 2006; Klein et al., 2010; Knorr et al., 2011; Hyngstrom et al., 2012; Bowden et al., 2014; Rybar et al., 2014; Kuhnen et al., 2015; McManus et al., 2017). These studies attribute force generating deficits to baseline reductions in cortical commands, but they do not consider the impact of the build-up of metabolic by-products on muscle function that could contribute to increased fatigability of limb muscles.
Peripheral fatigue refers to fatigue that is due to reductions in muscle contractile function. For example, excessive accumulation of metabolic by-products that occurs with muscle contractions interferes with the excitation-contraction coupling (Kent-Braun et al., 2012). Accumulation of metabolic byproducts can result from inadequate perfusion of the muscle. Following stroke, this may impact contractile properties as blood flow to the muscles of the paretic leg is decreased at rest (Ivey et al., 2004; Billinger et al., 2009; Durand et al., 2015) and during brief, submaximal contractions (Durand et al., 2015) compared with healthy controls. Moreover, limitations in the hyperemic response to exercise is related to strength and other measures of function (Durand et al., 2015). In individuals with stroke, the contribution of inadequate blood flow to decreased muscle contractile properties and fatigability of limb muscles is not known. Inadequate muscle perfusion and accumulation of metabolites within the muscle can also affect neural activation of the muscle via activation of chemo-sensitive group III and IV afferent endings in the muscle (Matthews, 1972; Martin et al., 2008). Understanding the effect of blood perfusion to exercising muscles and motor unit firing is important because cooperation between the two systems may provide a method for recovery.
The association between blood flow and individual motor unit firing behavior during intermittent fatiguing contractions post-stroke has not been studied but may provide important insight for impaired force generation and task endurance in chronic stroke. The purpose of the study was to determine the relationship between the change in blood flow with metrics of fatigue and motor unit firing behavior in stroke and controls. We hypothesized that individuals with stroke would have a blunted hyperemic response to exercise accompanied decreased motor unit firing rates and this relationship would be different than controls.
Materials and Methods
Participants
All participants gave informed consent before participation in this study, and the procedures were approved by the Medical College of Wisconsin Institutional Review Board (PRO190103). Ten participants with chronic, hemiparetic stroke (6 male, 4 female, 60 ± 6 years) and nine neurologically intact participants (6 male, 3 female, 63 ± 7 years) participated in the study. General inclusion criteria for stroke participants were: single, unilateral stroke (obtained through verbal communication from the physician and consistent with neurological physical examination); able to ambulate at least 30 feet (with or without an assistive device); ≥6 months post-stroke; at least 18 years old; and able to give informed consent. General exclusion criteria included for stroke participants were: brainstem stroke; any uncontrolled medical condition; contractures of any lower extremity joints; inability to follow 2–3 step commands; substance abuse; people unable to walk more than 10 feet without physical assistance; narrow angle glaucoma; chronic liver or kidney disorders; major psychiatric disorders; neurodegenerative disorders. Table 1 reports the participants’ characteristics.
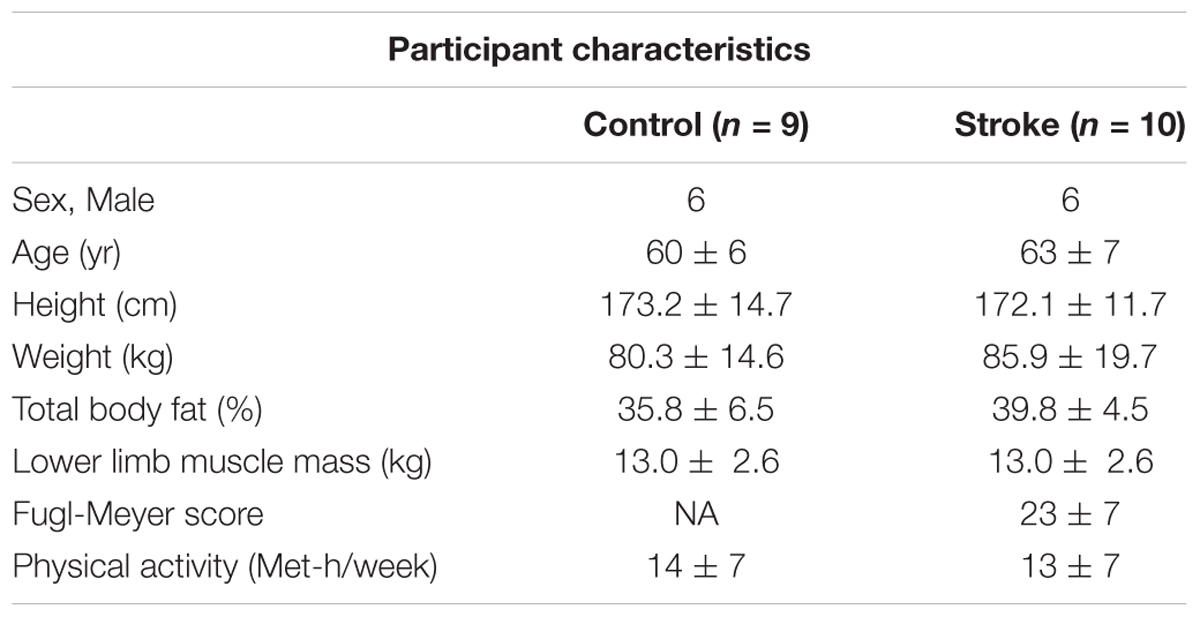
Table 1. Participant characteristics.
Torque Measurements
Participants were seated upright on a Biodex System 3 (Biodex Medical Systems, Shirley, NY, United States) with the test leg hip and knee angles at 90 degrees of flexion. Isometric knee extension torque measurements were made using a JR3 E-series load cell (JR3, Inc., Woodland, CA, United States) mounted to the dynamometer spindle by means of a custom aluminum coupling. A quarter inch aluminum arm extended from the axis of the load cell to a bracket that secured either left or right ankle attachments. The ankle attachments were secured to the test leg two inches above the lateral malleolus. The torque was acquired by an EMG-USB2+ amplifier (256-channel regular plus 16-auxiliary channels, OT Bioelettronica, Turin, Italy), low-pass filtered at 500 Hz, sampled at 2048 Hz, and recorded using the OT Biolab software. The data was then zero phased, low-pass filtered at 15 Hz using a 4th order Butterworth filter prior to analysis.
Voluntary Activation and Resting Twitch Response
The knee extensor muscles were electrically stimulated using a constant current generator (DS7A, Digitimer, Welwyn, United Kingdom) that delivered a rectangular pulse of 100 μs duration over the quadriceps muscle group. The stimulation intensity (range 200 to 500 mA) was set at 20% above the level required to produce a maximal resting twitch amplitude that caused a supramaximal stimulation. The stimulation occurred at the peak torque (visually determined when the torque reached a steady plateau) of a maximum voluntary contraction (MVC) and is referred to as the “superimposed twitch.” Once the knee extension torque returned to 0 Nm, a second stimulation was provided to elicit the resting twitch response. The maximal torque generated by the knee extensors in response to the electrical stimulation was acquired. The superimposed twitch was calculated as the magnitude of the increase provoked by the electrical stimulus during the MVC (i.e., peak of superimposed twitch minus the peak of the MVC contraction) (Allen et al., 1995). The resting twitch was the torque magnitude generated from the electrically evoked contraction of the relaxed muscle (i.e., the magnitude of the torque produced at rest). The voluntary activation was defined here as the completeness of motor unit recruitment and firing rate during a MVC and was calculated using an interpolated twitch technique (Shield and Zhou, 2004; Klass et al., 2007):
Blood Flow Measurements
The participants rested upright in the Biodex seat for a minimum of 15 min prior to assessments of blood flow. Diameter, blood flow velocity, and volume of blood flow through the superficial femoral artery were obtained with a Doppler angle of insonation fixed at 60 degrees using a linear array 4.0–12.0 MHz transducer designed for vascular imaging and equipped to a Vivid e ultrasound machine (General Electric, Fairfield, CT, United States). Sonography makes it possible to estimate the volume blood flow by careful measurement of the area, via the image, and the velocity distribution using the Doppler trace (velocity = frequency × wavelength) (Walter et al., 1986). Blood flow measurements during the fatigue protocol were taken immediately after each fatigue cycle (1 cycle = 5 isometric contractions at 40% MVC held for 10s and separated by a 4 s rest, see Figure 1) while the participant remained seated upright and still for a 10 s video capture of the superficial femoral artery. The same portion of the artery was able to be visualized following all fatigue cycles because the participants were secured to the chair with a lap belt and the isometric contractions did not result in movement of the lower limb. Only measurements obtained during the first three complete cardiac cycles following each fatigue cycle were included for analysis because local blood flow is a tightly coupled metabolic demand. Blood flow measurements were normalized to lean muscle mass of the whole lower limb determined by the dual-energy absorptiometry (Lunar iDXA, General Electric, Fairfield, CT, United States) analysis. Normalized blood flow was not available for one of the control participants and one of the individuals with stroke because the participants declined body composition analysis.
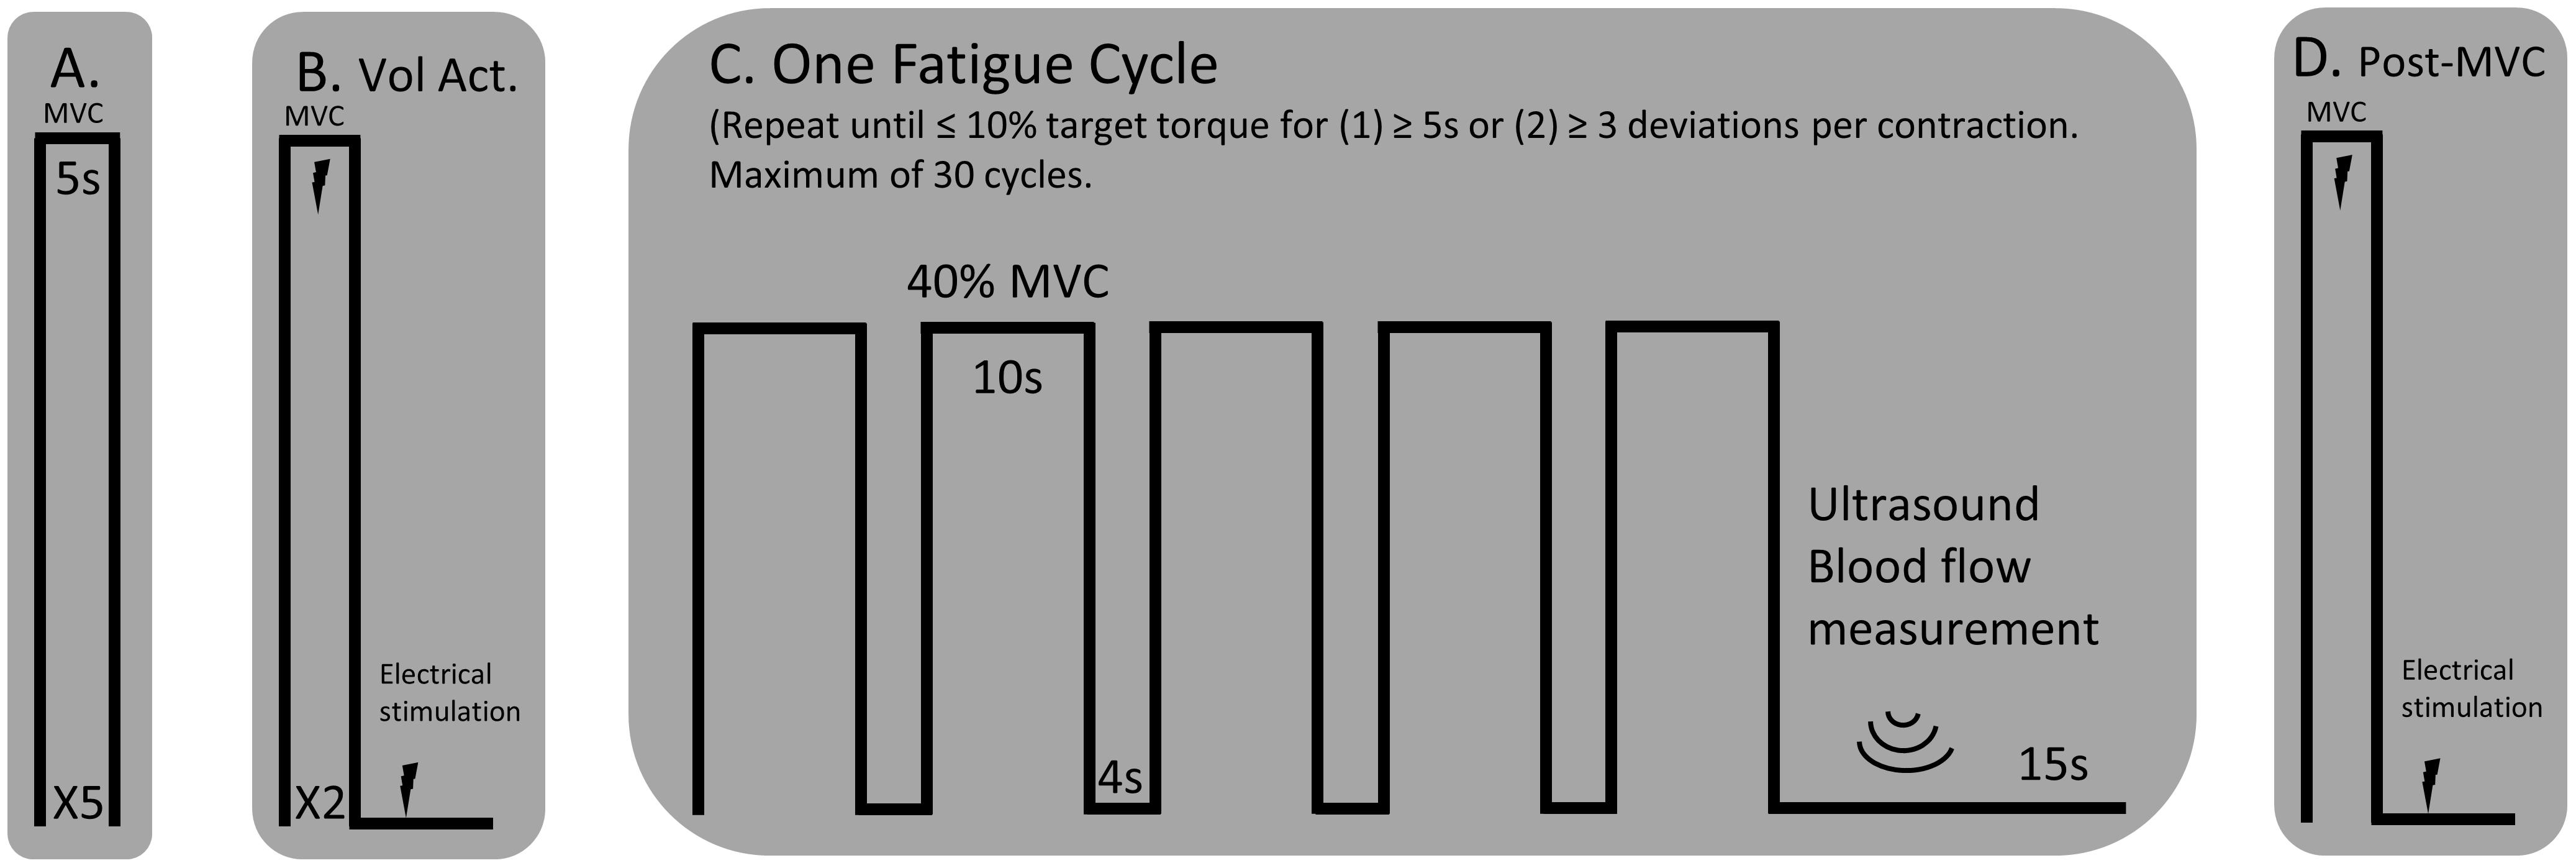
Figure 1. Experimental Protocol. (A) MVCs of the knee extensor muscles with a 1-min rest between trials. (B) An interpolated twitch procedure was performed for a measure of voluntary activation and resting twitch torque. (C) A single cycle for the fatigue protocol consisted of five consecutive 10 s isometric contractions, separated by a 4 s rest, at 40% MVC. A blood flow measurement was performed over the femoral artery of the test leg using an ultrasound machine. The fatigue cycle was repeated until the participant could not hold the isometric contraction within 10% of the target torque for more than three deviations per isometric contraction or for greater than five consecutive seconds. (D) A post-MVC including the interpolated twitch procedure was performed immediately after the final blood flow measurement.
Surface EMG Recordings
High-density surface electromyograms (HDsEMG) were obtained using a 64 channel 2-D electrode array with 8 mm interelectrode distance (ELSCH064NM2 – 13 rows, 5 columns, OT Bioelettronica, Turin, Italy). A double-sided adhesive sticker designed for and compatible with the array was placed over the array. The holes within the adhesive sticker were filled with a conductive electrode paste (Ten20, Weaver and Company, Aurora, CO, United States). The participant’s skin was sterilized with an alcohol swab and rubbed to remove superficial dead skin. The array was placed over the belly of the vastus lateralis, midway between the patella and the greater trochanter. A reference electrode was placed over the ipsilateral lateral malleolus. Signals for each channel were differentially amplified between 1000 and 5000 V/V (participant dependent) and band-pass filtered (10–500 Hz) using the EMG-USB2+ amplifier. The signals were sampled at 2048 Hz, A/D converted to 12 bits, and acquired using the OT Biolab software throughout the duration of the fatigue protocol.
Prior to analysis, a 2nd order bandpass filter (10–500 Hz) and a notch filter (60 Hz) were applied to each channel of the HDsEMG array. The EMG root mean square (RMS) for each channel was calculated for the five consecutive, 10 s isometric contraction for the first and last cycle of the fatigue protocol (described below Figure 1). For a spectral descriptor, the mean frequency of the EMG was also calculated: , where S(f) is the power spectral density (PSD) of the signal and fs is the sampling frequency. The EMG signal, x(t), has a Fourier transform, X(f), and a PSD [S(f) = |X(f)|2/N]. The RMS and mean frequency values of all channels were averaged together for each fatigue cycle to provide an average RMS and mean frequency of the entire high-density surface array.
Motor Unit Decomposition
The 63 differentially amplified sEMG channels were visually examined to exclude channels that did not show EMG activity. The remaining channels were decomposed to attain instances of single motor unit action potentials by implementing a multichannel convolutive blind source separation algorithm described and validated by Negro et al (Negro et al., 2016). In summary, the decomposition algorithm discriminates between individual motor unit action potentials from multi-unit signals. This and similar approaches have been extensively validated in previous studies (Holobar and Zazul, 2007; Holobar Minetto et al., 2010; Martinez-Valdes et al., 2017; Chen et al., 2018). The motor unit spike trains are estimated from the deconvolved sources using a peak detection algorithm and K-means classification. To provide a normalized index of reliability similar to the pulse to noise ratio, a silhouette measure (SIL) was computed on each estimated source, and the source was considered of acceptable quality if SIL was greater than 0.85. SIL provides a measure of the quality of the extracted motor unit spike trains based on the relative amplitude of the deconvolved spikes compared to the baseline noise. Motor units were identified by applying the decomposition algorithm separately to the first and last cycles of the fatigue protocol. Under the assumption that motor unit action potential shape may change with endurance, motor units were not matched between the first and last cycles; however, under the assumption of stable motor unit action potential properties, this configuration provided the possibility to identify reliably the same motor units within the same fatigue cycle (Martinez-Valdes et al., 2017).
Before calculating the discharge rates of the inter-spike intervals (ISI), abnormally long (>250 ms, 4 Hz) or short (<20 ms, 50 Hz) ISI values were excluded. The instantaneous firing rates of individual motor units were calculated as the inverse of the inter-spike interval (Hz, pulses per second, ). The motor unit action potential instances were time-locked with the torque trace. The mean firing rates were determined as the average firing rates during all five 10 s holds at 40% MVC for one fatigue cycle (i.e., First and Last Cycles, see Figures 1, 2). Therefore, the firing rate of the first fatigue cycle consists of the average firing rate for the first five contractions of the fatigue protocol, and the firing rate of the last fatigue cycle consists of the average firing rate for the last five contractions of the fatigue protocol.
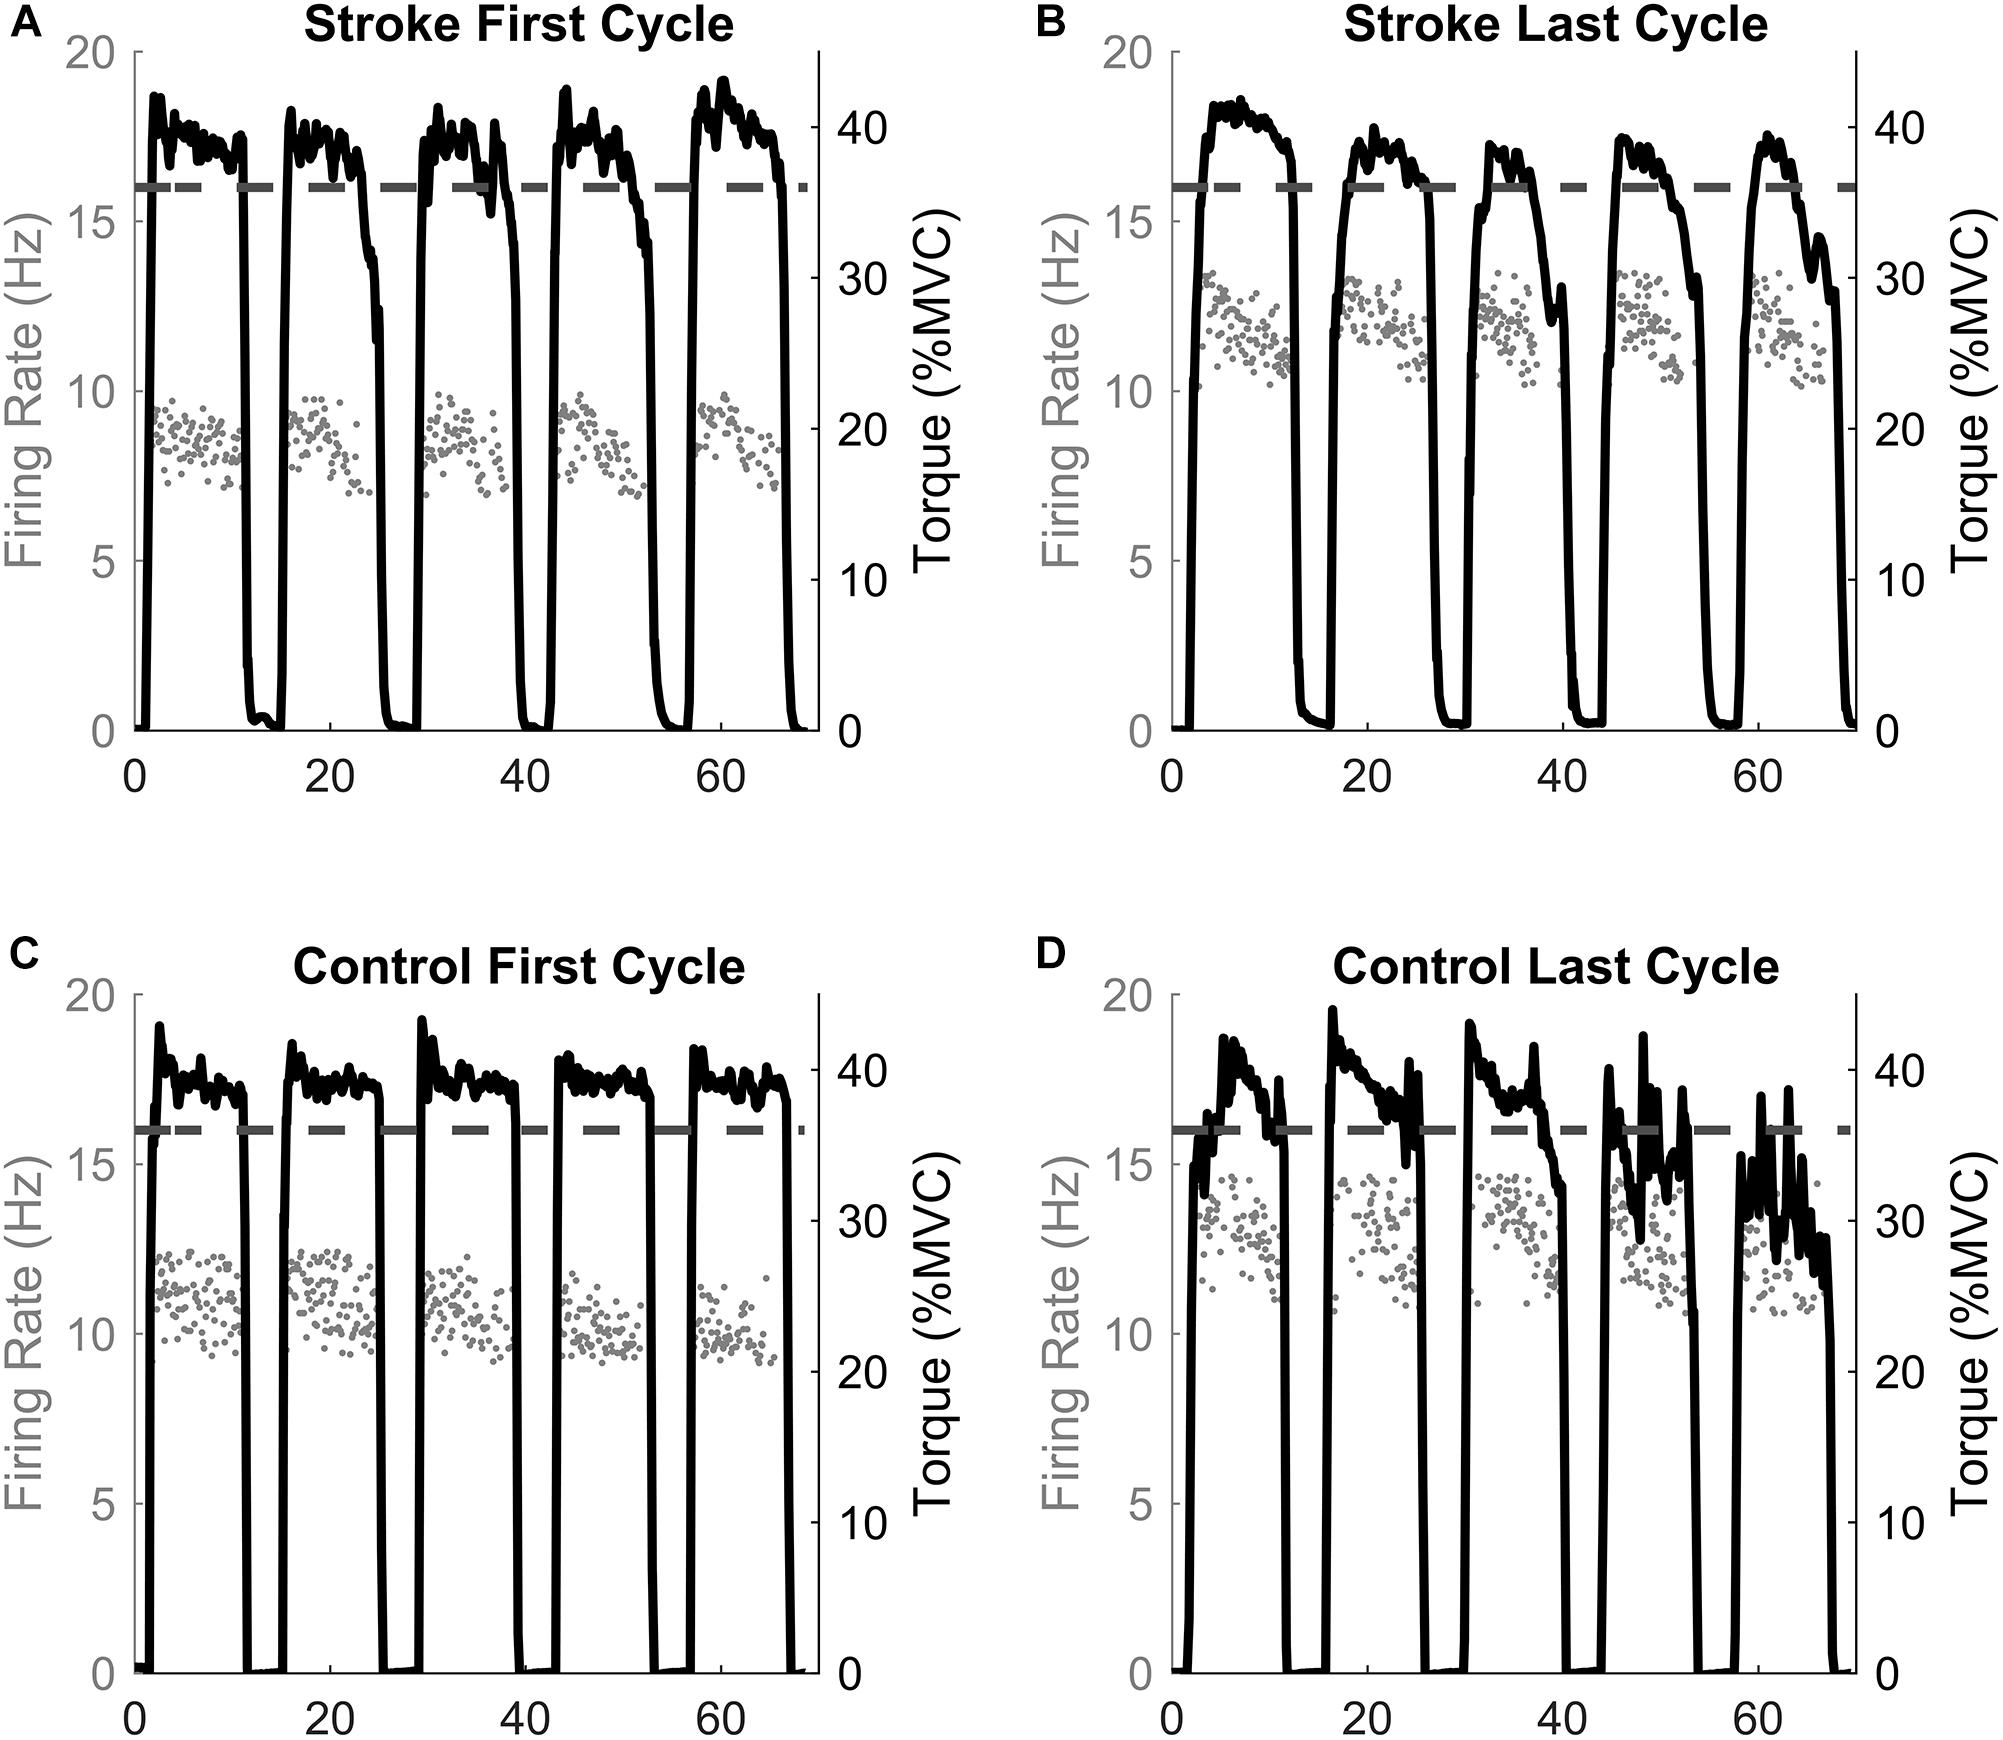
Figure 2. Single participant example. The motor unit firing instantaneous discharges (gray dots) and the corresponding torque generated for the first and last fatigue cycles for the stroke (A,B) and control (C,D) participants. The dashed line represents the point of task failure if the torque was not maintained above that value. Note the inability to maintain the torque above the task failure line in the last cycle compared to the first cycle.
Body Composition and Clinical Measurements
Anthropomorphic measurements were performed by a licensed bio nutritionist. Body composition analysis was conducted using an iDXA (GE Lunar Medical System, Madison, WI, United States) to determine the estimated visceral fat percentage, total lower limb mass, lean muscle mass of the limbs, and percent fat composition of each limb. A Lower Extremity Fugl-Meyer (assessment of motor impairment) was performed by a licensed physical therapist.
Experimental Protocol
The paretic leg of stroke survivors and the right leg of the control participants was tested. Figure 1 illustrates the timeline of the experimental protocol, and Figure 2 illustrates single participant examples for a control and an individual with stroke. Participants began by performing at least five baseline isometric maximum voluntary contractions (MVC) of the knee extensor muscles with 1 min of rest between trials. Visual feedback and verbal cueing were provided to the participant. The peak torque of all the trials was used as the MVC. Voluntary activation and resting twitch measures were made following the final MVC trial. A rest period of at least 5 min was provided following the final voluntary activation trial. Participants then performed the fatigue protocol. One cycle of the fatigue protocol consisted of five consecutive isometric contractions at 40% MVC and each contraction lasted for 10 s with a 4 s rest provided between each contraction. Visual feedback of the torque trace and target torque was provided using a custom written LabVIEW (National Instruments, Austin, TX, United States) program. Immediately after each fatigue cycle, a measurement of blood flow was taken. An additional 15 s of rest was applied after each cycle to allow ample time for the vascular measurements. A participant repeated the fatigue protocol until the individual was unable to hold the torque trace within 10% of the target torque for 5 s continuously or until the participant had at least three deviations of greater than 10% of the target torque within a 10 s contraction. Final vascular, voluntary activation, and resting twitch measurements were made immediately (within 10 s) following task failure. Surface EMG using the high-density electrode array was recorded throughout the duration of the fatigue protocol.
Statistical Analysis
Data processing was performed in Matlab R2017b (Mathworks, Natick, MA, United States), and statistical tests were performed using IBM SPSS Statistics 24 (IBM, Armonk, NY, United States). Data are reported as the mean ± standard deviation. For one of the control participants and one of the individuals with stroke, body composition analysis was declined; therefore, those participants could not have blood flow normalized to lean muscle mass and were not included in that part of the analysis. The motor units for three control participants did not fulfill the SIL criteria (SIL > 0.85); therefore, only the motor units from six control participants were considered.
Separate repeated measures, mixed model ANOVAs were performed to detect statistical differences between the tested GROUP (stroke, control) and fatigue CYCLE (first and last) in: (1) normalized blood flow; (2) absolute blood flow; (3) motor unit firing rates by participant mean; (3) voluntary activation; (4) resting twitch amplitude; (5) mean EMG RMS; and (6) EMG mean frequency. The between group variable was GROUP. CYCLE was the within group comparison. A multifactorial ANOVA was used to compare the individual motor unit firing rates (main factors: 1) CYCLE (first and last fatigue cycles), and GROUP (Stroke, Control). A repeated measures ANOVA was not used for the individual motor units because detection of the same motor units at the first and last fatigue cycles could not be determined. A Bonferroni correction was used in all post hoc testing.
Separate one-way analysis of variances (ANOVAs) were used to test for relative change in: (1) mean MVC; (2) mean EMG RMS; (3) EMG mean frequency; (4) motor unit firing rate by participant average; (5) mean blood flow (6) voluntary activation; and (7) resting twitch torque. A one-way ANOVA was also used to test for differences in task duration in terms of number of fatigue cycles completed.
Using the least squares estimates method for linear regression models, coefficient of determinations and model parameters were calculated for the following correlations: (1) Δ blood flow and task duration; (2) Δ blood flow and Δ MVC; (3) Δ blood flow and Δ motor unit firing rate; (4) absolute blood flow and MVC torque. ANOVAs were performed to test the significance of the correlations using the F-statistic. A runs test for detecting randomness was used to determine whether the linear regression fits the data. The linear regression models were included if the residuals showed a random, non-systematic pattern.
Results
MVC Torque and Task Duration Measurements
At baseline, controls had a greater knee extension MVC compared to individuals with stroke (129.8 ± 53.2 Nm vs. 76.4 ± 29.4 Nm, p = 0.003). The relative decline in MVC was similar for both groups (-39.8 ± 10.1% vs. -34.3 ± 12.6%, p = 0.311). There was no difference in the number of fatigue protocol cycles completed (11.9 ± 10.2 cycles vs. 15.7 ± 8.2 cycles, p = 0.383).
Voluntary Activation
A significant interaction effect was observed in the voluntary activation measurement between the control and stroke groups [F(1,17) = 24.9, p < 0.001] as the individuals with stroke had a larger decrease in the voluntary activation from the first cycle to the last cycle of the fatigue protocol (93.6 ± 4.5% to 75.4 ± 10.5, p < 0.001) (Figure 3A). There was no significant difference in voluntary activation of the control participants (97.4 ± 2.4% to 95.6 ± 4.5%, p = 0.465) with fatigue. A main effect of fatigue cycle was observed, F(1,17) = 37.0, p < 0.001, as there was a decrease in voluntary activation with fatigue. There was also a main effect of group F(1,17) = 24.8, p < 0.001, where voluntary activation in the stroke group was less than controls. Finally, the stroke group had a greater decrease in the relative change in voluntary activation compared to the controls (p < 0.001) (Figure 3B). In summary, the individuals with stroke had a greater decrease in voluntary activation with the fatigue protocol, as well as a lower baseline voluntary activation.
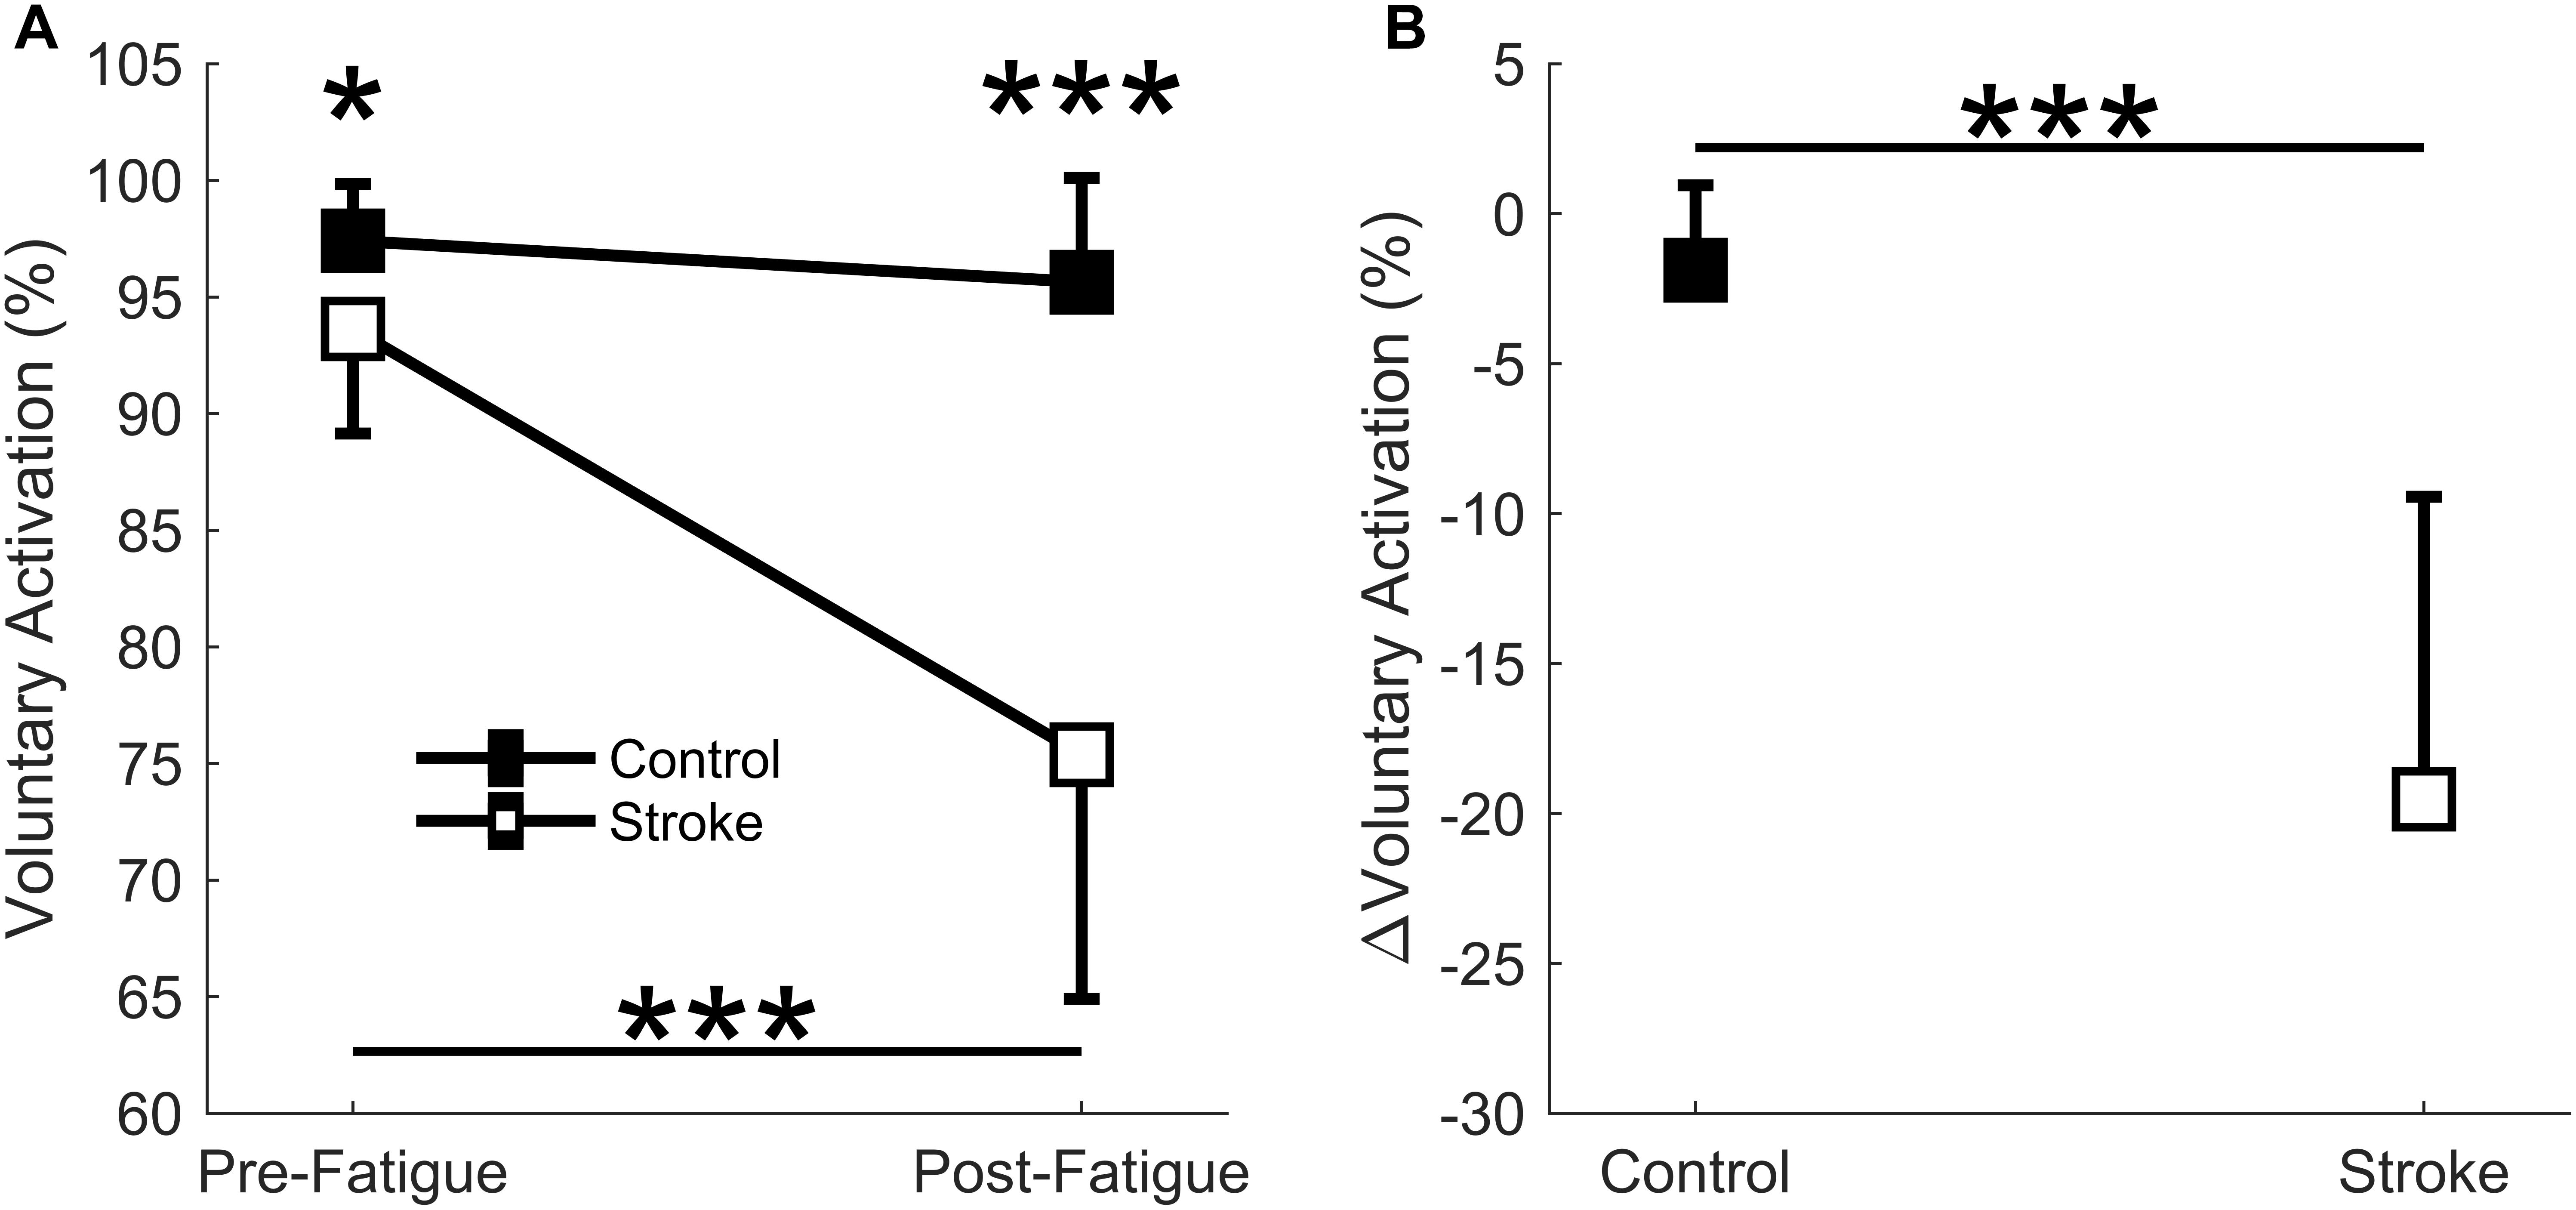
Figure 3. Voluntary activation. Voluntary activation assessed using the twitch interpolation technique comparing the first and last cycle (A) and the relative change before and after the fatigue protocol (B). A significant interaction effect (p < 0001) was observed as individuals with stroke significantly decrease voluntary activation with fatigue. Voluntary activation was significantly lower for the stroke participants at pre-fatigue (p < 0.05) and post-fatigue (p < 0.001), and significantly decreased with fatigue for the stroke participants (p < 0.001) but not the controls (A). A significantly greater normalized decrease in voluntary activation was observed for the stroke participants (p < 0.001) compared to controls (B). ∗p < 0.05, ∗∗p < 0.01, and ∗∗∗p < 0.001.
Resting Twitch Torque
A significant interaction effect was observed in the resting twitch torque between the control and stroke limbs [F(1,17) = 7.4, p = 0.015] as there was a greater decline in resting twitch torque response in controls (41.5 ± 17.2 Nm to 18.6 ± 11.1 Nm, p < 0.001) compared to individuals with stroke (33.8 ± 17.2 Nm to 22.7 ± 13.0 Nm, p = 0.002) (Figure 4A). There was also a main effect of cycle [F(1,17) = 61.3, p < 0.001] but not a main effect of group [F(1,17) = 0.8, p = 0.785]. Relative change in resting twitch torque showed a significantly greater decrease for the control group compared to the stroke group (p = 0.005) (Figure 4B). In summary, the control participants had a greater decrease in muscle contractile properties (resting twitch torque) in response to the fatigue protocol.
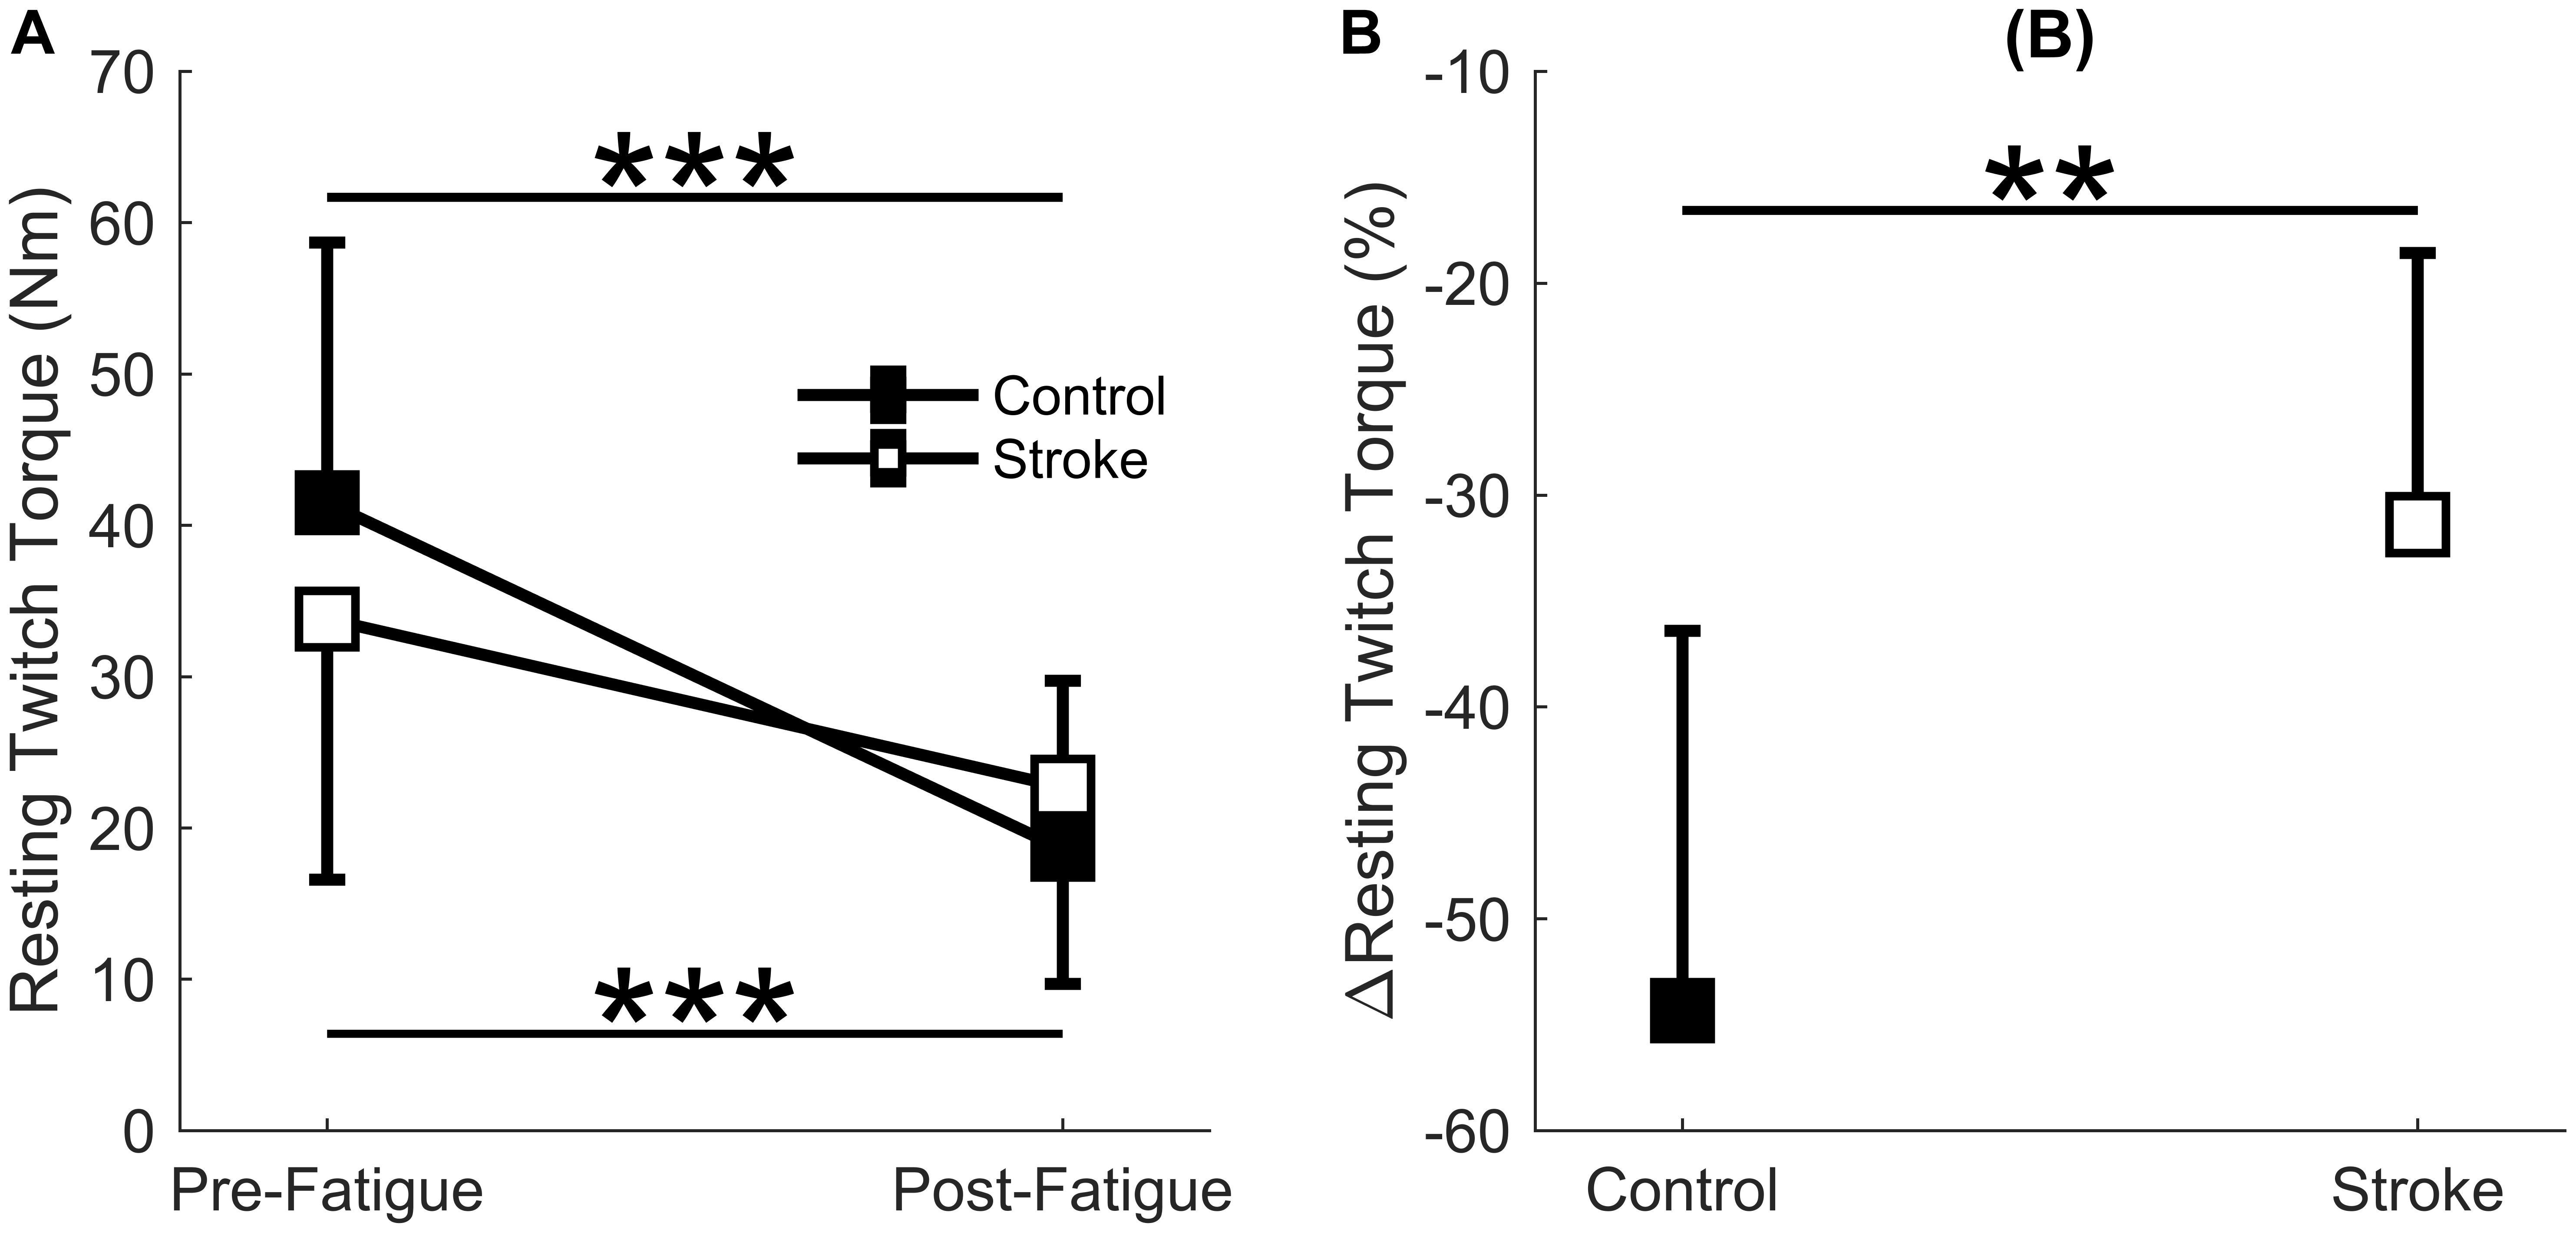
Figure 4. Resting twitch torque. Resting twitch torque amplitude elicited from electrical stimulation to the rectus femoris comparing the first and last cycle (A) and the relative change before and after the fatigue protocol (B). A significant interaction effect (p = 0.015) was observed as control participants significantly decreased resting twitch amplitude with fatigue. Resting twitch torque significantly decreased for both the stroke participants (p < 0.001) and controls (p < 0.001) (A). Controls had a significantly greater normalized decrease (p < 0.01) in resting twitch torque compared to the stroke participants (B). ∗p < 0.05, ∗∗p < 0.01, and ∗∗∗p < 0.001.
Femoral Artery Blood Flow
There was a significant main effect of normalized blood flow with fatigue cycle [F(1,15) = 24.4, p < 0.001] as blood flow increased in both groups with fatigue (Figure 5A). There was also a significant main effect of group [F(1,15) = 40.1, p < 0.001] as blood flow through the femoral artery was greater for the control leg compared to the paretic leg. No significant interaction effect (group∗cycle) was observed [F(1,15) = 1.7, p = 0.207]. Overall, lower levels of normalized blood flow were observed in the stroke group, but blood flow increased with fatigue regardless of group.
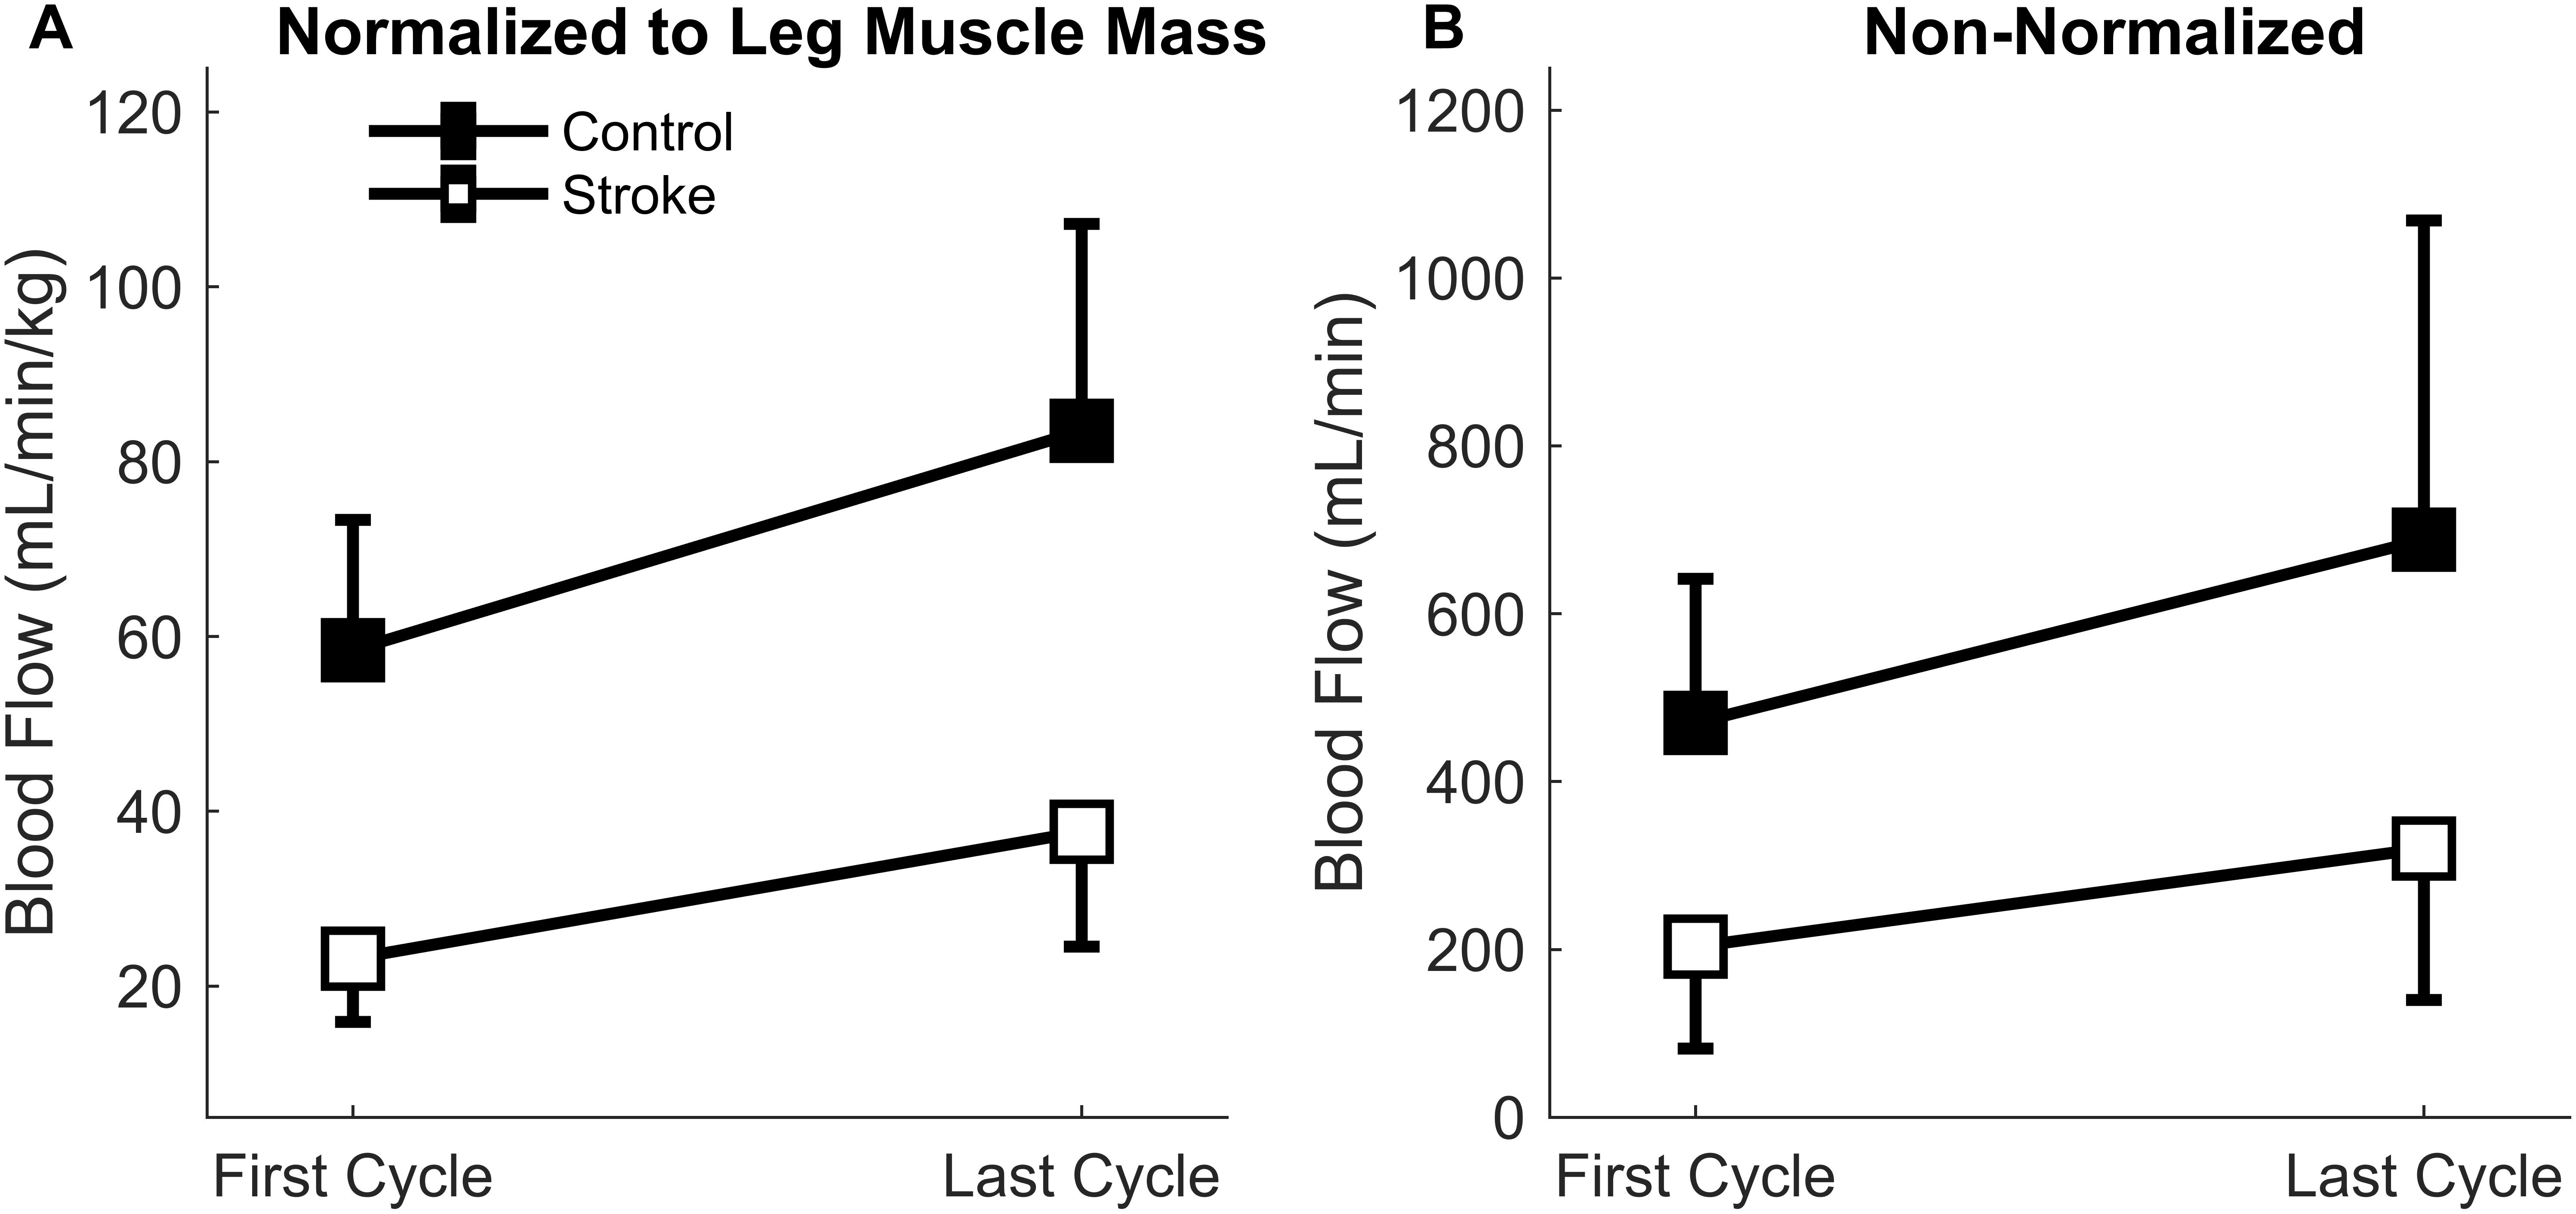
Figure 5. Blood Flow through the femoral artery. Blood flow normalized to leg muscle mass (A) and absolute magnitude (B) comparing the first and last cycles. Main effects of limb and fatigue cycler were observed in both cases as both groups significantly increased blood flow with fatigue and the control participants had a greater magnitude of blood flow than the individuals with stroke.
Because the normalized blood flow only applied to 17 of the participants (one control and one individual with stroke did not partake in body composition analysis), the absolute magnitude (non-normalized) was also calculated so that all participants were included (Figure 5B). Similar results were obtained for the absolute blood flow through the femoral artery in comparison to the normalized blood flow. A significant main effect of fatigue cycle [F(1,17) = 11.6, p = 0.003] and group [F(1,17) = 11.4, p = 0.004] was observed. There was no interaction effect [F(1,17) = 1.060, p = 0.318]. The data shows that regardless of group there was an increase in blood flow, but the blood flow response magnitude was greater for controls.
Regression analysis showed that changes in blood flow significantly correlated with task duration for the control group [r2 = 0.6, F(1,7) = 9.4, p = 0.018, β = 0.141] as greater increases in blood flow related to longer task duration (Figure 6). Blood flow and task duration did not correlate for the stroke group [r2 = 0.010, F(1,8) = 0.079, p = 0.786, β = 0.031]. Blood flow after the first fatigue cycle and MVC torque generation significantly correlated together for both control [r2 = 0.51, F(1,7) = 7.170, p = 0.030, β = 2.300] and stroke participants [r2 = 0.78, F(1,8) = 28.6, p < 0.001, β = 3.375] (Figure 7), showing that stronger individuals produced larger post-contraction blood flow responses. Changes in blood flow were not significantly correlated with changes in MVC torque generation for stroke [r2 = 0.003, F(1,8) = 0.020, p = 0.890, β = -0.020] or control groups [r2 = 0.03, F(1,7) = 0.257, p = 0.628, β = 0.034].
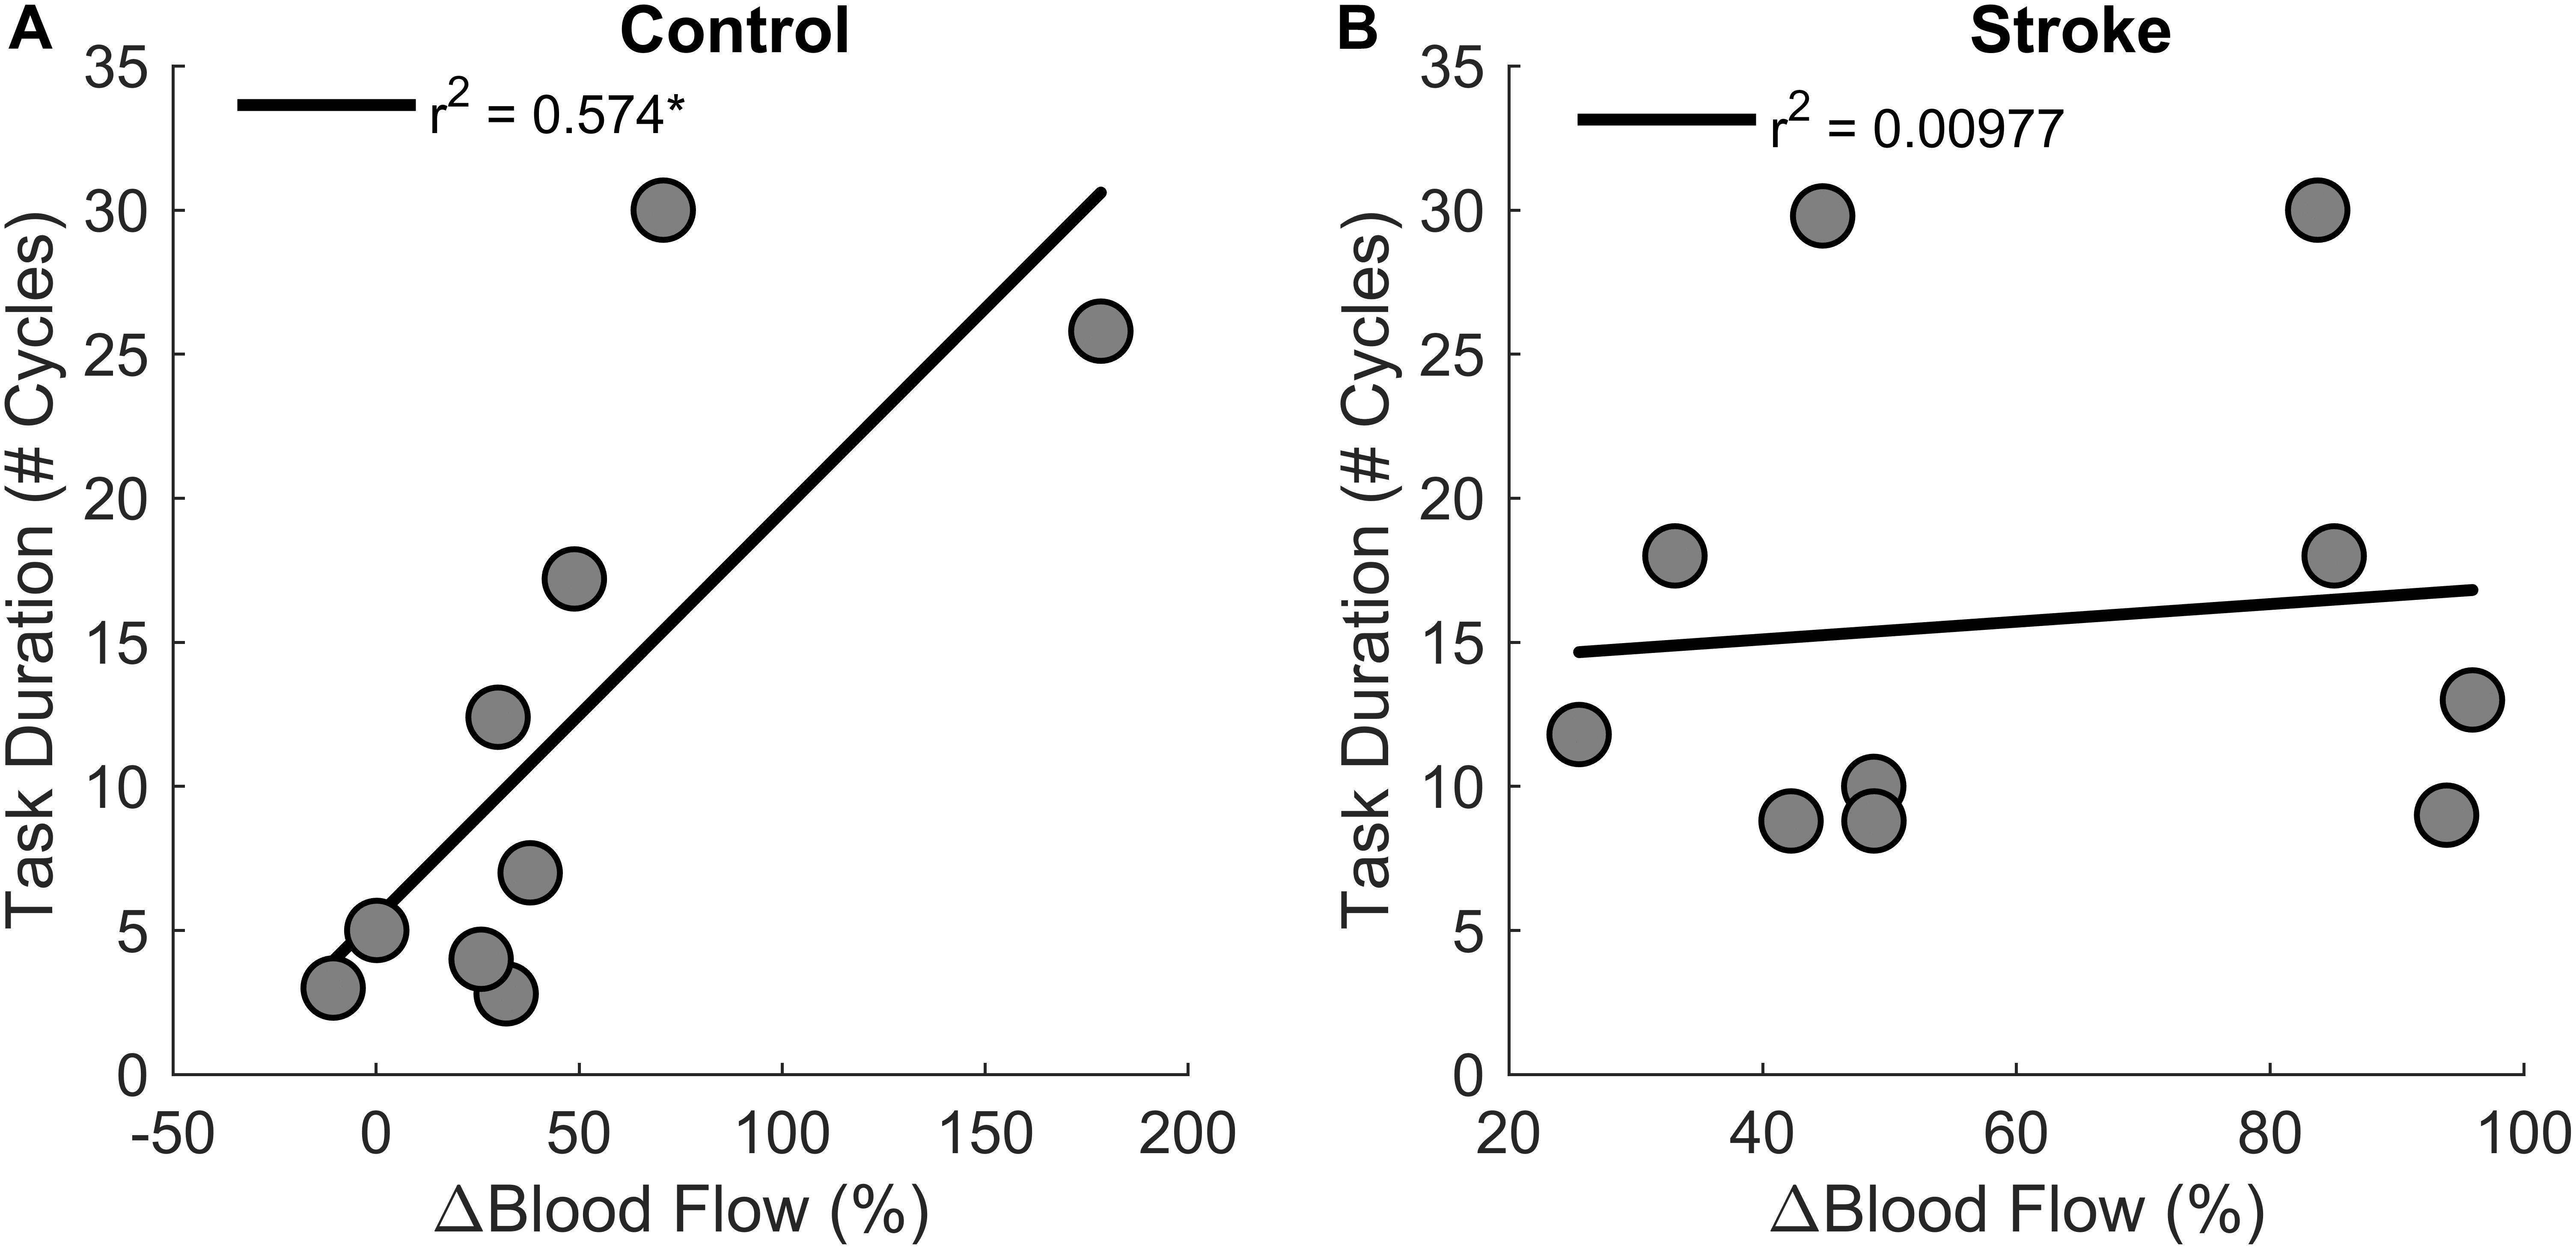
Figure 6. Changes in blood flow and task duration. Changes in blood flow significantly correlated with task duration for the control group (p = 0.018) (A) but not the stroke group (p = 0.786) (B).
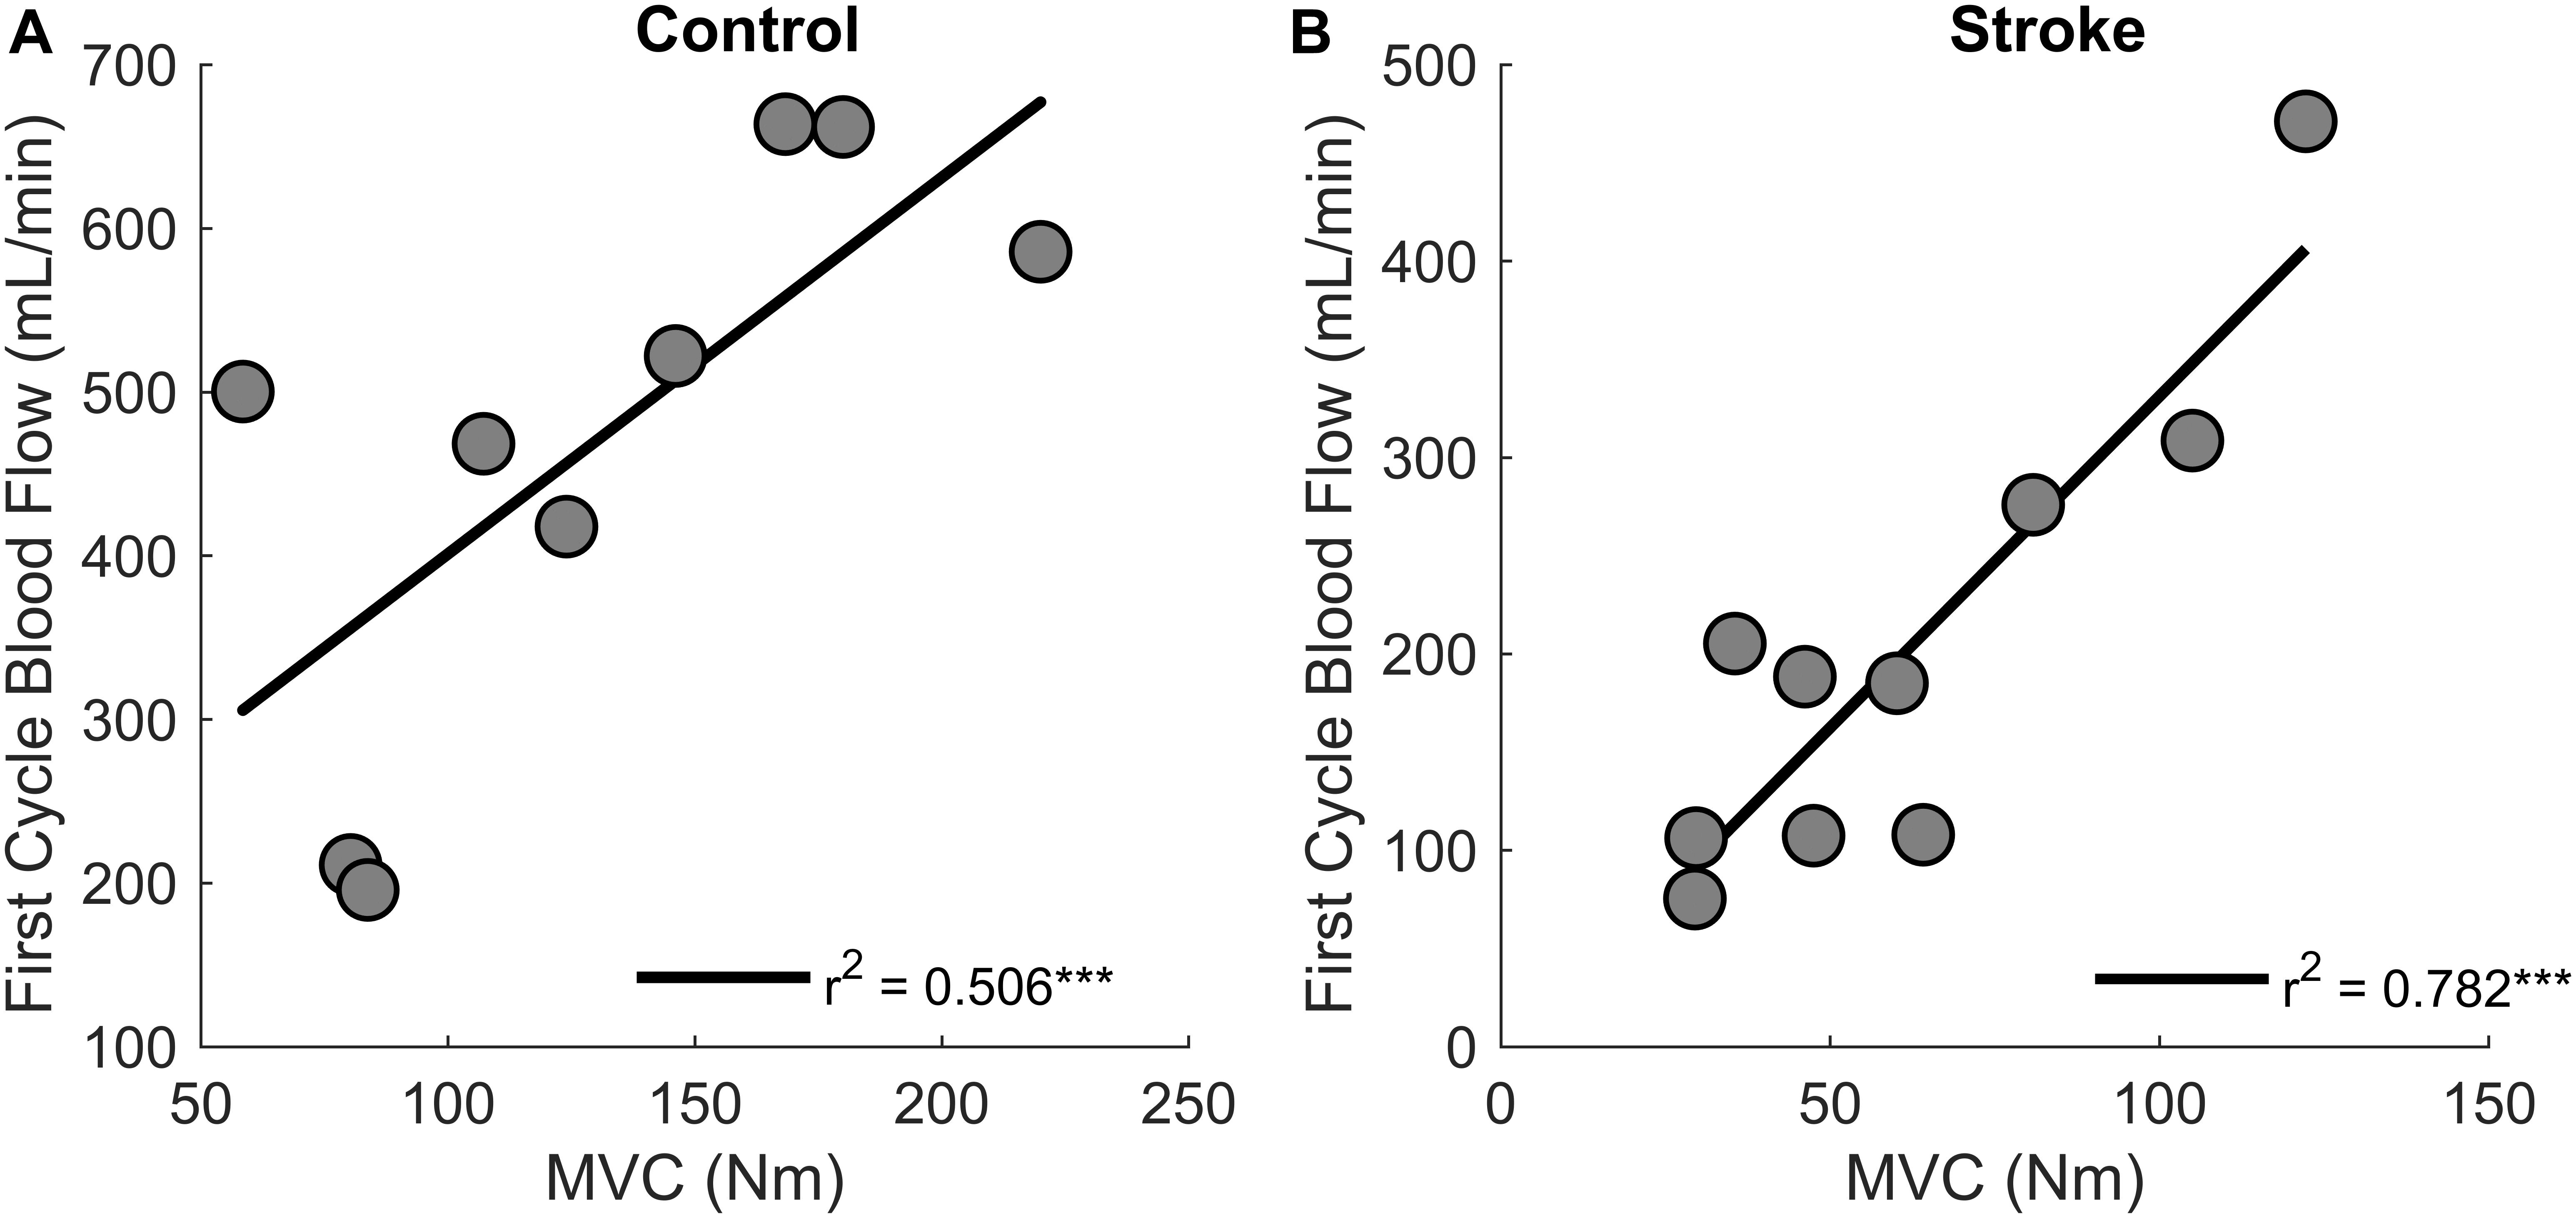
Figure 7. MVC and blood flow after the first cycle. Higher magnitudes of blood flow were observed for stronger individuals in both control (p = 0.030) (A) and stroke groups (p < 0.001) (B).
Motor Unit Firing Rates
A total of 186 motor units for the control leg (102 First Cycle, 84 Last Cycle), and 145 motor units for the participants with stroke (86 First Cycle, 59 Last Cycle) were accepted for data processing (totaling 331 motor units). When comparing the mean motor unit firing rates for the individual participants, a significant interaction effect occurred (group∗cycle) [F(1,14) = 10.3, p = 0.006] as there was a greater increase in firing rates for the controls as compared to stroke (Figure 8A). Main effects of group [F(1,14) = 10.9, p = 0.005] and cycle [F(1,14) = 13.5, p = 0.003] were also observed. The mean firing rates of the individual motor units for each group and cycle were: control = 13.3 ± 3.0 Hz; stroke = 10.5 ± 2.7 Hz; first cycle = 11.5 ± 3.2 Hz; last cycle = 12.8 ± 3.1 Hz. Comparisons of the mean motor unit firing rate for the first fatigue cycle showed control motor unit firing rates were significantly greater (p = 0.039) than the participants with stroke. The relative change in firing rate (Figure 8B) was greater for control participants (15.0 ± 3.8%) compared to the individuals with stroke (2.0 ± 11.9%) [F(1,14) = 6.6, p = 0.023]. In summary, the control leg had higher motor unit firing rates and greater motor unit discharge adaptation with fatigue compared to the individuals with stroke.
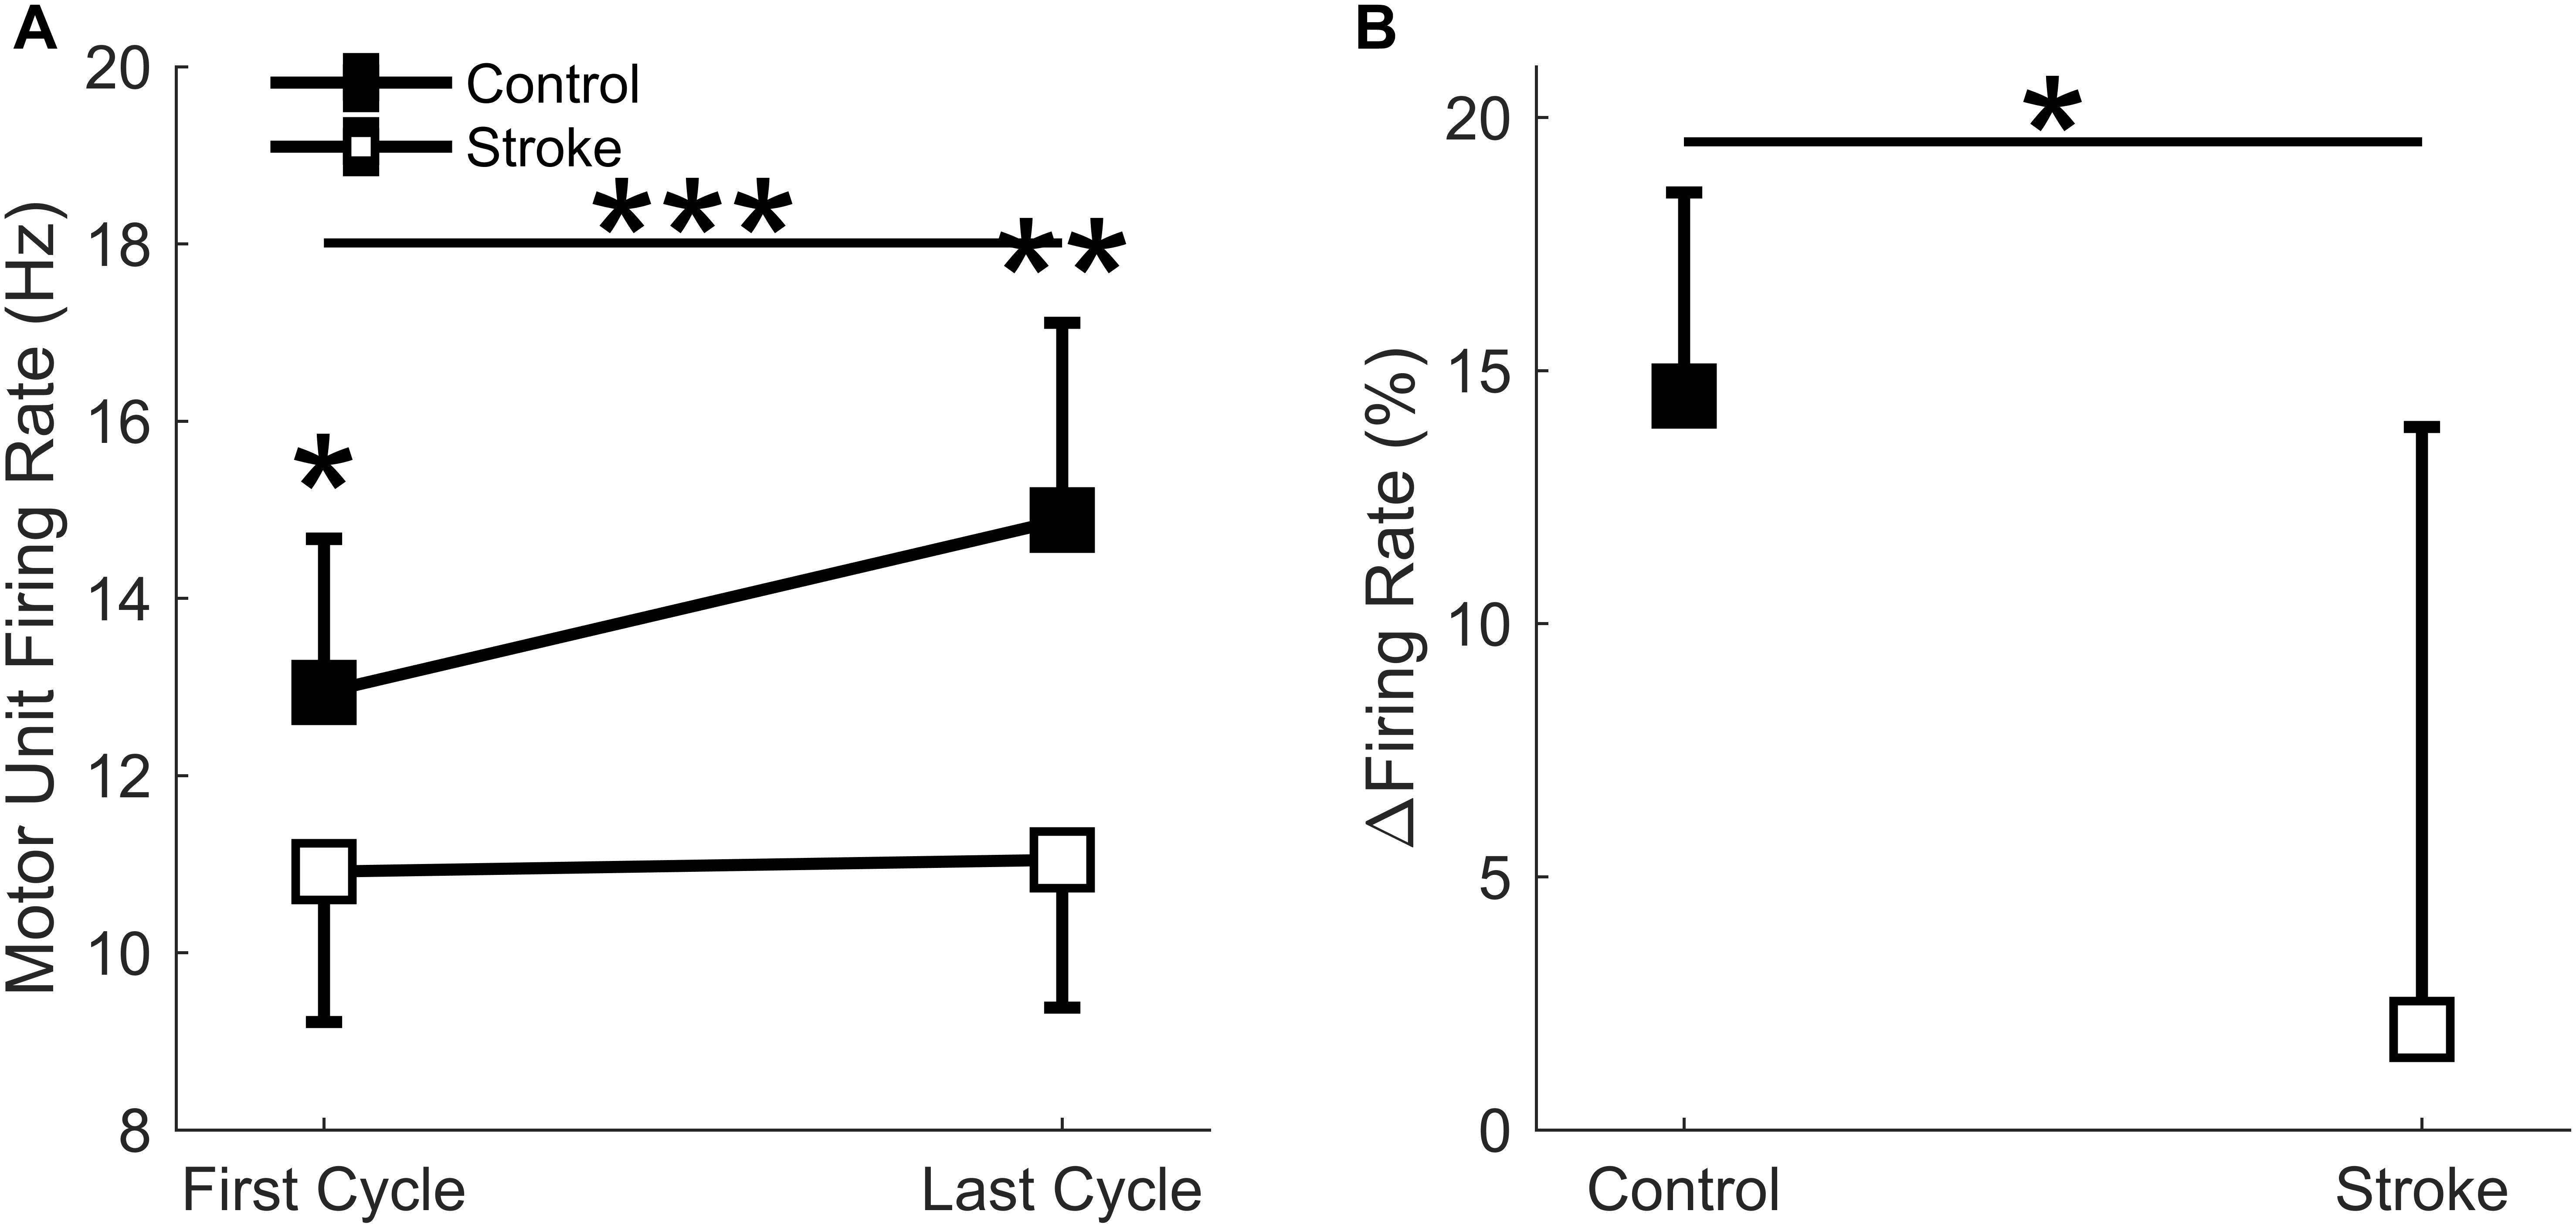
Figure 8. Motor unit firing rate. A significant interaction effect was observed (p = 0.006) as the control participants significantly increased motor unit firing rates with fatigue cycle. Stroke participants had significantly lower firing rates at the first (p < 0.05) and last (p < 0.01) fatigue cycles, and only the control group significantly increased firing rates with fatigue (p < 0.001) (A). Control participants had a significantly greater increase in normalized firing rates compared to the stroke group (p < 0.05) (B). ∗p < 0.05, ∗∗p < 0.01, and ∗∗∗p < 0.001.
EMG Root Mean Square (RMS)
There was a significant interaction effect (cycle∗group) observed [F(1,17) = 10.5, p = 0.005] as there was a greater increase in the RMS magnitude in the control participants (435.3 ± 302.3 μV to 551.9 ± 353.9 μV) as compared to individuals with stroke (244.4 ± 161.1 μV to 279.45 ± 161.1 μV). A main effect of fatigue cycle [F(1,17) = 36.4, p < 0.001] was observed, but there was not a main effect of group [F(1,17) = 3.9, p = 0.065]. The relative increase in EMG RMS was greater in the controls compared to individuals with stroke (32.4 ± 17.7% vs. 16.0 ± 9.4%), F(1,17) = 6.6, p = 0.020. In summary, the magnitude and relative change in RMS was greater for the control participants compared to the participants with stroke.
EMG Mean Frequency
There was a main effect of fatigue cycle [F(1,17) = 45.6, p = 0.016] as the mean EMG frequency decreased (73.3 ± 14.8 Hz to 67.1 ± 14.6 Hz) from the first cycle to last cycle. There was not a main effect of group [F(1,17) = 0.3, p = 0.573], but the interaction effect (cycle∗group) approached significance [F(1,17) = 4.3, p = 0.054]. There was a significantly greater relative decrease in EMG mean frequency in controls compared to individuals with stroke (-14.9 ± 11.9% vs. -1.14 ± 15.6%), [F(1,17) = 14.5, p = 0.048]. In summary, the decrease in relative change and magnitude in mean EMG frequency was greater for the control than stroke participants.
Correlations of Relative Changes in Blood Flow and Motor Unit Firing Rates
Correlations were performed to test if changes in motor unit firing rates correlated with changes in blood flow from the first fatigue cycle to the last fatigue cycle (Figure 9). There was a positive correlation between change in blood flow and change in motor unit firing rates [r2 = 0.6, F(1,8) = 15.1, p = 0.004, β = 0.362] for the individuals with stroke, but not for the control group [r2 = 0.00242, F(1,4) = 0.1, p = 0.768, β = 0.009]. In summary, changes in blood flow had a significant positive correlation with changes in firing rate for the participants with stroke but not for controls, showing that motor unit firing rates correlated with blood flow only for the individuals with stroke.
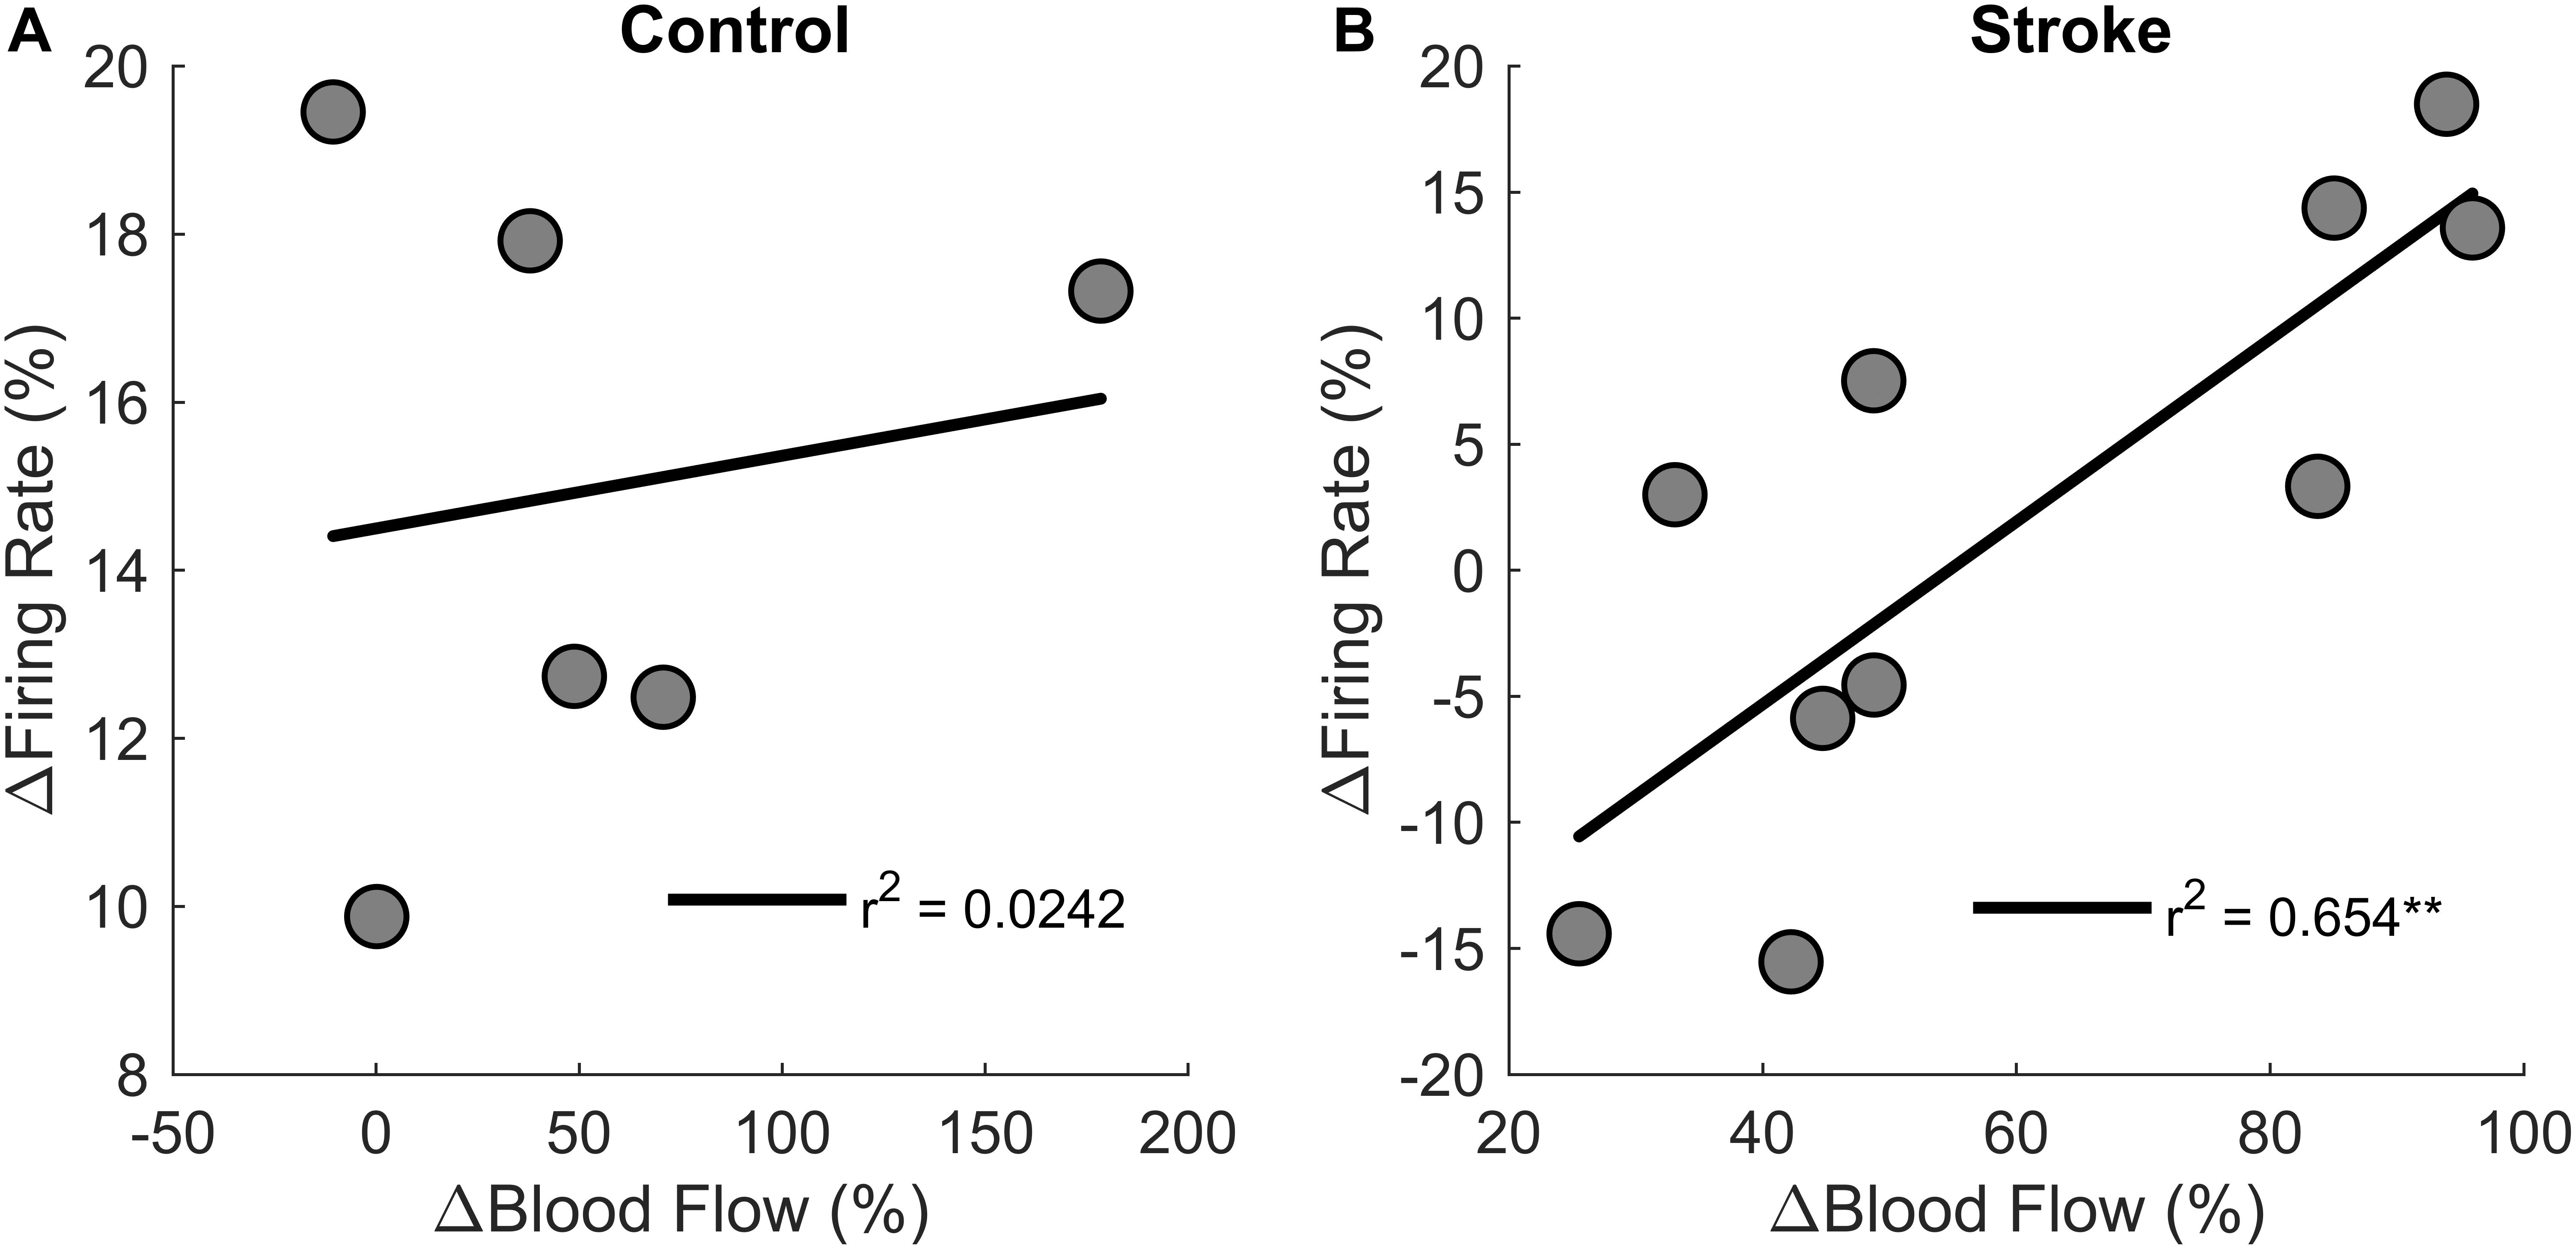
Figure 9. Changes in motor unit firing rates and blood flow. Change in motor unit firing rate correlated with changes in blood flow from the first fatigue cycle to the last fatigue cycle for the participants with stroke (p < 0.01) (B) but not for controls (A).
Discussion
To understand the role of muscle perfusion during fatiguing contractions after a stroke and the effect on motor unit activity, we compared the hyperemic response of healthy controls to individuals with stroke and associated this with differences in motor unit firing rates. The novel findings in this study were: (1) the net magnitude of the blood flow through the femoral artery was blunted for people with stroke compared to healthy controls during intermittent, fatiguing contractions (Figure 5); (2) greater increases in blood flow related to longer task duration for the control group but not the stroke group (Figure 6); and (3) changes in motor unit firing rates correlated with changes in blood flow for people with stroke (Figure 9). The individuals with stroke had a lower magnitude of blood flow through the femoral artery, but this did not have a lesser impact on peripheral metrics, such as resting twitch torque, than the controls; furthermore, the positive correlation among changes in motor unit firing rates and blood flow suggests a connection between muscle perfusion and neural inputs to the motoneuron. The differences seen in metrics of fatigue between controls and stroke are likely due to different mechanisms of fatigue for each group. Despite a decreased hyperemic response in the stroke group, blood flow appears to have a greater impact on peripheral fatigue and task duration for the control group. Factors which impact central fatigue such as associations between corticospinal and corticoreticular systems and inhibitory spinal reflex pathways may have a greater influence on blood flood and motor unit firing rates for the stroke group compared to the control group. Potential mechanisms and motor implications are discussed below.
Post-stroke Differences in Hyperemia
Post-contraction hyperemia was greater for controls compared to participants with stroke (Figure 5). In addition, greater torque production resulted in greater hyperemia for both control and stroke groups (Figure 7). As was previously shown, an increased blood flow response in the paretic leg positively correlated with limb strength (Durand et al., 2015). Stronger individuals typically have a greater blood flow response, likely because of strength-associated differences in the intramuscular pressure and mechanical compression of the vessels (Barnes, 1980; Hunter et al., 2009; Durand et al., 2015). Therefore, it is likely that differences in blood flow magnitude are partially due to strength differences between and within the control and stroke groups.
It is also possible that autonomic dysregulation contributed to the blunted magnitude of the blood flow response in the individuals with stroke. After a stroke, a simultaneous decrease in parasympathetic activity and increase in sympathetic activity has been observed during Ewing’s battery assessment and during continuous monitoring of heart rate variability, blood pressure, and respiration (Dütsch et al., 2007; Xiong et al., 2014). This may increase peripheral vasoconstriction, lowering the blood flow magnitude in the stroke group compared to the control group.
Post-stroke Blood Flow Deficits Do Not Relate to Metrics of Peripheral Fatigue or Task Duration
Healthy individuals and people with stroke had similar relative declines in MVC torque and similar time to task failure, indicating that both groups reached a similar degree of neuromuscular fatigue at task failure; however, differences in the degree of central fatigue for the stroke group compared to the degree of peripheral fatigue for the control group showed different mechanisms of fatigue. The differences in central and peripheral fatigue, as well as differences in target torque, may explain why control participants did not have longer task duration compared to the stroke participants as we expected. The control group had greater fatigue within the muscle fibers (peripheral fatigue) as indicated by larger decreases in resting twitch torque (Figure 4) and greater compression of the EMG spectrum compared to the stroke group (De Luca, 1984; Merletti et al., 1990; Riley and Bilodeau, 2002; Knorr et al., 2011). Individuals with stroke, however, showed greater decreases in voluntary activation (Figure 3), less increase in EMG RMS, and less motor unit rate modulation (Figure 8) compared to the controls. These metrics indicate some combination of decreases from descending motor command and excitatory afferent inputs, as well as increases from inhibitory afferent inputs, to the motoneuron (Gandevia, 2001; Riley and Bilodeau, 2002; Knorr et al., 2011; Bowden et al., 2014; McManus et al., 2017). We also observed that greater increases in blood flow correlated with longer task duration only for the control group (Figure 6). Thus, the differences in metrics of central and peripheral fatigue may explain why blood flow did not have a greater disturbance to muscle contractile properties for the participants with stroke.
Controls had a much greater reduction in metrics of peripheral fatigue. Although blood flow increased for both groups, changes in blood flow related to task duration only for the control group. The accumulation of metabolic byproducts, such as extracellular K+/Ca2+ from a slowed sarcoplasmic reticulum uptake and H+ from lactic acid (Fitts, 2011; Kent-Braun et al., 2012), decreases muscle contractile properties and conduction velocity (Tesch et al., 1983; Kupa et al., 1995). This was reflected in lower post-fatigue twitch amplitudes (Kent-Braun et al., 2012) (Figure 4) and compression of the EMG power spectrum (De Luca, 1984) for the control group but not the stroke group. This aligned with previous fatigue studies that involved sustained contractions; however, those studies did not associate these metrics with metabolite accumulation and perfusion (McComas et al., 1973; Riley and Bilodeau, 2002; Fimland et al., 2011; Knorr et al., 2011; Bowden et al., 2014; McManus et al., 2017). We were able to study the effects of blood flow on muscle fiber properties because the intermittent task (as opposed to a sustained task) involves a perfusion-dependent mechanism – greater perfusion results in reduced metabolic accumulation (Sadamoto et al., 1983). This was evident for the controls as participants with greater blood flow had longer task duration (Figure 6). The differing effects of blood flow on metrics of peripheral fatigue and task duration suggest that the influence of post-contraction hyperemia was not the same for controls and participants with stroke.
It appears the individuals with stroke were inhibited by central fatigue before blood flow was a factor in muscle force generation. One might expect the greater perfusion to result in a greater clearance of metabolites (Sadamoto et al., 1983) and greater fatigue resistance; however, blood flow did not correlate with task duration for the stroke participants (Figure 6B). Like previous studies, voluntary activation was significantly reduced at task failure (Figure 3; Newham et al., 1995; Riley and Bilodeau, 2002; Knorr et al., 2011; Bowden et al., 2014). The decreased voluntary activation assumes a decreased neural drive to the muscle (Allen et al., 1995; Shield and Zhou, 2004). This is likely facilitated by a loss of excitatory drive from the descending motor pathways after the stroke lesion ( Murase et al., 2004; Jang et al., 2017). The reduced voluntary activation not only reflects a reduction in the integrity of the corticospinal tract, but also explains a portion of the post-stroke impairments in the firing rate magnitude and rate modulation (Figure 8) manifested in the reduced EMG (Gemperline et al., 1995). It is likely that the effects of deficient blood flow on muscle fiber properties and task duration were not observed because of the dominant central factors contributing to neuromuscular fatigue.
Motor Unit Firing Rates Correlated With Blood Flow Changes After Stroke
We saw that changes in blood flow correlated with motor unit firing rate modulation in the stroke group. Contrary to this study, previous studies observed either no change or decreases in motor unit firing rates with fatigue during sustained fatiguing contractions for both healthy individuals and individuals with stroke (Garland et al., 1994; Adam and De Luca, 2005; Mettler and Griffin, 2016; McManus et al., 2017); however, It has also been observed that motor unit firing rates increased with fatiguing contractions (Contessa et al., 2016). This study differed because motor unit firing rates were observed during intermittent contractions rather than sustained contractions. Motor unit firing rates increased in all control participants with fatigue; however, motor unit firing rates decreased in magnitude in 4/10 stroke participants. These four individuals also had lower changes in blood flow compared to those with greater rate modulation (Figure 9B). A possible explanation for the positive correlations observed for the stroke group but not the control group may be that the stroke lesion disrupted the common drive to the corticospinal and corticoreticular tracts (Buford and Davidson, 2004; Herbert et al., 2015; Brownstone and Chopek, 2018). Because corticoreticular projections originate from common areas as the corticospinal projections (primarily from the primary motor cortex and premotor cortical areas), disruptions of these common areas after a stroke likely have implications on autonomic control of blood flow from the reticular system and activation of the motoneuron pools through the corticospinal system. In animal models with decerebration or ischemic cortical lesions, inhibitory inputs from corticobulbar pathways to the reticular formation are lost, causing a greater relative increase in reticulospinal influence and a concurrent relative decrease in corticospinal influence (Hounsgaard et al., 1988; Herbert et al., 2015). This is thought to be the case in human stroke as there is evidence of increased activity in the reticulospinal pathways, possibly from the disinhibition of the reticular formation, and a loss of corticospinal input (Foltys et al., 2003; Kline et al., 2007; McPherson et al., 2008, 2018; Murphy et al., 2015; Jang et al., 2017). The decreased post-contraction blood flow through the femoral artery in this study may indicate increased autonomic drive, possibly caused by a disinhibited reticular drive providing an excessive sympathetic outflow. The reticular system is known to modulate autonomic outflow and is a source for the vasoconstrictor norepinephrine (Nette et al., 2006; Schwarz et al., 2015). The positive correlation between the hyperemic response and motor unit firing rate modulation is likely a result of the damage to these common pathways – controls and individuals with stroke that had less damage to these common pathways likely had greater modulation of motor unit firing rates and voluntary activation, as well as greater inhibition to the sympathetic outflow from the reticular formation.
An alternative explanation for the positive correlation between blood flow and motor unit modulation (Figure 9B) is that the decreased blood flow for the individuals with stroke may have an inhibitory effect on the motoneuron pool. Motor unit firing rates may be associated with blood flow because metabolic accumulation activates group III/IV afferent pathways, and these pathways are known to have an inhibitory effect on the motoneuron pool during fatiguing exercise (Kaufman et al., 1983; Amann et al., 2008; Amann, 2012; Taylor et al., 2016). The inhibitory effects of ischemia on motor unit output may also be enhanced because these pathways may be hyper-excitable after a stroke (Hidler and Schmit, 2004; Li, 2017). Recently, we showed a greater decrease in paretic motor unit firing rates during a sub-maximal contractions with a transient (5 min) bout of whole limb ischemia as compared to controls (Murphy et al., 2018). Therefore, the lack of motor unit modulation and inability to significantly increase EMG RMS may partly be due to enhanced inhibitory afferent input from group III/IV pathways. Though it is possible these afferents were activated in the control group, central factors were not significantly affected before peripheral fatigue was a factor. Enhanced group III/IV pathways may also explain why changes in motor unit firing rates significantly correlated with changes in blood flow for the stroke group but not the control group. Thus, it is plausible that the stroke-related deficiencies in the peripheral blood flow to the exercising muscle and a change in the excitability of the group III/IV afferent pathways may enhance the inhibitory response to ischemia, restricting motor unit firing rates and modulation.
Implications for Motor Performance
Results from this study have important implications for motor performance and motor recovery post-stroke. The intermittent contractions, as opposed to sustained, showed the effects of perfusion on motor performance after a stroke. This provides insight into functional motor performance because many activities of daily living, such as walking, consist of intermittent contractions. Currently, stroke rehabilitation strategies consider cardiovascular fitness and limb strength as separate issues. This study shows the importance of considering the cooperation between the corticoreticular and corticospinal tracts in force generation after stroke. We showed that individuals with stroke that have greater post-contraction blood flow also have greater strength (Figure 7) and greater motor unit modulation (Figure 9). It seems logical that improving the hyperemic response to exercise would help improve fatigue resistance, but the data from this study would suggest that neural issues are the limiting factor to force generation during fatiguing exercise. It appears that improving neural function should remain the primary focus for rehabilitation strategies; furthermore, the evidence of increased reticulospinal influence together with the loss of corticospinal influence suggests that these two systems may be an undeveloped method for recovery. The loss of common pathways between the reticular system and spinal motoneurons may explain the systemic loss of both blood flow and motor unit rate modulation in some of the stroke participants. It is also possible that as neural function improves, perfusion to the muscle becomes more important. It has been shown that the hyperemic response to non-fatiguing muscle contractions has a positive relationship to limb function (Durand et al., 2015). Taken together, this data allows us to speculate that improving the neural contributions to the hyperemic response of limb muscles to exercise and motor unit rate modulation could optimize motor recovery in people with stroke.
Ethics Statement
All participants gave informed consent before participation in this study, and the procedures were approved by the Medical College of Wisconsin Institutional Review Board (PRO190103).
Author Contributions
All authors contributed to the study design, interpretation of data, approved to the final version of the manuscript to be published, and agreed to be accountable for all aspects of the work. SM and MD collected and processed the data.
Funding
This work was funded by the National Institute of Neurological Disorders and Stroke for the National Institutes of Health, award number: R21 NS088818. SM was supported by the National Center for Advancing Translational Sciences, National Institutes of Health, award number: TL1TR001437. The content is solely the responsibility of the authors and does not necessarily represent the official views of the NIH. FN has received funding from the European Union’s Horizon 2020 Research and Innovation Program under the Marie Skłodowska-Curie grant agreement no. 702491 (NeuralCon).
Conflict of Interest Statement
The authors declare that the research was conducted in the absence of any commercial or financial relationships that could be construed as a potential conflict of interest.
References
Adam, A., and De Luca, C. J. (2005). Firing rates of motor units in human vastus lateralis muscle during fatiguing isometric contractions. J. Appl. Physiol. 99, 268–280. doi: 10.1152/japplphysiol.01344.2004
Allen, G. M., Gandevia, S. C., and McKenzie, D. K. (1995). Reliability of measurements of muscle strength and voluntary activation using twitch interpolation. Muscle Nerve 18, 593–600. doi: 10.1002/mus.880180605
Amann, M. (2012). Significance of Group III and IV muscle afferents for the endurance exercising human. Clin. Exp. Pharmacol. Physiol. 39, 831–835. doi: 10.1111/j.1440-1681.2012.05681.x
Amann, M., Proctor, L. T., Sebranek, J. J., Eldridge, M. W., Pegelow, D. F., and Dempsey, J. A. (2008). Somatosensory feedback from the limbs exerts inhibitory influences on central neural drive during whole body endurance exercise. J. Appl. Physiol. 105, 1714–1724. doi: 10.1152/japplphysiol.90456.2008
Barnes, W. S. (1980). The relationship between maximum isometric strength and intramuscular circulatory occlusion. Ergonomics 23, 351–357. doi: 10.1080/00140138008924748
Billinger, S. A., Gajewski, B. J., Guo, L. X., and Kluding, P. M. (2009). Single limb exercise induces femoral artery remodeling and improves blood flow in the hemiparetic leg poststroke. Stroke 40, 3086–3090. doi: 10.1161/STROKEAHA.109.550889
Bowden, J. L., Taylor, J. L., and McNulty, P. A. (2014). Voluntary activation is reduced in both the more- and less-affected upper limbs after unilateral stroke. Front. Neurol. 5:239. doi: 10.3389/fneur.2014.00239
Brownstone, R. M., and Chopek, J. W. (2018). Reticulospinal systems for tuning motor commands. Front. Neural Circuits 12:30. doi: 10.3389/fncir.2018.00030
Buford, J. A., and Davidson, A. G. (2004). Movement-related and preparatory activity in the reticulospinal system of the monkey. Exp. Brain Res. 159, 284–300. doi: 10.1007/s00221-004-1956-4
Chen, G., and Patten, C. (2008). Joint moment work during the stance-to-swing transition in hemiparetic subjects. J. Biomech. 41, 877–883.
Chen, M., Zhang, X., Lu, Z., Li, X., and Zhou, P. (2018). Two-source validation of progressive FastICA peel-off for automatic surface EMG decomposition in human first dorsal interosseous muscle. Int. J. Neural Syst. 28:1850019. doi: 10.1142/S0129065718500193
Contessa, P., De Luca, C. J., and Kline, J. C. (2016). The compensatory interaction between motor unit firing behavior and muscle force during fatigue. J. Neurophysiol. 116, 1579–1585. doi: 10.1152/jn.00347.2016
De Luca, J. (1984). Myoelectrical manifestations of localized muscular fatigue in humans. Crit. Rev. Biomed. Eng. 11, 251–279.
Dean, C. M., Richards, C. L., and Malouin, F. (2001). Walking speed over 10 metres overestimates locomotor capacity after stroke. Clin. Rehabil. 15, 415–421.
Durand, M. J., Murphy, S. A., Schaefer, K. K., Hunter, S. K., Schmit, B. D., Gutterman, D. D., et al. (2015). Impaired hyperemic response to exercise post stroke. PLoS One 10:e0144023. doi: 10.1371/journal.pone.0144023
Dütsch, M., Burger, M., Dörfler, C., Schwab, S., and Hilz, M. J. (2007). Cardiovascular autonomic function in poststroke patients. Neurology 69, 2249–2255. doi: 10.1212/01.wnl.0000286946.06639.a7
Enoka, R. M., and Duchateau, J. (2008). Muscle fatigue: what, why and how it influences muscle function. J. Physiol. 586, 11–23.
Fimland, M. S., Moen, P. M., Hill, T., Gjellesvik, T. I., Tørhaug, T., Helgerud, J., et al. (2011). Neuromuscular performance of paretic versus non-paretic plantar flexors after stroke. Eur. J. Appl. Physiol. 111, 3041–3049. doi: 10.1007/s00421-011-1934-z
Fitts, R. (2011). “The muscular system: fatigue processes,” in Advanced Exercise Physiology, eds J. Ehrman, D. Kerrigan, and S. Keteyian (Philadelphia, PA: Lippincott Williams & Wilkins).
Foltys, H., Krings, T., Meister, I. G., Sparing, R., Boroojerdi, B., Thron, A., et al. (2003). Motor representation in patients rapidly recovering after stroke: a functional magnetic resonance imaging and transcranial magnetic stimulation study. Clin. Neurophysiol. 114, 2404–2415.
Gandevia, S. C. (2001). Spinal and supraspinal factors in human muscle fatigue. Physiol. Rev. 81, 1725–1789.
Gandevia, S. C., Allen, G. M., Butler, J. E., and Taylor, J. L. (1996). Supraspinal factors in human muscle fatigue: evidence for suboptimal output from the motor cortex. J. Physiol. 490(Pt 2), 529–536.
Garland, S. J., Enoka, R. M., Serrano, L. P., and Robinson, G. A. (1994). Behavior of motor units in human biceps brachii during a submaximal fatiguing contraction. J. Appl. Physiol. 76, 2411–2419. doi: 10.1152/jappl.1994.76.6.2411
Gemperline, J. J., Allen, S., Walk, D., and Rymer, W. Z. (1995). Characteristics of motor unit discharge in subjects with hemiparesis. Muscle Nerve 18, 1101–1114. doi: 10.1002/mus.880181006
Herbert, W. J., Powell, K., and Buford, J. A. (2015). Evidence for a role of the reticulospinal system in recovery of skilled reaching after cortical stroke: initial results from a model of ischemic cortical injury. Exp. Brain Res. 233, 3231–3251. doi: 10.1007/s00221-015-4390-x
Hidler, J. M., and Schmit, B. D. (2004). Evidence for force-feedback inhibition in chronic stroke. IEEE Trans. Neural Syst. Rehabil. Eng. 12, 166–176. doi: 10.1109/TNSRE.2004.828428
Holobar, A., Minetto, M. A., Botter, A., Negro, F., and Farina, D. (2010). Experimental analysis of accuracy in the identification of motor unit spike trains from high-density surface EMG. IEEE Trans. Neural Syst. Rehabil. Eng. 18, 221–229. doi: 10.1109/TNSRE.2010.2041593
Holobar, A., and Zazul, D. (2007). Multichannel blind source separation using convolution kernel compensation. IEEE Trans. Signal Process. 55, 4487–4496.
Horstman, M., Beltman, M. J., Gerrits, K. H., Koppe, P., Janssen, T. W., Elich, P., et al. (2008). Intrinsic muscle strength and voluntary activation of both lower limbs and functional performance after stroke. Clin. Physiol. Funct. Imaging 28, 251–261. doi: 10.1111/j.1475-097X.2008.00802.x
Hounsgaard, J., Hultborn, H., Jespersen, B., and Kiehn, O. (1988). Bistability of alpha-motoneurones in the decerebrate cat and in the acute spinal cat after intravenous 5-hydroxytryptophan. J. Physiol. 405, 345–367.
Hu, X. L., Tong, K. Y., and Hung, L. K. (2006). Firing properties of motor units during fatigue in subjects after stroke. J. Electromyogr. Kinesiol. 16, 469–476. doi: 10.1016/j.jelekin.2005.09.005
Hunter, S. K. (2018). Performance fatigability: mechanisms and task specificity. Cold Spring Harb. Perspect. Med. 8:a029728. doi: 10.1101/cshperspect.a029728
Hunter, S. K., Griffith, E. E., Schlachter, K. M., and Kufahl, T. D. (2009). Sex differences in time to task failure and blood flow for an intermittent isometric fatiguing contraction. Muscle Nerve 39, 42–53. doi: 10.1002/mus.21203
Hyngstrom, S., Onushko, T., Heitz, R. P., Rutkowski, A., Hunter, S. K., and Schmit, B. D. (2012). Stroke-related changes in neuromuscular fatigue of the hip flexors and functional implications. Am. J. Phys. Med. Rehabil. 91, 33–42. doi: 10.1097/PHM.0b013e31823caac0
Iosa, M., Morone, G., Fusco, A., Pratesi, L., Bragoni, M., and Coiro, P. (2012). Effects of walking endurance reduction on gait stability in patients with stroke. Stroke Res. Treat. 2012:810415. doi: 10.1155/2012/810415
Ivey, F. M., Gardner, A. W., Dobrovolny, C. L., and Macko, R. F. (2004). Unilateral impairment of leg blood flow in chronic stroke patients. Cerebrovasc. Dis. 18, 283–289. doi: 10.1159/000080353
Jang, S. H., Kim, D. H., Kim, S. H., and Seo, J. P. (2017). The relation between the motor evoked potential and diffusion tensor tractography for the corticospinal tract in chronic hemiparetic patients with cerebral infarct. Somatosens. Mot. Res. 34, 134–138. doi: 10.1080/08990220.2017.1343188
Jonkers, I., Delp, S., and Patten, C. (2009). Capacity to increase walking speed is limited by impaired hip and ankle power generation in lower functioning persons post-stroke. Gait Posture 29, 129–137. doi: 10.1016/j.gaitpost.2008.07.010
Kaufman, M. P., Longhurst, J. C., Rybicki, K. J., Wallach, J. H., and Mitchell, J. H. (1983). Effects of static muscular contraction on impulse activity of groups III and IV afferents in cats. J. Appl. Physiol. Respir. Environ. Exerc. Physiol. 55(1 Pt 1), 105–112. doi: 10.1152/jappl.1983.55.1.105
Kent-Braun, J. A., Fitts, R. H., and Christie, A. (2012). Skeletal muscle fatigue. Compr. Physiol. 2, 997–1044. doi: 10.1002/cphy.c110029
Klass, M., Baudry, S., and Duchateau, J. (2007). Voluntary activation during maximal contraction with advancing age: a brief review. Eur. J. Appl. Physiol. 100, 543–551.
Klein, S., Brooks, D., Richardson, D., McIlroy, W. E., and Bayley, M. T. (2010). Voluntary activation failure contributes more to plantar flexor weakness than antagonist coactivation and muscle atrophy in chronic stroke survivors. J. Appl. Physiol. 109, 1337–1346. doi: 10.1152/japplphysiol.00804.2009
Kline, T. L., Schmit, B. D., and Kamper, D. G. (2007). Exaggerated interlimb neural coupling following stroke. Brain 130(Pt 1), 159–169. doi: 10.1093/brain/awl278
Knorr, S., Ivanova, T. D., Doherty, T. J., Campbell, J. A., and Garland, S. J. (2011). The origins of neuromuscular fatigue post-stroke. Exp. Brain Res. 214, 303–315. doi: 10.1007/s00221-011-2826-5
Kuhnen, H. R., Rybar, M. M., Onushko, T., Doyel, R. E., Hunter, S. K., Schmit, B. D., et al. (2015). Stroke-related effects on maximal dynamic hip flexor fatigability and functional implications. Muscle Nerve 51, 446–448. doi: 10.1002/mus.24520
Kupa, E. J., Roy, S. H., Kandarian, S. C., and De Luca, C. J. (1995). Effects of muscle fiber type and size on EMG median frequency and conduction velocity. J. Appl. Physiol. 79, 23–32. doi: 10.1152/jappl.1995.79.1.23
Li, S. (2017). Spasticity, motor recovery, and neural plasticity after stroke. Front. Neurol. 8:120. doi: 10.3389/fneur.2017.00120
Lloyd-Jones, D., Adams, R., Carnethon, M., De Simone, G., Ferguson, T. B., and Flegal, K. (2009). Heart disease and stroke statistics–2009 update: a report from the American Heart Association Statistics Committee and Stroke Statistics Subcommittee. Circulation 119, 480–486. doi: 10.1161/CIRCULATIONAHA.108.191259
Martin, P. G., Weerakkody, N., Gandevia, S. C., and Taylor, J. L. (2008). Group III and IV muscle afferents differentially affect the motor cortex and motoneurones in humans. J. Physiol. 586, 1277–1289. doi: 10.1113/jphysiol.2007.140426
Martinez-Valdes, E., Negro, F., Laine, C. M., Falla, D., Mayer, F., and Farina, D. (2017). Tracking motor units longitudinally across experimental sessions with high-density surface electromyography. J. Physiol. 595, 1479–1496. doi: 10.1113/JP273662
McComas, J., Sica, R. E., Upton, A. R., and Aguilera, N. (1973). Functional changes in motoneurones of hemiparetic patients. J. Neurol. Neurosurg. Psychiatry 36, 183–193.
McManus, L., Hu, X., Rymer, W. Z., Suresh, N. L., and Lowery, M. M. (2017). Motor unit activity during fatiguing isometric muscle contraction in hemispheric stroke survivors. Front. Hum. Neurosci. 11:569. doi: 10.3389/fnhum.2017.00569
McPherson, J. G., Ellis, M. D., Harden, R. N., Carmona, C., Drogos, J. M., Heckman, C. J., et al. (2018). Neuromodulatory inputs to motoneurons contribute to the loss of independent joint control in chronic moderate to severe hemiparetic stroke. Front. Neurol. 9:470. doi: 10.3389/fneur.2018.00470
McPherson, J. G., Ellis, M. D., Heckman, C. J., and Dewald, J. P. (2008). Evidence for increased activation of persistent inward currents in individuals with chronic hemiparetic stroke. J. Neurophysiol. 100, 3236–3243. doi: 10.1152/jn.90563.2008
Merletti, R., Knaflitz, M., and De Luca, C. J. (1990). Myoelectric manifestations of fatigue in voluntary and electrically elicited contractions. J. Appl. Physiol. 69, 1810–1820. doi: 10.1152/jappl.1990.69.5.1810
Mettler, J. A., and Griffin, L. (2016). Muscular endurance training and motor unit firing patterns during fatigue. Exp. Brain Res. 234, 267–276. doi: 10.1007/s00221-015-4455-x
Murase, N., Duque, J., Mazzocchio, R., and Cohen, L. G. (2004). Influence of interhemispheric interactions on motor function in chronic stroke. Ann. Neurol. 55, 400–409. doi: 10.1002/ana.10848
Murphy, S. A., Berrios, R., Nelson, P. A., Negro, F., Farina, D., Schmit, B., et al. (2015). Impaired regulation post-stroke of motor unit firing behavior during volitional relaxation of knee extensor torque assessed using high density surface EMG decomposition. Conf. Proc. IEEE Eng. Med. Biol. Soc. 2015, 4606–4609. doi: 10.1109/EMBC.2015.7319420
Murphy, S. A., Negro, F., Farina, D., Onushko, T., Durand, M., Hunter, S. K., et al. (2018). Stroke increases ischemia-related decreases in motor unit discharge rates. J. Neurophysiol. 120, 3246–3256. doi: 10.1152/jn.00923.2017
Negro, F., Muceli, S., Castronovo, A. M., Holobar, A., and Farina, D. (2016). Multi-channel intramuscular and surface EMG decomposition by convolutive blind source separation. J. Neural Eng. 13:026027. doi: 10.1088/1741-2560/13/2/026027
Nette, R. W., Ie, E. H., Vletter, W. B., Krams, R., Weimar, W., and Zietse, R. (2006). Norepinephrine-induced vasoconstriction results in decreased blood volume in dialysis patients. Nephrol. Dial Transplant. 21, 1305–1311. doi: 10.1093/ndt/gfk070
Newham, D. J., Davies, J., and Mayston, M. (1995). Voluntary force generation and activation in the knee muscles of stroke patients with mild spastic hemiparesis. J. Physiol. 483:128.
Peters, H. T., Dunning, K., Belagaje, S., Kissela, B. M., Ying, J., Laine, J., et al. (2017). Navigated transcranial magnetic stimulation: a biologically based assay of lower extremity impairment and gait velocity. Neural Plast 2017:6971206. doi: 10.1155/2017/6971206
Riley, N. A., and Bilodeau, M. (2002). Changes in upper limb joint torque patterns and EMG signals with fatigue following a stroke. Disabil. Rehabil. 24, 961–969.
Rybar, M. M., Walker, E. R., Kuhnen, H. R., Ouellette, D. R., Berrios, R., and Hunter, S. K. (2014). The stroke-related effects of hip flexion fatigue on over ground walking. Gait Posture 39, 1103–1108. doi: 10.1016/j.gaitpost.2014.01.012
Sadamoto, T., Bonde-Petersen, F., and Suzuki, Y. (1983). Skeletal muscle tension, flow, pressure, and EMG during sustained isometric contractions in humans. Eur. J. Appl. Physiol. Occup. Physiol. 51, 395–408.
Schwarz, L. A., Miyamichi, K., Gao, X. J., Beier, K. T., Weissbourd, B., DeLoach, K. E., et al. (2015). Viral-genetic tracing of the input-output organization of a central noradrenaline circuit. Nature 524, 88–92. doi: 10.1038/nature14600
Shield, A., and Zhou, S. (2004). Assessing voluntary muscle activation with the twitch interpolation technique. Sports Med. 34, 253–267.
Taylor, J. L., Amann, M., Duchateau, J., Meeusen, R., and Rice, C. L. (2016). Neural contributions to muscle fatigue: from the brain to the muscle and back again. Med. Sci. Sports Exerc. 48, 2294–2306. doi: 10.1249/MSS.0000000000000923
Tesch, P. A., Komi, P. V., Jacobs, I., Karlsson, J., and Viitasalo, J. T. (1983). Influence of lactate accumulation of EMG frequency spectrum during repeated concentric contractions. Acta Physiol. Scand. 119, 61–67. doi: 10.1111/j.1748-1716.1983.tb07306.x
Walter, J. P., McGahan, J. P., and Lantz, B. M. (1986). Absolute flow measurements using pulsed Doppler US. Work in progress. Radiology 159, 545–548. doi: 10.1148/radiology.159.2.3515426
Keywords: stroke, blood flow, motor unit, fatigue, EMG
Citation: Murphy S, Durand M, Negro F, Farina D, Hunter S, Schmit B, Gutterman D and Hyngstrom A (2019) The Relationship Between Blood Flow and Motor Unit Firing Rates in Response to Fatiguing Exercise Post-stroke. Front. Physiol. 10:545. doi: 10.3389/fphys.2019.00545
Received: 23 November 2018; Accepted: 17 April 2019;
Published: 10 May 2019.
Edited by:
Giuseppe D’Antona, University of Pavia, ItalyReviewed by:
C. J. Heckman, Northwestern University, United StatesQi Xu, Huazhong University of Science and Technology, China
Copyright © 2019 Murphy, Durand, Negro, Farina, Hunter, Schmit, Gutterman and Hyngstrom. This is an open-access article distributed under the terms of the Creative Commons Attribution License (CC BY). The use, distribution or reproduction in other forums is permitted, provided the original author(s) and the copyright owner(s) are credited and that the original publication in this journal is cited, in accordance with accepted academic practice. No use, distribution or reproduction is permitted which does not comply with these terms.
*Correspondence: Allison Hyngstrom, YWxsaXNvbi5oeW5nc3Ryb21AbWFycXVldHRlLmVkdQ==