
94% of researchers rate our articles as excellent or good
Learn more about the work of our research integrity team to safeguard the quality of each article we publish.
Find out more
ORIGINAL RESEARCH article
Front. Physiol., 31 August 2018
Sec. Striated Muscle Physiology
Volume 9 - 2018 | https://doi.org/10.3389/fphys.2018.01220
 Henning T. Langer1,2,3*Joan M. G. Senden4Annemie P. Gijsen4Stefan Kempa5,6Luc J. C. van Loon4Simone Spuler1,2,3,5,6
Muscle loss is a severe complication of many medical conditions such as cancer, cardiac failure, muscular dystrophies, and nerve damage. The contribution of myofibrillar protein synthesis (MPS) to the loss of muscle mass after nerve damage is not clear. Using deuterium oxide (D2O) labeling, we demonstrate that MPS is significantly increased in rat m. tibialis anterior (TA) compared to control (3.23 ± 0.72 [damaged] to 2.09 ± 0.26%∗day−1 [control]) after 4 weeks of nerve constriction injury. This is the case despite substantial loss of mass of the TA (350 ± 96 mg [damaged] to 946 ± 361 mg [control]). We also show that expression of regulatory proteins involved with MPS (p70s6k1: 2.4 ± 0.3 AU [damaged] to 1.8 ± 0.2 AU [control]) and muscle protein breakdown (MPB) (MAFbx: 5.3 ± 1.2 AU [damaged] to 1.4 ± 0.4 AU [control]) are increased in nerve damaged muscle. Furthermore, the expression of p70s6k1 correlates with MPS rates (r2 = 0.57). In conclusion, this study shows that severe muscle wasting following nerve damage is accompanied by increased as opposed to decreased MPS.
Skeletal muscle is the biggest organ of the human body, comprising at least 40% of its mass and containing 50–75% of all body proteins (Frontera and Ochala, 2015). It is pivotal to health and locomotion, and the lack of muscle mass and strength is associated with severely reduced independence, quality of life, and life expectancy (Metter et al., 2002; Wannamethee et al., 2007). Many clinical conditions are accompanied by muscle loss, such as cancer, COPD, or heart failure (Rosenberg, 1997; Al-Majid and McCarthy, 2001; Marquis et al., 2002; Thomas, 2007). Currently, no drug treatment for muscle wasting is available, with exercise and ample protein intake being the only bona fide intervention to slow muscle loss (Sepulveda et al., 2015; Garber, 2016). However, there are situations of muscle loss where physical activity is not an option. Such as in patients with fractures, critically ill patients or nerve damage. Peripheral nerve damage is a frequently occurring clinical condition that can be caused by disease or trauma (Dyck, 2005). A common model to study peripheral nerve damage is chronic constriction injury to the nerve (Bennett and Xie, 1988). Chronic constriction injury to the nerve is accompanied by debilitating symptoms such as neuropathic pain, hampered motor function and skeletal muscle atrophy (Bennett and Xie, 1988). Even though nerve function may recover, this is often outlasted by the deteriorating effects on muscle tissue. Although chronic nerve constriction is well investigated in respect to its implications for pain in animals, very little is known on the physiology of muscle wasting.
Muscle mass is determined by the balance between muscle protein synthesis (MPS) and muscle protein breakdown (MPB). Either side of the balance may be disturbed. Consequently, most muscle atrophies are assumed to show a combination of decreased MPS and increased MPB (McKinnell and Rudnicki, 2004). Yet, the individual contribution of decreased MPS may differ between various types of atrophies. For example in disuse atrophy in humans, blunted MPS rates seem to be the predominant cause for a decline in muscle mass (Wall et al., 2013a,b, 2016). Similarly, decreased MPS has been reported for starvation, sarcopenia, cachexia, and other conditions of muscle wasting, indicating a potential benefit of interventions which increase MPS (Emery et al., 1984; Yarasheski et al., 1993; Hector et al., 2018). In nerve damage induced atrophy, early work has suggested varying effects of denervation on MPS. Depending on the time point, decreased as well as transiently increased MPS rates were found in very young rats after nerve transection (Goldspink, 1976, 1978; Goldspink et al., 1983). How MPS rates are affected by chronic nerve constriction in adult animals is not known. Furthermore, previous studies using stable isotope labeling with the flooding dose- or primed continuous infusion technique were restricted to an MPS assessment period of a few hours, reducing their ability to predict absolute changes in muscle mass (Mitchell et al., 2014; Reid et al., 2014). The reemergence of deuterium oxide (D2O) as a mean to study integrated MPS in vivo over multiple days- or weeks, however, offers an attractive solution for this problem (Busch et al., 2006; Wilkinson et al., 2014; Damas et al., 2016).
Therefore we set out to investigate the effects of chronic nerve constriction on MPS. We combined long term D2O-mediated tracer experiments in adult rats with absolute changes in muscle mass, immunohistochemical analysis and protein expression data. We hypothesized that nerve constriction would cause a decrease in MPS rates. However, we found that despite substantial muscle loss, nerve damage induced atrophy is accompanied by chronically elevated as opposed to reduced myofibrillar protein synthesis (MPS) rates.
The animal experiments were approved by the local authority (Landesamt für Gesundheit und Soziales, Berlin, Germany) under the reference G 0083/15 and performed at the animal care unit of the Max Delbrück Center for Molecular Medicine (MDC, Berlin).
Ten male Sprague-Dawley rats [Crl:CD (SD), Charles River, Sulzfeld, Germany] between 20–21 weeks of age were housed in individual cages. The animals were fed a diet of 20 g chow (ssniff Spezialdiäten GmbH, Soest, Germany) (Supplementary Figure 1) equivalent to 79 kcal∗day−1 to slow down commonly occurring weight gain. Nerve damage was induced via chronic constriction injury to the sciatic nerve (Sommer, 2013). The rats were anesthetized via isoflurane inhalation (∼2.5%) and treated with an injection of 4–5 mg carprofen ∗kg−1 bodyweight to reduce postsurgical pain. An incision was made along the femur, and the vastus lateralis was disconnected from the biceps femoris by blunt dissection. The sciatic nerve was exposed above the point of trifurcation and constriction injury was induced by implanting a cuff around the nerve. To further reduce postsurgical pain of the animals, they received 100 mg ∗kg−1 metamizole. For the last 2 weeks, the animals were electrostimulated twice a week to maintain the nerve injury and impair recovery, as has been described previously (Baptista et al., 2008; Gigo-Benato et al., 2010). The animals were dissected 4 weeks post surgery, between the age of 24 and 25 weeks. In a fasted state, the animals were put under deep anesthesia via isoflurane inhalation (∼3.5%) and the TA and extensor digitorum longus (EDL) were collected. Muscles were quickly weighed and cut in half, with one part being immediately snap frozen in liquid nitrogen and the other part being embedded in gum tragacanth for histological analysis and frozen in isopentane.
We used a labeling protocol suitable to detect deuterium (2H) enrichments in alanine of the myofibrillar protein fraction of skeletal muscle via GC-MS similar to what has been published previously (Busch et al., 2006; Gasier et al., 2009). Briefly, 2 weeks after surgery the animals received an intraperitoneal injection of 0.014 mL ∗g−1 bodyweight of D2O (99.8%+ Atom D, Euriso-Top GmbH Saarbrücken) and 0.9% NaCl. This injection primed the animals and enriched their body water levels to approximately 2.5% D2O. To maintain the label concentration, the rats received drinking water with 4% 2H2O enrichment.
Myofibrillar protein isolation was performed as described previously (Burd et al., 2012). Briefly, 80–120 mg muscle sample of rat TA (n = 10) was weighed into an Eppendorf tube and stored on ice. A standard buffer solution was added to each sample at 10 μL ∗mg−1 and the muscle tissue was thoroughly homogenized. Scissors were used to mince the tissue before subsequent homogenization by plastic pestles. To fractionate a pellet rich in myofibrillar- and other structural proteins, the sample was spun at 700 g for 10 min at 4°C. The remaining pellet was washed twice with buffer and dH2O, the supernatant was discarded and 1 mL 0.3 NaOH was added to the pellet to further solubilize the myofibrillar proteins and isolate them from collagen. The samples were heated at 50°C for 30 min. Subsequently the sample was spun at 10,000 g for 5 min at 4°C and the supernatant containing the myofibrillar protein was transferred into 4 mL screw-cap glass vials. One milliliter of 1M PCA was added to each glass vial to denaturate the remaining proteins. After centrifugation, the supernatant was removed and the pellet washed twice with 500 μL 70% EtOH. After removal of the EtOH, 1.5 mL of 6M HCL was added to hydrolyze the samples over night at 110°C. The next day the samples were put in a heating block (120°C) and dried under a nitrogen steam. To further purify the amino acids, the samples were passed through Dowex exchange resin (AG 50W-X8 Resin, Bio-Rad) prior to derivatization. After purification, the glass vials were carefully vortexed and put under a nitrogen steam to dry before derivatization. Samples containing the free amino acids of the myofibrillar protein fraction were then converted to their tert-butyldimethylsilyl (TBDMS) derivatives via the addition of 50 μL of N-tert-Butyldimethylsilyl-N-methyltrifluoroacetamide (MTBSTFA) and 50 μL of acetonitrile to the sample. Each sample was then incubated for 1 h at 70°C. The sample was then transferred to 2 mL screw-cap chromacol vials (Thermo Fisher Scientific, Schwerte, Germany) suitable for GC-MS injection.
To precipitate plasma protein, 40 μL perchloric acid (20%) were added to 360 μL plasma sample. After vortexing, free amino acids were separated from protein bound amino acids by centrifugation (3500 rpm, 20 min, 4°C). The pellet was collected and washed three times with 1 mL perchloric acid (2%) before being hydrolyzed over night as described above. After hydrolysis, samples were purified and processed for GC-MS injection as described above. Values of unlabeled samples were used as a baseline control for 2H enrichment in plasma protein bound alanine.
Plasma samples were thawed on ice and dry 5-sulfosalicylic acid was added to the sample to deproteinize it as described previously (Trommelen et al., 2016). After vortexing, the sample was spun at 1000 g for 15 min. The supernatant was collected and then purified, processed and measured on the GC-MS as described in the sections above.
The alanine enrichment was determined by electron ionization gas chromatography-mass spectrometry (GC-MS; Agilent 6890N GC/5973N MSD) using selected ion monitoring of masses 232, 233, 234, 235, and 236 for their unlabeled and labeled H2-alanine. We applied standard regression curves to assess linearity of the mass spectrometer and to control for the loss of tracer.
Approximately 400 μm of sample was cut from the histology block and homogenized in a standard lysing buffer using a pestle. Protein concentrations in the samples were determined using a bicinchoninic acid assay (BCA) kit (Thermo Fisher Scientific, Schwerte, Germany). The required volume for 40 μg of protein per sample was calculated, aliquoted and SDSPP (6×) and SDSPP in H2O (1×) were added for a total volume of 15 μL. Commercial SDS gels (Invitrogen NuPAGE Bis-Tris Gel, Thermo Fisher Scientific, Schwerte, Germany) and electrophoresis (130–200 V) were used to separate the proteins in each sample. The semi-dry blot technique was used for transfer (45 min at 18 V). Membranes were blocked in TBS-T (4% milk powder) for 1 h at room temperature. Membranes were then incubated with the first antibody in TBS-T (4% milk powder) or BSA overnight (Supplementary Figure 9). The next day, samples were washed in TBS-T and the second antibody was added for 60 min at room temperature. After washing, chemiluminescence (ECL) was used for development of the bands. Expression levels of the protein bands of interest were directly analyzed using Image Studio Lite (LI-Cor, Lincoln, NE, United States). Protein loading and transfer was controlled for with a ponceau s staining (Supplementary Figure 2).
Gomori trichrome and toluidine blue ATPase stainings were performed according to an established protocol (Engel and Cunningham, 1963; Ogilvie and Feeback, 1990). For the fiber type distribution, as many fibers per slice were measured as clearly distinguishable by the toluidine blue staining. For type 2 fibers this was approximately 50 per slide, for the far less abundant type 1 fibers approximately 10.
For immunofluorescence staining, freshly cut cryosections were left 1 h at RT to dry and then fixated in 3.7% paraformaldehyde. Subsequently, sections were washed and blocked in 3% BSA/PBS. Afterward sections were incubated with anti-GLUT4 antibody (Supplementary Figure 9), CT-3,-3/5; 1:1000 in PBS (1% BSA) for 1 h at room temperature. The sections were incubated with biotin anti rabbit (1:200) in PBS and Streptavidin-Cy3 (1:200). Nuclei were visualized with Hoechst (1:1000 in PBS) before being mounted on slides using Aqua Mount (Thermo Fisher Scientific, Schwerte, Germany).
Pictures were acquired using a Zeiss LSM 700 confocal microscope (Zeiss, Jena, Germany) and the associated vendor software Zen 2012. Mosaic pictures of the TA were created with a Leica DFC 420 microscope (Leica Microsystems, Wetzlar, Germany). Fiber number was analyzed by counting every single fiber of the section.
Body composition was measured using the Minispec LF90 II time domain NMR analyzer (6.5 mHz, Bruker Optics, United States). Rats were placed into a restraint tube and inserted into the instrument which measured fat mass, fat-free mass, and fluid content of the animal.
Myofibrillar protein synthesis rates were calculated using the precursor-product method (Wall et al., 2013b).
where FSR is the fractional synthesis rate of myofibrillar proteins, ΔMPEmyo is the change in enrichment of 2H in muscle protein-bound alanine, ΔMPEplasma is the change in enrichment of 2H in alanine found in plasma and t is time.
Statistical tests were applied as appropriate depending on the sample- and group number. Data are expressed as scatter dot plot with the line indicating the mean, mean ± standard deviation or floating bars (minimum to maximal value) with the line indicating the mean. After testing for normality of the data, Student’s t-test or ANOVA with Tukey’s post hoc test were applied depending on the number of groups. p-Values below 0.05 were deemed significant.
We induced sciatic nerve damage in otherwise healthy, male SD rats. We observed a fully developed muscle wasting phenotype at 28 days post surgery (Figures 1A–D). Immediately after surgery, the animals showed signs of decreased innervation of the hind limb affected, as expected after peripheral nerve injury (Gigo-Benato et al., 2010). The animals did not show any symptoms of decreased alertness or daily activity. Sciatic nerve innervated muscles lost significant mass: After 28 days TA mass had decreased by 66%, from 946 to 350 mg (Figure 1B), EDL by 50% from 264 to 132 mg (Figure 1C). In the m. soleus (SOL), loss of mass was less pronounced. Muscle weight decreased from 252 to 156 mg which approximates a 38% loss in muscle mass (Figure 1D). Since the SOL is almost exclusively composed of type 1 fibers (Gregory et al., 2001), this might hint toward a predominant type 2 fiber atrophy in association with disuse, rather than neurogenic atrophy. We followed this up via histological analysis.
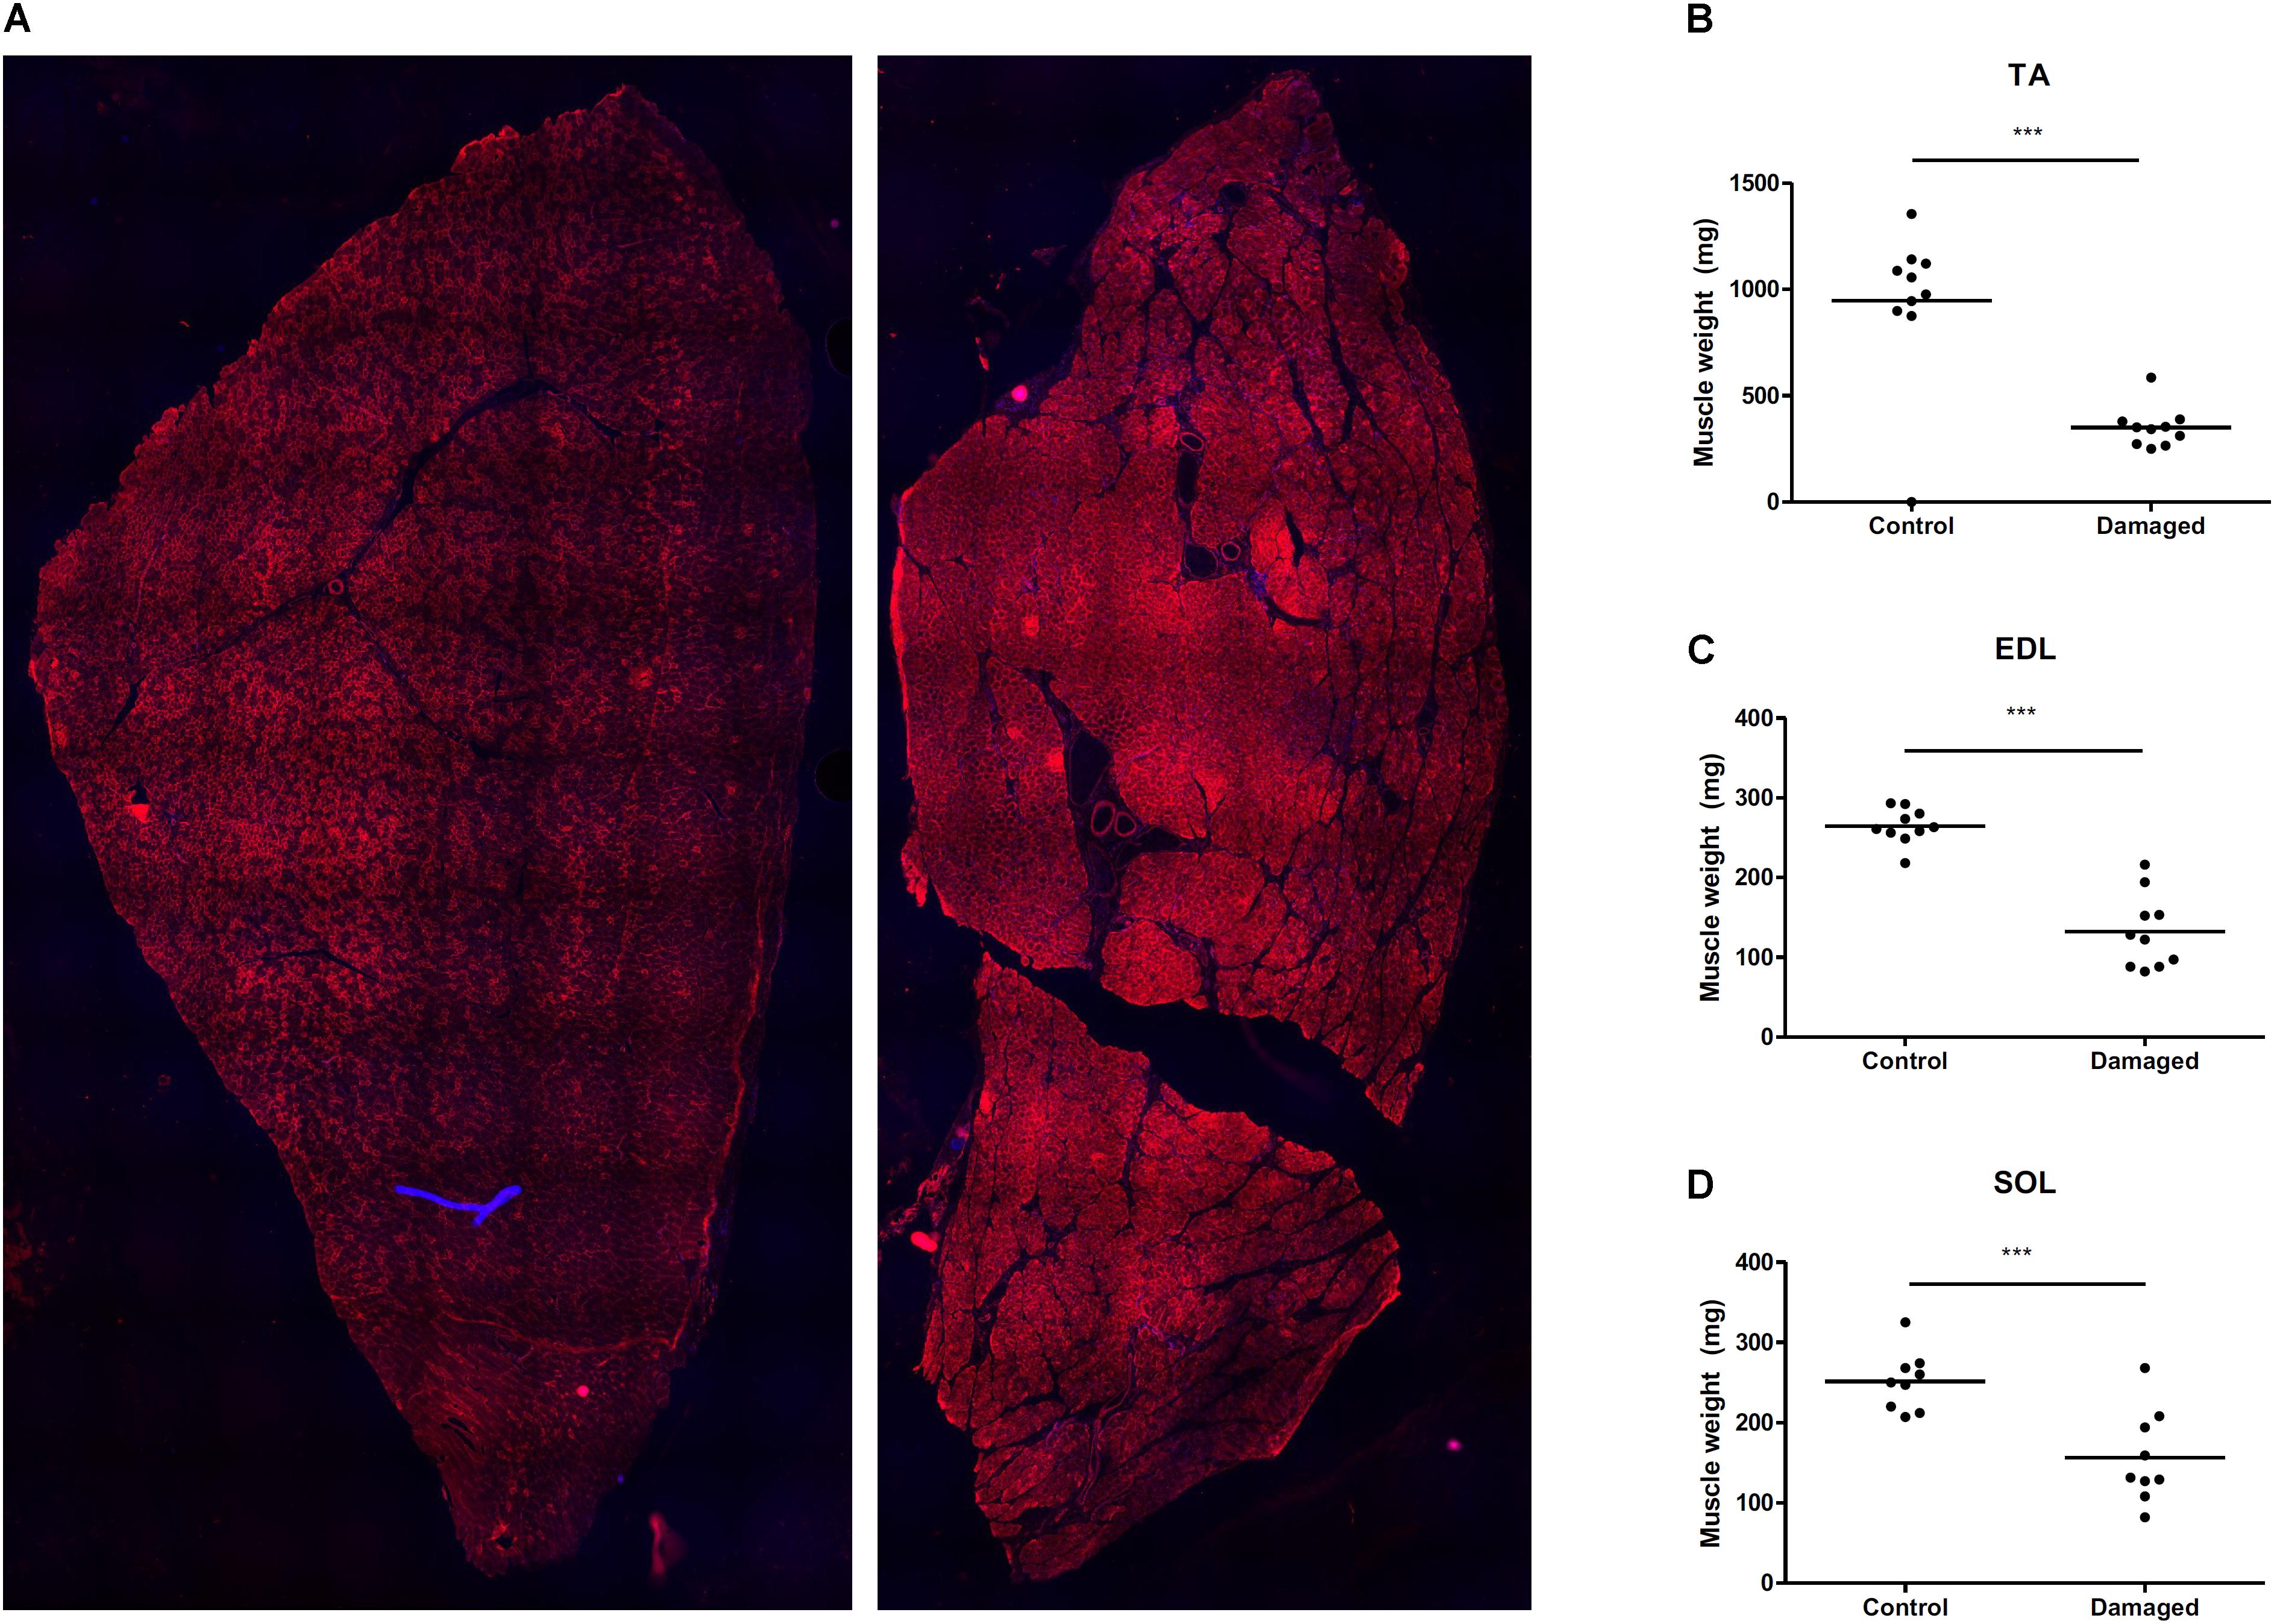
FIGURE 1. (A) Mosaic picture of rat tibialis anterior stained with GLUT4. (B) Nerve damage induces substantial muscle loss in m. tibialis anterior (TA) (n = 10), (C) m. extensor digitorum longus (EDL) (n = 10), and (D) m. soleus (SOL) (n = 9). ∗p < 0.05, ∗∗p < 0.01, ∗∗∗p < 0.001.
Histological analysis at day 28 after initiation of nerve damage revealed signs of necrotizing myopathy with regenerating fibers, fibers with centrally located nuclei, necrotic, and atrophic fibers (Figure 2A). The Feret’s diameter ranged from 43–51 μm in healthy type 1 fibers, and from 30–37 μm in damaged type 1 fibers (Figure 2B). In type 2a fibers, Feret’s diameter ranged from 43–53 μm in healthy muscle and 28–47 μm in damaged muscle (Figure 2B). Type 2b fibers ranged from 52–63 μm in healthy, and 29–43 μm in damaged muscle (Figure 2B). Overall, nerve damage induced a decrease in fiber diameter in all three fiber types (Figure 2B). In our study the type 2b fibers were most affected, decreasing by 41% (± 13%) in Feret’s diameter (Figure 2B). When type 2a and -b fibers were clustered, the loss of fiber diameter was greater than in type 1 fibers (Supplementary Figure 3). This confirms that the loss of muscle mass is predominantly based on type 2 fiber atrophy and explains why the SOL showed the least decline in muscle mass, being composed almost exclusively of type 1 fibers (Gregory et al., 2001). The total number of fibers in a complete cross section of TA from control and nerve damaged muscle were counted. In healthy muscle we found 13980 ± 999 compared to 13270 ± 652 fibers in damaged muscle (Figure 2C). These data indicate that muscular atrophy was due to loss of mass in individual fibers rather than reduction of total number of fibers, all consistent with muscular atrophy rather than dystrophy.
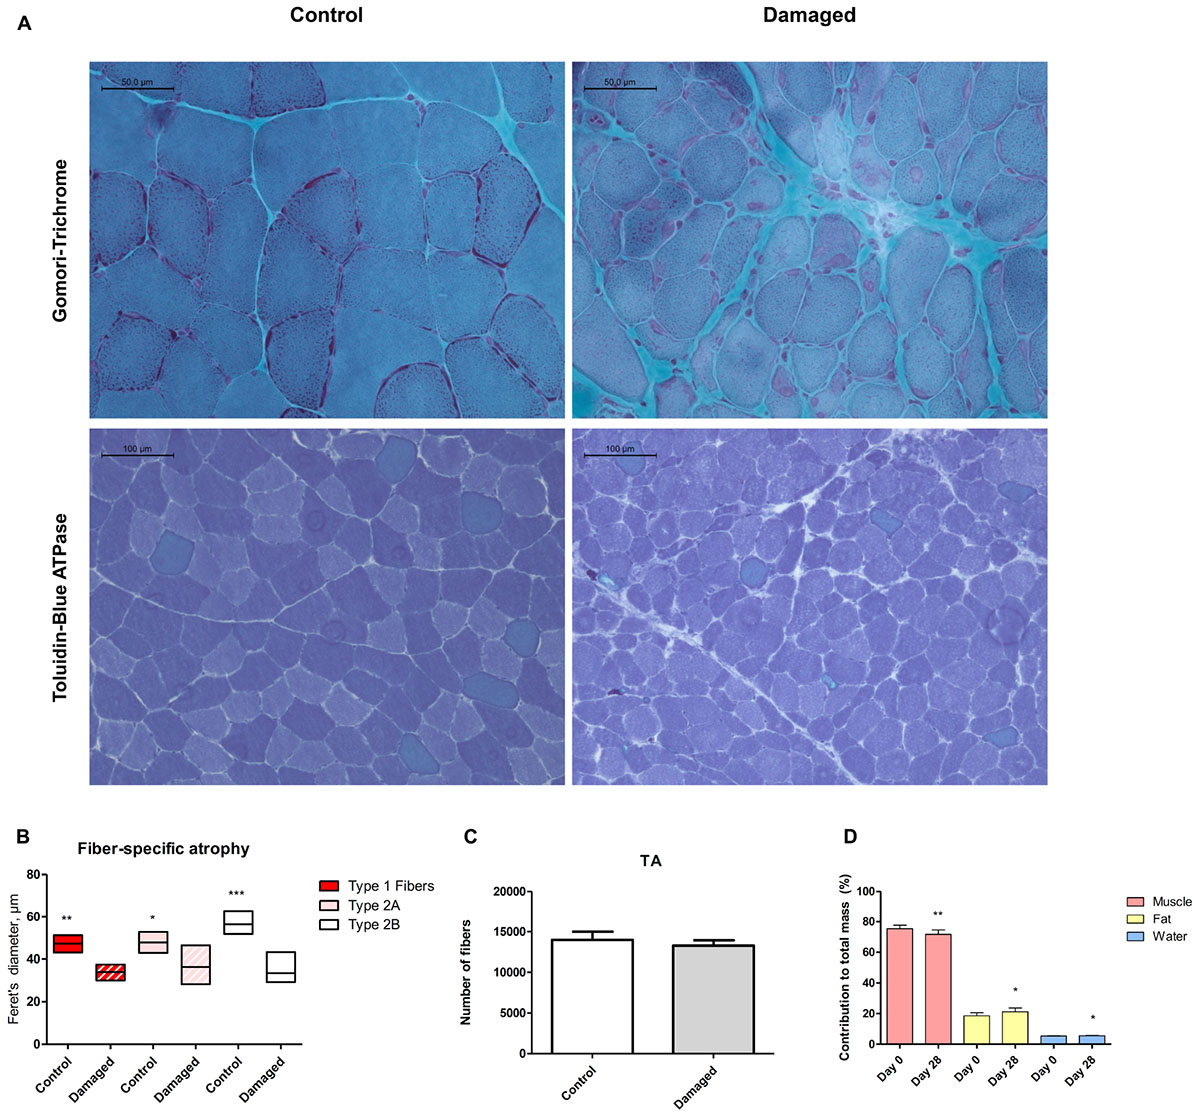
FIGURE 2. (A) Histochemical analysis via Gomori trichrome staining reveals regenerating fibers, centrally located nuclei and necrosis (upper panel). Toluidine blue staining shows fiber type specificity (lower panel). (B) Quantification of Feret’s diameter reveals pronounced type 2b fiber atrophy (n = 5). (C) No significant difference in number of muscle fibers between damaged and control muscle (n = 3). (D) Decreased lean body mass, increased fat mass and increased body water content 28 days post surgery (n = 8). ∗p < 0.05, ∗∗p < 0.01, ∗∗∗p < 0.001.
We asked whether sciatic nerve-induced atrophy resulted in overall changes in body composition. From day 0 to 28 days post surgery, we detected a 3.7% (± 1.3%) decrease in lean body mass from 75.4% (± 2.3%) to 71.7% (± 2.9%) (Figure 2D). The loss of lean body mass percentage occurred despite a tendency toward an increase in bodyweight (p = 0.61; Supplementary Figure 7). The decrease in lean body mass was accompanied by a slight increase in body fat percentage (Figure 2D).
Deuterium oxide was injected and then added to regular water supply to analyze myofibrillar fractional synthetic rate (Figure 3A). We confirmed our ability to reliably detect 2H labeled alanine in a vast amount of different rat muscle samples, obtained from several interventions which have utilized D2O (Figure 3B). Myofibrillar fractional synthetic rate was increased 1.6-fold in the damaged compared to the control leg after 2 weeks of D2O treatment (3.23 ± 0.72 to 2.09 ± 0.26%∗day−1, respectively) (Figure 4). Every single animal (n = 10) showed increased muscle protein synthesis rates in the damaged compared to the control leg (Supplementary Figure 4). To our knowledge, this is the first study showing an integrated increase in MPS during a prolonged period of loss of muscle mass.
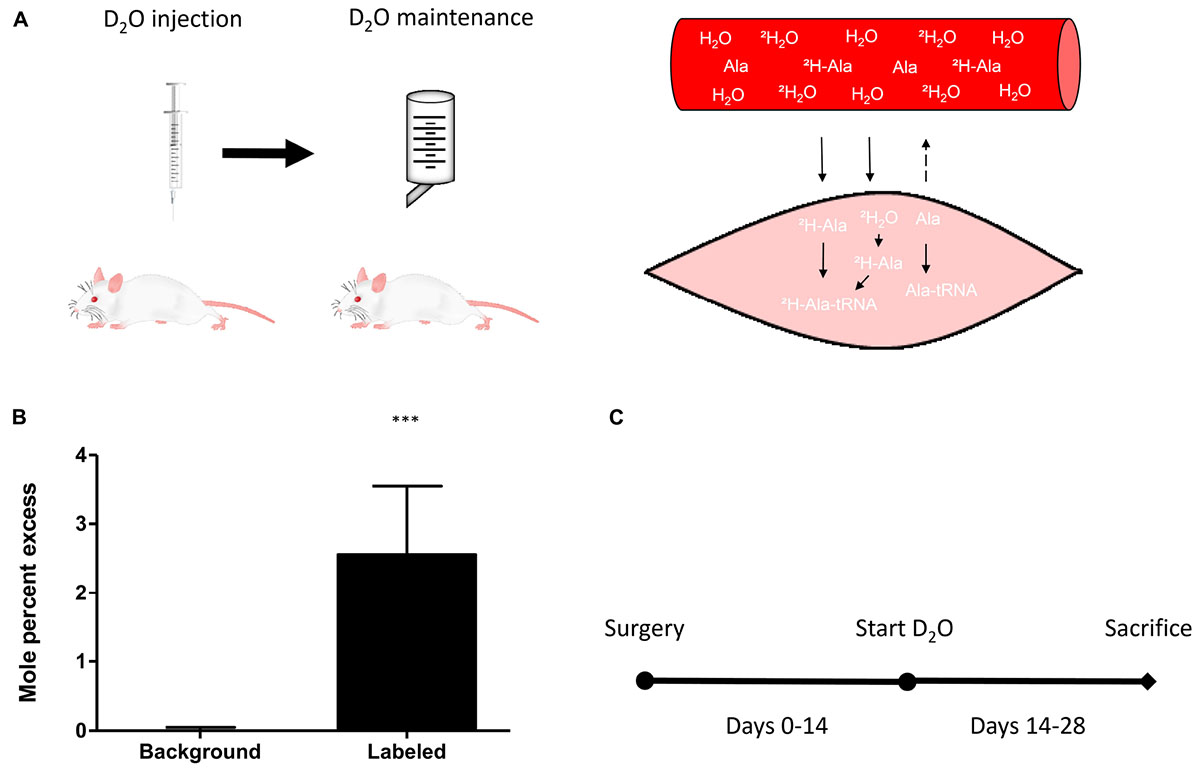
FIGURE 3. (A) Schematic principle of D2O labeling protocol in rats (left) and muscle (right). (B) Quantification of the incorporation of 2H into m+1 of the myofibrillar alanine fraction in unlabeled background muscle (n = 4) versus D2O labeled muscle (n = 40). (C) Schematic representation of the study protocol. Surgery at day 0, start of the labeling experiment with D2O labeling on day 14 and assessment of myofibrillar protein synthesis between day 14 and day 28. ∗∗∗p < 0.001.
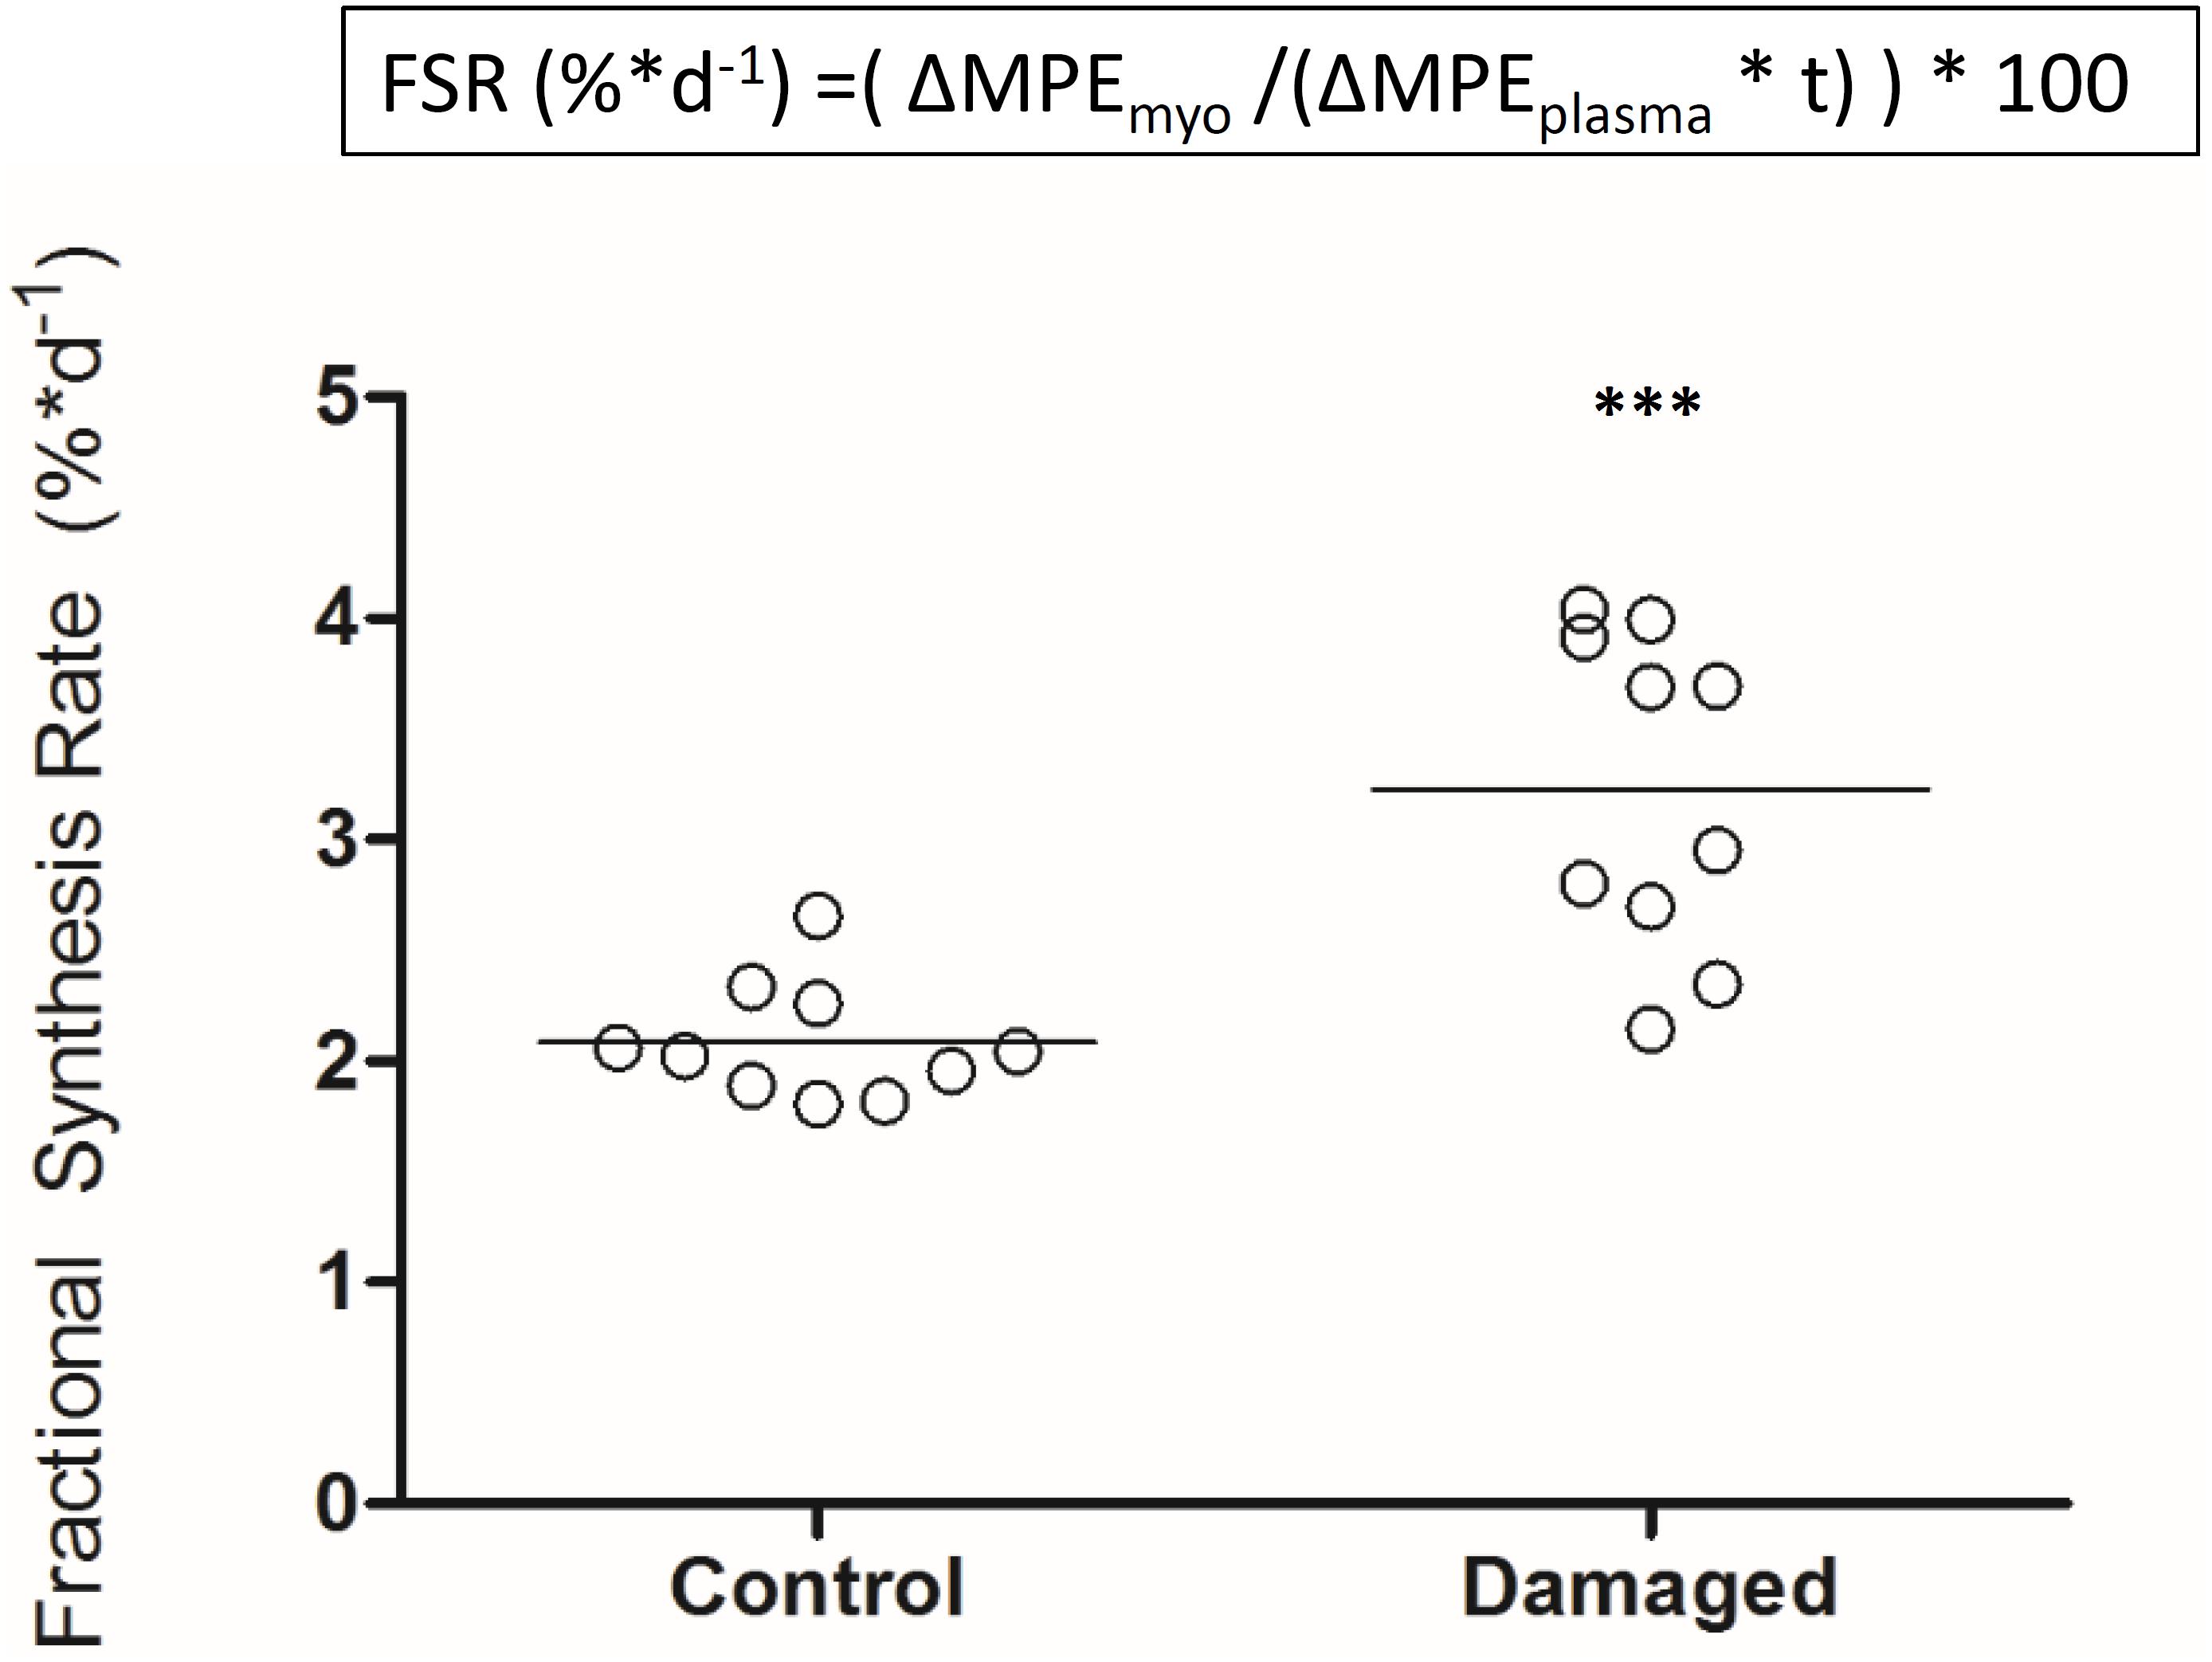
FIGURE 4. Myofibrillar fractional protein synthesis rates in nerve damaged TA and contralateral control (n = 10). ∗∗∗p < 0.001.
Skeletal muscle proteolysis is partially regulated by the E3 ubiquitine proteasome pathway and its muscle specific ligases MAFbx and MuRF1 (Bodine et al., 2001). To investigate how key signaling proteins of the proteasome pathway are regulated in our model, we investigated MAFbx and MuRF1 by Western blot analysis. Expression of MAFbx was increased fourfold in the damaged versus the control leg (5.3 ± 1.2 to 1.4 ± 0.4 AU, respectively) (Figure 5A, upper panel). MuRF1 expression followed a similar pattern (p < 0.0001) (Supplementary Figure 5). Protein expression of p70s6k1 increased 1.4-fold in the damaged leg (2.4 ± 0.3 to 1.8 ± 0.2 AU) (Figure 5A, lower panel). Phosphorylated p70s6k1 could not be detected (Supplementary Figure 6). We found a correlation between p70s6k1 expression and myofibrillar fractional synthesis rates (r2 = 0.57) (Figure 6A). The correlation for p70s6k1 and FSR is independent of the intervention effect and still present if the analysis is restricted to the control leg (r2 = 0.65) (Supplementary Figure 8).
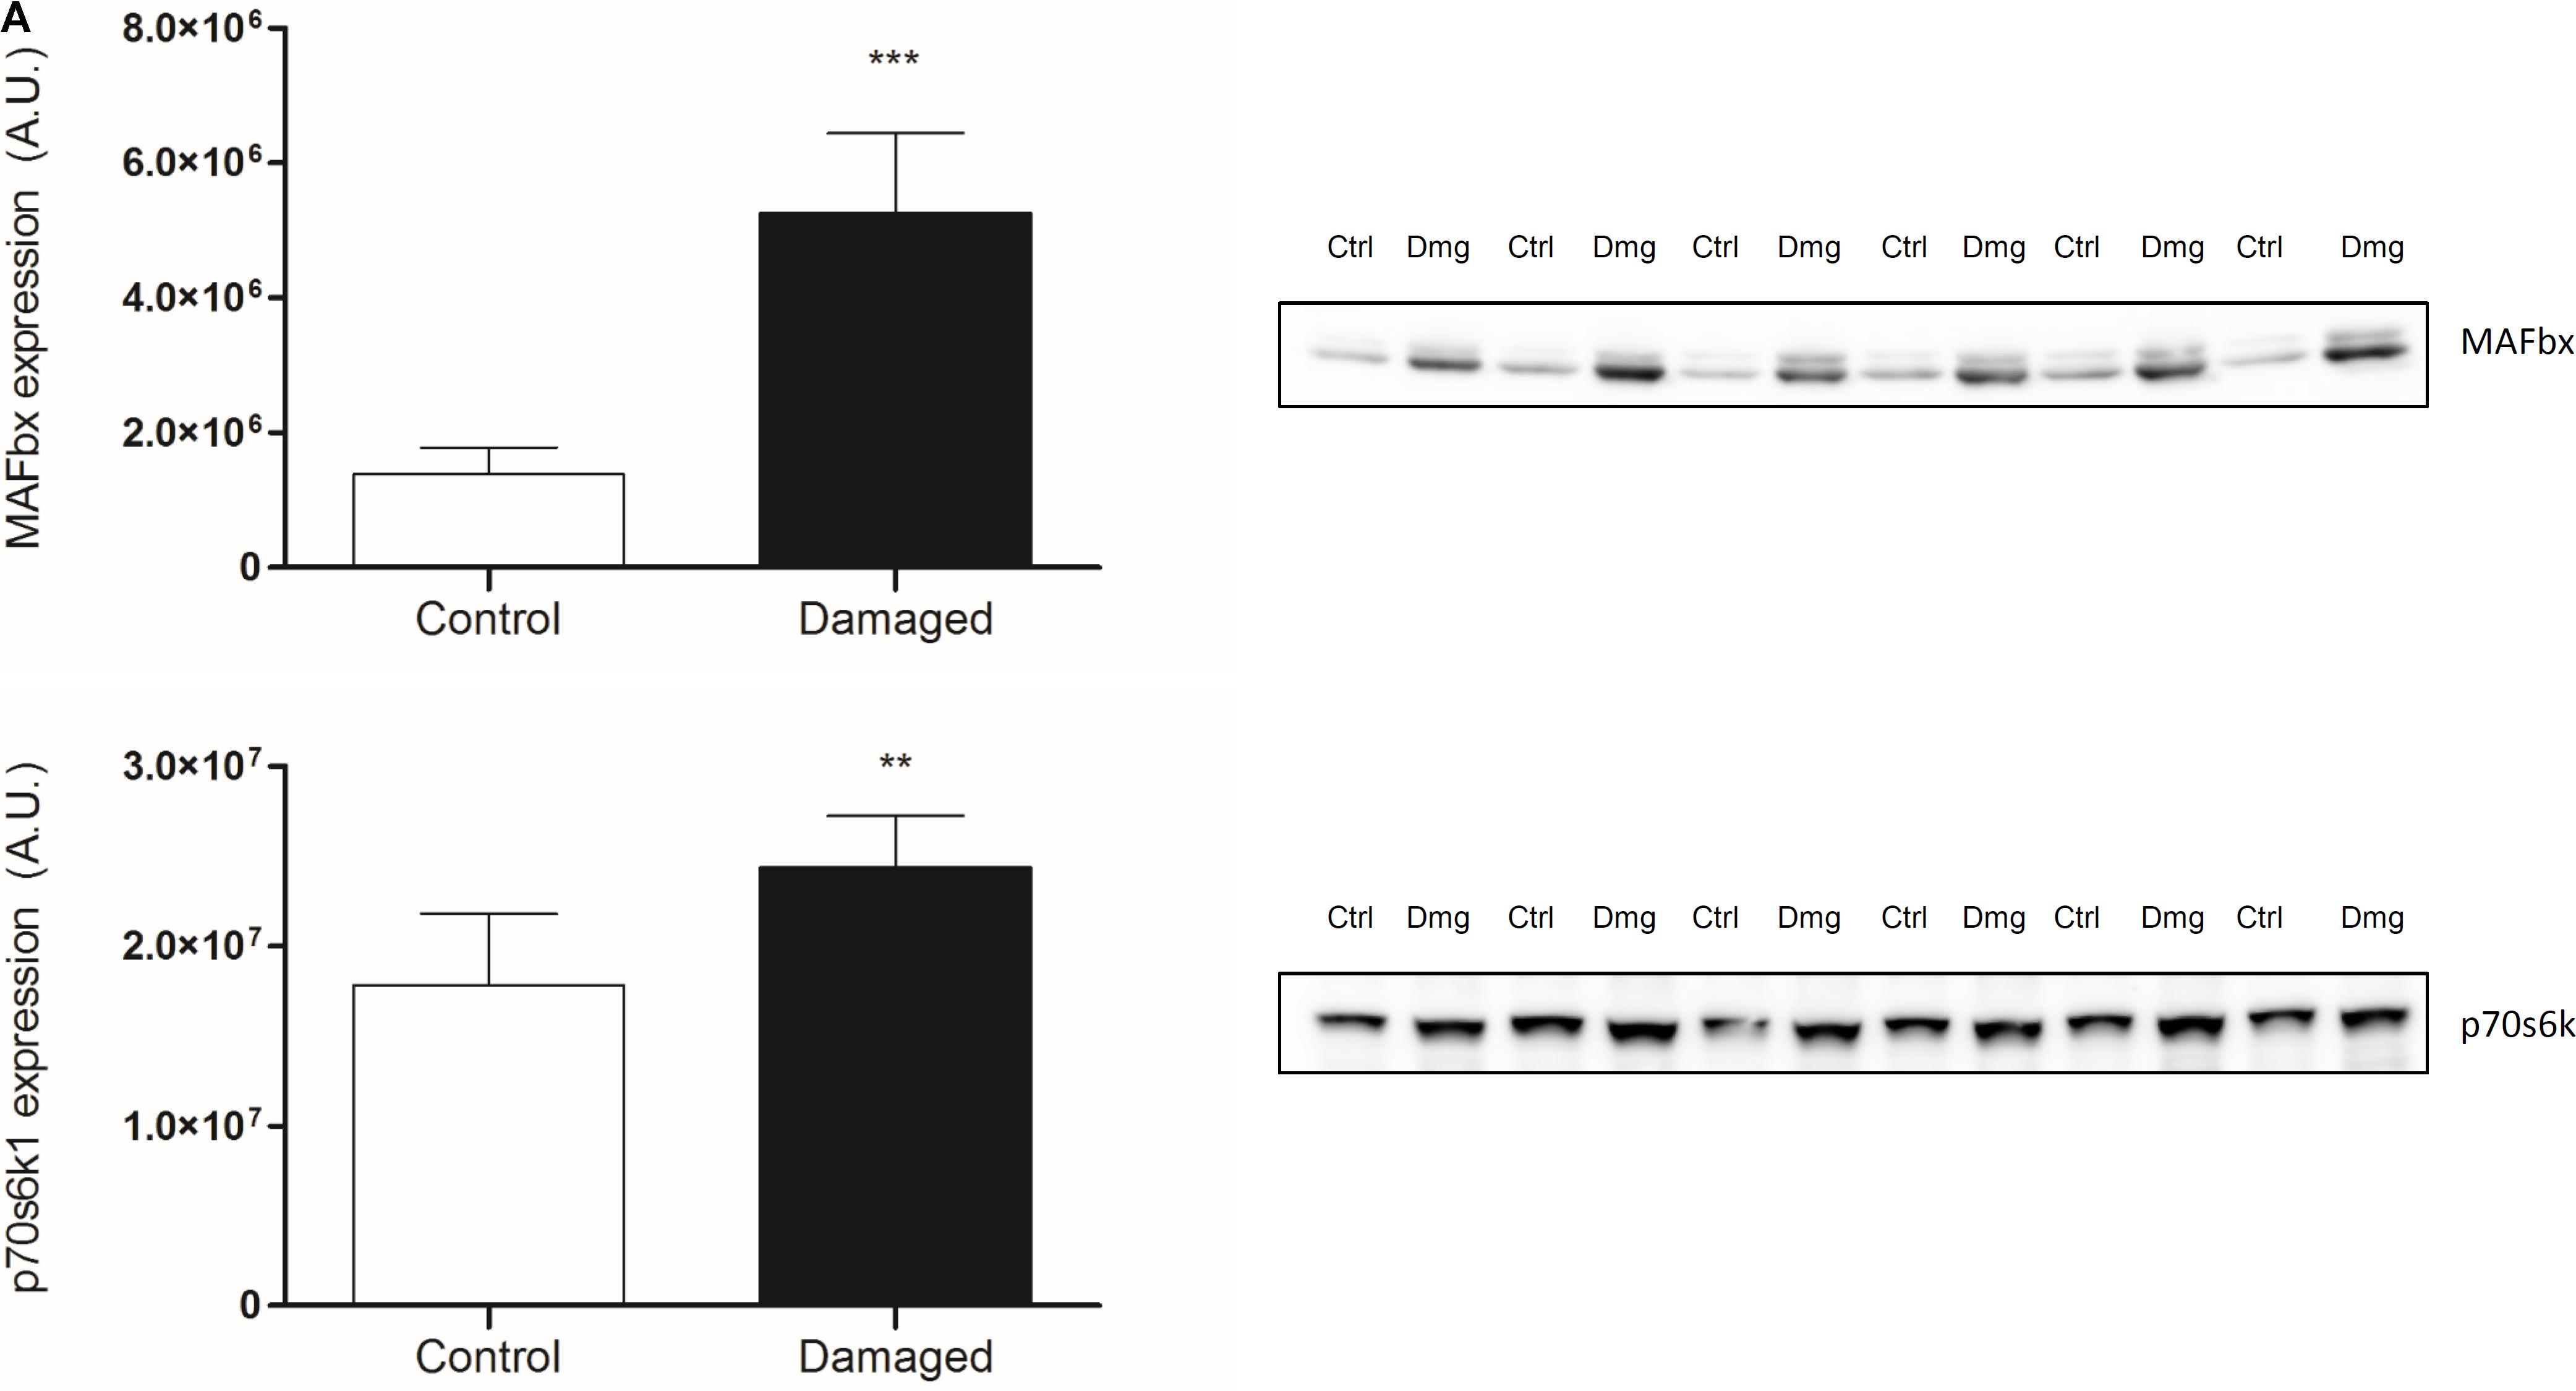
FIGURE 5. (A) Protein expression of MAFbx and p70s6k1 in contralateral (ctrl) and damaged (Dmg) rat TA; representative pictures of blots (n = 6). ∗∗p < 0.01, ∗∗∗p < 0.001.
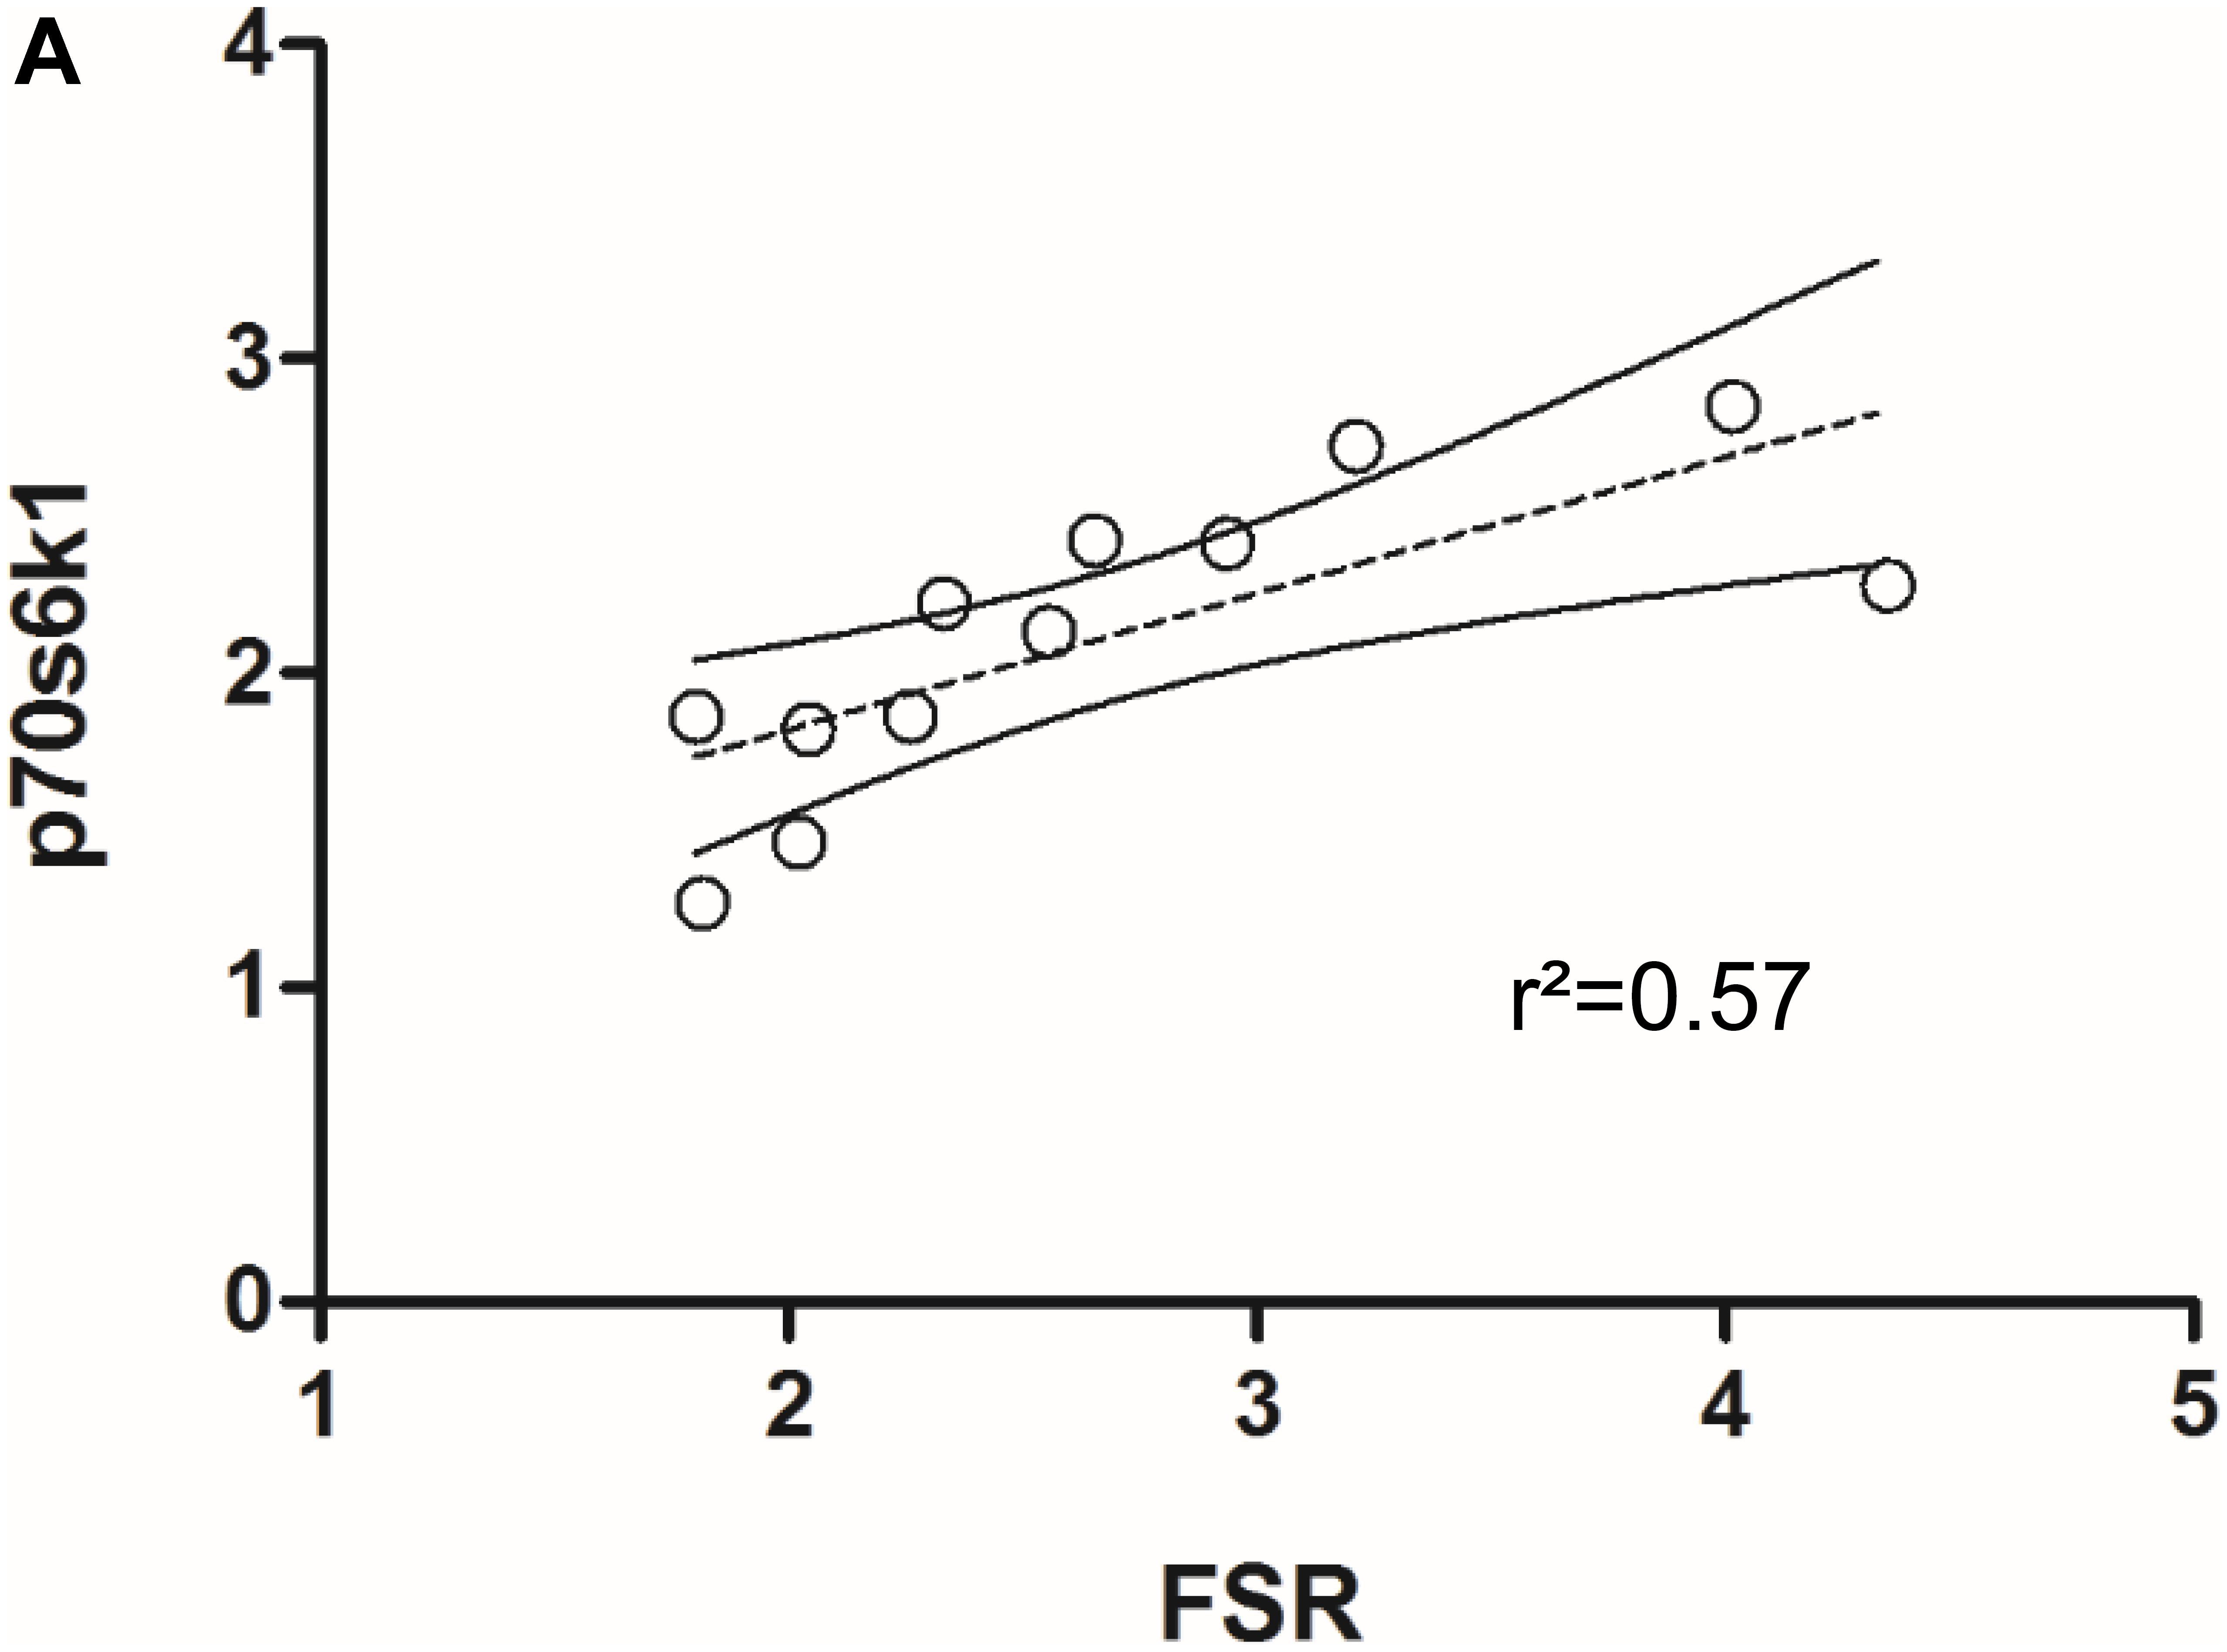
FIGURE 6. (A) Correlation between p70s6k1 protein expression and myofibrillar fractional synthesis rates (FSR) in rat TA (n = 6).
The most prevalent assumption is that in most situations of muscle loss, there is a decrease in protein synthesis as well an increase in protein breakdown (McKinnell and Rudnicki, 2004). In disuse atrophy and immobilization in humans, a decrease in MPS appears to be the predominant mechanism causing muscle loss (Wall et al., 2013a; Phillips and McGlory, 2014). A decrease in MPS has also been observed for diet induced muscle atrophy in obese men, cancer cachexia, sepsis, and burned patients (Emery et al., 1984; Sakurai et al., 1995; Lang et al., 2007; Hector et al., 2018). In our study, we investigated chronic changes in MPS in response to nerve damage induced muscle atrophy. In stark contrast to the scenarios mentioned above, we found that MPS rates are increased as opposed to decreased during nerve damage induced muscle loss (Figure 4). Early studies on MPS after nerve damage have found varying results. MPS was reported to be transiently increased in vitro and in vivo by Buse, Goldspink and others (Buse et al., 1965; Goldspink, 1976, 1978). Later work has shown a decrease in MPS in muscle that has undergone compensatory growth with subsequent nerve transection (Goldspink et al., 1983). However, the implications of these studies differ profoundly from our findings. One reason are the differences between the nerve damage models: while a lot of work has been done on nerve transection, less is known for chronic constriction injuries to the nerve, which was the model in this study. In fact, no study thus far had investigated how muscle protein turnover and MPS are affected by nerve constriction injury. Furthermore, the studies finding an increase in tracer incorporation into the EDL and SOL after nerve transection were performed in particularly young rats (Goldspink, 1976, 1978). Undergoing age related growth, these animals still increased absolute mass of the denervated muscle over the course of the experiment (Goldspink, 1976, 1978). The result was slowed growth and relative atrophy of the affected muscles compared to control animals rather than absolute atrophy. In the face of a systemically anabolic environment, increased MPS rates may be less surprising. We chose full grown, adult rats (21–22 weeks old) and controlled their food intake to avoid excess bodyweight- and associated muscle gains (Supplementary Figure 7). Over the course of 4 weeks after the surgery our animals lost 66% of the TA compared to the contralateral control leg, and 50% of the EDL mass, respectively (Figures 1B,C). Despite this significant decrease in muscle mass we found a 1.6-fold increase in MPS in the TA (Figure 4). To our knowledge, this is the first study finding such a pronounced increase in integrated MPS despite absolute atrophy of the muscle. This supports the notion that MPS rates may be more indicative of muscle remodeling and ongoing regeneration than muscle growth per se (Ochala et al., 2011; Mitchell et al., 2014; Damas et al., 2016).
The timing to assess muscle protein turnover is crucial to the understanding of the changes in muscle mass. It is well known that the time course of muscle protein turnover in response to an atrophic stimulus is dynamic and depends on a variety of parameters. For example in muscle disuse atrophy, the majority of the changes to muscle protein turnover occur within the first week after the onset of the stimulus (Wall et al., 2016). It is thought that MPS decreases rapidly being accompanied by swift muscle loss, both tapering off in the second and third week of disuse (Wall et al., 2013a,b). Therefore, assessing muscle protein synthesis at a later time point may miss important changes. In respect to nerve damage, the literature suggests a fairly steady rate of muscle loss (Goldspink, 1976; al-Amood et al., 1991; Ma et al., 2007). It is important to note that the muscle continues to lose mass up to 3–12 months after nerve damage (Wu et al., 2014). To avoid any artifacts due to an initial inflammatory response induced by the surgery, we chose to analyze MPS during the second half of our intervention. We used D2O as a tracer to measure integrated protein synthesis over the course of 2 weeks (Figure 3C). As opposed to a short term experiment with the constant infusion- or flooding method, this allowed us to assess chronic alterations of MPS.
To investigate changes in protein expression that may be underlying the observed changes in protein turnover, we analyzed key signaling proteins for muscle protein synthesis and breakdown. For muscle protein synthesis we focused on p70s6k1, a protein downstream of mTORC1, known to increase protein synthesis upon phosphorylation and with a regulatory role in muscle growth (Baar and Esser, 1999; Saxton and Sabatini, 2017). To gain insight into the signaling underlying protein breakdown, we analyzed the E3 ubiquitine ligases MAFbx and MuRF1. These are muscle specific proteins downstream of FOXO, which have been shown to be upregulated under most atrophic conditions and are crucial regulators of muscle loss (Bodine et al., 2001; Gomes et al., 2001; Bodine and Baehr, 2014). In our model, protein expression of p70s6k1 is significantly increased in the nerve damaged leg compared to the control leg (Figure 5A, lower panel). The expression of p70s6k1 correlates with fractional synthesis rates of myofibrillar protein (Figure 6A). Interestingly that is still the case when expression and synthesis rates are analyzed exclusively in the control leg (Supplementary Figure 8). We tried to analyze phosphorylated p70s6k1, but failed to detect any in both, the damaged and the control legs. We confirmed the absence of phosphorylated p70s6k1 in our samples by the addition of positive controls (Supplementary Figure 6). The lack of phosphorylated p70s6k1 is not surprising, as the expression pattern appears to be transient and sampling of muscle would have to occur closely to the initiation of an early stimulus, which was not the case in our study (Ogasawara et al., 2013; West et al., 2016). Eventually, in case of our atrophy model the protein expression data seems to line up with the protein turnover data from the tracer experiments.
In summary, we found that nerve damage induced muscle loss is primarily based on muscle fiber atrophy, not the loss of muscle fibers. With the combination of integrating the D2O tracer method with the analysis of absolute changes in muscle mass, we were able to find that in our model of muscle atrophy, muscle loss is accompanied by an increase as opposed to a decrease in MPS rates. These findings support the notion that muscle protein synthesis may be reflective of muscle remodeling and should not be used as a proxy to predict changes in muscle mass. In conclusion, muscle atrophy caused by chronic constriction injury to the nerve is not associated with a decline in MPS rates.
HL was responsible for the design of the study, animal experiments, analysis of the samples, interpretation of the data, and writing of the manuscript. JS, HL, and AG prepared the samples for GC-MS analysis. LvL was involved in the design of the study, interpretation of the data, and writing of the manuscript. SK was involved in the interpretation of the data. SS was involved in the design of the study, interpretation of the data, and writing of the manuscript.
The study was supported by the German Research Foundation (DFG) through the International Research Training Group for Muscle Sciences (“MyoGrad” IGK1631) and a grant to SS and HL. The French-German University (UFA) supported HL through financial and educational support. Contributions were made possible by DFG funding through the Berlin-Brandenburg School for Regenerative Therapies (BSRT) GSC 203. The body composition analysis was performed at the Phenotyping-Facility of the Max Delbrück Center for Molecular Medicine.
The authors declare that the research was conducted in the absence of any commercial or financial relationships that could be construed as a potential conflict of interest.
We thank Adrienne Rothe, Monique Bergemann, Shoaib Afzal, and Christin Zasada for technical assistance. We would like to thank Andy Holwerda for helpful discussion of the project and design of the labeling protocol. We also thank Annette Schürmann for providing us with the GLUT4 antibody.
The Supplementary Material for this article can be found online at: https://www.frontiersin.org/articles/10.3389/fphys.2018.01220/full#supplementary-material
al-Amood, W. S., Lewis, D. M., and Schmalbruch, H. (1991). Effects of chronic electrical stimulation on contractile properties of long-term denervated rat skeletal muscle. J. Physiol. 441, 243–256. doi: 10.1113/jphysiol.1991.sp018749
Al-Majid, S., and McCarthy, D. O. (2001). Cancer-induced fatigue and skeletal muscle wasting: the role of exercise. Biol. Res. Nurs. 2, 186–197. doi: 10.1177/109980040100200304
Baar, K., and Esser, K. (1999). Phosphorylation of p70S6kcorrelates with increased skeletal muscle mass following resistance exercise. Am. J. Physiol. Cell Physiol. 276, C120–C127. doi: 10.1152/ajpcell.1999.276.1.C120
Baptista, A. F., Gomes, J. R., Oliveira, J. T., Santos, S. M., Vannier-Santos, M. A., and Martinez, A. (2008). High-and low-frequency transcutaneous electrical nerve stimulation delay sciatic nerve regeneration after crush lesion in the mouse. J. Peripher. Nerv. Syst. 13, 71–80. doi: 10.1111/j.1529-8027.2008.00160.x
Bennett, G. J., and Xie, Y.-K. (1988). A peripheral mononeuropathy in rat that produces disorders of pain sensation like those seen in man. Pain 33, 87–107. doi: 10.1016/0304-3959(88)90209-6
Bodine, S. C., and Baehr, L. M. (2014). Skeletal muscle atrophy and the E3 ubiquitin ligases MuRF1 and MAFbx/atrogin-1. Am. J. Physiol. Endocrinol. Metab. 307, E469–E484. doi: 10.1152/ajpendo.00204.2014
Bodine, S. C., Latres, E., Baumhueter, S., Lai, V. K., Nunez, L., Clarke, B. A., et al. (2001). Identification of ubiquitin ligases required for skeletal muscle atrophy. Science 294, 1704–1708. doi: 10.1126/science.1065874
Burd, N. A., Andrews, R. J., West, D. W., Little, J. P., Cochran, A. J., Hector, A. J., et al. (2012). Muscle time under tension during resistance exercise stimulates differential muscle protein sub-fractional synthetic responses in men. J. Physiol. 590, 351–362. doi: 10.1113/jphysiol.2011.221200
Busch, R., Kim, Y. K., Neese, R. A., Schade-Serin, V., Collins, M., Awada, M., et al. (2006). Measurement of protein turnover rates by heavy water labeling of nonessential amino acids. Biochim. Biophys. Acta 1760, 730–744. doi: 10.1016/j.bbagen.2005.12.023
Buse, M. G., McMaster, J., and Buse, J. (1965). The effect of denervation and insulin on protein synthesis in the isolated rat diaphragm. Metab. Clin. Exp. 14, 1220–1232. doi: 10.1016/0026-0495(65)90092-2
Damas, F., Phillips, S. M., Libardi, C. A., Vechin, F. C., Lixandrão, M. E., Jannig, P. R., et al. (2016). Resistance training-induced changes in integrated myofibrillar protein synthesis are related to hypertrophy only after attenuation of muscle damage. J. Physiol. 594, 5209–5222. doi: 10.1113/JP272472
Emery, P., Edwards, R., Rennie, M., Souhami, R., and Halliday, D. (1984). Protein synthesis in muscle measured in vivo in cachectic patients with cancer. Br. Med. J. 289, 584–586. doi: 10.1136/bmj.289.6445.584
Engel, W. K., and Cunningham, G. G. (1963). Rapid examination of muscle tissue An improved trichrome method for fresh-frozen biopsy sections. Neurology 13, 919–923. doi: 10.1212/WNL.13.11.919
Frontera, W. R., and Ochala, J. (2015). Skeletal muscle: a brief review of structure and function. Calcif. Tissue Int. 96, 183–195. doi: 10.1007/s00223-014-9915-y
Gasier, H. G., Riechman, S. E., Wiggs, M. P., Previs, S. F., and Fluckey, J. D. (2009). A comparison of 2H2O and phenylalanine flooding dose to investigate muscle protein synthesis with acute exercise in rats. Am. J. Physiol. Endocrinol. Metab. 297, E252–E259. doi: 10.1152/ajpendo.90872.2008
Gigo-Benato, D., Russo, T. L., Geuna, S., Domingues, N. R., Salvini, T. F., and Parizotto, N. A. (2010). Electrical stimulation impairs early functional recovery and accentuates skeletal muscle atrophy after sciatic nerve crush injury in rats. Muscle Nerve 41, 685–693. doi: 10.1002/mus.21549
Goldspink, D. (1976). The effects of denervation on protein turnover of rat skeletal muscle. Biochem. J. 156, 71–80. doi: 10.1042/bj1560071
Goldspink, D. F. (1978). Changes in the Size and Protein Turnover of the Soleus Muscle in Response to Immobilization or Denervation. London: Portland Press Limited.
Goldspink, D. F., Garlick, P. J., and McNurlan, M. (1983). Protein turnover measured in vivo and in vitro in muscles undergoing compensatory growth and subsequent denervation atrophy. Biochem. J. 210, 89–98. doi: 10.1042/bj2100089
Gomes, M. D., Lecker, S. H., Jagoe, R. T., Navon, A., and Goldberg, A. L. (2001). Atrogin- 1, a muscle-specific F-box protein highly expressed during muscle atrophy. Proc. Nat. Acad. Sci. 98, 14440–14445. doi: 10.1073/pnas.251541198
Gregory, C. M., Vandenborne, K., and Dudley, G. A. (2001). Metabolic enzymes and phenotypic expression among human locomotor muscles. Muscle Nerve 24, 387–393. doi: 10.1002/1097-4598(200103)24:3<387::AID-MUS1010>3.0.CO;2-M
Hector, A. J., McGlory, C., Damas, F., Mazara, N., Baker, S. K., and Phillips, S. M. (2018). Pronounced energy restriction with elevated protein intake results in no change in proteolysis and reductions in skeletal muscle protein synthesis that are mitigated by resistance exercise. FASEB J. 32, 265–275. doi: 10.1096/fj.201700158RR
Lang, C. H., Frost, R. A., and Vary, T. C. (2007). Regulation of muscle protein synthesis during sepsis and inflammation. Am. J. Physiol. Endocrinol. Metab. 293, E453–E459. doi: 10.1152/ajpendo.00204.2007
Ma, J., Shen, J., Garrett, J. P., Lee, C. A., Li, Z., Elsaidi, G. A., et al. (2007). Gene expression of myogenic regulatory factors, nicotinic acetylcholine receptor subunits, and GAP-43 in skeletal muscle following denervation in a rat model. J. Orthop. Res. 25, 1498–1505. doi: 10.1002/jor.20414
Marquis, K., Debigaré, R., Lacasse, Y., LeBlanc, P., Jobin, J., Carrier, G., et al. (2002). Midthigh muscle cross-sectional area is a better predictor of mortality than body mass index in patients with chronic obstructive pulmonary disease. Am. J. Respir. Crit. Care Med. 166, 809–813. doi: 10.1164/rccm.2107031
McKinnell, I. W., and Rudnicki, M. A. (2004). Molecular mechanisms of muscle atrophy. Cell 119, 907–910. doi: 10.1016/j.cell.2004.12.007
Metter, E. J., Talbot, L. A., Schrager, M., and Conwit, R. (2002). Skeletal muscle strength as a predictor of all-cause mortality in healthy men. J. Gerontol. A Biol. Sci. Med. Sci. 57, B359–B365. doi: 10.1093/gerona/57.10.B359
Mitchell, C. J., Churchward-Venne, T. A., Parise, G., Bellamy, L., Baker, S. K., Smith, K., et al. (2014). Acute post-exercise myofibrillar protein synthesis is not correlated with resistance training-induced muscle hypertrophy in young men. PLoS One 9:e89431. doi: 10.1371/journal.pone.0089431
Ochala, J., Gustafson, A. M., Diez, M. L., Renaud, G., Li, M., Aare, S., et al. (2011). Preferential skeletal muscle myosin loss in response to mechanical silencing in a novel rat intensive care unit model: underlying mechanisms. J. Physiol. 589, 2007–2026. doi: 10.1113/jphysiol.2010.202044
Ogasawara, R., Kobayashi, K., Tsutaki, A., Lee, K., Abe, T., Fujita, S., et al. (2013). mTOR signaling response to resistance exercise is altered by chronic resistance training and detraining in skeletal muscle. J. Appl. Physiol. 114, 934–940. doi: 10.1152/japplphysiol.01161.2012
Ogilvie, R., and Feeback, D. (1990). Metachromatic dye ATPase method for the simultaneous identification of skeletal muscle fibers types I, II A, II B and II C. Stain Technol. 65, 231–241. doi: 10.3109/10520299009105613
Phillips, S. M., and McGlory, C. (2014). Crosstalk proposal: the dominant mechanism causing disuse muscle atrophy is decreased protein synthesis. J. Physiol. 592, 5341–5343. doi: 10.1113/jphysiol.2014.273615
Reid, M. B., Judge, A. R., and Bodine, S. C. (2014). Crosstalk opposing view: the dominant mechanism causing disuse muscle atrophy is proteolysis. J. Physiol. 592, 5345–5347. doi: 10.1113/jphysiol.2014.279406
Rosenberg, I. H. (1997). Sarcopenia: origins and clinical relevance. J. Nutr. 127, 990S–991S. doi: 10.1093/jn/127.5.990S
Sakurai, Y., Aarsland, A., Herndon, D. N., Chinkes, D. L., Pierre, E., Nguyen, T. T., et al. (1995). Stimulation of muscle protein synthesis by long-term insulin infusion in severely burned patients. Ann. Surg. 222, 283–294. doi: 10.1097/00000658-199509000-00007
Saxton, R. A., and Sabatini, D. M. (2017). mTOR signaling in growth, metabolism, and disease. Cell 168, 960–976. doi: 10.1016/j.cell.2017.02.004
Sepulveda, P. V., Bush, E. D., and Baar, K. (2015). Pharmacology of manipulating lean body mass. Clin. Exp. Pharmacol. Physiol. 42, 1–13. doi: 10.1111/1440-1681.12320
Sommer, C. (2013). “Neuropathic pain model, chronic constriction injury,” in Encyclopedia of Pain, eds G. F. Gebhart and R. F. Schmidt (Heidelberg: Springer). doi: 10.1007/2F978-3-642-28753-4_2678
Thomas, D. R. (2007). Loss of skeletal muscle mass in aging: examining the relationship of starvation, sarcopenia and cachexia. Clin. Nutr. 26, 389–399. doi: 10.1016/j.clnu.2007.03.008
Trommelen, J., Holwerda, A. M., Kouw, I. W., Langer, H., Halson, S. L., Rollo, I., et al. (2016). Resistance exercise augments postprandial overnight muscle protein synthesis rates. Med. Sci. Sports Exerc. 48, 2517–2525. doi: 10.1249/MSS.0000000000001045
Wall, B. T., Dirks, M. L., Snijders, T., van, Dijk JW, Fritsch, M., Verdijk, L. B., et al. (2016). Short-term muscle disuse lowers myofibrillar protein synthesis rates and induces anabolic resistance to protein ingestion. Am. J. Physiol. Endocrinol. Metab. 310, E137–E147. doi: 10.1152/ajpendo.00227.2015
Wall, B. T., Dirks, M. L., and van Loon, L. J. (2013a). Skeletal muscle atrophy during short-term disuse: implications for age-related sarcopenia. Ageing Res. Rev. 12, 898–906. doi: 10.1016/j.arr.2013.07.003
Wall, B. T., Snijders, T., Senden, J. M., Ottenbros, C. L., Gijsen, A. P., Verdijk, L. B., et al. (2013b). Disuse impairs the muscle protein synthetic response to protein ingestion in healthy men. J. Clin. Endocrinol. Metab. 98, 4872–4881. doi: 10.1210/jc.2013-2098
Wannamethee, S. G., Shaper, A. G., Lennon, L., and Whincup, P. H. (2007). Decreased muscle mass and increased central adiposity are independently related to mortality in older men. Am. J. Clin. Nutr. 86, 1339–1346. doi: 10.1093/ajcn/86.5.1339
West, D. W., Baehr, L. M., Marcotte, G. R., Chason, C. M., Tolento, L., Gomes, A. V., et al. (2016). Acute resistance exercise activates rapamycin-sensitive and-insensitive mechanisms that control translational activity and capacity in skeletal muscle. J. Physiol. 594, 453–468. doi: 10.1113/JP271365
Wilkinson, D. J., Franchi, M. V., Brook, M. S., Narici, M. V., Williams, J. P., Mitchell, W. K., et al. (2014). A validation of the application of D(2)O stable isotope tracer techniques for monitoring day-to-day changes in muscle protein subfraction synthesis in humans. Am. J. Physiol. Endocrinol. Metab. 306, E571–E579. doi: 10.1152/ajpendo.00650.2013
Wu, P., Chawla, A., Spinner, R. J., Yu, C., Yaszemski, M. J., Windebank, A. J., et al. (2014). Key changes in denervated muscles and their impact on regeneration and reinnervation. Neural Regen. Res. 9, 1796–1809. doi: 10.4103/1673-5374.143424
Keywords: skeletal muscle, atrophy, muscle loss, myofibrillar, protein synthesis, nerve damage, stable isotope, deuterium oxide
Citation: Langer HT, Senden JMG, Gijsen AP, Kempa S, van Loon LJC and Spuler S (2018) Muscle Atrophy Due to Nerve Damage Is Accompanied by Elevated Myofibrillar Protein Synthesis Rates. Front. Physiol. 9:1220. doi: 10.3389/fphys.2018.01220
Received: 22 June 2018; Accepted: 13 August 2018;
Published: 31 August 2018.
Edited by:
Susan V. Brooks, University of Michigan, United StatesReviewed by:
Kunihiro Sakuma, Tokyo Institute of Technology, JapanCopyright © 2018 Langer, Senden, Gijsen, Kempa, van Loon and Spuler. This is an open-access article distributed under the terms of the Creative Commons Attribution License (CC BY). The use, distribution or reproduction in other forums is permitted, provided the original author(s) and the copyright owner(s) are credited and that the original publication in this journal is cited, in accordance with accepted academic practice. No use, distribution or reproduction is permitted which does not comply with these terms.
*Correspondence: Henning T. Langer, aHRsYW5nZXJAdWNkYXZpcy5lZHU=
Disclaimer: All claims expressed in this article are solely those of the authors and do not necessarily represent those of their affiliated organizations, or those of the publisher, the editors and the reviewers. Any product that may be evaluated in this article or claim that may be made by its manufacturer is not guaranteed or endorsed by the publisher.
Research integrity at Frontiers
Learn more about the work of our research integrity team to safeguard the quality of each article we publish.