 David T. Sims
 Gladys L. Onambélé-Pearson
 Adrian Burden
 Carl Payton
 Christopher I. Morse
95% of researchers rate our articles as excellent or good
Learn more about the work of our research integrity team to safeguard the quality of each article we publish.
Find out more
ORIGINAL RESEARCH article
Front. Physiol. , 20 July 2018
Sec. Exercise Physiology
Volume 9 - 2018 | https://doi.org/10.3389/fphys.2018.00867
Achondroplasia is a genetic mutation of fibroblast growth factor receptor resulting in impaired growth plate development in long bones due to lower collagen turnover. Despite the characteristic shorter stature and lower strength in Achondroplasic groups, little is known of the tendon mechanical properties under loading. The aim of this study was therefore to conduct a between measure design of patella tendon (PT) mechanical properties (stress, strain, stiffness and Young's Modulus) in 10 men with Achondroplasia (22 ± 3 years) and 17 male controls (22 ± 2 years). PT mechanical properties were measured during isometric maximal voluntary contraction (iMVC) of the knee extensors using ultrasonography. The Achondroplasic group produced 54% less stress at iMVC than controls (29.4 ± 8.0 v 64.5 ± 14.0 MPa, P < 0.001, d = 3.12). Maximal excursion of the Achondroplasic PT was 22% less than controls at iMVC (7.4 ± 2.1 v 5.5 ± 1.7 mm, P < 0.001, d = 0.99), but there was no difference in strain between groups (13 ± 4 v 13 ± 3%, P > 0.05). Achondroplasic PT were 47% less stiff (748 ± 93 v 1418 ± 101 N·mm−1, P < 0.001, d = 6.89) and had a 51% lower Young's modulus (0.39 ± 0.09 v 0.77 ± 0.14 GPa, P < 0.001, d = 3.46) than controls at iMVC. Achondroplasic PT are indeed more compliant than controls which may contribute to lower relative force production. The causes of higher Achondroplasic PT compliance are unclear but are likely due to the collagen related genetic mutation which causes Achondroplasia.
Achondroplasia is a genetic condition characterized by shorter growth of long bones in the appendicular skeleton relative to the torso (Horton et al., 2007). The genetic mutation occurs within the fibroblast growth factor receptor 3 (FGFR3) which is part of a family of fibroblasts that are essential for the development, repair and turnover of collagen (Benjamin and Ralphs, 2000). The Achondroplasic condition is synonymous with impaired bone growth and development, but given that the human tendon is predominantly made up of collagen fibrils (Wang, 2006), it is possible that the altered FGFR3 may impact intrinsic properties of the Achondroplasic tendon compared to age matched averaged statured individuals (controls). However, Achondroplasic tendon compliance (or joint laxity) have only been commented on but not quantified (Bober et al., 2008; Akyol et al., 2015).
The human tendon is a collagenous, viscoelastic material which deforms in a curvilinear fashion when loaded (Maganaris and Paul, 2000; Reeves, 2006; Wang, 2006; Onambélé et al., 2007). Both the force through the cross-sectional area (CSA) of tendon (here as stress) and the amount of relative lengthening of the tendon during loading (here as strain) contribute to the tendon's role in transferring force from muscle to bone. The ratio of stress to strain provide Young's Modulus, which implies the tensile strength of the tendon whilst accounting for morphological properties of CSA and tendon length. A tendon that lengthens more for a given force production is more compliant and less effective at translating force to the bone and influences power output by up to 40% (Galantis and Woledge, 2003). This can lead to a higher oxygen cost during activities such as walking and running (Fletcher et al., 2010), which has recently been observed in a male Achondroplasic population (Sims et al., 2018). Whilst tendon loading and excursion during contraction has been described for differing human populations, both in vivo and in vitro, there remains no data for Achondroplasic populations.
Assuming tendon collagen is unaffected in Achondroplasic populations, there are likely to be differences in tendon morphology compared to controls due to stature differences between groups. The likely differences in tendon morphology between groups are also not likely to scale to anthropometric measures. For example, there is a downscaling of patella tendon morphology (CSA and length) from adults to children (O'Brien et al., 2010b). Given that the Achondroplasic limb length is disproportionate to the torso, compared to controls, a similar downscaling of patella tendon morphology may not be apparent. During contraction, differences in tendon morphology affect the rate of force transduction to the bone (Reeves, 2006). We previously observed that absolute and relative knee extensor (KE) force production is lower in Achondroplasic adult males to controls (Sims et al., 2017), and the likely patella tendon morphology differences between groups may explain some of the difference. There appears to be however, no measure of in vivo morphological or mechanical properties of the Achondroplasic tendon to make this assumption.
The aim of this study was therefore to measure the in vivo morphological properties of Achondroplasic patella tendons and compare them to controls. Furthermore, we aimed to measure the mechanical properties of the patella tendon during isometric maximal voluntary contraction (iMVC) of the KE and to observe the contractile properties of the vastus lateralis (VL). Young's Modulus would be calculated to appropriately scale Achondroplasic tendon properties and identify tensile strength of the patella tendon for both groups. The hypotheses of this study were that the Achondroplasic group would produce less KE force, have smaller dimensions of the patella tendon and in turn have more compliant patella tendons than controls.
After written, informed consent, 27 participants free from lower limb injury and of good health volunteered to participate in the study [mean (SD): 10 adult males with Achondroplasia, age: 22 (3) years, mass: 61.8 (8.5) kg, stature: 137.8 (4.7) cm, and 17 adult males, age: 22 (2) years, mass: 78.3 (10.7) kg, stature: 178.7 (8.3) cm]. Ethical approval was obtained from the local committee (Manchester Metropolitan University) and each participant attended one testing session at the laboratories of Manchester Metropolitan University where architectural properties of the patella tendon and vastus lateralis (VL) were measured, followed by isometric maximal voluntary contractions (iMVC) measurements of the KE. The study was a cross-sectional, between subject design which was developed in line with the Strengthening the Reporting of Observational Studies in Epidemiology (STROBE) statement.
While at rest participants sat in an isokinetic dynamometer with their dominant leg strapped into the lever arm so that 90° of knee flexion was attained (180° = full extension). Patella tendon origin and insertion were identified using ultrasonography (Technos MXP Biosound Esaote, UK) by holding a 5 cm 7.5 MHz linear array probe in the sagittal plane to the patella tendon. Intervals of tendon length (25, 50, and 75%) were measured and marked. CSA of the patella tendon (CSAPT) was taken by applying water-soluble transmission gel to the probe and placing along the sagittal plane of the patella tendon at the marked percentages of patella length with minimal pressure. Depth of view was such that medial and lateral borders of the patella tendon were viewable. Image recordings were AVI format at a sample frequency of 25 Hz; single images were selected using capture software (Adobe Premiere Elements version 10, Adobe Systems) and analyzed using digitizing software (NIH ImageJ, Version 1.44o, National Institutes of Health, Bethesda, Maryland). High reliability has been shown measuring patella tendon length (Skou and Aalkjaer, 2013) and CSAPT with ultrasound (Gellhorn and Carlson, 2013). Previous data on the reliability of the CSAPT using ultrasound is reported between 0.870 and 0.990 (Reeves et al., 2003b; Onambélé et al., 2007; Burgess et al., 2009; Gellhorn and Carlson, 2013). To confirm this within our study, CSAPT was measured on a single occasion and digitized on two separate occasions to determine intrascan reliability and coefficient of variation (CV). Patella tendon volume was then calculated using each individual CSAPT within the truncated cone method (Figure 1):
Where R is the radius (cm) of a given scan, A is the measured CSAPT (cm2), TCV is the mid-proximal (TCV1) and mid-distal (TCV2) truncated cone volumes (cm3) representing 25–50% and 50–75% of the tendon respectively, LPT is patella tendon length (cm) between two measured points, R1 and R2 are the radii (cm) of two scans respectively, while CV is cone volume (cm3) of the proximal (CVprox) and distal cone (CVdist) representing 0–25% and 75–100% of the tendon respectively. Tendon volume (cm3) is the sum of all inter-scan volumes.
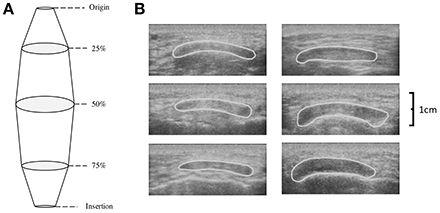
Figure 1. (A) Schematic depicting the calculation of tendon volume using the truncated cone method and (B) transverse ultrasound scans of the patella tendon CSA at 25% (top), 50% (middle), and 75% (bottom) of patella tendon length for a typical Achondroplasia (Left) and control (Right) control participant.
Torque production during KE iMVC (KE iMVCτ) of the dominant leg (Achondroplasia N = 9/10 right leg, control N = 16/18 right leg) was recorded using an isokinetic dynamometer (Cybex Norm, Cybex International Inc., NY, USA). Firstly, a counter weight was fixed to the dynamometer to minimize and standardize the compliance of the device. Participants were seated upright with the dynamometer and chair positioned in accordance with the calibration guidelines, so the lateral epicondyle was aligned with the dynamometer's central axis of rotation. Particularly in the Achondroplasic group, the chair and dynamometer were adjusted to align the medial malleolus if needed. Additional padding was placed behind the spine to stabilize the individual to ensure the knee maintained the set position throughout contractions. Velcro straps were used to secure the dominant leg to the chair via the distal portion of the thigh, while the lever arm was attached to the tibia at ~80% of its length. Participants warmed up by performing six continuous submaximal concentric contractions of the KE and knee flexors (KF). To reduce the effect of creep and to ensure preconditioning of the patella tendon (Maganaris, 2003; Pearson et al., 2007), participants completed four KE iMVCs at 90°Flexion (180° = full extension) with ~120 s rest between trials. Following warm up, two KE iMVC trials were recorded with participants verbally encouraged to exert as much force as possible. A ramped iMVC, lasting ~5 s, was instructed with visual feedback provided to all participants. KE iMVCτ was assumed based upon a visible plateau on a monitor and were recorded (2,000 Hz) on a computer (iMac, California) using an acquisition system (AcqKnowledge, Biopac Systems, California).
The origin and insertion of the VL were identified using B-mode ultrasonography (Technos MXP Biosound Esaote) by holding a 5 cm 7.5 MHz linear array probe along the transverse plane of the muscle. Upon identification of landmarks, a tape measure was used to determine VL length. In vivo muscle architecture of the VL was measured using B-mode ultrasonography during the last warm up KE iMVC to observe fascicle length (cm) and pennation angle (θ). Both fascicle length and pennation were measured during rest and KE iMVC to observe the change in each respective variable. The same linear array probe described above was held on the mid-sagittal plane on a previously established mid-point of the VL; measured equidistant from the origin-insertion and medial-lateral muscular borders. With water-soluble transmission gel, the probe was held normal to the skin with minimal pressure. View depth was set to ensure a number of fasciculi insertion points and deep aponeurosis were in view (Maganaris, 2001). Imaging and torque production were synchronized by an external voltage trigger enabling the accurate attainment of iMVC-to-ultrasound. Image recordings were AVI format at a sample frequency of 25 Hz; single images were selected using capture software (Adobe Premiere Elements version 10, Adobe Systems). Images of the VL at rest and iMVC were analyzed using digitizing software (NIH ImageJ, Version 1.44o, National Institutes of Health, Maryland). Fascicle length was determined as the distance between the superficial and deep aponeuroses along a visible fascicle (Maganaris, 2001). Pennation angle was defined as the insertion angle of the fascicle into the deep aponeurosis (Maganaris, 2001). With the VL being one of the larger muscles in the body, invariably the dimensions of the probe were not large enough to capture a full fascicle, for these cases linear extrapolation was used to determine fascicle length as little error (2–7%) is observed at the midpoint of the muscle (Finni et al., 2003), again using digitizing software described above.
Tendon elongation was observed from rest to iMVC. 50% of the measured resting tendon length described above was used to place a thin (~10 mm) echo absorbing marker (Micropore tape) on the skin, across the tendon, to act as a reference marker. The ultrasound probe was held in the sagittal plane over the patella tendon so that the reference marker was identifiable with both the patella tendon origin (proximal, trial 1) and the patella tendon insertion (distal, trial 2) in the same image. Ultrasound images were then stitched together using digitizing software (GIMP) and analyzed using Image J. High reliability (r = 0.910) of tendon excursion using this method is reported elsewhere (Onambélé et al., 2007). Participants were instructed to perform a ramped iMVC where the test was terminated once a plateau of the torque trace was observed on a monitor. Ultrasound imaging and torque production were synchronized using an external voltage trigger enabling the accurate attainment of iMVC-to-ultrasound. As described by Onambélé et al. (2007), analysis of the images were completed after the calculation of torque at 10% intervals of iMVC, where excursion was determined from the respective origin and insertion of the tendon to the respective superior and inferior edge of the reference marker (Figure 2). At each 10% interval of iMVC, the displacement of the patella tendon from the respective trial 1 and trial 2 measurements added to the width of the tape placed over the patella tendon to measure total tendon length, as described elsewhere (Onambélé et al., 2007). Elongation of the patella tendon was recorded once, but to ensure intrascan reliability, images were digitized twice on separate occasions. These values were then used to determine total strain described below.
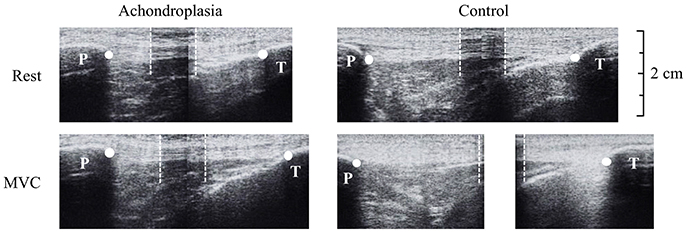
Figure 2. Ultrasound images during tendon elongation measures of the Achondroplasic (left images) and control (right images) patella tendon from rest (top) to maximal voluntary contraction (bottom). White dots represent the measurement of tendon length from patella tendon origin (patella, P) and insertion (tibia, T). For the longer tendons that exceed the ultrasound probe's field of view, an echo-absorptive marker was used as a reference point to help stitch images together (Onambélé et al., 2007). The boundaries of the marker are identified by the white dotted lines.
To accurately measure KE iMVCτ, agonist activation was assessed to estimate the degree of total activation of the KE. To do so, two rubber stimulation pads (size ranging from 70 × 90 to 180 × 100 mm; Uni-Patch, MN, USA) were placed proximally and distally along the transverse plane of the dominant femur. A counter weight was fixed to the dynamometer to minimize the compliance of the device. While in a relaxed state, a percutaneous singlet electrical stimulus (DS7, Digitimer stimulator, Welwyn, Garden City, UK) was passed through the KE at increasing increments (~50 mV) and regular intervals (~20 s) until a plateau of twitch torque was measured. A supramaximal doublet stimulus was subsequently applied to the participant's KE (interstimulus gap 10 μs and pulse width 50 μs) during KE iMVC. Doublet stimulus has been shown to improve the signal-noise ratio in the assessment of central activation (Kent-Braun and Ng, 1999). A second doublet was applied approximately 5 s after the first stimulus when the muscles were fully relaxed, termed the potentiated doublet (Behm et al., 2001). Agonist activation was calculated using the following equation:
Where; t is the interpolated doublet amplitude of the twitch torque, iMVCτ is the isometric maximal voluntary contraction torque and T is the potentiated doublet amplitude (Behm et al., 2001).
Co-activation of the KF was measured in all participants during a KE iMVC, and subsequent KF iMVCτ produced at the angle at which peak KE iMVCτ was measured. In order to determine coactivation of the KF, surface electromyography (EMG) was recorded over the biceps femoris (BF) as it is the largest of the KF group, and is representative of the KF group as a whole (Kellis and Unnithan, 1999). Furthermore, surface EMG was deemed adequate despite the adiposity levels in Achondroplasic individuals (Sims et al., 2017), as no differences in EMG readings are observed between groups of differing adiposity (De Vito et al., 2003). Boundaries of the BF were determined using ultrasonography (Technos MXP Biosound Esaote) to ensure consistent placement of EMG electrodes over the KF. When established two pre-gelled, unipolar, 10 mm, Ag-AgCl percutaneous EMG electrodes (Ambu Neuroline 720, Baltorpbakken, Denmark) were placed distally at ~1/3 of muscle length, to avoid the motor unit of the BF, and ~2 mm apart along the mid-sagittal plane of the muscle (NORAXON, Arizona, USA). A third electrode was placed on the lateral epicondyle of the same femur as a reference. Prior to the placement of the electrodes, areas of the skin were shaved, then cleaned using an alcoholic wipe to minimize skin impedance and improve the EMG signal. Raw EMG data were recorded at 2,000 Hz, with a high and low band-pass filter set at 10 and 500 Hz respectively, and a notch set at 50 Hz. The integral of the root mean square was recorded 0.5 seconds either side of the KE and KF iMVCτ to quantify the level of KF muscle coactivation. Based on a linear relationship occurring between torque and EMG activity (Maganaris et al., 1998), KF torque (KFτ) during KE iMVC was derived by converting the percentage activation of KF EMG during KE iMVC to KF EMG during KF iMVC.
Where KFτ is the KF torque during KE (N·m), KE is the agonist EMG (mV) recorded of the KE during KE iMVC, KF is the antagonist EMG (mV) recorded of the KE during KE iMVC and KF iMVCτ is the torque (N·m) observed during KF iMVC.
The measurement of agonist and antagonist muscle activation are required for the accurate quantification of net KE iMVCτ production which is used in the calculation of patella tendon force (FPT). Net KE iMVCτ was subsequently calculated as the sum of KE iMVCτ and KFτ (Reeves et al., 2003b; Onambélé and Degens, 2006; Onambélé et al., 2007; Pearson et al., 2007; Seynnes et al., 2009).
A duel-energy X-ray absorptiometry (DEXA) scan (Hologic Discovery, Vertec Scientific Ltd, UK) was used to obtain moment arm length of the patellar tendon (Erskine et al., 2014). Participants were asked to lie on their side in a relaxed state with the dominant knee positioned at 90° using a manual goniometer. A sagittal plane scan was taken of the knee using a 22.3 × 13.7 cm field of view. Obtained scans were exported to, and analyzed on, a Dicom viewer (OsiriZ 5.0.2, Pixmeo Sarl, Geneva, Switzerland). Moment arm length (m) was determined as the perpendicular distance between the estimated tibiofemoral contact point (the estimated joint center) and the patella tendon (Tsaopoulos et al., 2006).
To calculate the mechanical properties of the patella tendon, the first measurement of CSAPT and patella tendon elongation, and the average KE iMVCτ was used in both groups.
To calculate the FPT, the average net KE iMVCτ achieved between proximal and distal efforts was divided by the patella moment arm length (m).
Patella tendon stress was calculated by dividing FPT by CSAPT at mid-tendon length (MPa) while patella tendon strain was the ratio of excursion to resting patella tendon length (%) (Onambélé et al., 2007; O'Brien et al., 2010b).
Patella tendon force-elongation relationships were fitted with second order polynomial functions forced through zero. Instantaneous patella tendon stiffness values were then calculated at 10% intervals of KE iMVC force (from 10 to 100%), from the gradient of tangential lines along the force-elongation curve (Onambélé et al., 2007).
Instantaneous Young's modulus values were calculated as:
Where K is the calculated stiffness, LPTi is the patella tendon length at each 10% tangential calculation of FPT and CSAPT is the cross-sectional area of the patella tendon at 50% of resting length.
With large discrepancies in maximal FPT expected between groups (Sims et al., 2017), the tensile properties of the patella tendon were calculated at the lowest FPT attained by the weakest Achondroplasic participant. Patella stress, strain and Young's Modulus are then presented at this common force level (1756 N) achieved by all participants consistent with previous work (Onambélé et al., 2007; Burgess et al., 2009; Hicks et al., 2017).
All data were collated onto a personal computer (MacBook Pro, California) and analyzed using SPSS (v22.0, IBM). Data were assumed parametric following Shapiro-Wilk and Levene's tests. Repeated measures ANOVA with between group effects were conducted on the CSAPT and VL architecture. Between group comparisons for all measured variables at 10% intervals of iMVC were conducted using independent t-tests. Intraclass correlations (ICC) with a one-way random effect model and CV were used for reliability of KE iMVCτ between proximal and distal efforts, and between post scan digitization of CSAPT and patella tendon elongation. Where data violated parametric assumptions, a Mann Whitney-U was performed. Alpha was set at ≤ 0.05 and the power of the study was > 0.80 (G*Power) such that effect sizes (Cohen's d and η2) are reported; all results are reported as means (SD). All results are reported as means (SD). All inferential statistics at maximal values are reported in the text, while all submaximal values can be found in the online supplementary documentation that accompanies this paper.
There was no difference in age between groups [t(25) = 0.658, P = 0.522]. The Achondroplasic group were 23% smaller in stature [t(25) = 18.95, P < 0.001] and 19% lighter in body mass [t(25) = 4.598, P < 0.001] compared to controls; data are reported in the methods. Reliability of KE iMVCτ between proximal and distal efforts were strong (Achondroplasic group: ICC = 0.968, CV = 3.2%, P < 0.001; controls: ICC = 0.932, CV = 3.4%, P < 0.001) as were the measures of CSAPT (ICC = 0.965–0.998, CV 1.3–4.4% for all measures in both groups, P < 0.001) and patella tendon elongation (ICC = 0.940–0.982, CV 1.5–3.0% for all measures in both groups, P < 0.001).
The Achondroplasic group had a 32% smaller resting patella tendon length (P < 0.001) and a 41% smaller VL than controls (P < 0.001, Table 1). ANOVA showed an effect in CSAPT between groups [F(1, 25) = 9.803, P = 0.004, η2 = 28.2], but no effect in CSAPT between each measured interval within groups [F(1.8, 50) = 3.299, P = 0.051, η2 = 11.7], but no interaction effect was found [F(2, 50) = 0.142, P = 0.868, η2 = 0.6]. The Achondroplasic group had a smaller CSAPT at 25% (P = 0.013), 50% (P = 0.003) and 75% (P = 0.010) compared to controls (Table 1). The Achondroplasic patella tendon volume was 48% less than controls (P < 0.001). There was no difference between groups' moment arm length (P = 0.989, Table 1). The Achondroplasic group did have a 15% longer patella tendon length relative to VL length (P = 0.001) and a 42% greater moment arm length to femur ratio, compared to controls (P < 0.001, Table 1). There was no difference in the ratio of 50% CSAPT to patella tendon length between groups (P = 0.102, Table 1).
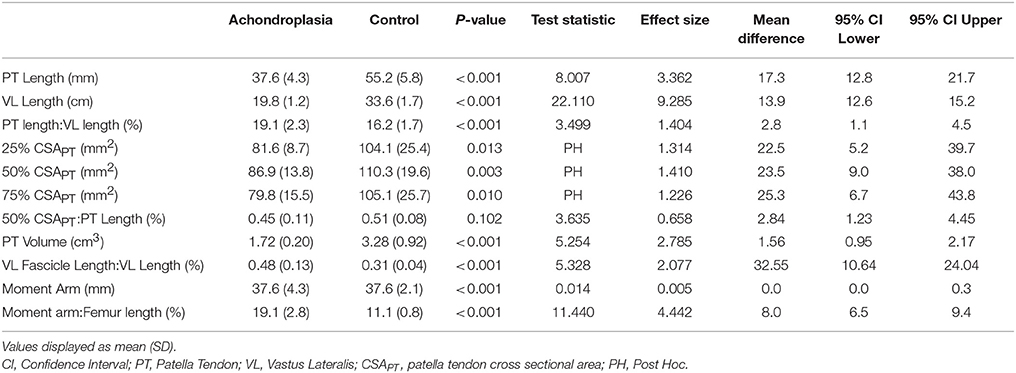
Table 1. Morphological properties of the patella tendon, vastus lateralis and patella tendon moment arm at rest in Achondroplasia and control.
Adult males with Achondroplasia produced 63% less KE iMVCτ than controls (P < 0.001, Table 2). KF iMVCτ was also 82% lower in the Achondroplasic group compared to controls (P < 0.001, Table 2). The ratio of KE to KF iMVCτ was higher in the Achondroplasic group compared to controls (P < 0.001, Table 2). The ratio between KE iMVCτ and VL length was 39% greater in Achondroplasic group than controls (P < 0.001, Table 2).
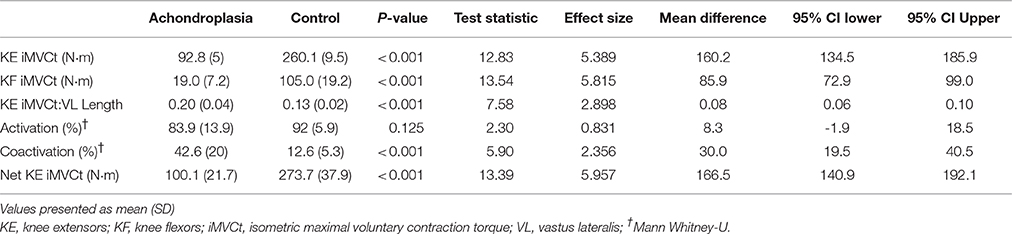
Table 2. Activation and force characteristics of the adult VL in Achondroplasia and controls.
There was no difference in maximal KE activation between the groups (P = 0.125), however the Achondroplasic group had a 70% greater coactivation of the BF during KE iMVC compared to controls (P < 0.001, Table 2).
Both groups increased KE iMVCτ when corrected for BF coactivation, with the Achondroplasic group increasing by 7% (P < 0.001) and controls by 5% (P < 0.001), respectively. The net KE iMVCτ produced by the VL was 63% less in Achondroplasic group compared to controls (P < 0.001, Table 2).
There was a significant effect in VL fiber length from rest to iMVC [F(1, 25) = 69.65, P < 0.001, η2 = 72.8] and a between group effect [F(1, 25) = 4.260, P = 0.048, η2 = 12.9], but no interaction was observed [F(1, 25) = 0.545, P = 0.467, η2 = 2.1]. Similarly, there was a significant effect in VL pennation angle from rest to iMVC [F(1, 25) = 68.28, P < 0.001, η2 = 72.4] and a between group effect [F(1, 25) = 6.191, P = 0.020, η2 = 19.2], but no interaction was observed [F(1, 25) = 2.645, P = 0.116, η2 = 9.2]. There was no difference in VL pennation angle (P = 0.105) or fascicle length (P = 0.199) at rest between groups, but Achondroplasic fascicles shortened 28% more (P = 0.012) and increased by 25% in pennation angle (P = 0.029) from rest to iMVC compared to controls (Figures 3, 4). The Achondroplasic group also had a 36% longer fascicle length relative to VL length (P < 0.001, Table 1).
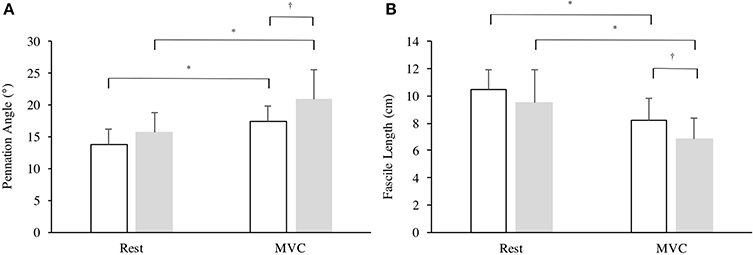
Figure 3. Architectural properties of the vastus lateralis' (A) pennation angle and (B) fascicle length in Achondroplasia (gray) and controls (white) from rest to iMVC. * ≤ 0.05, † ≤ 0.001.
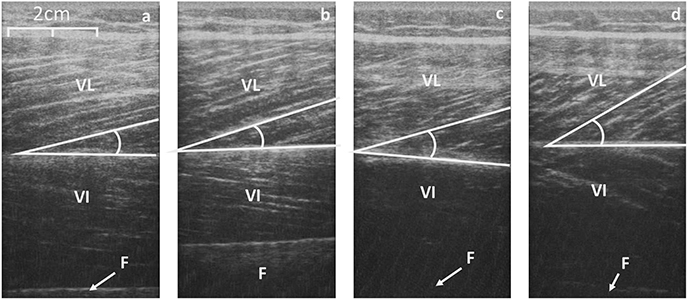
Figure 4. Sagittal scans of the VL at rest (a, control; c, Achondroplasia) and at iMVC (b, control; d, Achondroplasia). Deep aponeurosis is highlighted along with a fascicular insertion. VL, Vastus Lateralis; VI, Vastus Intermedius; F, Femur.
The Achondroplasic group produced less FPT than controls [F(9, 216) = 71.85, P < 0.001, η2 = 75.0], with an average of 63% less FPT at each 10% interval (P < 0.001) and 64% less maximal FPT than controls (P < 0.001, d = 5.315, Figure 5A). The Achondroplasic tendon elongation was less than controls [F(9, 216) = 32.948, P < 0.001, η2 = 57.9] with an average 15% less elongation compared to controls at each 10% interval (each 10% interval: P < 0.001) and 22% less at KE iMVC compared to controls (P < 0.001, d = 3.837, Figure 5A).
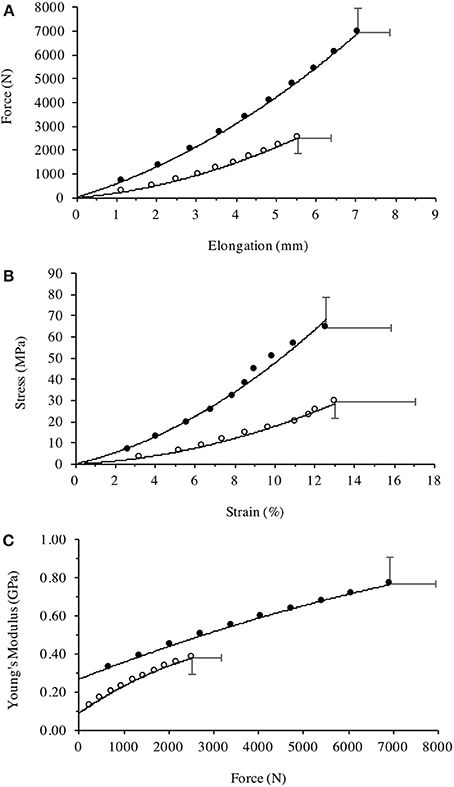
Figure 5. Patella tendon (A) Force-Elongation relationship, (B) stress-strain relationship, and (C) Young's modulus plotted against the incremental level of iMVC force for the Achondroplasic (open circles) and control group (closed circles). All figures are fitted with polynomial curves, with Figures 4a, b forced through zero. For clarity of Figures, SD are only given at max values.
Patella tendon strain was similar between groups [F(9, 216) = 0.376, P = 0.545, η2 = 1.5] during KE with maximal strain being 13 (4%) and 13 (3%) for the Achondroplasic and control group, respectively (Figure 5B). Stress was lower however, in the Achondroplasic group during KE [F(9, 216) = 43.81, P < 0.001, η2 = 64.6], with an average 55% less patella tendon stress at each 10% interval (each 10% interval: P < 0.001) and 53% lower maximal patella tendon stress compared to controls (P < 0.001, d = 3.191, Figure 5B).
Patella Tendon stiffness was lower in the Achondroplasic group [F(9, 216) = 106.8, P < 0.001, η2 = 81.6] with patella tendon stiffness being on average 51% lower through the 10–90% intervals of KE iMVC compared to controls (each 10% interval: P < 0.01). The Achondroplasic group had a 47% lower maximal patella tendon stiffness compared to controls (Achondroplasic group, 748 N·mm-1 (93); controls, 1418 N·mm-1 (101), P < 0.001, d = 6.890).
Young's Modulus was also lower in the Achondroplasic group compared to controls [F(9, 216) = 74.21, P < 0.001, η2 = 74.8]. Young's Modulus was on average 54% lower in Achondroplasic group at each 10% of KE iMVC (each 10% interval: P < 0.001, Figure 5C) and was 51% lower at KE iMVC than controls (P < 0.001, d = 3.465, Figure 5C).
Tensile properties of all participants were analyzed at 1756 N (the FPT attained by the weakest Achondroplasic participant). Consistent with absolute measures of FPT, stress (22%, P = 0.001) and strain (78%, P < 0.001) were higher in the Achondroplasic group, while their stiffness (12%, P < 0.001) and Young's Modulus (11%, P = 0.041) were lower compared to controls (Table 3).
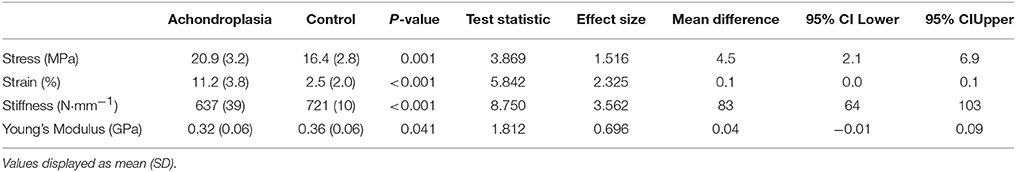
Table 3. Elastic properties of Achondroplasic and control patella tendon at a standardized force (1756 N).
The aim of this study was to assess the in vivo morphological and material properties of Achondroplasic patella tendons during KE iMVC and compare them to controls. The Achondroplasic patella tendon was smaller in CSA and volume but were disproportionate in length compared to controls. The main finding however, was that despite accounting for patella tendon morphology and mechanical properties, the tensile strength (here as Young's Modulus) of the Achondroplasic patella tendon were significantly lower than controls' leading to a more compliant Achondroplasic patella tendon.
Many agree that a larger ratio of tendon CSA to tendon length leads to a greater tendon stiffness (Kubo et al., 2001b; Reeves, 2006; O'Brien et al., 2010b). While this ratio was higher in the Achondroplasic patella tendon, a higher patella tendon stiffness was not observed. A shorter Achondroplasic femur length compared to controls (measured here as VL length) would explain the difference in Achondroplasic patella tendon length. A shorter femur would suggest a shorter muscle tendon unit, which is observed elsewhere in groups of shorter statures (Morse et al., 2008; O'Brien et al., 2010a,b). However, the shorter femur observed in the Achondroplasic group compared to controls does not explain the Achondroplasic group's relatively longer patella tendon length. The Achondroplasic knee is more flexed when at rest (Akyol et al., 2015), and the more flexed knee may deform the patella tendon over time leading to a creep effect. However, no longitudinal measures of the Achondroplasic tendon has been made.
With no in vitro tendon properties identified in the Achondroplasic population, explanations as to why absolute measures of CSAPT are lower and relative measures (CSAPT to patella tendon length) are higher compared to controls are speculative, but reasonable. The measurement of CSAPT using ultrasound is regarded by some, though by few, as unreliable (Ekizos et al., 2013). However, the present data, previous reports from our own lab (Reeves et al., 2003b), and recently by Gellhorn and Carlson (2013), show high ICCs for CSAPT with a typical error of < 1.5 mm2. Using the maximal CSAPT difference from Reeves et al., the ranges of calculated stress measured here would be 3.6 and 2.8% different for the Achondroplasic and control group, respectively. Even the lower ICCs presented by Ekizos et al. would present stress values ±20% of the average values for each of the current groups. If the measurement of CSAPT was indeed miscalculated in this study, it would have to have been ~40% under- and over-predicted for the Achondroplasic and control group, respectively, for there to be the same stress and therefore the same stiffness values.
The use of ultrasound is a good method of attaining CSAPT without the use and availability of a magnetic resonance imaging (MRI) scanner, which is considerably less accessible for most researchers. Despite the conflicting arguments in the reliability of CSAPT calculation, the stress and Young's Modulus calculated here have a large amount of face validity. These results are undoubtedly due to the large differences in relative (CSAPT to patella tendon length) and absolute CSAPT between groups. Importantly though, this is backed by the potential respective under- and over-predictions of the Achondroplasic and control groups' CSAPT required to attain similar stress values. Therefore, the smaller absolute CSAPT seen in the Achondroplasic group would most likely be a result of the scaling of leg length and muscle size. The larger relative CSAPT in the Achondroplasic group is most probably “pseudohypertrophy” of the tendon fibrils and is likely due to intrinsic factors of the tendon, which are discussed later.
We have previously observed that Achondroplasic adults have a lower net KE iMVCτ than controls (Sims et al., 2017). This in turn led to a lower FPT and patella tendon stress in the Achondroplasic group. Initially this would have been a viable reason to explain the Achondroplasic group's lower patella tendon Young's Modulus, particularly as patella tendon strain was similar between groups at iMVC. However, to observe the mechanical properties of the patella tendon between groups, we standardized FPT between groups. Stress and strain were higher in the Achondroplasic group while their stiffness and Young's Modulus was lower than controls. This finding is different to other reports where Young's Modulus at iMVC is different but are similar when calculated at a standardized tendon forces (Onambélé et al., 2007; Burgess et al., 2009). The lower Young's Modulus at this standardized value again suggest that the intrinsic properties of the Achondroplasic patella tendon are different to controls.
In the present study, the higher Achondroplasic Young's Modulus at maximal and standardized FPT suggests that the Achondroplasic patella tendon's tensile properties are different to controls. The Young's Modulus of the Achondroplasic patella tendon appears to be lower than adult females (Onambélé et al., 2007), children of both genders (O'Brien et al., 2010b), the elderly (Reeves et al., 2003b) and a large number of controls groups that are similar in age, stature as the control group presented here (Onambélé et al., 2007; Carroll et al., 2008; Seynnes et al., 2009; O'Brien et al., 2010b; Hicks et al., 2017). There appears to be no conclusive evidence to suggest why a lower Young's Modulus exists in the Achondroplasic group, however there are a number of speculative but reasonable explanations as to why Achondroplasic patella tendons would be more compliant than controls. Whilst this list is not exhaustive, the mutation that causes Achondroplasia, the tendon's extracellular matrix, hormonal differences and body composition of Achondroplasic individuals may all contribute to a more compliant Achondroplasic patella tendon. For example, the Achondroplasic male adults adiposity and body mass index are higher than controls (Sims et al., 2017), and there are known genetic mutations of collagen formation within Achondroplasia, symptomatic of the condition (Benjamin and Ralphs, 2000; Horton et al., 2007). Both factors may play a role in the development and orientation of the patella tendon type II collagen in the fibrocartilage of FGFR3 mutated mice which is negatively affected (Liang et al., 2009). Were fibrocartilage to be similarly affected by FGFR3 in humans, the compliance of the fibrocartilage may be reduced. Furthermore, high adiposity has previously been associated with hormonal differences (Miller et al., 2007; Hansen et al., 2009) and higher tendon water content (Laaksonen et al., 2003), which are in turn linked to more compliant tendons (Kubo et al., 2001b; Birch, 2007; Onambélé et al., 2007). As mentioned however, these factors are speculative and further in vivo and in vitro investigations are warranted.
A more compliant tendon alters the length tension relationship whereby the muscle fascicle works on the ascending limb of the relationship (Reeves, 2006). This observation may partly explain the lower specific force production of the Achondroplasic VL (Sims et al., 2017). Furthermore, a more compliant tendon will undergo a greater excursion for the same force, as observed within our Achondroplasic group at a standardized force value (1756 N). The higher Achondroplasic patella tendon compliance is likely to affect postural balance in Achondroplasic populations, as observed in control populations (Onambélé et al., 2006). This would suggest that Achondroplasic individuals are at a greater risk of falling compared to controls. Furthermore, compliant tendons are associated with a higher metabolic cost during gait (Arampatzis et al., 2006; Fletcher et al., 2010; Albracht and Arampatzis, 2013) and amplification of muscle power during muscle contraction (Roberts and Azizi, 2011). We have recently showed both of these artifacts in Achondroplasic males with the population having a higher walking and running metabolic cost (Sims et al., 2018) and a lower specific VL force production compared to controls (Sims et al., 2017). The more compliant Achondroplasic patella tendon observed in the current study would suggest plausible reasoning for their higher metabolic cost and lower amplification of force production from the muscle. Therefore, improvements of Achondroplasic tendon compliance through resistance training would likely improve their higher metabolic cost, as observed in controls (Fletcher et al., 2010). To the authors' knowledge though, no such training study in Achondroplasic individuals exist.
Although there is a potential increase in injury risk to Achondroplasic tendons, research groups have shown that tendons are adaptable structures which can increase in stiffness when put through a resistance training programme and therefore reduce the risk of injury and improve metabolic cost. Such programmes are observed in controls (Kubo et al., 2001a,b; Onambélé et al., 2008; Seynnes et al., 2009), the elderly (Reeves et al., 2003a,b; Onambélé et al., 2006, 2008) and children (Waugh et al., 2014). The likely lower risk of falling and a lower metabolic cost following such programmes in physically active, sedentary and elderly Achondroplasic groups would possibly improve the prevalence at which they effectively complete activities of daily living and physical activity. This in turn would likely have positive effects on their health (Wilmot et al., 2012). Future work should therefore be aimed to chronicle the effects of differing training regimens in Achondroplasic populations, specifically observing the changing of gait related tendon compliance, such as the patella and Achilles tendon.
To the authors' knowledge, this paper presents the first data regarding the in vivo mechanical properties of the Achondroplasic patella tendon. There are however, a number of limitations to the methods employed that warrant further development to confirm the presented data. The quantification of the Achondroplasic and control group's CSAPT was through ultrasonography. While ultrasound to quantify CSAPT is considered reliable (Mc Auliffe et al., 2017) and used in numerous populations (Reeves et al., 2003b; Onambélé et al., 2007; Burgess et al., 2009; Gellhorn and Carlson, 2013), the technique has not been validated against MRI. It should be noted however that our control group's CSAPT is similar to that presented previously using both ultrasonography (Onambélé et al., 2007; O'Brien et al., 2010b) and MRI (Carroll et al., 2008; Seynnes et al., 2009). We are confident therefore, that the large effect sizes observed between the current groups' CSAPT would be persist despite the likely higher variance in measurement when using ultrasonography compared to MRI.
Net KE iMVCτ was derived by the measurement of KF coactivation during KE iMVC on an isokinetic dynamometer. Both the methods of correcting for coactivation and the use of an isokinetic dynamometer could be considered to be a limitation to the calculation of net KE iMVCτ and FPT, respectively. Based on previous data (Macaluso et al., 2002), there is 5% KE coactivation during KF iMVC, this is equivalent to 13 N·m in controls and 8 N·m in the Achondroplasic group, assuming KE coactivation is three times greater like that observed in Achondroplasic KF coactivation. By omitting the calculation of KE coactivation during our measurement of KF iMVC, we underestimated the KF iMVCτ and have therefore underestimated our net KE iMVCτ. It should be noted however, that because KE coactivation is very low during KF, this level of underestimation of coactivation torque would increase KE iMVCτ by 12% in the Achondroplasic group and 5% in controls. In the present study, by making this correction, the group differences in net KE iMVCτ would be 61% rather than the 63% reported. Due to the circular nature of accounting for coactivation in this manner however, we have only corrected net KE iMVCτ calculations based on the much higher coactivation of the KF during KE iMVC.
The use of a dynamometer, although ubiquitous within research observing neuromuscular and biomechanical properties of the musculotendon unit during iMVCs, is likely to result in a degree of change of the knee joint angle that could contribute to errors in torque measurement. At the level of net KE iMVCτ observed in the present controls group, a prediction of unmeasured torque can be made using the change in the knee joint angle from 90° to ~70° (Tsaopoulos et al., 2011). At this level of joint displacement (20°), we would expect a lengthening of the patella tendon moment arm by 3.3 mm (Baltzopoulos, 1995), although a lower iMVC was seen in the Achondroplasic group which would suggest a lower joint displacement during at iMVC (Kaufman et al., 1995; Arampatzis et al., 2004; Tsaopoulos et al., 2011). Assuming the same level of moment arm lengthening in both groups (3.3 mm), the FPT would reduce by 8% in the Achondroplasic group and 7% in the controls. As these estimates of joint deformation as a result of dynamometer compliance are unverified, we present the unaltered values as to allow comparison to related work.
This study aimed to examine the in vivo material properties of adult Achondroplasic patella tendon during a ramped MVC. The main findings are that there are significant differences in material properties between Achondroplasic males and controls, which lead to a more compliant Achondroplasic patella tendon. In addition, at both absolute (iMVC) and standardized force (1756 N) levels of stress, stiffness and Young's modulus are lower in the Achondroplasic groups compared to controls suggesting intrinsic differences between groups.
Achondroplasic patella tendon morphology and mechanical properties are different to controls leading to a more compliant patella tendon during maximal voluntary contraction. The genetic variation that alters collagen development in the bone and causes Achondroplasia, may also affect their tendon compliance.
This study was carried out in accordance with the recommendations of Manchester Metropolitan Universities locale this committee with written informed consent from all subjects. All subjects gave written informed consent in accordance with the Declaration of Helsinki.
DS lead author, contributed to the inception of the study, participant recruitment and testing, data analysis and interpretation, writing of the main body of work and approval of the article. GO-P and AB contributed to the inception of the study, data analysis and interpretation and revisions of the main body of work and approval of the article. CP contributed to data analysis and interpretation and revisions of the main body of work and approval of the article. CM contributed to the inception of the study, participant recruitment and testing, data analysis and interpretation and writing of the main body of work and approval of the article.
The authors declare that the research was conducted in the absence of any commercial or financial relationships that could be construed as a potential conflict of interest.
The authors would like to thank the Dwarf Sports Association (Dronfield, UK. Registered Charity number 1041961) for their assistance in recruitment and Dream it Believe it Achieve it (Northwich, UK. Registered Charity Number: 1153116) for which DS received initial postgraduate funding.
The Supplementary Material for this article can be found online at: https://www.frontiersin.org/articles/10.3389/fphys.2018.00867/full#supplementary-material
Akyol, Y., Averill, L. W., Atanda, A., Kecskemethy, H. H., Bober, M. B., and Mackenzie, W. G. (2015). Magnetic resonance evaluation of the knee in children and adolescents with achondroplasia. Pediatr. Radiol. 45, 888–895. doi: 10.1007/s00247-014-3228-1
Albracht, K., and Arampatzis, A. (2013). Exercise-induced changes in triceps surae tendon stiffness and muscle strength affect running economy in humans. Eur. J. Appl. Physiol. 113, 1605–1615. doi: 10.1007/s00421-012-2585-4
Arampatzis, A., De Monte, G., Karamanidis, K., Morey-Klapsing, G., Stafilidis, S., and Brüggemann, G. P. (2006). Influence of the muscle-tendon units mechanical and morphological properties on running economy. J. Exp. Biol. 209, 3345–3357. doi: 10.1242/jeb.02340
Arampatzis, A., Morey-Klapsing, G., Karamanidis, K., DeMonte, G., Stafilidis, S., and Brüggemann, G. P. (2004). Differences between measured and resultant joint moments during isometric contractions at the ankle joint. J. Biomech. 38, 885–892. doi: 10.1016/j.jbiomech.2004.04.027
Baltzopoulos, V. (1995). A videofluoroscopy method for optical distortion correction and measurement of knee-joint kinematics. Clin. Biomech. 10, 85–92. doi: 10.1016/0268-0033(95)92044-M
Behm, D., Power, K., and Drinkwater, E. (2001). Comparison of interpolation and central activation ratios as measures of muscle inactivation. Muscle Nerve 27, 925–934. doi: 10.1002/mus.1090
Benjamin, M., and Ralphs, J. R. (2000). The cell and developmental biology of tendons and ligaments. Int. Rev. Cytol. 196, 85–130. doi: 10.1016/S0074-7696(00)96003-0
Birch, H. L. (2007). Tendon matrix composition and turnover in relation to functional requirements. Int. J. Exp. Pathol. 88, 241–248. doi: 10.1111/j.1365-2613.2007.00552.x
Bober, M., Johnson, C., Nicholson, L., and Scott, C. (2008). Scott sign: a clinical measure of ligamentous laxity in achondroplastic infants. Am. J. Med. Genet. A 146, 2291–2292. doi: 10.1002/ajmg.a.31977
Burgess, K. E., Graham-Smith, P., and Pearson, S. J. (2009). Effect of acute tensile loading on gender-specific tendon structural and mechanical properties. J. Orthop. Res. 27, 510–516. doi: 10.1002/jor.20768
Carroll, C. C., Dickinson, J. M., Haus, J. M., Lee, G. A., Hollon, C. J., Aagaard, P., et al. (2008). Influence of aging on the in vivo properties of human patellar tendon. J. Appl. Physiol. 105, 1907–1915. doi: 10.1152/japplphysiol.00059.2008
De Vito, G., Mchugh, D., Macaluso, A., and Riches, P. E. (2003). Is the coactivation of biceps femoris during isometric knee extension affected by adiposity in healthy young humans? J. Electromyogr. Kinesiol. 15, 425–431. doi: 10.1016/S1050-6411(03)00061-0
Ekizos, A., Papatzika, F., Charcharis, G., Bohm, S., Mersmann, F., and Arampatzis, A. (2013). Ultrasound does not provide reliable results for the measurement of the patellar tendon cross sectional area. J. Electromyogr. Kinesiol. 23, 1278–1282. doi: 10.1016/j.jelekin.2013.08.004
Erskine, R. M., Morse, C. I., Day, S. H., Williams, A. G., and Onambélé-Pearson, G. L. (2014). The human patellar tendon moment arm assessed in vivo using dual-energy X-ray absorptiometry. J. Biomech. 47, 1294–1298. doi: 10.1016/j.jbiomech.2014.02.016
Finni, T., Ikegawa, S., Lepola, V., and Komi, P. V. (2003). Comparison of force–velocity relationships of vastus lateralis muscle in isokinetic and in stretch-shortening cycle exercises. Acta Physiol. Scand. 177, 483–491. doi: 10.1046/j.1365-201X.2003.01069.x
Fletcher, J. R., Esau, S. P., and MacIntosh, B. R. (2010). Changes in tendon stiffness and running economy in highly trained distance runners. Eur. J. Appl. Physiol. 110, 1037–1046. doi: 10.1007/s00421-010-1582-8
Galantis, A., and Woledge, R. C. (2003). The theoretical limits to the power output of a muscle–tendon complex with inertial and gravitational loads. Proc. R. Soc. Lond. B Biol. Sci. 270, 1493–1498. doi: 10.1098/rspb.2003.2403
Gellhorn, A. C., and Carlson, M. J. (2013). Inter-rater, intra-rater, and inter-machine reliability of quantitative ultrasound measurements of the patellar tendon. Ultrasound Med. Biol. 39, 791–796. doi: 10.1016/j.ultrasmedbio.2012.12.001
Hansen, M., Miller, B. F., Holm, L., Doessing, S., Petersen, S. G., Skovgaard, D., et al. (2009). Effect of administration of oral contraceptives in vivo on collagen synthesis in tendon and muscle connective tissue in young women. J. Appl. Physiol. 106, 1435–1443. doi: 10.1152/japplphysiol.90933.2008
Hicks, K. M., Onambélé-Pearson, G. L., Winwood, K., and Morse, C. I. (2017). Muscle-tendon unit properties during eccentric exercise correlate with the creatine kinase response. Front. Physiol. 8:657. doi: 10.3389/fphys.2017.00657
Horton, W. A., Hall, J. G., and Hecht, J. T. (2007). Achondroplasia. Lancet 370, 162–172. doi: 10.1016/S0140-6736(07)61090-3
Kaufman, K. R., An, K. N., and Chao, E. Y. (1995). A comparison of intersegmental joint dynamics to isokinetic dynamometer measurements. J. Biomech. 28, 1243–1247. doi: 10.1016/0021-9290(94)00176-5
Kellis, E., and Unnithan, V. B. (1999). Co-activation of vastus lateralis and biceps femoris muscles in pubertal children and adults. Eur. J. Appl. Physiol. Occup. Physiol. 79, 504–511. doi: 10.1007/s004210050545
Kent-Braun, J. A., and Ng, A. V. (1999). Specific strength and voluntary muscle activation in young and elderly women and men. J. Appl. Physiol. 87, 22–29. doi: 10.1152/jappl.1999.87.1.22
Kubo, K., Kanehisa, H., Kawakami, Y., and Fukunaga, T. (2001a). Effects of repeated muscle contractions on the tendon structures in humans. Eur. J. Appl. Physiol. 84, 162–166. doi: 10.1007/s004210000337
Kubo, K., Kanehisa, H., Ito, M., and Fukunaga, T. (2001b). Effects of isometric training on the elasticity of human tendon structures in vivo. J. Appl. Physiol., 91, 26–32. doi: 10.1152/jappl.2001.91.1.26
Laaksonen, D. E., Nuutinen, J., Lahtinen, T., Rissanen, A., and Niskanen, L. K. (2003). Changes in abdominal subcutaneous fat water content with rapid weight loss and long-term weight maintenance in abdominally obese men and women. Int. J. Obes. Relat. Metab. Disord. 27, 677–683. doi: 10.1038/sj.ijo.0802296
Liang, G., Katz, L. D., Insogna, K. L., Carpenter, T. O., and Macica, C. M. (2009). Survey of the enthesopathy of X-linked hypophosphatemia and its characterization in Hyp mice. Calcif. Tissue Int. 85, 235–246. doi: 10.1007/s00223-009-9270-6
Macaluso, A., Nimmo, M. A., Foster, J. E., Cockburn, M., McMillan, N. C., and De Vito, G. (2002). Contractile muscle volume and agonist-antagonist coactivation account for differences in torque between young and older women. Muscle Nerve 25, 858–863. doi: 10.1002/mus.10113
Maganaris, C. N. (2001). Force-length characteristics of in vivo human skeletal muscle. Acta Physiol. Scand. 172, 279–285. doi: 10.1046/j.1365-201x.2001.00799.x
Maganaris, C. N. (2003). Tendon conditioning: artefact or property? Proc. R. Soc. Lond. B Biol. Sci. 270(Suppl. 1), S39–S42. doi: 10.1098/rsbl.2003.0004
Maganaris, C. N., Baltzopoulos, V., and Sargeant, A. J. (1998). Differences in human antagonistic ankle dorsiflexor coactivation between legs; can they explain the moment deficit in the weaker plantarflexor leg? Exp. Physiol. 83, 843–855. doi: 10.1113/expphysiol.1998.sp004164
Maganaris, C. N., and Paul, J. P. (2000). In vivo human tendinous tissue stretch upon maximum muscle force generation. J. Biomech. 33, 1453–1459. doi: 10.1016/S0021-9290(00)00099-3
Mc Auliffe, S., Mc Creesh, K., Purtill, H., and O'Sullivan, K. (2017). A systematic review of the reliability of diagnostic ultrasound imaging in measuring tendon size: is the error clinically acceptable? Phys. Ther. Sport 26, 52–63. doi: 10.1016/j.ptsp.2016.12.002
Miller, B. F., Hansen, M., Olesen, J. L., Schwarz, P., Babraj, J. A., Smith, K., et al. (2007). Tendon collagen synthesis at rest and after exercise in women. J. Appl. Physiol. 102, 541–546. doi: 10.1152/japplphysiol.00797.2006
Morse, C. I., Tolfrey, K., Thom, J. M., Vassilopoulos, V., Maganaris, C. N., and Narici, M. V. (2008). Gastrocnemius muscle specific force in boys and men. J. Appl. Physiol. 104, 469–474. doi: 10.1152/japplphysiol.00697.2007
O'Brien, T. D., Reeves, N. D., Baltzopoulos, V., Jones, D. A., and Maganaris, C. N. (2010a). Muscle-tendon structure and dimensions in adults and children. J. Anat. 216, 631–642. doi: 10.1111/j.1469-7580.2010.01218.x
O'Brien, T. D., Reeves, N. D., Baltzopoulos, V., Jones, D. A., and Maganaris, C. N. (2010b). Mechanical properties of the patellar tendon in adults and children. J. Biomech. 43, 1190–1195. doi: 10.1016/j.jbiomech.2009.11.028
Onambélé, G. L., Burgess, K., and Pearson, S. J. (2007). Gender-specific in vivo measurement of the structural and mechanical properties of the human patellar tendon. J. Orthop. Res. 25, 1635–1642. doi: 10.1002/jor.20404
Onambélé, G. L., and Degens, H. (2006). Improvements in muscle-tendon properties are beneficial to balance in multiple sclerosis. Mult. Scler. 12, 666–669. doi: 10.1177/1352458506070715
Onambélé, G. L., Maganaris, C. N., Mian, O. S., Tam, E., Rejc, E., McEwan, I. M., et al. (2008). Neuromuscular and balance responses to flywheel inertial versus weight training in older persons. J. Biomech. 41, 3133–3138. doi: 10.1016/j.jbiomech.2008.09.004
Onambélé, G. L., Narici, M. V., and Maganaris, C. N. (2006). Calf muscle-tendon properties and postural balance in old age. J. Appl. Physiol. 100, 2048–2056. doi: 10.1152/japplphysiol.01442.2005
Pearson, S. J., Burgess, K., and Onambélé, G. N. (2007). Creep and the in vivo assessment of human patellar tendon mechanical properties. Clin. Biomech. 22, 712–717. doi: 10.1016/j.clinbiomech.2007.02.006
Reeves, N. D. (2006). Adaptation of the tendon to mechanical usage. J. Musculoskelet. Neuronal Interact. 6, 174–180.
Reeves, N. D., Maganaris, C. N., and Narici, M. V. (2003b). Effect of strength training on human patella tendon mechanical properties of older individuals. J. Physiol. 548, 971–981. doi: 10.1113/jphysiol.2002.035576
Reeves, N. D., Narici, M. V., and Maganaris, C. N. (2003a). Strength training alters the viscoelastic properties of tendons in elderly humans. Muscle Nerve 28, 74–81. doi: 10.1002/mus.10392
Roberts, T. J., and Azizi, E. (2011). Flexible mechanisms: the diverse roles of biological springs in vertebrate movement. J. Exp. Biol. 214, 353–361. doi: 10.1242/jeb.038588
Seynnes, O. R., Erskine, R. M., Maganaris, C. N., Longo, S., Simoneau, E. M., Grosset, J. F., et al. (2009). Training-induced changes in structural and mechanical properties of the patellar tendon are related to muscle hypertrophy but not to strength gains. J. Appl. Physiol. 107, 523–530. doi: 10.1152/japplphysiol.00213.2009
Sims, D. T., Onambélé-Pearson, G. L., Burden, A., Payton, C., and Morse, C. I. (2017). Specific force of the vastus lateralis in adults with Achondroplasia. J. Appl. Physiol. 124, 696–703. doi: 10.1152/japplphysiol.00638.2017
Sims, D. T., Onambélé-Pearson, G. L., Burden, A., Payton, C., and Morse, C. I. (2018). The oxygen consumption and metabolic cost of walking and running in adults with Achondroplasia. Front. Physiol. 9:410. doi: 10.3389/fphys.2018.00410
Skou, S. T., and Aalkjaer, J. M. (2013). Ultrasonographic measurement of patellar tendon thickness - a study of intra-and interobserver reliability. Clin. Imaging 37, 934–937. doi: 10.1016/j.clinimag.2013.01.007
Tsaopoulos, D. E., Baltzopoulos, V., and Maganaris, C. N. (2006). Human patellar tendon moment arm length: measurement considerations and clinical implications for joint loading assessment. Clin. Biomech. 21, 657–667. doi: 10.1016/j.clinbiomech.2006.02.009
Tsaopoulos, D. E., Baltzopoulos, V., Richards, P. J., and Maganaris, C. N. (2011). Mechanical correction of dynamometer moment for the effects of segment motion during isometric knee-extension tests. J. Appl. Physiol. 111, 68–74. doi: 10.1152/japplphysiol.00821.2010
Wang, J. H. (2006). Mechanobiology of tendon. J. Biomech. 39, 1563–1582. doi: 10.1016/j.jbiomech.2005.05.011
Waugh, C. M., Korff, T., Fath, F., and Blazevich, A. J. (2014). Effects of resistance training on tendon mechanical properties and rapid force production in prepubertal children. J. Appl. Physiol. 117, 257–266. doi: 10.1152/japplphysiol.00325.2014
Keywords: Achondroplasia, patella tendon, stress, strain, Young's Modulus
Citation: Sims DT, Onambélé-Pearson GL, Burden A, Payton C and Morse CI (2018) Morphological and Mechanical Properties of the Human Patella Tendon in Adult Males With Achondroplasia. Front. Physiol. 9:867. doi: 10.3389/fphys.2018.00867
Received: 01 February 2018; Accepted: 18 June 2018;
Published: 20 July 2018.
Edited by:
Luca Paolo Ardigò, University of Verona, ItalyReviewed by:
Adamantios Arampatzis, Humboldt-Universität zu Berlin, GermanyCopyright © 2018 Sims, Onambélé-Pearson, Burden, Payton and Morse. This is an open-access article distributed under the terms of the Creative Commons Attribution License (CC BY). The use, distribution or reproduction in other forums is permitted, provided the original author(s) and the copyright owner(s) are credited and that the original publication in this journal is cited, in accordance with accepted academic practice. No use, distribution or reproduction is permitted which does not comply with these terms.
*Correspondence: David T. Sims, ZC5zaW1zQG1tdS5hYy51aw==
Disclaimer: All claims expressed in this article are solely those of the authors and do not necessarily represent those of their affiliated organizations, or those of the publisher, the editors and the reviewers. Any product that may be evaluated in this article or claim that may be made by its manufacturer is not guaranteed or endorsed by the publisher.
Research integrity at Frontiers
Learn more about the work of our research integrity team to safeguard the quality of each article we publish.