
94% of researchers rate our articles as excellent or good
Learn more about the work of our research integrity team to safeguard the quality of each article we publish.
Find out more
ORIGINAL RESEARCH article
Front. Physiol. , 27 February 2018
Sec. Systems Biology Archive
Volume 9 - 2018 | https://doi.org/10.3389/fphys.2018.00139
 Xiang Zhang1*
 Adil Mardinoglu2,3
 Leo A. B. Joosten4
 Jan A. Kuivenhoven5
 Yang Li6
 Mihai G. Netea4,7
 Albert K. Groen1,8
Immunity and cellular metabolism are tightly interconnected but it is not clear whether different pathogens elicit specific metabolic responses. To address this issue, we studied differential metabolic regulation in peripheral blood mononuclear cells (PBMCs) of healthy volunteers challenged by Candida albicans, Borrelia burgdorferi, lipopolysaccharide, and Mycobacterium tuberculosis in vitro. By integrating gene expression data of stimulated PBMCs of healthy individuals with the KEGG pathways, we identified both common and pathogen-specific regulated pathways depending on the time of incubation. At 4 h of incubation, pathogenic agents inhibited expression of genes involved in both the glycolysis and oxidative phosphorylation pathways. In contrast, at 24 h of incubation, particularly glycolysis was enhanced while genes involved in oxidative phosphorylation remained unaltered in the PBMCs. In general, differential gene expression was less pronounced at 4 h compared to 24 h of incubation. KEGG pathway analysis allowed differentiation between effects induced by Candida and bacterial stimuli. Application of genome-scale metabolic model further generated a Candida-specific set of 103 reporter metabolites (e.g., desmosterol) that might serve as biomarkers discriminating Candida-stimulated PBMCs from bacteria-stimuated PBMCs. Our analysis also identified a set of 49 metabolites that allowed discrimination between the effects of Borrelia burgdorferi, lipopolysaccharide and Mycobacterium tuberculosis. We conclude that analysis of pathogen-induced effects on PBMCs by a combination of KEGG pathways and genome-scale metabolic model provides deep insight in the metabolic changes coupled to host defense.
As the first line of host defense, the innate immune system can immediately sense and combat foreign pathogens (McGettrick and O'Neill, 2013; Mills and O'Neill, 2014). Cells of the innate immune system, such as monocytes and neutrophils recognize pathogens via pattern recognition receptors (PRRs) (McGettrick and O'Neill, 2013; Cheng et al., 2014; Mills and O'Neill, 2014). These PRRs, such as Toll-like receptors, NOD-like receptors, C-type lectin receptors, and RigI-helicases, are found on the plasma membrane of innate immune cells (McGettrick and O'Neill, 2013; Cheng et al., 2014; Mills and O'Neill, 2014). Activation of these PRRs leads to profound changes in gene expression and subsequent production of inflammatory mediators such as cytokines and chemokines (McGettrick and O'Neill, 2013; Pearce and Pearce, 2013; Cheng et al., 2014). Once innate immune cells are activated, they can trigger responses of the adaptive immune system (e.g., activate T lymphocytes) (Pearce et al., 2013; Mills and O'Neill, 2014).
Although often not realized, the responses of immune cells against pathogens are tightly linked to endogenous changes of metabolism (Mills and O'Neill, 2014). It is known that upon activation, immune cells (e.g., monocytes and T lymphocytes) dramatically shift from oxidative phosphorylation to aerobic glycolysis, in order to meet the rapidly increasing energy demand by processes such as cytokine production and cell proliferation (McGettrick and O'Neill, 2013; Pearce and Pearce, 2013; Pearce et al., 2013; Cheng et al., 2014). In addition, immune cells also increase the activity of the pentose phosphate pathway to provide sufficient nucleotide precursors for accelerated cell proliferation (e.g., T lymphocytes) (Pearce et al., 2013; Mills and O'Neill, 2014). Also, in lipopolysaccharide (LPS) challenged macrophages, succinate and citrate accumulate to regulate production of IL-1 β (Tannahill et al., 2013). Thus far, however, metabolism of activated immune cells has been mainly investigated after challenges with LPS, which only activates Toll-like receptor 4 (Bordbar et al., 2012; McGettrick and O'Neill, 2013; Tannahill et al., 2013). A recent study on the modulation of glycolysis and oxidative phosphorylation in immune cells stimulated with LPS and other TLR stimuli supported the concept that different stimuli may induce various metabolic programs in immune cells (Lachmandas et al., 2016).
To our knowledge, a comprehensive understanding of the metabolism of immune cells after stimulation of various PRRs (e.g., TLRs, NOD-like receptors—NLRs, C-type lectin receptors—CLRs, and RigI-helicases) has not yet been reported. In the current study, we interrogate which metabolic pathways and metabolites are altered upon activation by various pathogens. To this end, we systematically measured gene expression profiles in human peripheral blood mononuclear cells (PBMCs) stimulated by heat inactivated Candida albicans (Candida), Borrelia burgdorferi (Borrelia), Escherichia coli-derived LPS, and Mycobacterium tuberculosis (MTB). These four are typical stimuli of innate immune pathways. LPS is the prototypical stimulus recognized by TLR 4 (Ngkelo et al., 2012). Candida is recognized by TLRs and CLRs, and causes mucosal and systematic infection in immunocompromised individuals (Mayer et al., 2013). Borrelia is recognized by TLRs, NLRs, CLRs, and RigI-helicases and causes Lyme disease (Oosting et al., 2016). MTB is recognized by TLRs, NLRs, and CLRs and causes tuberculosis (Kleinnijenhuis et al., 2011).
To identify gene expression changes involved in metabolism, we ran Kyoto Encyclopedia of Genes and Genomes (KEGG) based metabolic pathway analysis and genome-scale metabolic model (GEM) based reporter metabolite analysis, respectively. KEGG pathway analyses are widely and successfully used in biomedical research over the last decade as a routine step of interpreting gene expression data (Kanehisa et al., 2012). As an alternative, genome scale metabolic models (GEMs) are increasingly used to interpret large-scale gene expression data sets. GEMs are represented by networks in which the nodes are metabolites and the connecting edges are metabolic reactions (Mardinoglu et al., 2013b; Bordbar et al., 2014). Generic human GEMs, such as Recon2 (Thiele et al., 2013) and HMR2 (Mardinoglu et al., 2014) represent our current knowledge of all established metabolic reactions involved in human energy metabolism and macromolecule biosynthesis. GEMs have mostly been used to identify key enzymes and metabolites that may serve as potential biomarkers and drug targets for non-alcoholic fatty liver disease, obesity, Alzheimer's disease, and cancer (Lewis et al., 2010; Mardinoglu et al., 2013a, 2014; Agren et al., 2014; Yizhak et al., 2014). Our analysis showed that KEGG pathway analysis allowed differentiation between effects induced by Candida and bacterial stimuli, and application of genome-scale metabolic model further generated a Candida-specific set of 103 reporter metabolites that might serve as biomarkers discriminating Candida-stimulated PBMCs from bacteria-stimulated PBMCs.
As described in the previous study (Smeekens et al., 2013), blood was collected after written informed consent from healthy volunteers. The study was approved by the Institutional Review Boards at Radboud University Nijmegen Medical Centre (RUNMC, Nijmegen, The Netherlands). The study was performed in accordance with the declaration of Helsinki. After informed consent was given, blood was collected by venipuncture into 10 ml EDTA syringes (Monoject, s-Hertogenbosch, The Netherlands).
As reported in in the previous study (Smeekens et al., 2013), we isolated PBMCs from healthy subjects by density centrifugation and stimulated them with heat-killed C. albicans(UC 820) (1 × 10⁶ per ml), heat-killed B. burgdorferi, E. coli-derived LPS (10 ng per ml), or heat-killed MTB (1 μg per ml), respectively for 4 or 24 h. PBMCs that were cultured in only RPMI medium were used as controls. Illumina Human HT-12 Expression BeadChips were used to measure gene expression levels at 4 and 24 h. Details about the experiment and processed data are available in GSE42606 archived by Gene Expression Omnibus.
The raw gene expression data were preprocessed by using the lumi R package with default settings, which includes background correction, variance stabilizing transformation and quantile normalization (Lin et al., 2008). Principal component analysis was performed with the full gene expression data set by using the function prcomp in R. Valid paired samples were selected to perform differential expression analysis at 4 and 24 h separately. At 4 h, the size of paired samples for each stimulation were 19 (Candida), 25 (Borrelia), 19 (LPS), and 18 (MTB). At 24 h, the size of paired samples were 29 (Candida), 29 (Borrelia), 20 (LPS), and N = 30 (MTB). Illumina probe IDs were mapped to Ensembl gene IDs (Ensembl version 73) or Entrez gene IDs by using the lumiHumanIDMapping and biomaRt R packages (Durinck et al., 2009; Du et al., 2016). To exclude the influence of ambiguous probes (a probe ID corresponding to two or more gene IDs), only the probes that have unique gene IDs were used for differential gene expression analysis. Moreover, the hidden batch effect originated from microarray analysis were adjusted by applying surrogate variable analysis which is built in the sva R package (Leek and Storey, 2007, 2008; Leek et al., 2012). Gene expression levels of stimulated PBMCs were then compared to controls by using linear models and empirical Bayes statistics (Smyth, 2004). Both methods were implemented in the limma R package (Ritchie et al., 2015). Significance inference of differential expression was done with moderated t test (Ritchie et al., 2015) and the Benjamini-Hochberg procedure (Benjamini and Hochberg, 1995) was performed to calculate False Discovery Rate (FDR). In cases when a gene has multiple probes on the chip, the probe-level statistical test results were aggregated into a single gene-level statistic based on the smallest FDR.
In this study, the KEGG pathways and the generic human genome-scale metabolic model, HMR2 were used to analyze the gene expression data of human PBMCs stimulated by different pathogenic agents for 4 or 24 h. The KEGG pathway information was downloaded from the Molecular Signature Database v5.1 (Subramanian et al., 2005). There are in total 186 pathways and the related gene identifiers are Entrez gene IDs. Here we focused on 68 metabolic pathways since this study aims to identify metabolic signatures of stimulated human PBMCs. The HMR2 (SBML format) was downloaded from Human Metabolic Atlas (Pornputtapong et al., 2015). HMR2 contains 3,765 genes, 6,007 metabolites, and 8,181 reactions (Mardinoglu et al., 2014). Essentially, KEGG pathway analysis and reporter metabolite analysis are two gene set enrichment analysis methods. The difference between them is that KEGG pathway analysis uses protein constituted pathways to group genes, whereas reporter metabolite analysis uses metabolites to define gene sets. Since every metabolite serves as a gene set in reporter metabolite analysis, the information of which genes belonged to which metabolite was attained through using the piano R package (Väremo et al., 2013). The gene identifiers in HMR2 were annotated by Ensemble gene IDs (version 73). When KEGG pathways were used as gene sets, we computed average t statistics of pathways as the summary statistics:
This simple approach was first introduced by Irizarry et al. (2009). Zpathway is the summary statistic of a pathway. Npathway is the number of genes in the pathway and ti is the modified t statistics of gene i in the pathway. When metabolites of HMR2 were translated to gene sets, the original reporter metabolite algorithm (Patil and Nielsen, 2005) was adapted to calculate summary statistics for metabolites. Patil and Nielsen (2005) defined reporter metabolites of which the expression levels were significantly changed. In the original reporter metabolite algorithm (Patil and Nielsen, 2005), the gene-level P-values were first converted to Z scores by using the inverse normal cumulative distribution. Then an aggregated Z score (gene set summary statistic) was calculated for each metabolite from the gene-level Z scores of its associated genes. Here we calculated summary statistics for metabolites directly with the gene-level modified t statistics:
Zmetabolite is the summary statistics of a metabolite, and ti is the t statistics of gene i associated with the metabolite. Nmetabolite is the number of genes associated with the metabolite.
Regarding statistical inference, we calculated a P-value for each gene set based on its background distribution of summary statistics. However, unlike the original reporter metabolite algorithm (Patil and Nielsen, 2005), which derived background distributions by randomly sampling genes from the GEM, we applied sample permutations to derive such background distributions. Comparing gene/sample permutations is out of the scope of this manuscript. Goeman and Bühlmann (2007) extensively discussed this topic previously. The sample labels (stimulated or control) were randomly shuffled within each pair of samples (PBMCs derived from the same donor). As the next step, we repeated the same procedures as described previously to recalculate the gene-level as well as the summary statistics. In total, we performed such permutations 10,000 times for each stimulation case. The resulted permutation Z scores were used to represent the enrichment:
Z is the summary statistic of a gene set (either Zpathway or Zmetabolite). Znull refer to the summary statistics of that gene set based on the sample permutations.
Permutation P-values were then calculated by using the function permp in the statmod R package. The algorithm underlying the permp function was developed by Phipson and Smyth (2010). Since we tested a number of pathways or metabolites simultaneously, we performed the Benjamini-Hochberg procedure (Benjamini and Hochberg, 1995) to derive the FDR. When a metabolite had a FDR value below 0.05, we defined that particular metabolite as a reporter metabolite.
We were interested in metabolic pathways and metabolites that can discriminate Candida-stimulated PBMCs from Borrelia, LPS, and MTB-stimulated PBMCs. We were also interested in metabolic pathways and metabolites that can discriminate Borrelia, LPS, and MTB-stimulated PBMCs. To this end, we first compared gene set enrichment results across PBMCs stimulated by Candida, Borrelia, LPS, and MTB after treatment at 4 and 24 h. We compared the 4-h gene expression profile of PBMCs stimulated by Candida, Borrelia, LPS, and MTB to the paired RPMI-treated PBMCs. We did the same regarding the 24-h gene expression profile. When a pathway or a metabolite had a FDR value below 0.05 and a positive enrichment score, we labeled its transcriptional regulation as “Up.” When a pathway or a metabolite had a FDR value below 0.05 and a negative enrichment score, we marked its transcriptional regulation as “Down.” The remaining pathways and metabolites were then denoted as “N.S.,” meaning no significant transcriptional changes. In the following analysis, comparisons of pathways or metabolites in PBMCs stimulated by various pathogens were done based on their “Up,” “Down,” and “N.S.” patterns. The euclidean distance was calculated to quantify similarity between two metabolic pathway gene expression patterns. The ggdendro R package was used to produce the dendrogram and the cmdscale function of the stat R package was used to produce the multidimensional scaling plot. To identify metabolic pathways and metabolites that were differentially regulated in a specific bacterial stimulation at both 4 and 24 h, we also compared gene set enrichment results across PBMCs stimulated by Borrelia, LPS, and MTB. Considering difficulty of interpretation, HMR2 subsystems (equivalent to pathways), including “Isolated,” “Artificial reactions,” “Exchange reactions,” “Pool reactions,” “Miscellaneous,” “Other amino acid,” and “Blood group biosynthesis” were not included in the analysis. To simplify data visualization, all the transport subsystems were not included as well. If a metabolite could be mapped to multiple subsystems, all the subsystems were included in the final results.
To evaluate whether pathogen-specific metabolism corresponded to a specific immune response, we focused on innate immunity genes provided by the database innateDB (Breuer et al., 2013). According to the innateDB, there are 1,057 innate immune genes in human. Our microarray platform measured 850 of these innate immune genes. Similar to the procedures in pathway analysis, when an innate immune gene had a FDR value below 0.05 and a positive t statistic, we labeled its transcriptional regulation as “Up.” When an innate immune gene had a FDR value below 0.05 and a negative t statistic, we marked its transcriptional regulation as “Down.” The remaining innate immune genes were then denoted as “N.S.,” meaning no significant transcriptional changes. Again we performed the multidimensional scaling analysis.
Depending on the duration and type of pathogenic stimulant, gene expression patterns of human PBMCs varied considerably. Along the axis of the first principal component, a clear separation of 4 and 24 h gene expression patterns was observed (Figure 1). To identify differentially regulated metabolic pathways in human PBMCs stimulated by heat-killed Candida, heat-killed Borrelia, LPS, and heat-killed MTB, we ran gene set enrichment analysis with KEGG metabolic pathways. In general, we observed more down than up-regulated metabolic pathways in stimulated PBMCs at 4 h. However, this was reversed at 24 h (Figure 2). Hierarchical cluster analysis revealed that metabolic pathway regulations were very different between 4 and 24 h irrespective of the stimuli used (Figure 3). Multidimensional scaling analysis confirmed the result of hierarchical clustering analysis. Furthermore, we observed that the clustering result based on metabolic pathways was consistent with the clustering outcome based on innate immunity genes at 24 h after stimulation (Figure 4).
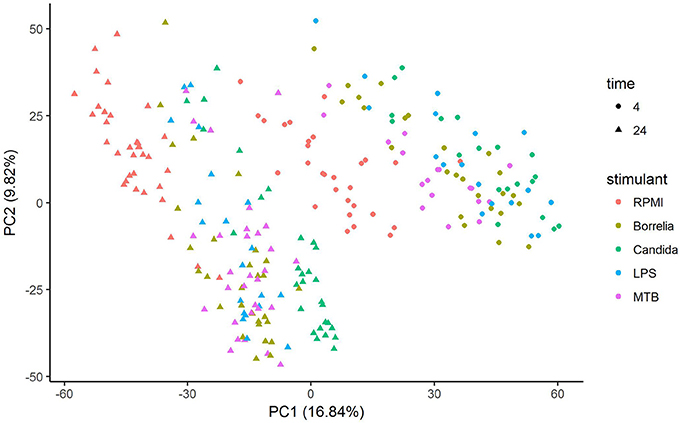
Figure 1. Principal component analysis of gene expression of human PBMCs stimulated by Candida, Borrelia, LPS and MTB for 4 and 24 h.
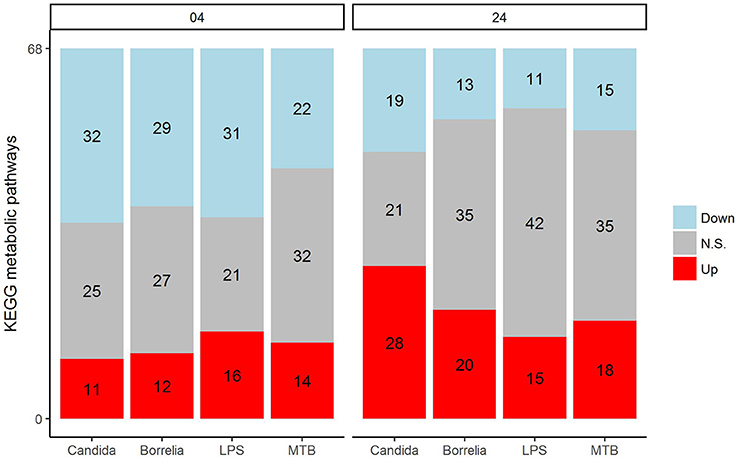
Figure 2. Distribution of significantly up-regulated (red), down-regulated (blue), and not significantly changed (gray) pathways in 68 KEGG metabolic pathways for Candida, Borrelia, LPS, and MTB-stimulated human PBMCs at 4 and 24 h. Any metabolic pathway is significantly changed if its FDR < 0.05.
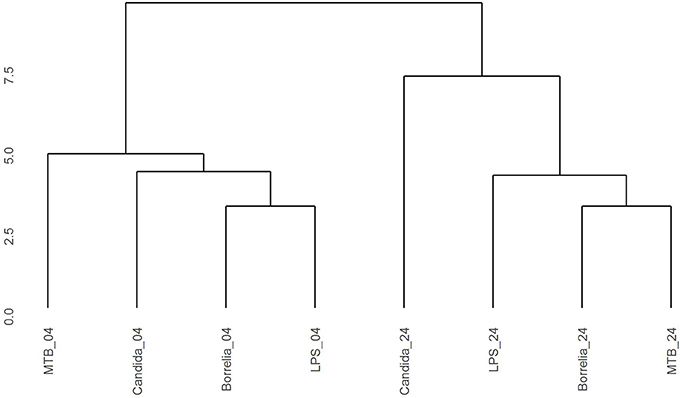
Figure 3. Hierarchical clustering gene expression pattern in KEGG metabolic pathways derived from human PBMCs stimulated by Candida, Borrelia, LPS, and MTB at 4 and 24 h. Euclidean distance is calculated to quantify similarity between two metabolic pathway gene expression pattern.
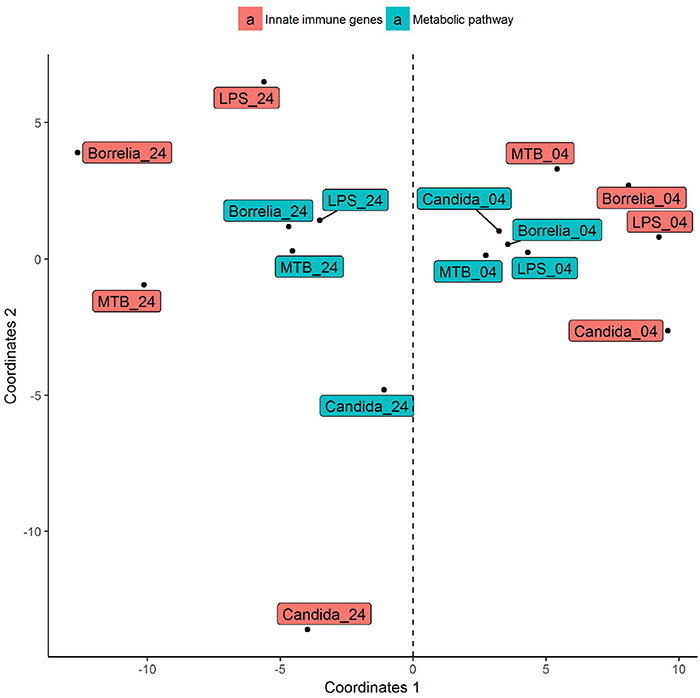
Figure 4. Multidimensional scaling of differential expression patterns of human PBMCs stimulated by Candida, Borrelia, LPS, and MTB at 4 and 24 h. Differential expression patterns were derived from genes involved in KEGG metabolic pathways and innate immunity. Euclidean distance is calculated to quantify similarity between two metabolic pathway gene expression pattern.
At 4 h after stimulation, glycolysis pathway was down-regulated in Candida (Enrichment score = −5.88, FDR = 2.41 × 10⁻⁴), Borrelia (Enrichment score = −5.96, FDR = 3.09 × 10⁻⁴), LPS (Enrichment score = −5.83, FDR = 3.21 × 10⁻⁴), and MTB-stimulated (Enrichment score = −4.17. FDR = 0.0013) PBMCs. Oxidative phosphorylation pathway was also down-regulated in Candida (Enrichment score = −4.90, FDR = 2.41 × 10⁻⁴), Borrelia (Enrichment score = −4.60, FDR = 3.09 × 10⁻⁴), LPS (Enrichment score = −5.21, FDR = 3.21 × 10⁻⁴), and MTB-stimulated (Enrichment score = −3.82. FDR = 0.0013) PBMCs. At 24 h after stimulation, glycolysis pathway was up-regulated in Candida (Enrichment score = 4.33, FDR = 2.12 × 10⁻⁴), Borrelia (Enrichment score = 7.52, FDR = 3.09 × 10⁻⁴), LPS (Enrichment score = 2.99, FDR = 0.0019), and MTB-stimulated (Enrichment score = 7.51, FDR = 4.25 × 10⁻⁴) PBMCs. However, oxidative phosphorylation was not significantly changed in PBMCs stimulated by Candida, Borrelia, LPS, and MTB.
We focused on metabolic pathways that had the same transcriptional patterns in PBMCs stimulated by Borrelia, LPS, and MTB, but differed from Candida-stimulated PBMCs at both 4 and 24 h. The detail statistics for pathways were provided in the Supplementary Table 1. The pentose phosphate pathway was down-regulated in Borrelia, LPS, and MTB-stimulated PBMCs, but not in Candida-stimulated PBMCs at 4 h (Figure 5). However, at 24 h, the pentose phosphate pathway was up-regulated in Candida-stimulated PBMCs, but had no significant change in Borrelia, LPS, and MTB-stimulated PBMCs (Figure 5). Riboflavin, beta alanine and histidine metabolism were differentially regulated in Candida-stimulated PBMCs, but not significantly changed in Borrelia, LPS and MTB-stimulated PBMCs at both 4 and 24 h (Figure 5). Aminoacyl tRNA biosynthesis was up-regulated in Borrelia, LPS and MTB-stimulated PBMCs but not significantly changed in Candida-stimulated PBMCs at 4 h. However, this pathway was up-regulated in Candida-stimulated PBMCs but down-regulated in Borrelia, LPS, and MTB-stimulated PBMCs at 24 h (Figure 5).
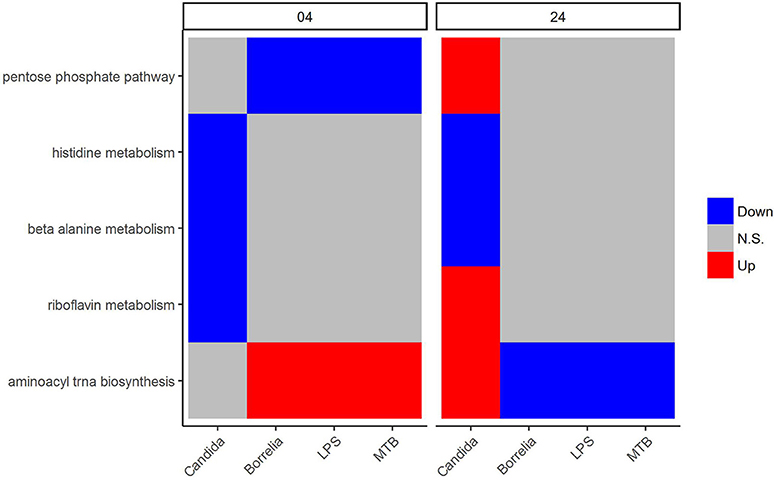
Figure 5. KEGG metabolic pathways that discriminated Candida-stimulated PBMCs from Borrelia, LPS, and MTB-stimulated human PBMCs. Blue refers to significantly down regulation. Red refers to significantly up regulation. Gray means not significantly changed. A pathway is significantly changed if its FDR < 0.05.
Regarding the metabolic pathways that discriminated Borrelia, LPS and MTB-stimulated PBMCs, we observed that glycosylphosphatidylinositol GPI anchor biosynthesis was up-regulated in LPS-stimulated PBMCs but did not change in Borrelia and MTB-stimulated PBMCs at 4 h. However, at 24 h, this pathway was down-regulated in Borrelia and MTB-stimulated PBMCs whereas it remained unchanged in LPS-stimulated PBMCs (Figure 6). Similarly, fatty acid metabolism and glycerolipid metabolism were down-regulated in LPS-stimulated PBMCs but not in Borrelia and MTB-stimulated PBMCs at 4 h. This pathway was up-regulated in Borrelia and MTB-stimulated PBMCs but did not change in LPS-stimulated PBMCs at 24 h (Figure 6). Tryptophan metabolism was differentially regulated in MTB-stimulated PBMCs, but not significantly changed in Borrelia and LPS-stimulated PBMCs at both 4 and 24 h (Figure 6). We did not identify a metabolic pathway that can discriminate Borrelia-stimulated PBMCs from LPS and MTB-stimulated PBMCs.
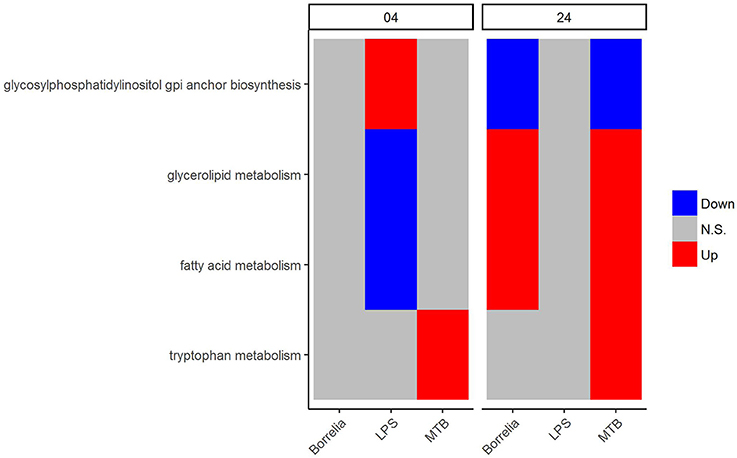
Figure 6. KEGG metabolic pathways that discriminated between Borrelia, LPS, and MTB-stimulated human PBMCs. Blue refers to significantly down regulation. Red refers to significantly up regulation. Gray means not significantly changed. A pathway is significantly changed if its FDR < 0.05.
In an attempt to identify metabolites that discriminated PBMCs with various stimuli, we ran reporter metabolite analysis with the human genome-scale metabolic model, HMR2. A total number of 4,548 metabolites were involved in the reporter metabolite analysis. We observed more down-regulated than up-regulated reporter metabolites in the stimulated PBMCs at 4 h. However, this pattern was reversed at 24 h (Figure 7). In a next step, we focused on reporter metabolites that were differentially regulated in Candida-stimulated PBMCs but not in PBMCs with bacterial stimuli at both 4 and 24 h. Among the identified reporter metabolites at 4 and 24 h, 103 of them were found specific for Candida-stimulated PBMCs. These 103 Candida-specific reporter metabolites participated in 45 pathways including nucleotide metabolism (15 reporter metabolites), and fatty acid biosynthesis (10 reporter metabolites; Figure 8). We also focused on reporter metabolites that can discriminate between Borrelia, LPS and MTB-stimulated PBMCs at both 4 and 24 h. We identified 32, 7, and 10 reporter metabolites that were specific for Borrelia, LPS and MTB-stimulated PBMCs, respectively (Figure 9). Statistics of all the pathogen-specific reporter metabolites were provided in Supplementary Table 2.
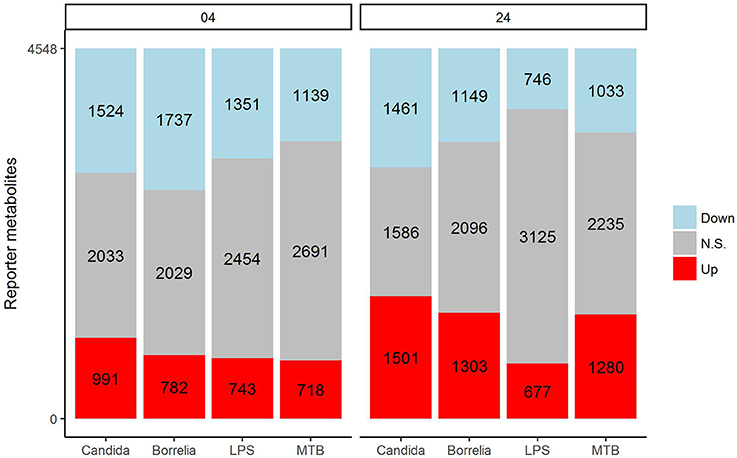
Figure 7. Distribution of significantly up-regulated (red), down-regulated (blue), and not significantly changed (gray) reporter metabolites for Candida, Borrelia, LPS, and MTB-stimulated human PBMCs at 4 and 24 h. When a reporter metabolite has FDR < 0.05, it is significant.
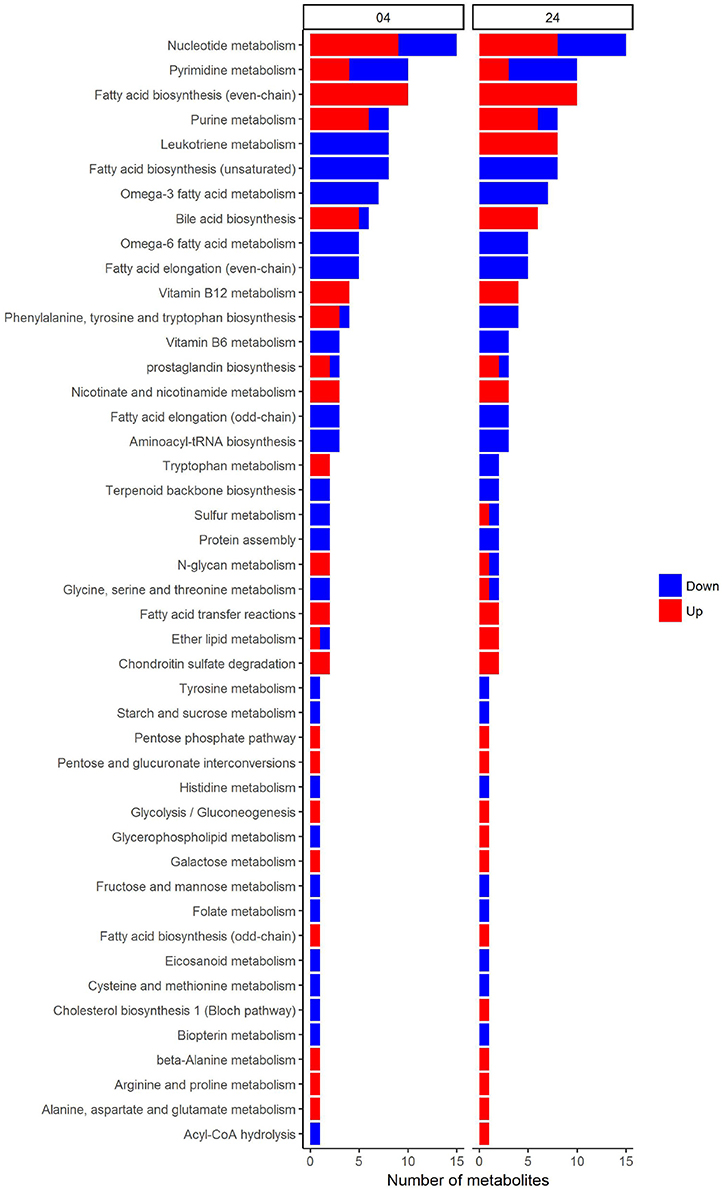
Figure 8. Reporter metabolites that discriminate Candida-stimulated PBMCs from Borrelia, LPS, and MTB-stimulated PBMCs at 4 and 24 h. These reporter metabolites were grouped based on their associated subsystems in HMR2. Blue denotes significant down-regulation. Red denotes significant up-regulation.
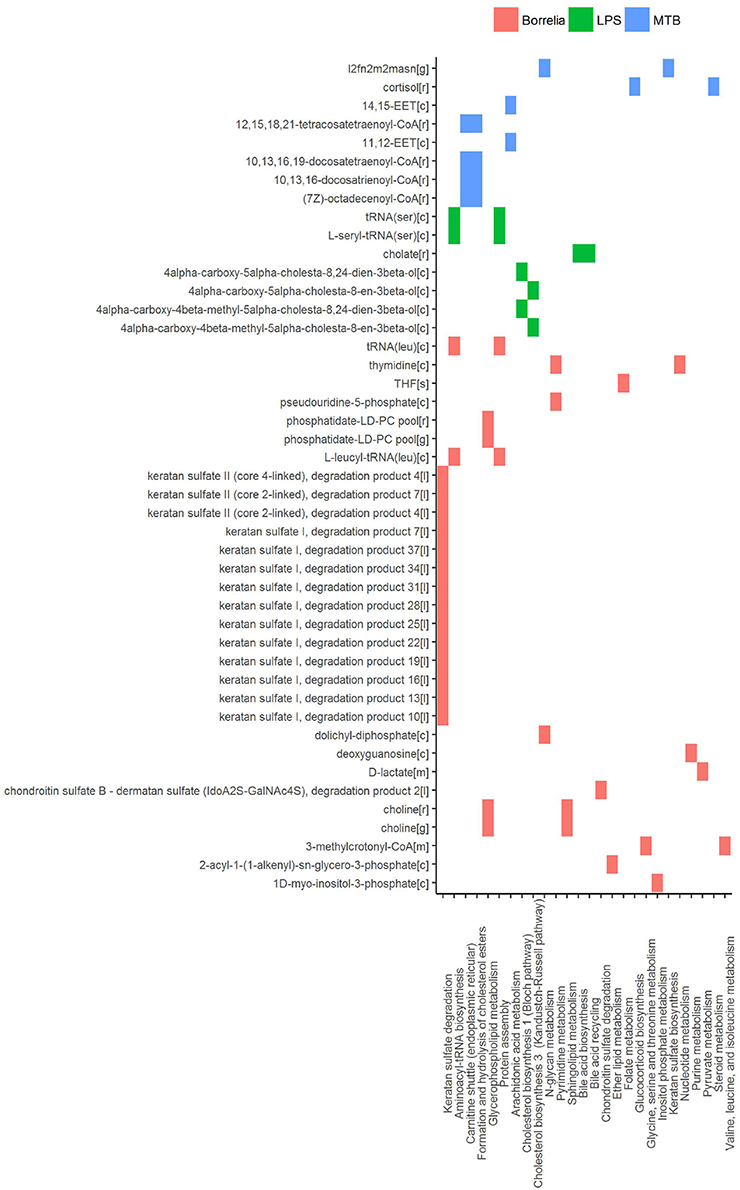
Figure 9. Reporter metabolites that discriminated Borrelia, LPS, and MTB-stimulated PBMCs at 4 and 24 h. Associated subsystems of these reporter metabolites are identified in HMR2.
The main finding of our study is that characterization of pathogen-dependent metabolic reprogramming in immune cells treated by various stimuli of innate immune pathway. For this purpose, we performed gene set enrichment analysis on gene expression data of human PBMCs treated with heat-killed Candida, heat-killed Borrelia, E. coli-derived LPS and heat-killed MTB. Either KEGG metabolic pathways or metabolites in human genome-scale metabolic models were used as gene sets. Our particular experimental setup with one fungal pathogen (Candida) and three bacterial inflammatory stimuli (Borrelia, LPS, and MTB) allowed us to identify metabolic signatures of Candida-induced host response, but also host response differences between bacterial challenges.
A very strong temporal effect on the expression of metabolic genes was observed. This observation is in line with the concept that stimulation period is a critical factor in immune response (Nagy and Haschemi, 2015; Hotamisligil, 2017). At 4 h after stimulation, both oxidative phosphorylation and glycolysis were down-regulated. At 24 h, however, gene expression of glycolysis showed up-regulation, whereas gene expression of oxidative phosphorylation remained unaltered in PBMCs. The observation of down-regulation of glycolysis genes after 4 h of stimulation is novel, and its impact for cell function warrants future studies. However, the observation at 24 h is consistent with literature data showing that activated immune cells shift toward glycolysis and away from oxidative phosphorylation (McGettrick and O'Neill, 2013; Pearce and Pearce, 2013; Pearce et al., 2013; Cheng et al., 2014).
For the purpose of identifying pathogen-dependent metabolic reprogramming in immune cells, we focused on metabolic pathways and metabolites that allow discrimination between various stimuli at both 4 and 24 h.
Five pathways, i.e., the pentose phosphate pathway, histidine metabolism, beta alanine metabolism, riboflavin metabolism, and aminoacyl tRNA biosynthesis, were identified to discriminate Candida-stimulated PBMCs from Borrelia, LPS, and MTB-stimulated PBMCs. Interestingly, we observed that the pentose phosphate pathway was differentially regulated in PBMCs stimulated by Borrelia, LPS, and MTB but not in Candida-stimulated PBMCs at 4 h. In contrast, at 24 h, this pathway was differentially regulated only in Candida-stimulated PBMCs but not significantly changed in Borrelia, LPS, and MTB-stimulated PBMCs. The pentose phosphate pathway was reported to support cytokine secretion in dendritic cells (Everts et al., 2014). Since cytokine production of human PBMCs depends on the type of stimulus (Henderson and Rippin, 1995), our observation of differential regulation in the pentose phosphate pathway likely indicates a specific function for Candida stimulated cytokine production. Indeed, our findings corroborate those of a recent study in which Candida-stimulated PBMCs were identified to have different cytokine profiles from bacteria-stimulated PBMCs (Li et al., 2016). On the other hand, little is known about the specific roles of the other four Candida-specific metabolic pathways in regulation of the immune response, and further investigation is warranted to validate these novel findings.
We further noted that three pathways (glycosylphosphatidylinositol GPI anchor biosynthesis, glycerolipid metabolism, fatty acid metabolism) discriminated LPS-stimulated PBMCs from Borrelia and MTB-stimulated PBMCs. Meanwhile, tryptophan metabolism differentiates MTB-stimulated PBMCs from Borrelia and LPS-stimulated PBMCs. We failed to identify pathways that allow discrimination Borrelia-stimulated PBMCs from LPS and MTB-stimulated PBMCs. Activation of tryptophan metabolism was previously reported in human marcophages in vitro upon MTB stimulation (Blumenthal et al., 2012), and a recent study (van Laarhoven et al., 2018) has identified a crucial role of tryptophan metabolism for the pathophysiology of tuberculous meningitis. In addition, enhancement of tryptophan catabolism is an IFN (interferon) γ-induced immune response in many different host cell types, and has been postulated to reduce the supply of tryptophan to bacterial pathogens (Moffett and Namboodiri, 2003; O'Neill et al., 2016). A reduced supply of tryptophan is linked to suppress T cell proliferation (Munn et al., 1999). Our observation of differential regulation of tryptophan in MTB-stimulated PBMCs might be related to different T cell proliferation after stimulation of MTB, compared to Borrelia and LPS.
The KEGG pathway based analysis failed to identify metabolic pathways that discriminate Borrelia-stimulated PBMCs from LPS- and MTB-stimulated PBMCs. To explore potential differences in more depth, we ran the reporter metabolite analysis, which is a gene set enrichment analysis with a genome-scale metabolic model. A genome-scale metabolic model is comprised of metabolites and reactions between them. Compared to KEGG metabolic pathway information, the genome-scale metabolic model makes use of detailed information on biochemical reactions of pathways. For instance, for any enzyme catalyzing reaction, we can retrieve the genes encoding that enzyme in the genome-scale metabolic model. Moreover, metabolites can be products of some reactions and meanwhile act as substrates in other reactions. Consequently, reporter metabolite analysis based on genome-scale metabolic model does not repeat but complement results from KEGG pathway analysis. We used HMR2 in our analysis since we did not perform flux balance analysis.
In this study, we identified 103 reporter metabolites that were differentially regulated in Candida-stimulated PBMCs, but not in PBMCs stimulated with bacterial stimuli at both 4 and 24 h. A considerable number of these Candida-specific reporter metabolites were found to be related to lipid metabolism. The previous study (Smeekens et al., 2013) reported that Candida induced a type I IFN response that was distinct from Borrelia, LPS, and MTB stimulation. Interestingly, type I IFN was identified to influence de novo cholesterol biosynthesis and fatty acids biosynthesis in murine marcophages (York et al., 2015). Desmosterol, one of the Candida-specific reporter metabolites, is the last intermediary metabolite in the Bloch pathway of cholesterol biosynthesis. This metabolite was previously reported to coordinate cholesterol and fatty acid homeostasis, and affect anti-inflammatory function in macrophage (Spann et al., 2012). Taken together, we proposed that desmosterol might serve as a metabolic read out of the type I IFN response in Candida-stimulated PBMCs.
In PBMCs stimulated by Borrelia, LPS, and MTB, 49 metabolites were identified to discriminate different kinds of pathogenic challenges. Within LPS-specific reporter metabolites, we observed intermediate metabolites present in the Bloch pathway and Kandutsch-Russell pathway (e.g., 4α-carboxy-5α-cholesta-8,24-dien-3β-ol). With mass spectrometry and isotope labeling techniques, (Mitsche et al., 2015) previously showed that different tissues or cell types were characterized by different flux distributions in the Bloch and Kandutsch-Russell pathway. Our observation indicates that there also might be condition-specific flux distribution in these two parallel cholesterol biosynthesis pathways. Within MTB-specific reporter metabolites, we observed two kind of epoxyeicosatrienoic acids, synthesized from arachidonic acid. Epoxyeicosatrienoic acids were reported to inhibit inflammatory gene expression in immune cells and animal models (Thomson et al., 2012).
In summary, by integrating gene expression data with KEGG metabolic pathways in combination with the human genome-scale metabolic model, a very sensitive method to characterize metabolic reprogramming in immune cells is obtained. Applying this methodology, we were able to discriminate metabolic pathways and metabolites in human PBMCs stimulated by Candida, Borrelia, LPS, and MTB. For instance, in the case of Candida we identified five differentially regulated pathways spanning metabolic regions from the pentose phosphate pathway to aminoacyl tRNA biosynthesis. Our analysis here, for the first time, provides insight into pathogen-specific metabolism which affects stimulus-dependent signal transduction and cytokine production in stimulated human PBMCs.
XZ: Did the analysis and wrote the manuscript; LJ: Recruited the participants and performed stimulation experiment; AM, JK, YL, MN, and AG: Helped with manuscript writing.
This work was supported by grants CVON-Genius (CVON2011-19) and RESOLVE (FP7 305707).
The authors declare that the research was conducted in the absence of any commercial or financial relationships that could be construed as a potential conflict of interest.
The Supplementary Material for this article can be found online at: https://www.frontiersin.org/articles/10.3389/fphys.2018.00139/full#supplementary-material
Agren, R., Mardinoglu, A., Asplund, A., Kampf, C., Uhlen, M., and Nielsen, J. (2014). Identification of anticancer drugs for hepatocellular carcinoma through personalized genome-scale metabolic modeling. Mol. Syst. Biol. 10:721. doi: 10.1002/msb.145122
Benjamini, Y., and Hochberg, Y. (1995). Controlling the false discovery rate: a practical and powerful approach to multiple testing. J. R. Stat. Soc. Ser. B 57, 289–300.
Blumenthal, A., Nagalingam, G., Huch, J. H., Walker, L., Guillemin, G. J., Smythe, G. A., et al. (2012). M. tuberculosis induces potent activation of IDO-1, but this is not essential for the immunological control of infection. PLoS ONE 7:e37314. doi: 10.1371/journal.pone.0037314
Bordbar, A., Mo, M. L., Nakayasu, E. S., Schrimpe-Rutledge, A. C., Kim, Y.-M., Metz, T. O., et al. (2012). Model-driven multi-omic data analysis elucidates metabolic immunomodulators of macrophage activation. Mol. Syst. Biol. 8:558. doi: 10.1038/msb.2012.21
Bordbar, A., Monk, J. M., King, Z. A., and Palsson, B. O. (2014). Constraint-based models predict metabolic and associated cellular functions. Nat. Rev. Genet. 15, 107–120. doi: 10.1038/nrg3643
Breuer, K., Foroushani, A. K., Laird, M. R., Chen, C., Sribnaia, A., Lo, R., et al. (2013). InnateDB: systems biology of innate immunity and beyond–recent updates and continuing curation. Nucleic Acids Res. 41, D1228–D1233. doi: 10.1093/nar/gks1147
Cheng, S.-C., Joosten, L. A. B., and Netea, M. G. (2014). The interplay between central metabolism and innate immune responses. Cytokine Growth Factor Rev. 25, 707–713. doi: 10.1016/j.cytogfr.2014.06.008
Du, P., Feng, G., Kibbe, W., and Lin, S. (2016). lumiHumanIDMapping: Illumina Identifier Mapping for Human.
Durinck, S., Spellman, P. T., Birney, E., and Huber, W. (2009). Mapping identifiers for the integration of genomic datasets with the R/Bioconductor package biomaRt. Nat. Protoc. 4, 1184–1191. doi: 10.1038/nprot.2009.97
Everts, B., Amiel, E., Huang, S. C.-C., Smith, A. M., Chang, C.-H., Lam, W. Y., et al. (2014). Tlr-driven early glycolytic reprogramming via the kinases tbk1-ikkϵ supports the anabolic demands of dendritic cell activation. Nat. Immunol. 15, 323–332. doi: 10.1038/ni.2833
Goeman, J. J., and Bühlmann, P. (2007). Analyzing gene expression data in terms of gene sets: methodological issues. Bioinformatics 23, 980–987. doi: 10.1093/bioinformatics/btm051
Henderson, D. C., and Rippin, J. J. (1995). Stimulus-dependent production of cytokines and pterins by peripheral blood mononuclear cells. Immunol. Lett. 45, 29–34.
Hotamisligil, G. S. (2017). Inflammation, metaflammation and immunometabolic disorders. Nature 542, 177–185. doi: 10.1038/nature21363
Irizarry, R. A., Wang, C., Zhou, Y., and Speed, T. P. (2009). Gene set enrichment analysis made simple. Stat. Methods Med. Res. 18, 565–575. doi: 10.1177/0962280209351908
Kanehisa, M., Goto, S., Sato, Y., Furumichi, M., and Tanabe, M. (2012). KEGG for integration and interpretation of large-scale molecular data sets. Nucleic Acids Res. 40, D109–D114. doi: 10.1093/nar/gkr988
Kleinnijenhuis, J., Oosting, M., Joosten, L. A. B., Netea, M. G., and Van Crevel, R. (2011). Innate immune recognition of Mycobacterium tuberculosis. Clin. Dev. Immunol. 2011:405310. doi: 10.1155/2011/405310
Lachmandas, E., Boutens, L., Ratter, J. M., Hijmans, A., Hooiveld, G. J., Joosten, L. A., et al. (2016). Microbial stimulation of different toll-like receptor signalling pathways induces diverse metabolic programmes in human monocytes. Nat. Microbiol. 2:16246. doi: 10.1038/nmicrobiol.2016.246
Leek, J. T., Johnson, W. E., Parker, H. S., Jaffe, A. E., and Storey, J. D. (2012). The sva package for removing batch effects and other unwanted variation in high-throughput experiments. Bioinformatics 28, 882–883. doi: 10.1093/bioinformatics/bts034
Leek, J. T., and Storey, J. D. (2007). Capturing heterogeneity in gene expression studies by surrogate variable analysis. PLoS Genet. 3:e161. doi: 10.1371/journal.pgen.0030161
Leek, J. T., and Storey, J. D. (2008). A general framework for multiple testing dependence. Proc. Natl. Acad. Sci. U.S.A. 105, 18718–18723. doi: 10.1073/pnas.0808709105
Lewis, N. E., Schramm, G., Bordbar, A., Schellenberger, J., Andersen, M. P., Cheng, J. K., et al. (2010). Large-scale in silico modeling of metabolic interactions between cell types in the human brain. Nat. Biotechnol. 28, 1279–1285. doi: 10.1038/nbt.1711
Li, Y., Oosting, M., Deelen, P., Ricaño-Ponce, I., Smeekens, S., Jaeger, M., et al. (2016). Inter-individual variability and genetic influences on cytokine responses to bacteria and fungi. Nat. Med. 22, 952–960. doi: 10.1038/nm.4139
Lin, S. M., Du, P., Huber, W., and Kibbe, W. A. (2008). Model-based variance-stabilizing transformation for Illumina microarray data. Nucleic Acids Res. 36:e11. doi: 10.1093/nar/gkm1075
Mardinoglu, A., Agren, R., Kampf, C., Asplund, A., Nookaew, I., Jacobson, P., et al. (2013a). Integration of clinical data with a genome-scale metabolic model of the human adipocyte. Mol. Syst. Biol. 9:649. doi: 10.1038/msb.2013.5
Mardinoglu, A., Agren, R., Kampf, C., Asplund, A., Uhlen, M., and Nielsen, J. (2014). Genome-scale metabolic modelling of hepatocytes reveals serine deficiency in patients with non-alcoholic fatty liver disease. Nat. Commun. 5:3083. doi: 10.1038/ncomms4083
Mardinoglu, A., Gatto, F., and Nielsen, J. (2013b). Genome-scale modeling of human metabolism - a systems biology approach. Biotechnol. J. 8, 985–996. doi: 10.1002/biot.201200275
Mayer, F. L., Wilson, D., and Hube, B. (2013). Candida albicans pathogenicity mechanisms. Virulence 4, 119–128. doi: 10.4161/viru.22913
McGettrick, A. F., and O'Neill, L. A. J. (2013). How metabolism generates signals during innate immunity and inflammation. J. Biol. Chem. 288, 22893–22898. doi: 10.1074/jbc.R113.486464
Mills, E., and O'Neill, L. A. J. (2014). Succinate: a metabolic signal in inflammation. Trends Cell Biol. 24, 313–320. doi: 10.1016/j.tcb.2013.11.008
Mitsche, M. A., McDonald, J. G., Hobbs, H. H., and Cohen, J. C. (2015). Flux analysis of cholesterol biosynthesis in vivo reveals multiple tissue and cell-type specific pathways. eLife 4:e07999. doi: 10.7554/eLife.07999
Moffett, J. R., and Namboodiri, M. A. (2003). Tryptophan and the immune response. Immunol. Cell Biol. 81, 247–265. doi: 10.1046/j.1440-1711.2003.t01-1-01177.x
Munn, D. H., Shafizadeh, E., Attwood, J. T., Bondarev, I., Pashine, A., and Mellor, A. L. (1999). Inhibition of t cell proliferation by macrophage tryptophan catabolism. J. Exp. Med. 189, 1363–1372.
Nagy, C., and Haschemi, A. (2015). Time and demand are two critical dimensions of immunometabolism: the process of macrophage activation and the pentose phosphate pathway. Front. Immunol. 6:164. doi: 10.3389/fimmu.2015.00164
Ngkelo, A., Meja, K., Yeadon, M., Adcock, I., and Kirkham, P. A. (2012). LPS induced inflammatory responses in human peripheral blood mononuclear cells is mediated through NOX4 and Giα dependent PI-3kinase signalling. J. Inflamm. 9:1. doi: 10.1186/1476-9255-9-1
O'Neill, L. A. J., Kishton, R. J., and Rathmell, J. (2016). A guide to immunometabolism for immunologists. Nat. Rev. Immunol. 16, 553–565. doi: 10.1038/nri.2016.70
Oosting, M., Buffen, K., van der Meer, J. W. M., Netea, M. G., and Joosten, L. A. B. (2016). Innate immunity networks during infection with Borrelia burgdorferi. Crit. Rev. Microbiol. 42, 233–244. doi: 10.3109/1040841X.2014.929563
Patil, K. R., and Nielsen, J. (2005). Uncovering transcriptional regulation of metabolism by using metabolic network topology. Proc. Natl. Acad. Sci. U.S.A. 102, 2685–2689. doi: 10.1073/pnas.0406811102
Pearce, E. L., and Pearce, E. J. (2013). Metabolic pathways in immune cell activation and quiescence. Immunity 38, 633–643. doi: 10.1016/j.immuni.2013.04.005
Pearce, E. L., Poffenberger, M. C., Chang, C.-H., and Jones, R. G. (2013). Fueling immunity: insights into metabolism and lymphocyte function. Science 342:1242454. doi: 10.1126/science.1242454
Phipson, B., and Smyth, G. K. (2010). Permutation P-values should never be zero: calculating exact P-values when permutations are randomly drawn. Stat. Appl. Genet. Mol. Biol. 9:Article39. doi: 10.2202/1544-6115.1585
Pornputtapong, N., Nookaew, I., and Nielsen, J. (2015). Human metabolic atlas: an online resource for human metabolism. Database 2015:bav068. doi: 10.1093/database/bav068
Ritchie, M. E., Phipson, B., Wu, D., Hu, Y., Law, C. W., Shi, W., et al. (2015). limma powers differential expression analyses for RNA-sequencing and microarray studies. Nucleic Acids Res. 43:e47. doi: 10.1093/nar/gkv007
Smeekens, S. P., Ng, A., Kumar, V., Johnson, M. D., Plantinga, T. S., van Diemen, C., et al. (2013). Functional genomics identifies type I interferon pathway as central for host defense against Candida albicans. Nat. Commun. 4:1342. doi: 10.1038/ncomms2343
Smyth, G. K. (2004). Linear models and empirical bayes methods for assessing differential expression in microarray experiments. Stat. Appl. Genet. Mol. Biol. 3:Article3. doi: 10.2202/1544-6115.1027
Spann, N. J., Garmire, L. X., McDonald, J. G., Myers, D. S., Milne, S. B., Shibata, N., et al. (2012). Regulated accumulation of desmosterol integrates macrophage lipid metabolism and inflammatory responses. Cell 151, 138–152. doi: 10.1016/j.cell.2012.06.054
Subramanian, A., Tamayo, P., Mootha, V. K., Mukherjee, S., Ebert, B. L., Gillette, M. A., et al. (2005). Gene set enrichment analysis: a knowledge-based approach for interpreting genome-wide expression profiles. Proc. Natl. Acad. Sci. U.S.A. 102, 15545–15550. doi: 10.1073/pnas.0506580102
Tannahill, G. M., Curtis, A. M., Adamik, J., Palsson-McDermott, E. M., McGettrick, A. F., Goel, G., et al. (2013). Succinate is an inflammatory signal that induces IL-1β through HIF-1α. Nature 496, 238–242. doi: 10.1038/nature11986
Thiele, I., Swainston, N., Fleming, R. M. T., Hoppe, A., Sahoo, S., Aurich, M. K., et al. (2013). A community-driven global reconstruction of human metabolism. Nat. Biotechnol. 31, 419–425. doi: 10.1038/nbt.2488
Thomson, S. J., Askari, A., and Bishop-Bailey, D. (2012). Anti-inflammatory effects of epoxyeicosatrienoic acids. Int. J. Vasc. Med. 2012:605101. doi: 10.1155/2012/605101
van Laarhoven, A., Dian, S., Aguirre-Gamboa, R., Avila-Pacheco, J., Ricaño-Ponce, I., Ruesen, C., et al. (2018). Cerebral tryptophan metabolism and outcome of tuberculous meningitis: an observational cohort study. Lancet Infect. Dis. doi: 10.1016/S1473-3099(18)30053-7. [Epub ahead of print]
Väremo, L., Nielsen, J., and Nookaew, I. (2013). Enriching the gene set analysis of genome-wide data by incorporating directionality of gene expression and combining statistical hypotheses and methods. Nucleic Acids Res. 41, 4378–4391. doi: 10.1093/nar/gkt111
Yizhak, K., Gaude, E., Le Dévédec, S., Waldman, Y. Y., Stein, G. Y., van de Water, B., et al. (2014). Phenotype-based cell-specific metabolic modeling reveals metabolic liabilities of cancer. eLife 3:e03641. doi: 10.7554/eLife.03641
Keywords: innate immunity, metabolism, peripheral blood mononuclear cell, Candida albicans, lipopolysaccharides, Mycobacterium tuberculosis, Borrelia burgdorferi, genome scale metabolic model
Citation: Zhang X, Mardinoglu A, Joosten LAB, Kuivenhoven JA, Li Y, Netea MG and Groen AK (2018) Identification of Discriminating Metabolic Pathways and Metabolites in Human PBMCs Stimulated by Various Pathogenic Agents. Front. Physiol. 9:139. doi: 10.3389/fphys.2018.00139
Received: 11 December 2017; Accepted: 12 February 2018;
Published: 27 February 2018.
Edited by:
Xiaogang Wu, Institute for Systems Biology, United StatesReviewed by:
Syed Aun Muhammad, Institute of Molecular Biology and Biotechnology, BZ University, PakistanCopyright © 2018 Zhang, Mardinoglu, Joosten, Kuivenhoven, Li, Netea and Groen. This is an open-access article distributed under the terms of the Creative Commons Attribution License (CC BY). The use, distribution or reproduction in other forums is permitted, provided the original author(s) and the copyright owner are credited and that the original publication in this journal is cited, in accordance with accepted academic practice. No use, distribution or reproduction is permitted which does not comply with these terms.
*Correspondence: Xiang Zhang, eGlhbmcuemhhbmdAYW1jLnV2YS5ubA==
Disclaimer: All claims expressed in this article are solely those of the authors and do not necessarily represent those of their affiliated organizations, or those of the publisher, the editors and the reviewers. Any product that may be evaluated in this article or claim that may be made by its manufacturer is not guaranteed or endorsed by the publisher.
Research integrity at Frontiers

Learn more about the work of our research integrity team to safeguard the quality of each article we publish.