

95% of researchers rate our articles as excellent or good
Learn more about the work of our research integrity team to safeguard the quality of each article we publish.
Find out more
ORIGINAL RESEARCH article
Front. Physiol. , 10 April 2012
Sec. Craniofacial Biology and Dental Research
Volume 3 - 2012 | https://doi.org/10.3389/fphys.2012.00085
This article is part of the Research Topic Cleft Palate: Clinical and developmental aspects View all 8 articles
Development of the palate comprises sequential stages of growth, elevation, and fusion of the palatal shelves. The mesenchymal component of palates plays a major role in early phases of palatogenesis, such as growth and elevation. Failure in these steps may result in cleft palate, the second most common birth defect in the world. These early stages of palatogenesis require precise and chronological orchestration of key physiological processes, such as growth, proliferation, differentiation, migration, and apoptosis. There is compelling evidence for the vital role of TGFβ-mediated regulation of palate development. We hypothesized that the isoforms of TGFβ regulate different cellular biofunctions of the palatal mesenchyme to various extents. Human embryonic palatal mesenchyme (HEPM) cells were treated with TGFβ1, β2, and β3 for microarray-based gene expression studies in order to identify the roles of TGFβ in the transcriptome of the palatal mesenchyme. Following normalization and modeling of 28,869 human genes, 566 transcripts were detected as differentially expressed in TGFβ-treated HEPM cells. Out of these altered transcripts, 234 of them were clustered in cellular biofunctions, including growth and proliferation, development, morphology, movement, cell cycle, and apoptosis. Biological interpretation and network analysis of the genes active in cellular biofunctions were performed using IPA. Among the differentially expressed genes, 11 of them are known to be crucial for palatogenesis (EDN1, INHBA, LHX8, PDGFC, PIGA, RUNX1, SNAI1, SMAD3, TGFβ1, TGFβ2, and TGFβR1). These genes were used for a merged interaction network with cellular behaviors. Overall, we have determined that more than 2% of human transcripts were differentially expressed in response to TGFβ treatment in HEPM cells. Our results suggest that both TGFβ1 and TGFβ2 orchestrate major cellular biofunctions within the palatal mesenchyme in vitro by regulating expression of 234 genes.
Cleft lip and/or palate is one of the most prevalent birth defects worldwide (1 in 800 live births; Schutte and Murray, 1999; Spritz, 2001), and is caused by failures in palate development. The formation of a continuous palate is a complex process composed of multiple steps, including palatal shelf growth, elevation, attachment, and fusion. Palatogenesis in the human spans from approximately gestational day 48 to 59 and the outgrowth of the secondary palate can generally be detected around day 49. During day 54–55, the palatine processes rapidly elevate, assuming a horizontal position which allows them to grow toward each other, attach, and fuse (Wyszynski, 2002). In general, with slight variation among strains, the stages of palatogenesis in mice [12.5–16.5 days post coitum (dpc)] are extremely similar and comparable to that of humans; therefore, mice have been used as a model to study human palate development (Ferguson, 1988). The failure of palatal shelves to grow and adhere after elevation is the most common type of cleft palate defect documented in murine models (Chai and Maxson, 2006). The palatal cellular components originate from the cranial neural crest (CNC)-derived palatal mesenchyme, concealed with a veneer of pharyngeal ectoderm-derived epithelium (Ito et al., 2003; Nakajima et al., 2010). A precise and time-sensitive regulation of various mesenchymal biofunctions, such as cellular movement, cell death (apoptosis), cell morphology, cell cycle progression, development, and growth and proliferation, is fundamental for the proper development of the palate. These cellular functions are coordinated by numerous genes encoding a range of growth factors, signaling mediators, transcriptional factors, cytokines, and extracellular matrix proteins (Richman and Tickle, 1989; Greene and Pisano, 2004, 2005). Therefore it is immensely important to explore the genes and the molecules that regulate the plethora of these biofunctions to understand cellular behavior during palatogenesis.
The TGFβ family consists of more than 30 ligand proteins, including activins, BMP, and TGFβ cytokines, regulating a wide variety of biological processes such as cellular development, morphology, movement, growth and proliferation, survival, mitotic regulation, apoptosis, and epithelial–mesenchymal transition (EMT). Although the three isoforms of TGFβ (β1, β2, and β3) are highly conserved between species (Rotzer et al., 2001) and share 71–76% sequence identity, these ligands have isoform-specific activities that cannot be compensated by other family members (Iwata et al., 2011). Based on knockout mouse models, TGFβ isoforms have been found to be essential for normal morphogenesis of the palate (Iordanskaia and Nawshad, 2011). TGFβ1 null mice are embryonically lethal and die before 11 dpc (Brunet et al., 1995), so its role in palate development cannot be evaluated. TGFβ2 knockout mice, which are also embryonic lethal at 18 dpc, have defects in their mandible and maxilla, with 23% of cases resulting in cleft palate (Sanford et al., 1997); whereas all TGFβ3 null mice develop cleft palate (Kaartinen et al., 1995; Proetzel et al., 1995) and die within 24 h after birth. Furthermore, TGFβ mutations and expression patterns have been shown to be associated with the occurrence of cleft lip and/or palate (Stoll et al., 2004). Mutations in TGFβ1 and TGFβ3, as well as their variants, are associated with cleft palate in humans (Lidral et al., 1998; Mitchell et al., 2001; Kim et al., 2003; Vieira et al., 2003; Rullo et al., 2006; Guo et al., 2010; Salahshourifar et al., 2011). Moreover, in vitro studies of human tissues showed that TGFβ1 and β3 are differently expressed and correlated with the cleft lip and/or palate phenotype (Bodo et al., 1999). Overall, these findings underscore the crucial function of TGFβ isoforms in the optimal regulation and completion of palate development.
The TGFβ isoforms are expressed in the early stages of mouse palate development (Fitzpatrick et al., 1990; Pelton et al., 1990; Gehris et al., 1991; Gehris and Greene, 1992). During the sequential steps of palatogenesis, TGFβ1 is expressed both in the epithelial and mesenchymal components of the palatal shelves (Fitzpatrick et al., 1990; Pelton et al., 1990). TGFβ2 is predominantly expressed in the mesenchymal cells, particularly immediately adjacent to the epithelium, with few epithelial cells also expressing TGFβ2 transcripts (Fitzpatrick et al., 1990; Pelton et al., 1990; Gehris and Greene, 1992). Intense and distinct localization of TGFβ3 has been detected in the medial edge epithelium (MEE) of the palate (Fitzpatrick et al., 1990; Pelton et al., 1990). In our lab, we have demonstrated that TGFβ3 is also expressed in the palatal mesenchyme, albeit at a lower level compared to the palatal epithelium (Unpublished data). It has also been shown that each TGFβ ligand can signal via different receptor complexes and downstream signaling molecules resulting in divergent cellular functions and behavior (Abbott and Pratt, 1988; Iwata et al., 2011). Therefore the isoforms of TGFβ may behave uniquely in the palatal mesenchyme compared to the palatal epithelium.
In this study, we investigated the crucial roles of TGFβ1, β2, and β3 on the regulation of palatal mesenchyme transcriptome and various cellular biofunctions, such as growth and proliferation, development, cell morphology, movement, cell cycle, and cell death. Using human embryonic palatal mesenchymal (HEPM) cells and bioinformatics tools, we analyzed how these isoforms regulate differential expression of transcripts and gene interaction networks within the palatal mesenchyme. Using microarray genechips, we found that expression of only 566 genes, which corresponds to >2% of the overall human transcriptome, were differentially expressed in TGFβ-treated HEPM cells with statistical significance; including candidate genes recognized as inducers of cleft palate either in human or mouse (EDN1, INHBA, LHX8, PDGFC, PIGA, RUNX1, SNAI1, SMAD3, TGFβ1, TGFβ2, and TGFβR1). We also found that exogenous TGFβ can regulate different molecules of the canonical TGFβ signaling pathway. Our results suggest that both TGFβ1 and TGFβ2, in concordance, regulate expression of 234 genes that govern cellular biofunctions which are crucial for the complete formation of the palate.
The HEPM cell line (CRL 1486) was obtained from the American Type Culture Collection (ATCC; Rockville, MD, USA) from a single human abortus at the time of palatal shelf elevation, but prior to epithelial contact. HEPM cells represent the undifferentiated fibroblast-like cells from embryonic palatal shelves. The cells were cultured at 37°C with 5% CO2. The culture medium consisted of DMEM (Mediatech, Manassas, VA, USA) supplemented with 10% (v:v) fetal bovine serum (FBS) and 1% (v:v) penicillin streptomycin. For the microarray and qPCR studies, following 24 h serum starvation, HEPM cells were treated either with 0.5% FBS (Control) or with recombinant TGFβ (R&D Systems, Minneapolis, MN, USA) at 10 ng/ml TGFβ1, TGFβ2, or TGFβ3 for 24 h in triplicate and harvested for RNA extraction.
Total RNA from the TGFβ-treated HEPM cells was extracted using the RNeasy spin column RNA purification kit (Qiagen, CA, USA) according to the manufacturer’s instructions. RNA yield and integrity were initially evaluated using a NanoDrop 2000c spectrophotometer (NanoDrop, Wilmington, DE, USA). Samples with a concentration above 40 ng/ml, OD260:280 of 1.8–2.0, and OD260:230 above 1.8 were retained. Samples intended for microarray analysis were further evaluated using the Agilent 2100 Bioanalyzer and RNA 6000 Pico kit (Agilent, Santa Clara, CA, USA) according to the manufacturer’s instructions. Samples with electropherograms exhibiting sharp 18S and 28S rRNA peaks and no evidence of degradation were retained.
RNA samples from each treatment group of triplicates (Total:12) were profiled using the Affymetrix GeneChip® Human Gene 1.0 ST Array (Affymetrix Inc., Santa Clara, CA, USA) representing 28,869 genes. In this chip, each of the genes was represented on the array by approximately 26 probes spread across the full length of the gene, providing a more complete and accurate interpretation of gene expression than 3′ based expression array designs (Pradervand et al., 2008). The microarray procedure was performed according to the standard Affymetrix gene chip analysis protocol at the UNMC Microarray Core. Three hundred nanograms of total RNA was reverse transcribed and converted to double stranded cDNA using the Ambion WT Expression kit (Ambion, Austin, TX, USA). The samples were subsequently subjected to fragmentation and biotin end-labeling using the Affymetrix WT Labeling Kit and hybridized per the manufacturers suggestions to the Affymetrix Human Gene ST 1.0 arrays. The wash, stain, and scan procedures were carried out on the Affymetrix Hybridization Oven, FS 450 wash station, and the 7000G scanner per the manufacturer’s recommendations (Affymetrix, Santa Clara, CA, USA).
Synthesis of cDNA prior to qPCR was performed using the SuperScript® III First Strand SuperMix (Invitrogen, Carlsbad, CA, USA) with 5 μg input total RNA per 25 μl reaction according to the manufacturer’s instructions. Negative control samples were performed in parallel by omitting reverse transcriptase. The sequences of primers for genes of interest (Table A1 in Appendix) were designed using the PrimeTime qPCR Assay [Integrated DNA Technologies (IDT), Iowa City, IA, USA) and synthesized by Eurofins MWG Operon (Huntsville, AL, USA). All qPCR experiments were performed using cDNA synthesized from the same batch and starting amount of total RNA. Negative controls containing no cDNA template were included for each gene within each qPCR run. To avoid variation in amplification conditions across runs, reactions for all experimental conditions (i.e., all untreated and TGFβ-treated HEPM cells) for each gene of interest were performed as triplicates in the same 96-well plate. Cycling conditions were designed according to the RealMasterMix SYBR ROX handbook (5 PRIME, Gaithersburg, MD, USA) as initial activation at 95°C for 10 min; 40 cycles of 95°C for 15 s, 60°C for 1 min. Amplification specificity for each gene was confirmed by a single distinct melting curve. Relative quantification of gene expression was determined by normalization of the samples with the internal reference gene, GAPDH. Data from the triplicates was evaluated and analyzed for significance by the pair-wise fixed reallocation randomization test using the REST 2009 software (Pfaffl et al., 2002). A p-value of ≤0.05 was considered significant.
Scanned array images were analyzed by dChip applying a smoothing spline normalization method prior to obtaining model-based gene expression indices, a.k.a. signal values. There were no outliers identified by dChip, so all samples were carried on for subsequent analysis. When comparing two groups of samples to identify enriched genes in a given group, we used the lower confidence bound (LCB) of the fold change (FC) between the two groups as the cut-off criteria. If 90% LCB of FC between the two groups was above 1.2, the corresponding gene was considered to be differentially expressed. LCB is a stringent estimate of the FC and has been shown to be the better ranking statistic (Li and Wong, 2001). By use of LCB, we can be 90% confident that the actual FC is some value above the reported LCB. Researchers demonstrated that (Ramalho-Santos et al., 2002) selecting genes that have a LCB above 1.2 most likely corresponds to genes with an “actual” FC of at least three in gene expression. For all genes scored, the FC was calculated by dividing the experiment value by the control value. If this number was less than one, the (negative) reciprocal is listed (e.g., 0.75 or a drop of 25% from control is reported as −1.25 FC). The reported FCs are the average of the independent experiments. All of the significantly changed genes (FC >1.2-fold down or up) were selected for the biofunctional analysis. p-Values less than 0.05 indicated a statistically significant, non-random association. The complete list of genes passing dChip’s statistical filter for each treatment with their respective FCs and p-values was deposited to the gene expression omnibus (GEO) of NCBI (Accession number: TBD). To compare the results of our multiple microarray experiments, we drew Venn diagrams which depicted the relations among the TGFβ treatment groups as intersections or uniqueness using the GeneVenn (Pirooznia et al., 2007).
Clustering of samples and genes was performed using the unweighted pair group method with arithmetic-mean (UPGMA), a hierarchical clustering technique used to construct a similarity tree, and principal components analysis (PCA; Sneath, 1973; Handl et al., 2005). Heatmaps with dendrograms are constructed using Bioconductor of R statistical software (Gentleman et al., 2004; Reimers and Carey, 2006). Samples and genes were clustered using the normalized and modeled expression values obtained by dChip analysis. The expression data matrix was row-normalized for each gene prior to the application of average linkage clustering and the Pearson’s correlation was used as the distance measure. In the heatmaps, each column corresponds to the averaged expression profile of a treatment in triplicate, and each row corresponds to an mRNA. The upper portion (green-to-red) represents downregulated transcripts and the lower portion (red-to-green) represents upregulated transcripts. The increasing intensities of red signify a higher expression in the given sample of a specific mRNA, whereas the increasing intensities of green indicate a lower expression of mRNA and black indicates mean level expression. Functional analysis was comprised of finding gene ontology (GO) categories in the gene clusters of interest that warrant further investigation. GO annotations are used for the biological interpretation of detected clusters (Ashburner et al., 2000).
The effects of TGFβ on cellular functions of HEPM cells were examined in the context of differentially expressed human genes using the ingenuity pathway analysis (IPA; Ingenuity Systems, CA, USA) a web-delivered application used to discover, visualize, and explore relevant networks. Following statistical analysis and filtering of the microarray data using dChip, Affymetrix probe identifiers, and fold-values of each treatment group were uploaded to IPA as a dataset. Each identifier was mapped to its corresponding gene object in the ingenuity knowledge base (IKB). Interactions were then queried between these datasets and all other gene objects stored within IPA to generate a set of direct interaction networks that were overlapped. The significant genes were categorized, compared to functional categories in the IPA database, and ranked according to their p-values. p-Values less than 0.05 indicate a statistically significant, non-random association between a set of significant genes and a set of all genes related to a given function in the IKB (Mori et al., 2009). Through the assessment of differentially expressed genes, cellular processes that are most significantly altered in our dataset were: cellular growth and proliferation, development, morphology, movement, cell cycle, and cell death. Using these IPA analyses, molecules within the cellular biofunction categories were filtered and imported to Excel (Microsoft, Seattle, WA, USA) for further graphical analysis of the networks.
We performed gene expression profiling on the Affymetrix GeneChip® Human Gene 1.0 ST Array representing 28,869 genes. We explored the alterations in gene expression in HEPM cells extracted from human embryonic palatal shelves in response to 10 ng/ml TGFβ1, TGFβ2, and TGFβ3 for 24 h. Statistically significant altered genes were filtered using dChip through normalization and modeling analysis. Out of 28,869 genes represented within the GeneChip®, 301 genes demonstrated upregulated and 200 genes demonstrated downregulated expression in response to TGFβ1 treatment. Similarly, 190 genes were upregulated and 77 genes were downregulated in response to TGFβ2 treatment. Interestingly, only four genes demonstrated increased and four genes demonstrated decreased expression patterns in response to TGFβ3 treatment. The numbers of differentially expressed genes, indicating individual and overlapping aggregations of TGFβ isoforms, are depicted in a Venn diagram (Figure 1).
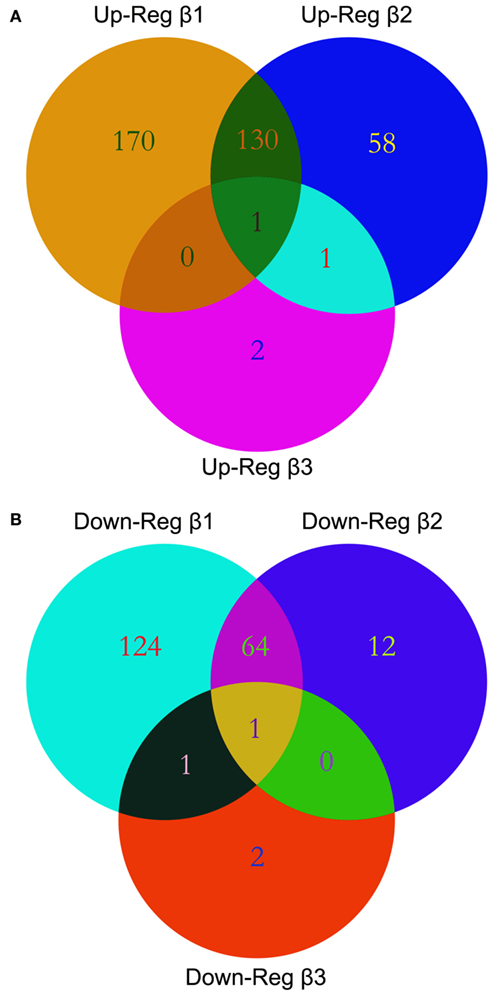
Figure 1. Venn diagrams. Multiple microarray experiments were designed to detect differential expression of transcripts with TGFβ treatment and were compared using Venn diagrams. List of differentially expressed genes with their accession IDs were uploaded to GeneVenn, query was run, and the detected numbers and gene lists were exported to MS Excel. Graphical figure is illustrated using the Adobe Photoshop (Adobe Inc, CA, USA). Relations among the list of altered genes within TGFβ treatment groups are depicted as intersections or uniqueness. A significant overlap of differentially expressed genes was observed between the TGFβ1 and TGFβ2 treatment groups both in the upregulated (A) or downregulated (B) gene lists.
The genes (n = 27) displaying the most significant changes in expression patterns in response to TGFβ1 and TGFβ2 stimulation with their FCs and p-values are shown in Table 2. According to dChip normalization and modeling, the level of differential gene expression by TGFβ3 was detected to be statistically non-significant; therefore TGFβ3 has been excluded from the FC analysis. Transcripts, which were differentially expressed both by TGFβ1 and TGFβ2, are highlighted in the table (Table 2). Graphical representation of FC values detected by microarray analysis is shown in Figure 2A. In order to validate the gene expression profiling results of these most significantly up- and downregulated transcripts, expression levels of 27 genes were quantified by qPCR and compared to the levels determined by microarray (Figure 2B). Expression profiles of all 27 genes tested were found to be in agreement between the two analytical assay results. We identified a strong correlation of gene expression pattern between microarray and qPCR data in terms of up- and downregulation, but not relative level of expression.
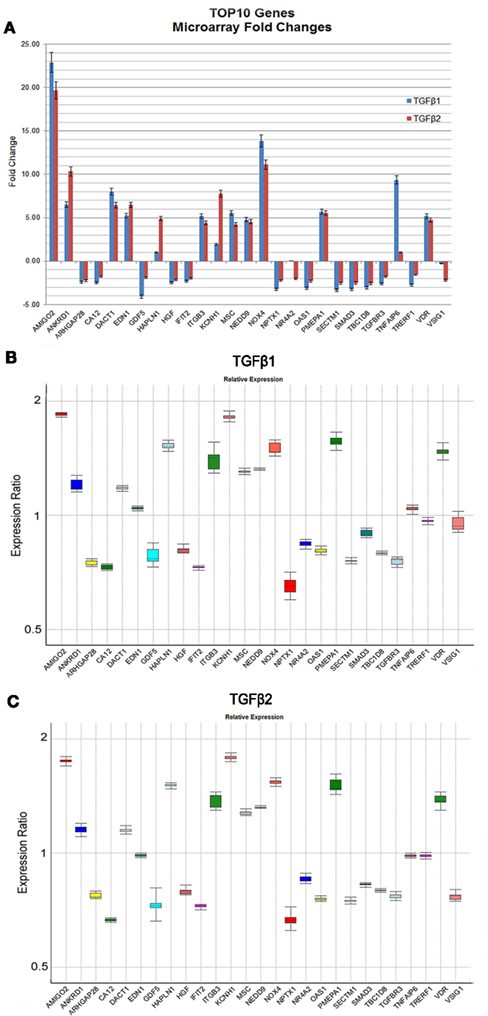
Figure 2. Expression levels of the most significantly up- and downregulated genes based on microarray and qPCR analyses. The graphical representation of genes (n = 27) displaying the most significant changes in expression patterns in response to TGFβ stimulation with their FC values based on microarray analyses were shown (A). Only TGFβ1 and TGFβ2 treatments were represented in (A) due to their statistically significant p-values detected by dChip. (B,C) Gene expression profiles of all 27 genes were independently validated using qPCR and data was analyzed using REST 2009 (Pfaffl et al., 2002). Expression variation for each gene was visualized in a whisker-box plot. Transcripts were sorted alphabetically.
Furthermore, direct or indirect relations of these 27 genes with TGFβ signaling were detected using IPA. Among the significantly upregulated transcripts, we detected that ANKRD1, EDN1, IGFBP3, ITGB3, NOX4, NEDD9, PMEPA1, TNFAIP6, and VDR were directly related with TGFβ; while AMIGO2 and MSC were indirectly associated with TGFβ via other molecules (Figure 3A). Within the significantly downregulated gene group HGF, NR4A2, SMAD3, and TGFBR3 presented a direct relation with TGFβ; while transcripts of TBC1D8, GDF5, IFIT2, and OAS1 presented an indirect association with TGFβ via other molecules (Figure 3B).
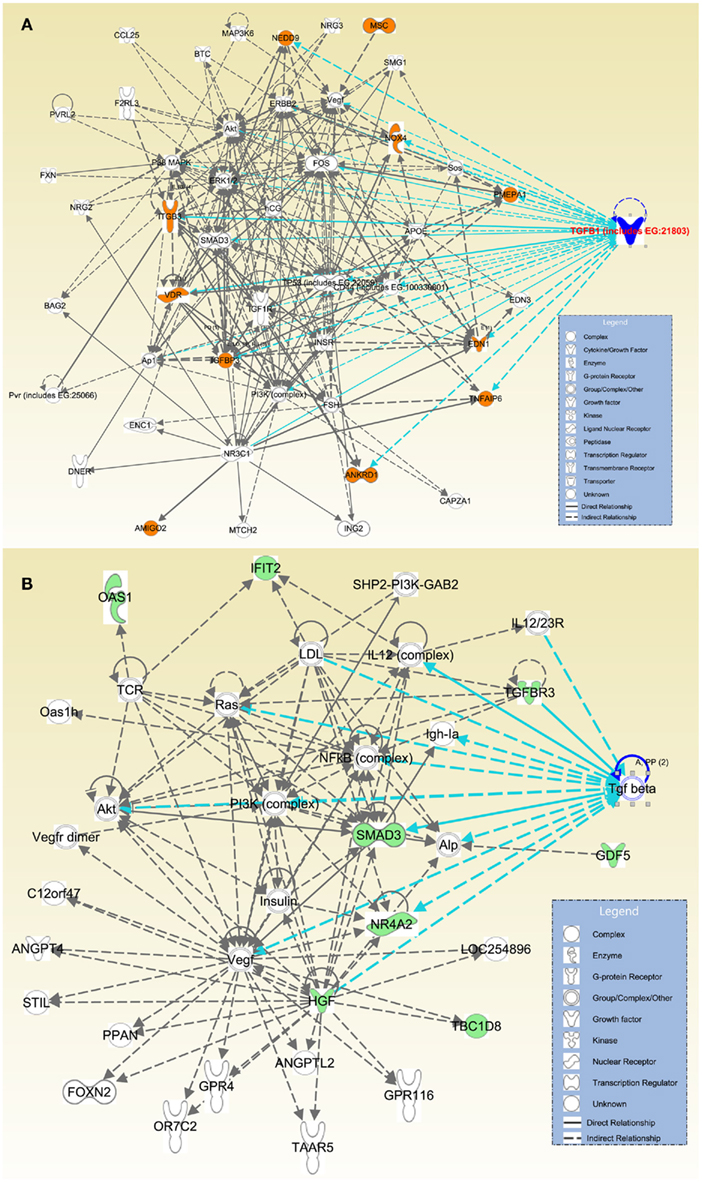
Figure 3. Direct and indirect relations of most differentially expressed genes with TGFβ. Affymetrix probe identifiers and FC values of significantly altered transcripts (n = 27) were uploaded to IPA and each identifier was mapped to its corresponding gene object in the IKB. Interactions were then queried between these gene objects and all other gene objects stored within IPA to generate a set of direct interaction networks that were merged. Networks with the highest number of molecules were selected, overlaid with TGFβ molecules, and organized using Path Designer of IPA. Upregulated transcripts were highlighted with orange (A); and downregulated transcripts were highlighted with green (B). Types of molecules were annotated in the legend in the box.
We focused on the differential expression of genes involved in cellular biofunctions with a criterion of FC >1.2 using the IPA software. While several genes overlapped based on cellular functions, we were able to cluster them according to their GO annotations as: cell cycle, cell death, cell morphology, growth and proliferation, development, and movement (Table 1). The individual heatmaps were generated according to hierarchal clustering of genes which are involved in the cellular processes (Figure 4). According to IPA analysis, there were 66 differentially expressed genes detected to have a role in cellular movement; 48 were upregulated, and 18 were downregulated in response to TGFβ treatment. Eighty genes were found to play a role in apoptosis (cell death); 55 demonstrated increased expression, while 25 displayed lower expression levels). Fifty genes function in cell morphology; 12 were downregulated and 38 were upregulated. Cellular development included 91 genes, among which 53 were upregulated and 38 were downregulated. The Cell cycle GO was represented by 37 genes; 20 were upregulated and 17 were downregulated. The GO cluster containing the highest number of differentially expressed genes (n = 93) compared to other cellular biofunction clusters was the cellular growth and proliferation GO, including 57 upregulated and 36 downregulated transcripts.
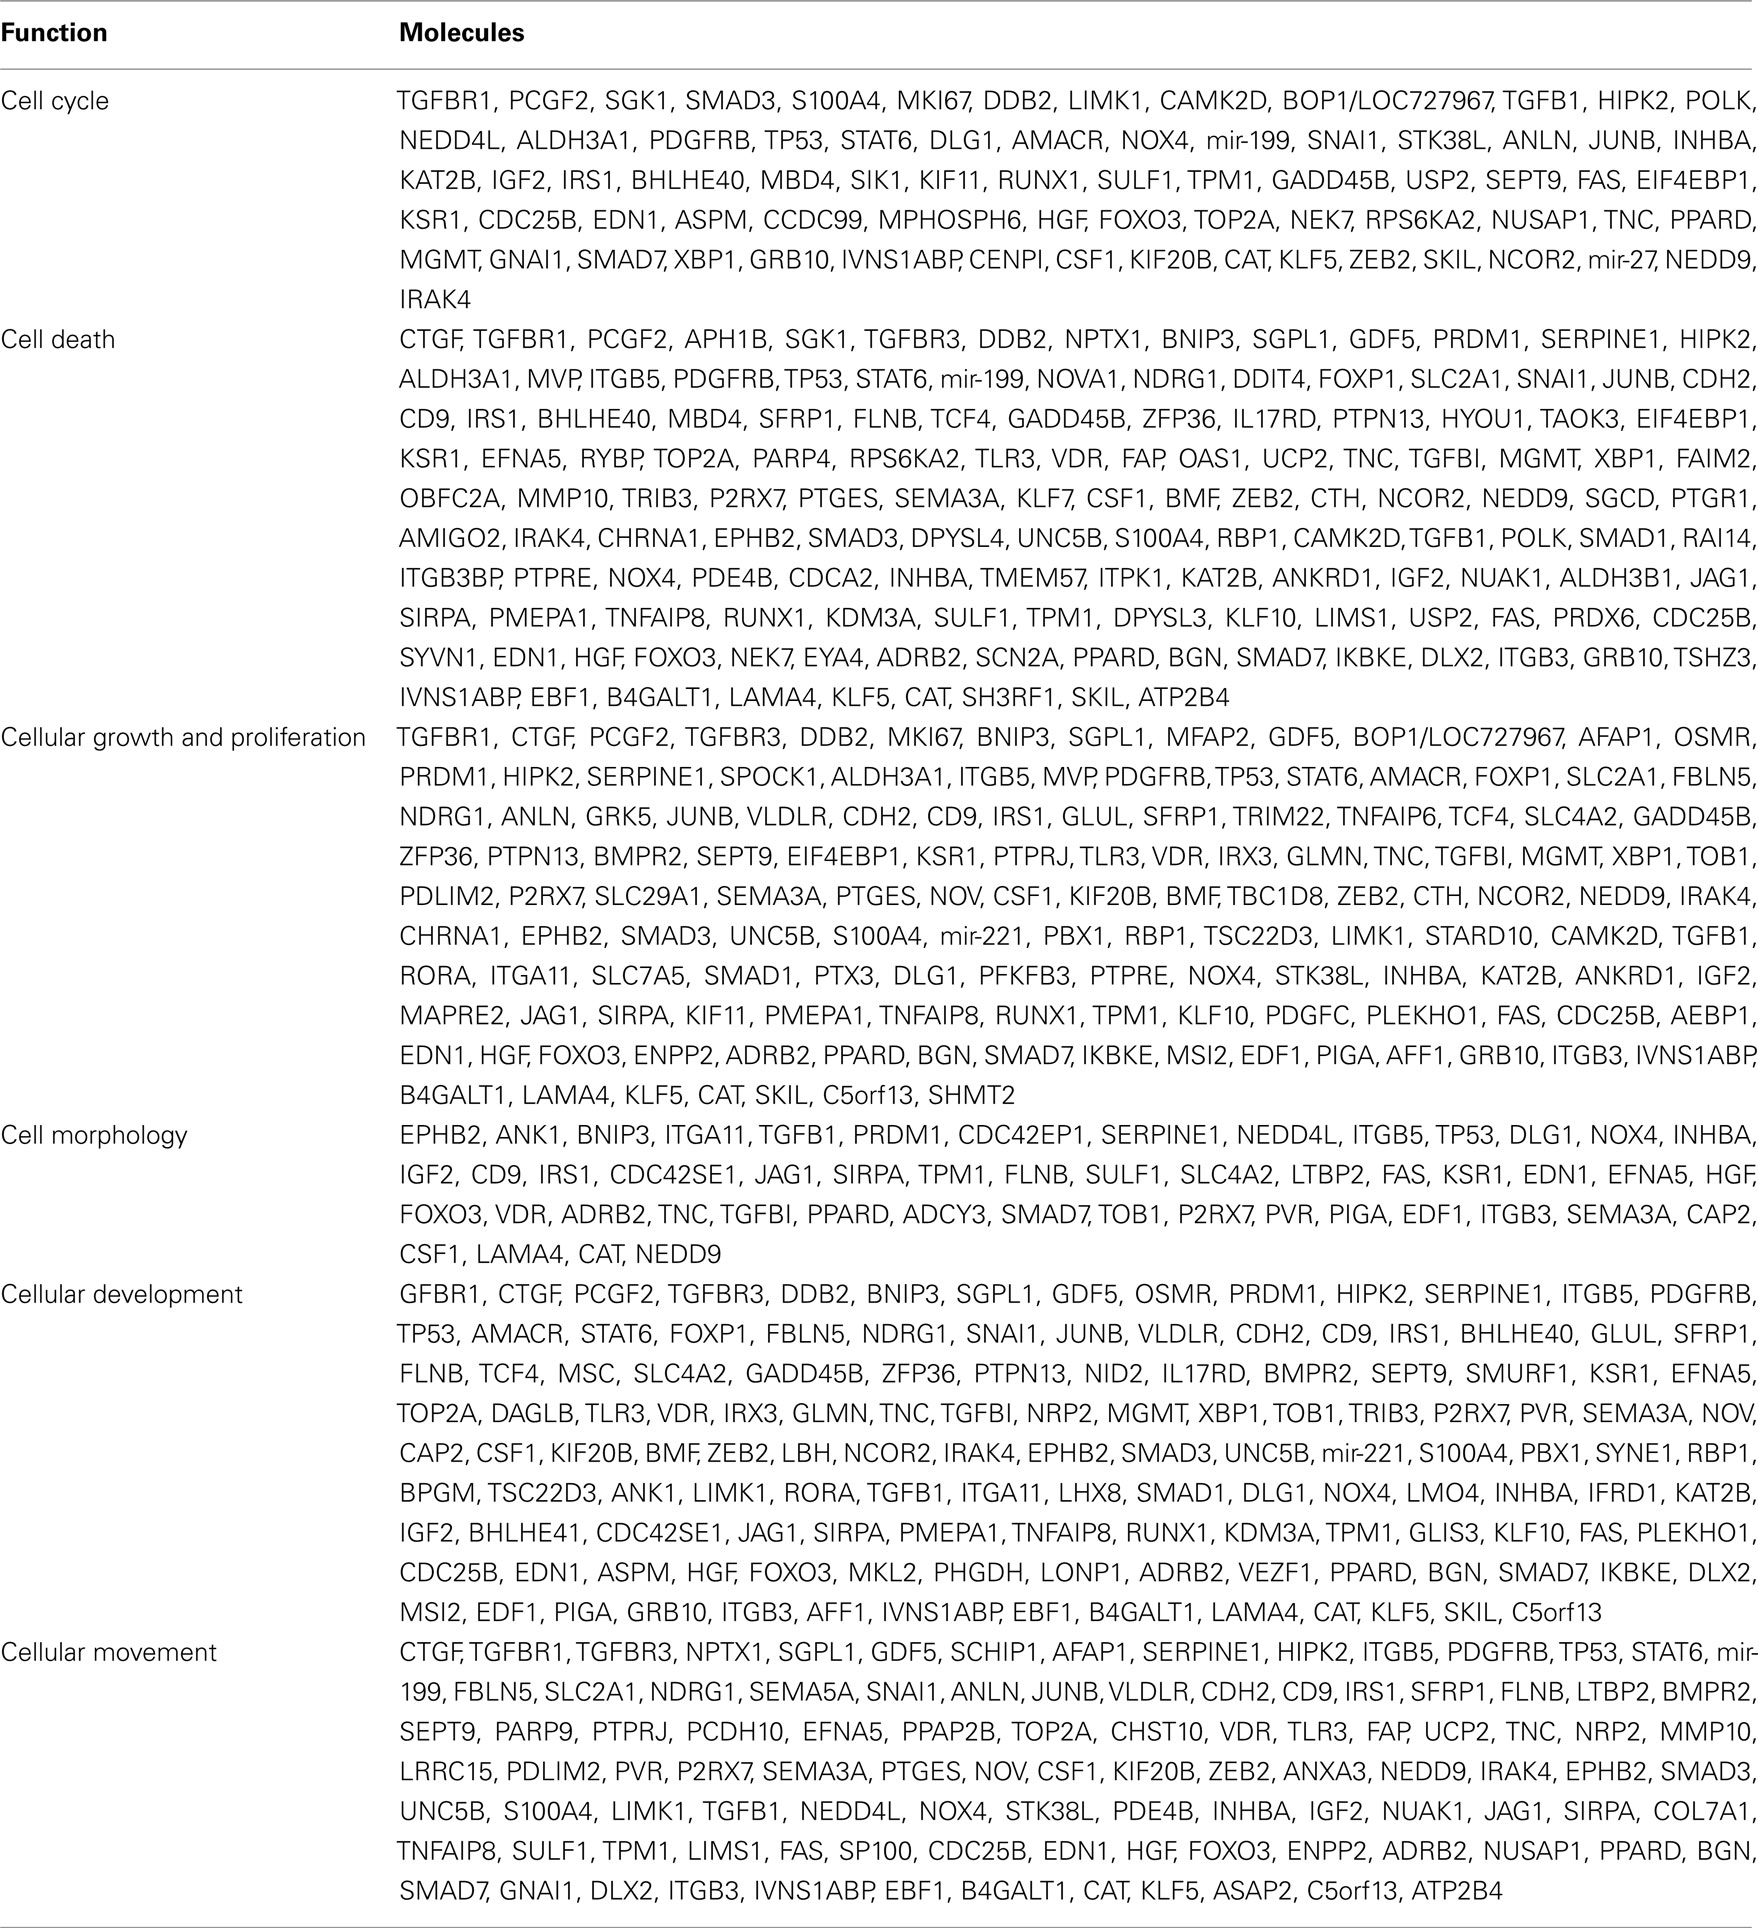
Table 1. Differentially expressed molecules clustered into GO of cellular biofunctions.
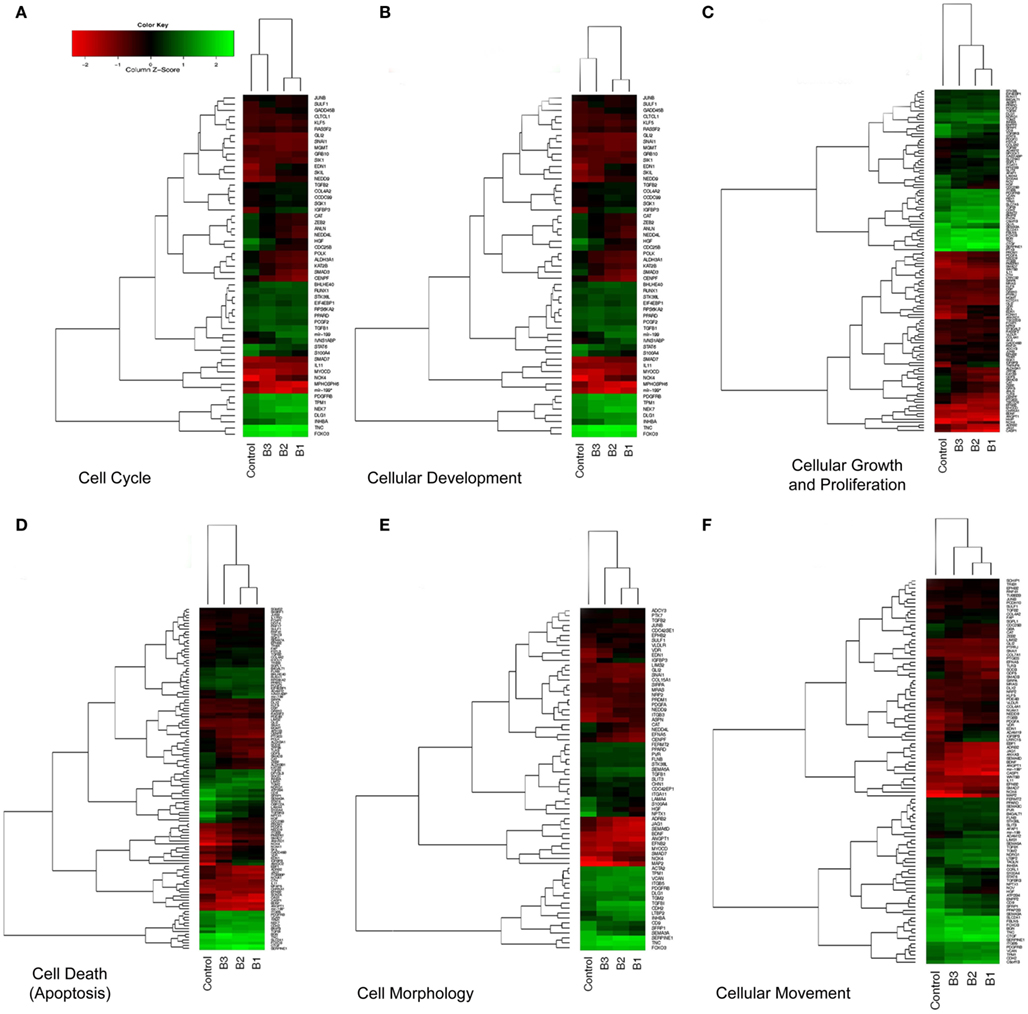
Figure 4. Hierarchical clustering (heatmap) analysis of differentially expressed transcripts. Altered genes were clustered based on cellular biofunctions and heatmaps were constructed using Bioconductor. Coexpressed groups of genes were illustrated with dendrograms and progressively and distinctly up- or downregulated genes were ranked accordingly. Each column corresponds to the expression profile of a treatment (either TGFβ or Control) in triplicate, and each row corresponds to a transcript. The increasing intensities of red signify a higher expression in the given sample of a specific mRNA, whereas the increasing intensities of green indicate a lower expression of mRNA and black indicates mean level expression. The list of genes for each particular function (A–F) was shown in Table 1.
A representation of the network-based interactions of the differentially expressed genes, according to their cellular biofunctions, and their molecule type, is shown in Figure 5. Due to the high number of genes in each biofunction, we preferred the genes with an FC >2.0 for network interactions. In the cell cycle network, only three genes (SMAD3, let-7, and EPGN) were downregulated, and seven genes (mir-199, IGFBP3, SKIL, NOX4, IVNS1ABP, EDN1, and NEDD9) were upregulated. Within the cellular movement network there were 4 significantly downregulated genes (SMAD3, SERPINB2, GDF5, and NPTX1) and 15 upregulated genes (ADAM19, VDR, VLDLR, NUAK1, NEDD9, LRRC15, mir-199, IGFBP3, EDN1, MAP2, ADAM12, LTBP2, IVNS1ABP, NOX4, and ITGB3) in response to TGFβ treatment. In the network of cellular growth and proliferation, we detected 8 genes (TRA2A, EPGN, GDF5, SERPINB2, SMAD3, let-7, GPAM, and mir-218) which were downregulated, while 17 genes (KCNH1, ITGB3, PMEPA1, NOX4, IVNS1ABP, VLDLR, IGFBP3, ADAM12, EDN1, AK4, VDR, ANKRD1, TGFβI, NEDD9, SKIL, TNFAIP6, and SPOCK1) were upregulated. Downregulated genes belonging to the cell morphology GO network include NPTX1 and SMAD3; and upregulated genes (n = 11) include LTBP2, VDR, ASPN, TGFβI, IGFBP3, EDN1, MAP2, VLDLR, NEDD9, NOX4, and ITGB3. In the cellular development network, 6 genes (mir-218, TRA2A, GDF5, SERPINB2, SMAD3, and let-7) were downregulated and 12 genes (EDN1, PMEPA1, SKIL, VDR, ASPN, IVNS1ABP, TGFβI, VLDLR, NOX4, IGFBP3, ITGB3, and KCHN1) were upregulated. Within the cell death (apoptosis) GO network, 5 genes (NPTX1, GDF5, SERPINB2, SMAD3, and GPAM) were downregulated and 14 genes (NUAK1, SKIL, VDR, AMIGO2, ANKRD1, TGFβI, ADAM12, mir-199, IVNS1ABP, IGFBP3, NEDD9, NOX4, EDN1, PMEPA1, and ITGB3) were upregulated.
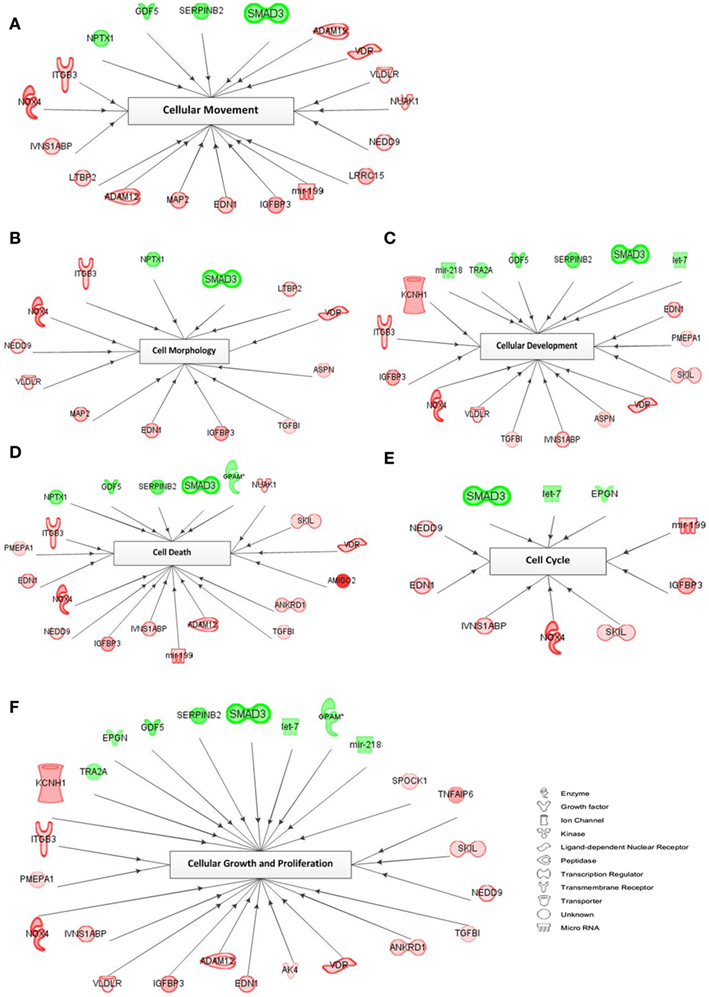
Figure 5. Network of cellular biofunctions and corresponding transcripts. Networks were constructed with the IPA software using the selected genes matching the criterion of FC >2.0 and involved in cellular biofunctions. Several differentially regulated genes from the study were used to construct a gene association map for predicting various cellular and molecular events operating within the palatal mesenchyme (A–F). Red symbols specify upregulated expression of genes, whereas green symbols indicate downregulated genes. The color darkness represents the FC intensity.
A table of genes vital to the morphogenesis of orofacial development was constructed based on the most recent literature review (Table A2 in Appendix; Wilkie and Morriss-Kay, 2001; Lidral and Moreno, 2005; Gritli-Linde, 2007; Dixon et al., 2011). Genes from the table of cellular biofunctions (Table 1) were merged with the Table A2 in Appendix to filter the differentially expressed genes according to putative candidates for palatal deformities. Some of the genes listed were identified as being important for palatogenesis in mouse, but not directly associated with human cases of cleft palate and thus remain “putative” cleft palate genes in the latter, as labeled with asterisk (*) in the Table A2 in Appendix. Overlapping genes (n = 11) were presented in Table 2 with their FC and p-values. Among these genes, EDN1, INHBA, TGFβ1, TGFβ2, RUNX1, LHX8, SNAI1, PDGFC, and PIGA were upregulated; while only SMAD3 was downregulated in response to TGFβtreatment. Intriguingly, TGFβR1 was upregulated with TGFβ1 treatment and downregulated with TGFβ2 treatment; which correlates with isoform-specific receptor requirement in TGFβ signaling (Rojas et al., 2009).
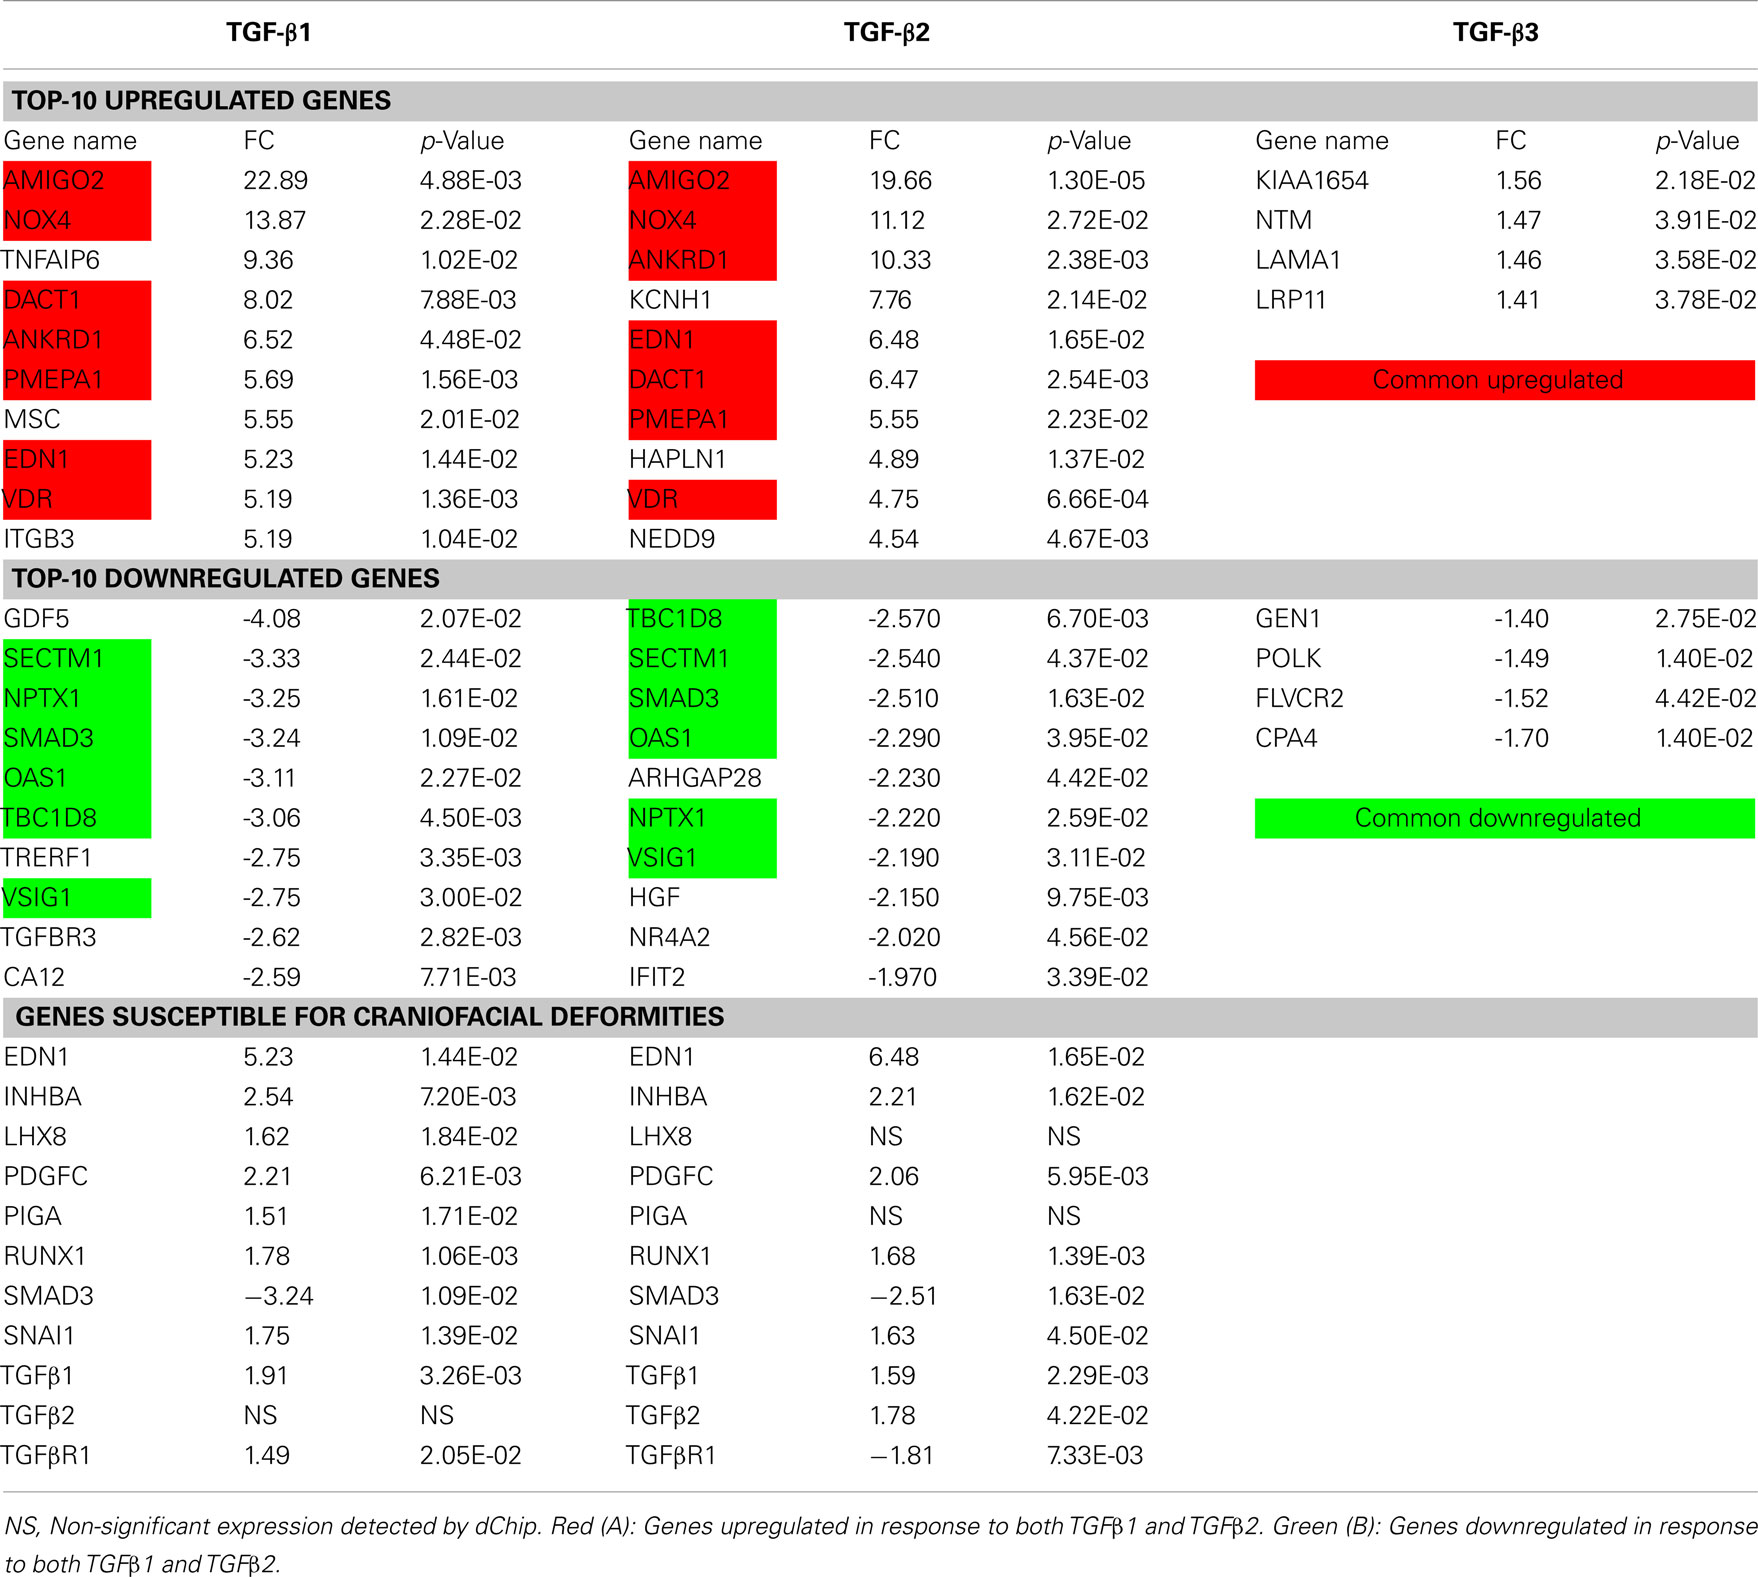
Table 2. The most significantly altered genes within the palatal mesenchyme with TGF-β treatment.
Ingenuity pathway analysis, a knowledge based program to generate relevant and interacting biological networks, was used to determine how the differentially expressed overlapping genes might interact to facilitate cellular biofunctions. A direct interaction network of the orofacial deformity susceptibility genes, overlaid with clustered cellular biofunctions crucial for development and maturation of the palatal mesenchyme was generated and is presented in Figure 6. Finally, the localization of differentially expressed genes within the canonical TGFβ pathway was illustrated by using the IPA Path Designer in Figure 7. The overlapping genes were: TGFβ1, TGFβ2, INHBA (activins/inhibins), BMPR2, SMAD7, SMURF1, SMAD 1/5/8, SMAD2/3, VDR, and PAI-1; suggesting that not all of the TGFβ pathway molecules are significantly regulated by exogenous TGFβ treatment. The list of genes regulated by differentially expressed TGFβ signaling molecules and their level of altered expression are represented at Table 3. The full list of these genes, including non-significantly altered, is provided in Table A4 in Appendix.
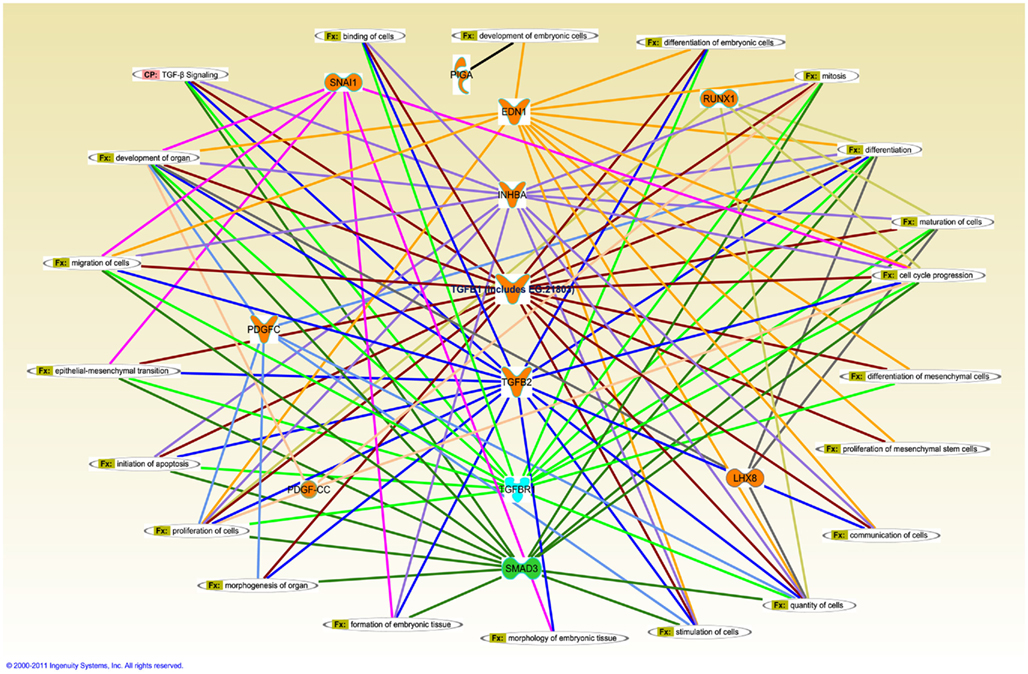
Figure 6. Merged interaction network of cleft palate susceptibility genes and biofunctions. Affymetrix probe identifiers and fold-values were uploaded to IPA and each identifier was mapped to its corresponding gene object in the IKB. Interactions were then queried between these gene objects and all other gene objects stored within IPA to generate a set of direct interaction networks that were merged. Cellular functions that directly interact with differentially expressed putative candidate genes for cleft palate in response to TGFβ treatment of HEPM cells were included in the network. The 11 transcripts meeting the 0.05 criteria of FDR in response to TGFβ treatment were analyzed for the direct interaction network using IPA. Upregulated genes (EDN1, INHBA, TGFβ1, TGFβ2, RUNX1, LHX8, SNAI1, PDGFC, and PIGA) were highlighted with orange and downregulated gene (SMAD3) was highlighted with green. TGFβR1 was upregulated with TGFβ1 treatment and downregulated with TGFβ2 treatment, thus highlighted with cyan. Fx, cellular function; CP, canonical pathway.
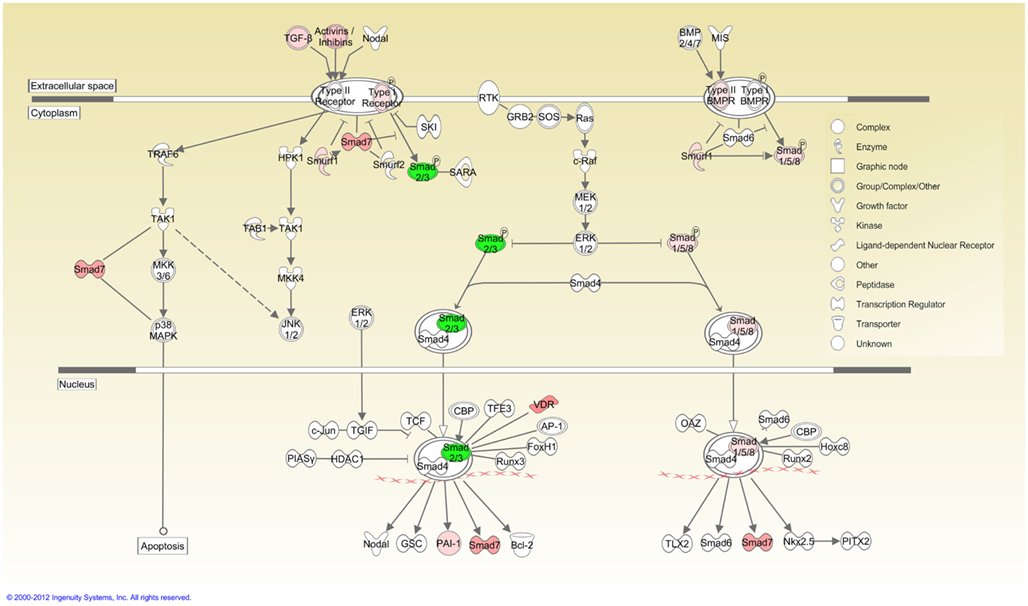
Figure 7. TGFβ signaling pathway overlaid with differentially expressed genes. Cellular localization of differentially expressed genes active in canonical TGFβ pathway was illustrated using the IPA Path Designer. Genes in Table 1 were uploaded to IPA as a dataset and analyzed using default settings. Acquired networks were overlaid with TGFβ canonical pathway. The overlapping genes are: TGFβ1, TGFβ2, INHBA (activins/inhibins), BMPR2, SMAD7, SMURF1, SMAD 1/5/8, SMAD2/3, VDR, and PAI-1. Green color represents downregulated expression, whereas red color represents upregulated expression of genes. Color intensity reflects the level of expression. Types of molecules are annotated in the legend in the box.
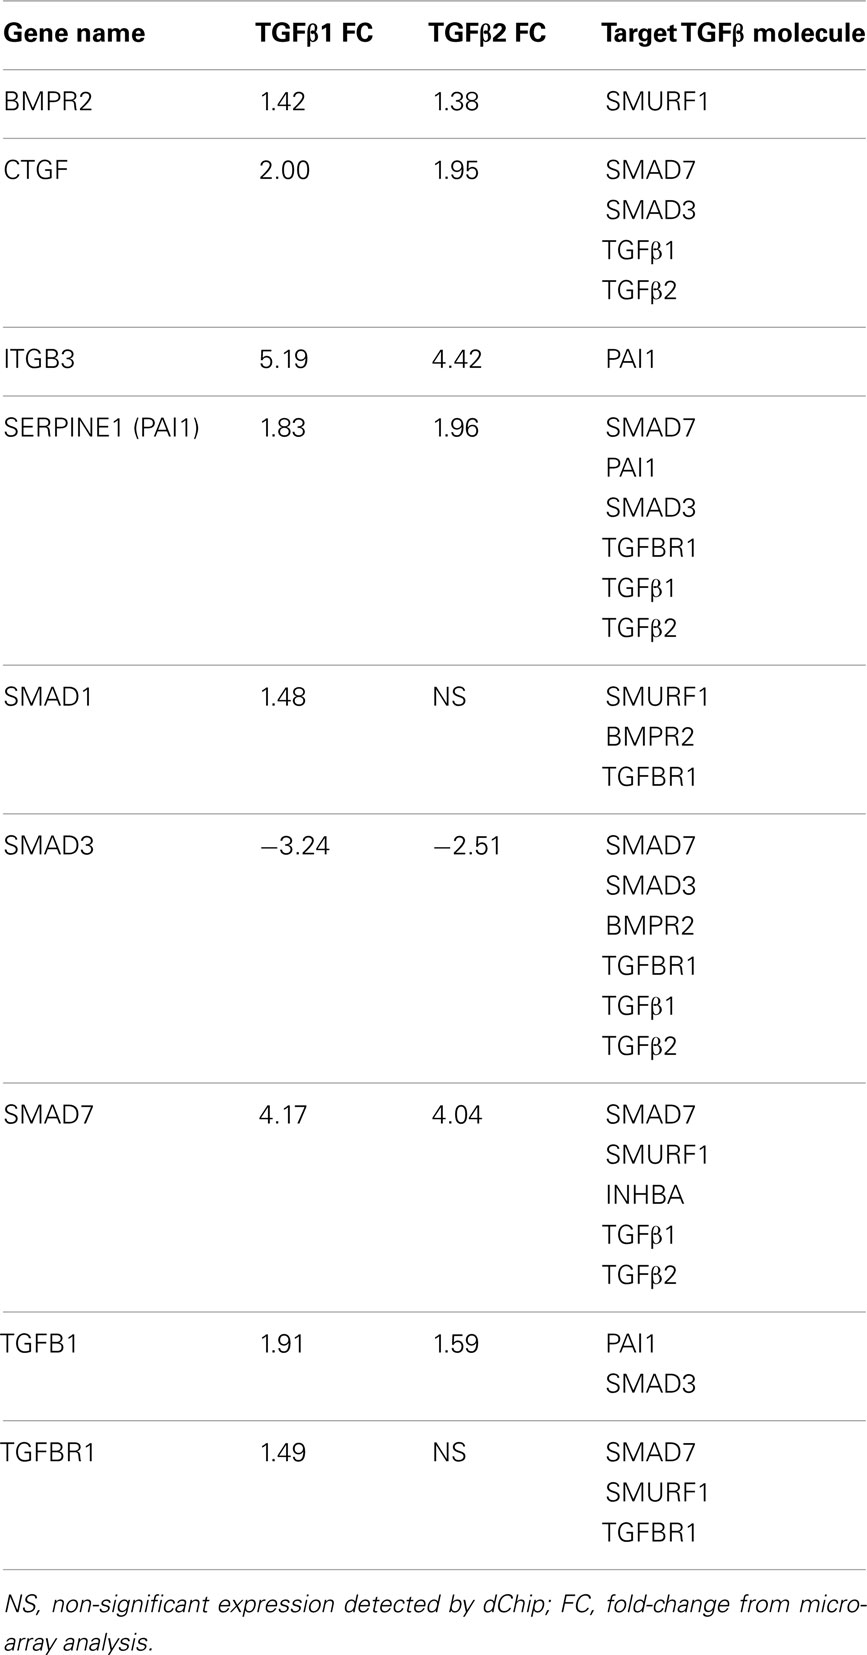
Table 3. List of differentially expressed genes targeting TGFβ signaling molecules.
Following vertical positioning of the palatal shelves along both sides of the tongue, each shelf elevates to a horizontal position above the tongue. In order to explain this reorientation and extension several hypotheses have been proposed, including: mesenchymal proliferation and organization (Jin et al., 2010), mesenchymal and muscular contraction (Innes, 1978), generation of hydrostatic forces by hyaluronan (Goudy et al., 2010), and epithelial reorganization (Babiarz et al., 1979). Taken as a whole, cellular changes within the palatal mesenchyme, which composes the majority of the palatal shelves, governs the optimum growth and elevation of the palatal shelves prior to adherence and fusion (Ito et al., 2003; Iwata et al., 2010, 2011). HEPM cells, which were extracted from a single human abortus at the time of palatal shelf elevation (Yoneda and Pratt, 1981), have previously been used in several studies, including: determining the mechanisms of cleft palate development induced by various teratogens (Dhulipala et al., 2004, 2011), the role of various growth factors active in the regulation of palate development (Takechi et al., 2008), and the teratogenic potential of environmental agents (Watanabe et al., 1990). Therefore, HEPM cells serve as a physiologically relevant model to study differential expression profiling of genes which function in palatal growth, elevation, and extension; which are all indispensable for mammalian palatogenesis.
We analyzed the raw data of scanned GeneChip images using dChip, which normalizes and models the signal values of transcripts in order to accurately detect differential expression with FC values. We set the p-value <0.05 as a cut-off criterion of statistical significance for all raw data analysis. Although the raw signal values of hybridized transcripts, i.e., prior to statistical filtering, exhibited differential expression of more than 12,000 genes in all TGFβ-treated samples (data not shown), TGFβ3 group could not pass the more stringent statistical significance threshold. Therefore, only 8 genes were detected to be differentially expressed in response to TGFβ3 treatment in HEPM cells (Table 1), while expression of more than 500 genes was altered in TGFβ1 and TGFβ2 group. Based on these criteria of microarray data analysis, we concluded that TGFβ3 treatment did not result in significant changes in expression levels of transcriptome of HEPM cells.
There are a number of methods to compare the differential expression of genes in different treatment group using multiple microarray experiments. For several years, Venn diagrams have been shown to be the most effective graphical analysis tool to demonstrate similarities, differences and distinctions within gene sets (Kestler et al., 2005; Pirooznia et al., 2007). In our study, we used Venn diagrams to illustrate the number of altered genes within the HEPM cells in response to TGFβ isoform treatments as overlapping and individual gene numbers (Figure 1). The number of genes differentially expressed by TGFβ2 is much higher than TGFβ3, but less than TGFβ1. This, combined with the observation that TGFβ2 is expressed primarily in the mesenchyme region (Fitzpatrick et al., 1990), indicates its important role within the palatal mesenchyme. Since TGFβ1 is expressed in both the palatal mesenchyme and epithelium, it has been proposed to facilitate cross-talk between the cell types during palate development (Fitzpatrick et al., 1990). Therefore, it is expected that TGFβ1 would affect more genes compared to TGFβ2 and TGFβ3. Surprisingly, the number of genes significantly altered by TGFβ3 was minimal, which may suggest that TGFβ3 is less involved in the regulation of cellular functions of palatal mesenchyme. However, this does not rule out its major role within the MEE during palatogenesis. Meanwhile, the high number of differentially up- and downregulated genes within the intersection regions, particularly between TGFβ1 and TGFβ2, suggests that TGFβ isoforms may simultaneously coordinate the development of the palatal mesenchyme. We identified a strong correlation of gene expression patterns between microarray and qPCR data in terms of up- and downregulation of significantly differentially expressed genes, but not relative level of expression. Expression profiles of all 27 genes tested were found to be in agreement between the two methods (Figure 3), further confirming the reliability of the hybridization-based gene expression assay.
Visualization of the vast amount of microarray data is an essential step for the accurate interpretation of the acquired data. Unsupervised hierarchical clustering presented as a heatmap and dendrogram is a common approach for detecting coexpressed groups of genes (Eisen et al., 1998). The heatmaps of differentially expressed genes according to cellular biofunctions allowed us to detect progressively and distinctly up- or downregulated genes. The heatmaps also showed us that most of the genes altered significantly in response to TGFβ1 and TGFβ2 followed a very similar pattern, unlike TGFβ3, which effected gene expression to a lower extent in the HEPM cells (Figure 4).
There were 27 genes grouped as the most significantly altered, in which 13 of them were upregulated and 14 of them were downregulated, in response to TGFβ stimulation (Table 2). Although, not all of them presented a direct/indirect relation with TGFβ molecule according to IPA (Figure 2), here, we provide their potential interaction with TGFβ and/or cleft palate based on most recent literature review. Further detailed discussion of all 27 genes can be found at Table A3 in Appendix.
In our study, AMIGO2 was the most significantly upregulated gene in TGFβ-treated HEPM cells. In a recent study by Gimelli et al. (2011), it has been shown that a patient exhibiting cleft palate, mental retardation, and high myopia carries a de novo 12q13.11 microdeletion, which harbors 16 genes including AMIGO2. This genetic analysis shows that AMIGO2 might have a role in one of the symptoms mentioned above, including cleft palate.
Several studies showed that TGFβ1 regulates expression of NOX4 in airway smooth muscle cells (Sturrock et al., 2006), cardiac fibroblasts (Cucoranu et al., 2005), renal epithelial cells (Rhyu et al., 2005), and keratinocytes (Davies et al., 2005). Upregulated expression of Nox4 in palatal mesenchyme may assign a crucial role to Nox4 during palate development under TGFβ regulation.
In our study, TGFβ treatment induced high-level expression of TNFAIP6 and HAPLN1, both hyaluronan-related genes, in the palatal mesenchyme, which may suggest that TGFβ mediates hyaluronan production required for palatal shelf reorientation and extension.
Expression levels of two Wnt-mediated genes, DAPPER1 (DACT1) and ANKRD1 (CARP) genes were upregulated in response to TGFβ treatment. During embryonic development, TGFβ and Wnt signaling exhibit synergistic effects (Letamendia et al., 2001; Lei et al., 2004; Deng et al., 2008; Owens et al., 2008; Micalizzi et al., 2010), and both DAPPER1 and ANKRD1 are involved in both of these pathways (Waxman et al., 2004; Labbe et al., 2007; Su et al., 2007). Based on our detection of their upregulated expression, we suggest that these genes may serve as mediators of cross-talk between TGFβ and Wnt signaling during palate development.
PMEPA1 is a TGFβ-induced transmembrane protein (Brunschwig et al., 2003) and was upregulated following TGFβ stimulation. Although PMEPA1’s distinct role in development has not been studied yet, its upregulated expression and association with TGFβ make it an important candidate for the regulation of palatal mesenchyme development.
EDN1, which is a candidate for non-syndromic orofacial cleft disease based on evidence from linkage analysis and mouse model knockouts (Kurihara et al., 1994; Sato et al., 2008), was also upregulated. Thus, we suggest that TGFβ isoforms may regulate the expression of EDN1 and/or its transcriptional activators, which requires further elucidation.
The vitamin D receptor (VDR), which encodes the nuclear hormone receptor for vitamin D3, was also highly stimulated by TGFβ treatment (Table 2). The TGFβ and vitamin D signaling pathways are involved in synergistic and antagonistic cross-talk, in a tissue-specific manner, facilitated through the binding of SMAD3 and VDR to their associated binding sites (Yanagisawa et al., 1999; Subramaniam et al., 2001). Given its role as a mediator in normal physiology and its high-level expression in response to TGFβ treatment, we propose that VDR mediates the communication between TGFβ and Vitamin D during palatogenesis. Further verification of this intermediation may also shed light on the importance of Vitamin D as an environmental etiological factor of cleft palate.
It has been proposed that palatal shelf elevation can be driven by the growth (and movement) of the facial skeletal muscles inducing mechanotransduction pathways, which in turn regulate cytoskeleton remodeling, cell proliferation, and tissue differentiation (Innes, 1978; Farge, 2011). MSC (musculin), also known as MyoR, is a basic helix-loop-helix (bHLH)-type transcriptional regulator of myogenesis; and we detected its expression as upregulated with TGFβ treatment. Considering its capability of binding to the E-box element and muscular movement during palatogenesis, we postulate that MSC and TGFβ isoforms can modulate each other’s expression in a feedback loop during palate formation.
In a study conducted by Vogel et al. (2010), it is documented that TGFβ1 regulates expression of NEDD9, a scaffolding protein, to promote the differentiation of hippocampal and cortical cells into neurons. Similar to TGFβ isoforms, NEDD9 is associated with diverse biological processes including cell attachment, migration, and invasion, as well as apoptosis and cell cycle regulation. Considering its high-level expression observed in palatal mesenchyme, it is conceivable that NEDD9 may mediate crucial processes during palatogenesis in a close relation with TGFβ.
GDF5 is a member of the TGFβ superfamily and is involved in cell adhesion and differentiation of mesenchymal cells to chondrocytes (Takahara et al., 2004). Considering its reduced expression in the embryonic palatal mesenchyme, we hypothesize that TGFβ signaling inhibits GDF5 expression to block the mesenchymal differentiation into ossification centers, in favor of mesenchymal proliferation during palatal growth.
Based on the network analysis, which is developed using the IPA (data not shown), SECTM1 has an indirect relationship with SMAD3 and HGF, both of which were downregulated upon TGFβ treatment. Although, to our knowledge, there is no study available focusing on the role of SECTM1 during development, its downregulated expression in response to TGFβ may be associated with SMAD3’s decreased expression, which may suggest that SECTM1 is regulated under TGFβ signaling.
Human NPTX1 mRNA is exclusively localized to the nervous system during development (Omeis et al., 1996), and promotes apoptosis within the developing cortical neurons in culture (Abad et al., 2006). Although its function during craniofacial development has not been described yet, its significant downregulation in TGFβ-treated HEPM can be explained by requirement for inhibition of cell death during the morphogenesis of palatal mesenchyme.
Another apoptosis-related gene, OAS1 (Hale et al., 2008), was also downregulated with TGFβ treatment. Since the palatal mesenchyme is constantly proliferating and growing during the initial stages of palatogenesis, reduced expression of OAS1, resulting in inhibition of apoptosis, is a required step for the continuous development of the palate.
SMAD3 is one of the intracellular mediators that transduce signals from TGFβ receptors. It has been demonstrated that SMAD2/3 is involved in growth inhibition of mouse embryonic palate mesenchymal cells (MEMP) induced by all-trans retinoic acid (Wang et al., 2009). Our study showing downregulated expression of SMAD3 in response to TGFβ may suggest that SMAD3 is required to be inhibited during palatal development to maintain consistent growth of palatal shelves until attachment.
The VSIG1 gene encodes a member of the junctional adhesion molecule (JAM) family. Since the mesenchymal cells of the palate do not express adherens junction proteins (Nawshad et al., 2004), reduced expression of VSIG1 by TGFβ suggests that regulation of VSIG1 is required for integrity of mesenchymal cells of developing palate.
In epithelial cells, TGFBR3 inhibits TGFβ signaling by preventing the formation of the TGFBR1–TGFBR2 complex, thereby functioning as a potent TGFβ neutralizing agent (Vilchis-Landeros et al., 2001; Eickelberg et al., 2002). For the maintenance of proper communication of TGFβ signaling within the palatal mesenchyme, it is essential that expression levels of TGFBR3 are minimized; thus both TGFβ1 and TGFβ2 treatment facilitated downregulation of TGFBR3.
HGF has been demonstrated to cell growth (Boccaccio et al., 1998), cell motility (Hajjar and Nachman, 1996), and morphogenesis (Sunil et al., 2002) by activating a tyrosine kinase signaling cascade (Porter and Vaillancourt, 1998). In several types of cells, it has been shown that TGFβ, even at low concentrations, significantly reduces HGF production [87; 88]. Based on downregulated expression of HGF, we hypothesize that there is a negative feedback between TGFβ and HGF for the proper development of the palate.
In conclusion, we have determined that more than 2% (n = 566) of the human genes were differentially expressed in palatal mesenchymal cells in response to treatment with TGFβ isoforms. According to GO annotation clustering, 234 of these altered genes (41%) were associated with cellular biofunctions. Nevertheless, only 11 of these transcripts were implicated in craniofacial deformities, which suggest that other etiological factors are correspondingly involved in the development of palatal constituents. Our overall results suggest that both TGFβ1 and TGFβ2 isoforms regulate the expression of genes that govern cellular biofunctions of the palatal mesenchyme; and this regulation is crucial for normal palatogenesis. Further elucidation of the significantly up- and downregulated genes at the protein level will enhance our understanding of the mechanisms controlling palate development; thereby pave the way for prevention of cleft palate during development.
The authors declare that the research was conducted in the absence of any commercial or financial relationships that could be construed as a potential conflict of interest.
This research is supported by NIDCR, NIH grant (R01DE017986) to Dr. Ali Nawshad.
FC, fold change; HEPM, human embryonic palatal mesenchyme; IKB, ingenuity knowledge base; IPA, ingenuity pathway analysis; MEE, medial edge epithelium; TGFβ, transforming growth factor β.
Abad, M. A., Enguita, M., Degregorio-Rocasolano, N., Ferrer, I., and Trullas, R. (2006). Neuronal pentraxin 1 contributes to the neuronal damage evoked by amyloid-beta and is overexpressed in dystrophic neurites in Alzheimer’s brain. J. Neurosci. 26, 12735–12747.
Abbott, B. D., and Pratt, R. M. (1988). Influence of retinoids and EGF on growth of embryonic mouse palatal epithelia in culture. In vitro Cell. Dev. Biol. 24, 343–352.
Ashburner, M., Ball, C. A., Blake, J. A., Botstein, D., Butler, H., Cherry, J. M., Davis, A. P., Dolinski, K., Dwight, S. S., Eppig, J. T., Harris, M. A., Hill, D. P., Issel-Tarver, L., Kasarskis, A., Lewis, S., Matese, J. C., Richardson, J. E., Ringwald, M., Rubin, G. M., and Sherlock, G. (2000). Gene ontology: tool for the unification of biology. The Gene Ontology Consortium. Nat. Genet. 25, 25–29.
Babiarz, B. S., Wee, E. L., and Zimmerman, E. F. (1979). Palate morphogenesis. III. Changes in cell shape and orientation during shelf elevation. Teratology 20, 249–278.
Boccaccio, C., Ando, M., Tamagnone, L., Bardelli, A., Michieli, P., Battistini, C., and Comoglio, P. M. (1998). Induction of epithelial tubules by growth factor HGF depends on the STAT pathway. Nature 391, 285–288.
Bodo, M., Baroni, T., Carinci, F., Becchetti, E., Bellucci, C., Pezzetti, F., Conte, C., Evangelisti, R., and Carinci, P. (1999). TGFbeta isoforms and decorin gene expression are modified in fibroblasts obtained from non-syndromic cleft lip and palate subjects. J. Dent. Res. 78, 1783–1790.
Brunet, C. L., Sharpe, P. M., and Ferguson, M. W. (1995). Inhibition of TGF-beta 3 (but not TGF-beta 1 or TGF-beta 2) activity prevents normal mouse embryonic palate fusion. Int. J. Dev. Biol. 39, 345–355.
Brunschwig, E. B., Wilson, K., Mack, D., Dawson, D., Lawrence, E., Willson, J. K., Lu, S., Nosrati, A., Rerko, R. M., Swinler, S., Beard, L., Lutterbaugh, J. D., Willis, J., Platzer, P., and Markowitz, S. (2003). PMEPA1, a transforming growth factor-beta-induced marker of terminal colonocyte differentiation whose expression is maintained in primary and metastatic colon cancer. Cancer Res. 63, 1568–1575.
Chai, Y., and Maxson, R. E. Jr. (2006). Recent advances in craniofacial morphogenesis. Dev. Dyn. 235, 2353–2375.
Cucoranu, I., Clempus, R., Dikalova, A., Phelan, P. J., Ariyan, S., Dikalov, S., and Sorescu, D. (2005). NAD(P)H oxidase 4 mediates transforming growth factor-beta1-induced differentiation of cardiac fibroblasts into myofibroblasts. Circ. Res. 97, 900–907.
Davies, M., Robinson, M., Smith, E., Huntley, S., Prime, S., and Paterson, I. (2005). Induction of an epithelial to mesenchymal transition in human immortal and malignant keratinocytes by TGF-beta1 involves MAPK, Smad and AP-1 signalling pathways. J. Cell. Biochem. 95, 918–931.
Deng, Z. L., Sharff, K. A., Tang, N., Song, W. X., Luo, J., Luo, X., Chen, J., Bennett, E., Reid, R., Manning, D., Xue, A., Montag, A. G., Luu, H. H., Haydon, R. C., and He, T. C. (2008). Regulation of osteogenic differentiation during skeletal development. Front. Biosci. 13, 2001–2021.
Dhulipala, V. C., Maddali, K. K., Ray, B. K., Welshons, W. V., and Reddy, C. S. (2011). Role of p21 and cyclin E in normal and secalonic acid D-inhibited proliferation of human embryonic palatal mesenchymal cells. Hum. Exp. Toxicol. 30, 1222–1232.
Dhulipala, V. C., Welshons, W. V., and Reddy, C. S. (2004). Inhibition of human embryonic palatal mesenchymal cell cycle by secalonic acid D: a probable mechanism of its cleft palate induction. Orthod. Craniofac. Res. 7, 227–236.
Dixon, M. J., Marazita, M. L., Beaty, T. H., and Murray, J. C. (2011). Cleft lip and palate: understanding genetic and environmental influences. Nat. Rev. Genet. 12, 167–178.
Eickelberg, O., Centrella, M., Reiss, M., Kashgarian, M., and Wells, R. G. (2002). Betaglycan inhibits TGF-beta signaling by preventing type I-type II receptor complex formation. Glycosaminoglycan modifications alter betaglycan function. J. Biol. Chem. 277, 823–829.
Eisen, M. B., Spellman, P. T., Brown, P. O., and Botstein, D. (1998). Cluster analysis and display of genome-wide expression patterns. Proc. Natl. Acad. Sci. U.S.A. 95, 14863–14868.
Fitzpatrick, D. R., Denhez, F., Kondaiah, P., and Akhurst, R. J. (1990). Differential expression of TGF beta isoforms in murine palatogenesis. Development 109, 585–595.
Gehris, A. L., D’Angelo, M., and Greene, R. M. (1991). Immunodetection of the transforming growth factors beta 1 and beta 2 in the developing murine palate. Int. J. Dev. Biol. 35, 17–24.
Gehris, A. L., and Greene, R. M. (1992). Regulation of murine embryonic epithelial cell differentiation by transforming growth factors beta. Differentiation 49, 167–173.
Gentleman, R. C., Carey, V. J., Bates, D. M., Bolstad, B., Dettling, M., Dudoit, S., Ellis, B., Gautier, L., Ge, Y., Gentry, J., Hornik, K., Hothorn, T., Huber, W., Iacus, S., Irizarry, R., Leisch, F., Li, C., Maechler, M., Rossini, A. J., Sawitzki, G., Smith, C., Smyth, G., Tierney, L., Yang, J. Y., and Zhang, J. (2004). Bioconductor: open software development for computational biology and bioinformatics. Genome Biol. 5, R80.
Gimelli, S., Makrythanasis, P., Stouder, C., Antonarakis, S. E., Bottani, A., and Bena, F. (2011). A de novo 12q13.11 microdeletion in a patient with severe mental retardation, cleft palate, and high myopia. Eur. J. Med. Genet. 54, 94–96.
Goudy, S., Law, A., Sanchez, G., Baldwin, H. S., and Brown, C. (2010). Tbx1 is necessary for palatal elongation and elevation. Mech. Dev. 127, 292–300.
Greene, R. M., and Pisano, M. M. (2004). Perspectives on growth factors and orofacial development. Curr. Pharm. Des. 10, 2701–2717.
Greene, R. M., and Pisano, M. M. (2005). Recent advances in understanding transforming growth factor beta regulation of orofacial development. Hum. Exp. Toxicol. 24, 1–12.
Gritli-Linde, A. (2007). Molecular control of secondary palate development. Dev. Biol. 301, 309–326.
Guo, Z., Huang, C., Ding, K., Lin, J., and Gong, B. (2010). Transforming growth factor beta-3 and environmental factors and cleft lip with/without cleft palate. DNA Cell Biol. 29, 375–380.
Hajjar, K. A., and Nachman, R. L. (1996). The role of lipoprotein(a) in atherogenesis and thrombosis. Annu. Rev. Med. 47, 423–442.
Hale, B. G., Randall, R. E., Ortin, J., and Jackson, D. (2008). The multifunctional NS1 protein of influenza A viruses. J. Gen. Virol. 89, 2359–2376.
Handl, J., Knowles, J., and Kell, D. B. (2005). Computational cluster validation in post-genomic data analysis. Bioinformatics 21, 3201–3212.
Innes, P. B. (1978). The ultrastructure of the mesenchymal element of the palatal shelves of the fetal mouse. J. Embryol. Exp. Morphol. 43, 185–194.
Iordanskaia, T., and Nawshad, A. (2011). Mechanisms of transforming growth factor beta induced cell cycle arrest in palate development. J. Cell. Physiol. 226, 1415–1424.
Ito, Y., Yeo, J. Y., Chytil, A., Han, J., Bringas, P. Jr., Nakajima, A., Shuler, C. F., Moses, H. L., and Chai, Y. (2003). Conditional inactivation of Tgfbr2 in cranial neural crest causes cleft palate and calvaria defects. Development 130, 5269–5280.
Iwata, J., Hosokawa, R., Sanchez-Lara, P. A., Urata, M., Slavkin, H., and Chai, Y. (2010). Transforming growth factor-beta regulates basal transcriptional regulatory machinery to control cell proliferation and differentiation in cranial neural crest-derived osteoprogenitor cells. J. Biol. Chem. 285, 4975–4982.
Iwata, J., Parada, C., and Chai, Y. (2011). The mechanism of TGF-beta signaling during palate development. Oral. Dis. 17, 733–744.
Jin, J. Z., Tan, M., Warner, D. R., Darling, D. S., Higashi, Y., Gridley, T., and Ding, J. (2010). Mesenchymal cell remodeling during mouse secondary palate reorientation. Dev. Dyn. 239, 2110–2117.
Kaartinen, V., Voncken, J. W., Shuler, C., Warburton, D., Bu, D., Heisterkamp, N., and Groffen, J. (1995). Abnormal lung development and cleft palate in mice lacking TGF-beta 3 indicates defects of epithelial-mesenchymal interaction. Nat. Genet. 11, 415–421.
Kestler, H. A., Muller, A., Gress, T. M., and Buchholz, M. (2005). Generalized Venn diagrams: a new method of visualizing complex genetic set relations. Bioinformatics 21, 1592–1595.
Kim, M. H., Kim, H. J., Choi, J. Y., and Nahm, D. S. (2003). Transforming growth factor-beta3 gene SfaN1 polymorphism in Korean nonsyndromic cleft lip and palate patients. J. Biochem. Mol. Biol. 36, 533–537.
Kurihara, Y., Kurihara, H., Suzuki, H., Kodama, T., Maemura, K., Nagai, R., Oda, H., Kuwaki, T., Cao, W. H., Kamada, N., Jishage, K., Ouchi, Y., Azuma, S., Toyoda, Y., Ishikawa, T., Kumada, M., and Yazaki, Y. (1994). Elevated blood pressure and craniofacial abnormalities in mice deficient in endothelin-1. Nature 368, 703–710.
Labbe, E., Lock, L., Letamendia, A., Gorska, A. E., Gryfe, R., Gallinger, S., Moses, H. L., and Attisano, L. (2007). Transcriptional cooperation between the transforming growth factor-beta and Wnt pathways in mammary and intestinal tumorigenesis. Cancer Res. 67, 75–84.
Lei, S., Dubeykovskiy, A., Chakladar, A., Wojtukiewicz, L., and Wang, T. C. (2004). The murine gastrin promoter is synergistically activated by transforming growth factor-beta/Smad and Wnt signaling pathways. J. Biol. Chem. 279, 42492–42502.
Letamendia, A., Labbe, E., and Attisano, L. (2001). Transcriptional regulation by Smads: crosstalk between the TGF-beta and Wnt pathways. J. Bone Joint Surg. Am. 83-A (Suppl. 1), S31–S39.
Li, C., and Wong, W. H. (2001). Model-based analysis of oligonucleotide arrays: expression index computation and outlier detection. Proc. Natl. Acad. Sci. U.S.A. 98, 31–36.
Lidral, A. C., and Moreno, L. M. (2005). Progress toward discerning the genetics of cleft lip. Curr. Opin. Pediatr. 17, 731–739.
Lidral, A. C., Romitti, P. A., Basart, A. M., Doetschman, T., Leysens, N. J., Daack-Hirsch, S., Semina, E. V., Johnson, L. R., Machida, J., Burds, A., Parnell, T. J., Rubenstein, J. L., and Murray, J. C. (1998). Association of MSX1 and TGFB3 with nonsyndromic clefting in humans. Am. J. Hum. Genet. 63, 557–568.
Micalizzi, D. S., Farabaugh, S. M., and Ford, H. L. (2010). Epithelial-mesenchymal transition in cancer: parallels between normal development and tumor progression. J. Mammary Gland Biol. Neoplasia 15, 117–134.
Mitchell, L. E., Murray, J. C., O’Brien, S., and Christensen, K. (2001). Evaluation of two putative susceptibility loci for oral clefts in the Danish population. Am. J. Epidemiol. 153, 1007–1015.
Mori, R., Xiong, S., Wang, Q., Tarabolous, C., Shimada, H., Panteris, E., Danenberg, K. D., Danenberg, P. V., and Pinski, J. K. (2009). Gene profiling and pathway analysis of neuroendocrine transdifferentiated prostate cancer cells. Prostate 69, 12–23.
Nakajima, A., Tanaka, E., Ito, Y., Maeno, M., Iwata, K., Shimizu, N., and Shuler, C. F. (2010). The expression of TGF-beta3 for epithelial-mesenchyme transdifferentiated MEE in palatogenesis. J. Mol. Histol. 41, 343–355.
Nawshad, A., Lagamba, D., and Hay, E. D. (2004). Transforming growth factor beta (TGFbeta) signalling in palatal growth, apoptosis and epithelial mesenchymal transformation (EMT). Arch. Oral Biol. 49, 675–689.
Omeis, I. A., Hsu, Y. C., and Perin, M. S. (1996). Mouse and human neuronal pentraxin 1 (NPTX1): conservation, genomic structure, and chromosomal localization. Genomics 36, 543–545.
Owens, P., Han, G., Li, A. G., and Wang, X. J. (2008). The role of Smads in skin development. J. Invest. Dermatol. 128, 783–790.
Pelton, R. W., Hogan, B. L., Miller, D. A., and Moses, H. L. (1990). Differential expression of genes encoding TGFs beta 1, beta 2, and beta 3 during murine palate formation. Dev. Biol. 141, 456–460.
Pfaffl, M. W., Horgan, G. W., and Dempfle, L. (2002). Relative expression software tool (REST) for group-wise comparison and statistical analysis of relative expression results in real-time PCR. Nucleic Acids Res. 30, e36.
Pirooznia, M., Nagarajan, V., and Deng, Y. (2007). GeneVenn – a web application for comparing gene lists using Venn diagrams. Bioinformation 1, 420–422.
Porter, A. C., and Vaillancourt, R. R. (1998). Tyrosine kinase receptor-activated signal transduction pathways which lead to oncogenesis. Oncogene 17, 1343–1352.
Pradervand, S., Paillusson, A., Thomas, J., Weber, J., Wirapati, P., Hagenbuchle, O., and Harshman, K. (2008). Affymetrix whole-transcript human gene 1.0 ST array is highly concordant with standard 3′ expression arrays. BioTechniques 44, 759–762.
Proetzel, G., Pawlowski, S. A., Wiles, M. V., Yin, M., Boivin, G. P., Howles, P. N., Ding, J., Ferguson, M. W., and Doetschman, T. (1995). Transforming growth factor-beta 3 is required for secondary palate fusion. Nat. Genet. 11, 409–414.
Ramalho-Santos, M., Yoon, S., Matsuzaki, Y., Mulligan, R. C., and Melton, D. A. (2002). “Stemness”: transcriptional profiling of embryonic and adult stem cells. Science 298, 597–600.
Reimers, M., and Carey, V. J. (2006). Bioconductor: an open source framework for bioinformatics and computational biology. Meth. Enzymol. 411, 119–134.
Rhyu, D. Y., Yang, Y., Ha, H., Lee, G. T., Song, J. S., Uh, S. T., and Lee, H. B. (2005). Role of reactive oxygen species in TGF-beta1-induced mitogen-activated protein kinase activation and epithelial-mesenchymal transition in renal tubular epithelial cells. J. Am. Soc. Nephrol. 16, 667–675.
Richman, J. M., and Tickle, C. (1989). Epithelia are interchangeable between facial primordia of chick embryos and morphogenesis is controlled by the mesenchyme. Dev. Biol. 136, 201–210.
Rojas, A., Padidam, M., Cress, D., and Grady, W. M. (2009). TGF-beta receptor levels regulate the specificity of signaling pathway activation and biological effects of TGF-beta. Biochim. Biophys. Acta 1793, 1165–1173.
Rotzer, D., Roth, M., Lutz, M., Lindemann, D., Sebald, W., and Knaus, P. (2001). Type III TGF-beta receptor-independent signalling of TGF-beta2 via TbetaRII-B, an alternatively spliced TGF-beta type II receptor. EMBO J. 20, 480–490.
Rullo, R., Gombos, F., Ferraraccio, F., Farina, A., Morano, D., Festa, V. M., Guida, L., Martinelli, M., Scapoli, L., Pezzetti, F., and Carinci, F. (2006). TGFbeta3 expression in non-syndromic orofacial clefts. Int. J. Pediatr. Otorhinolaryngol. 70, 1759–1764.
Salahshourifar, I., Halim, A. S., Wan Sulaiman, W. A., and Zilfalil, B. A. (2011). Contribution of MSX1 variants to the risk of non-syndromic cleft lip and palate in a Malay population. J. Hum. Genet. 16, 755–758.
Sanford, L. P., Ormsby, I., Gittenberger-De Groot, A. C., Sariola, H., Friedman, R., Boivin, G. P., Cardell, E. L., and Doetschman, T. (1997). TGFbeta2 knockout mice have multiple developmental defects that are non-overlapping with other TGFbeta knockout phenotypes. Development 124, 2659–2670.
Sato, T., Kurihara, Y., Asai, R., Kawamura, Y., Tonami, K., Uchijima, Y., Heude, E., Ekker, M., Levi, G., and Kurihara, H. (2008). An endothelin-1 switch specifies maxillomandibular identity. Proc. Natl. Acad. Sci. U.S.A. 105, 18806–18811.
Schutte, B. C., and Murray, J. C. (1999). The many faces and factors of orofacial clefts. Hum. Mol. Genet. 8, 1853–1859.
Sneath, P. H. A. (1973). Numerical Taxonomy: The Principles and Practice of Numerical Classification. San Francisco: Freeman.
Spritz, R. A. (2001). The genetics and epigenetics of orofacial clefts. Curr. Opin. Pediatr. 13, 556–560.
Stoll, C., Mengsteab, S., Stoll, D., Riediger, D., Gressner, A. M., and Weiskirchen, R. (2004). Analysis of polymorphic TGFB1 codons 10, 25, and 263 in a German patient group with non-syndromic cleft lip, alveolus, and palate compared with healthy adults. BMC Med. Genet. 5, 15. doi:10.1186/1471-2350-5-15
Sturrock, A., Cahill, B., Norman, K., Huecksteadt, T. P., Hill, K., Sanders, K., Karwande, S. V., Stringham, J. C., Bull, D. A., Gleich, M., Kennedy, T. P., and Hoidal, J. R. (2006). Transforming growth factor-beta1 induces Nox4 NAD(P)H oxidase and reactive oxygen species-dependent proliferation in human pulmonary artery smooth muscle cells. Am. J. Physiol. Lung Cell Mol. Physiol. 290, L661–L673.
Su, Y., Zhang, L., Gao, X., Meng, F., Wen, J., Zhou, H., Meng, A., and Chen, Y. G. (2007). The evolutionally conserved activity of Dapper2 in antagonizing TGF-beta signaling. FASEB J. 21, 682–690.
Subramaniam, N., Leong, G. M., Cock, T. A., Flanagan, J. L., Fong, C., Eisman, J. A., and Kouzmenko, A. P. (2001). Cross-talk between 1,25-dihydroxyvitamin D3 and transforming growth factor-beta signaling requires binding of VDR and Smad3 proteins to their cognate DNA recognition elements. J. Biol. Chem. 276, 15741–15746.
Sunil, N., Bennett, J. M., and Haslam, S. Z. (2002). Hepatocyte growth factor is required for progestin-induced epithelial cell proliferation and alveolar-like morphogenesis in serum-free culture of normal mammary epithelial cells. Endocrinology 143, 2953–2960.
Takahara, M., Harada, M., Guan, D., Otsuji, M., Naruse, T., Takagi, M., and Ogino, T. (2004). Developmental failure of phalanges in the absence of growth/differentiation factor 5. Bone 35, 1069–1076.
Takechi, R., Taniguchi, A., Ebara, S., Fukui, T., and Watanabe, T. (2008). Biotin deficiency affects the proliferation of human embryonic palatal mesenchymal cells in culture. J. Nutr. 138, 680–684.
Vieira, A. R., Orioli, I. M., Castilla, E. E., Cooper, M. E., Marazita, M. L., and Murray, J. C. (2003). MSX1 and TGFB3 contribute to clefting in South America. J. Dent. Res. 82, 289–292.
Vilchis-Landeros, M. M., Montiel, J. L., Mendoza, V., Mendoza-Hernandez, G., and Lopez-Casillas, F. (2001). Recombinant soluble betaglycan is a potent and isoform-selective transforming growth factor-beta neutralizing agent. Biochem. J. 355, 215–222.
Vogel, T., Ahrens, S., Buttner, N., and Krieglstein, K. (2010). Transforming growth factor beta promotes neuronal cell fate of mouse cortical and hippocampal progenitors in vitro and in vivo: identification of Nedd9 as an essential signaling component. Cereb. Cortex 20, 661–671.
Wang, M., Huang, H., and Chen, Y. (2009). Smad2/3 is involved in growth inhibition of mouse embryonic palate mesenchymal cells induced by all-trans retinoic acid. Birth Defects Res. Part A Clin. Mol. Teratol. 85, 780–790.
Watanabe, T., Willis, W. D., and Pratt, R. M. (1990). Effect of retinoids on proliferation of human embryonic palatal mesenchymal cells in culture. J. Nutr. Sci. Vitaminol. 36, 311–325.
Waxman, J. S., Hocking, A. M., Stoick, C. L., and Moon, R. T. (2004). Zebrafish Dapper1 and Dapper2 play distinct roles in Wnt-mediated developmental processes. Development 131, 5909–5921.
Wilkie, A. O., and Morriss-Kay, G. M. (2001). Genetics of craniofacial development and malformation. Nat. Rev. Genet. 2, 458–468.
Wyszynski, D. F. (2002). Cleft Lip and Palate: From Origin to Treatment. New York: Oxford University Press.
Yanagisawa, J., Yanagi, Y., Masuhiro, Y., Suzawa, M., Watanabe, M., Kashiwagi, K., Toriyabe, T., Kawabata, M., Miyazono, K., and Kato, S. (1999). Convergence of transforming growth factor-beta and vitamin D signaling pathways on SMAD transcriptional coactivators. Science 283, 1317–1321.
Yoneda, T., and Pratt, R. M. (1981). Mesenchymal cells from the human embryonic palate are highly responsive to epidermal growth factor. Science 213, 563–565.
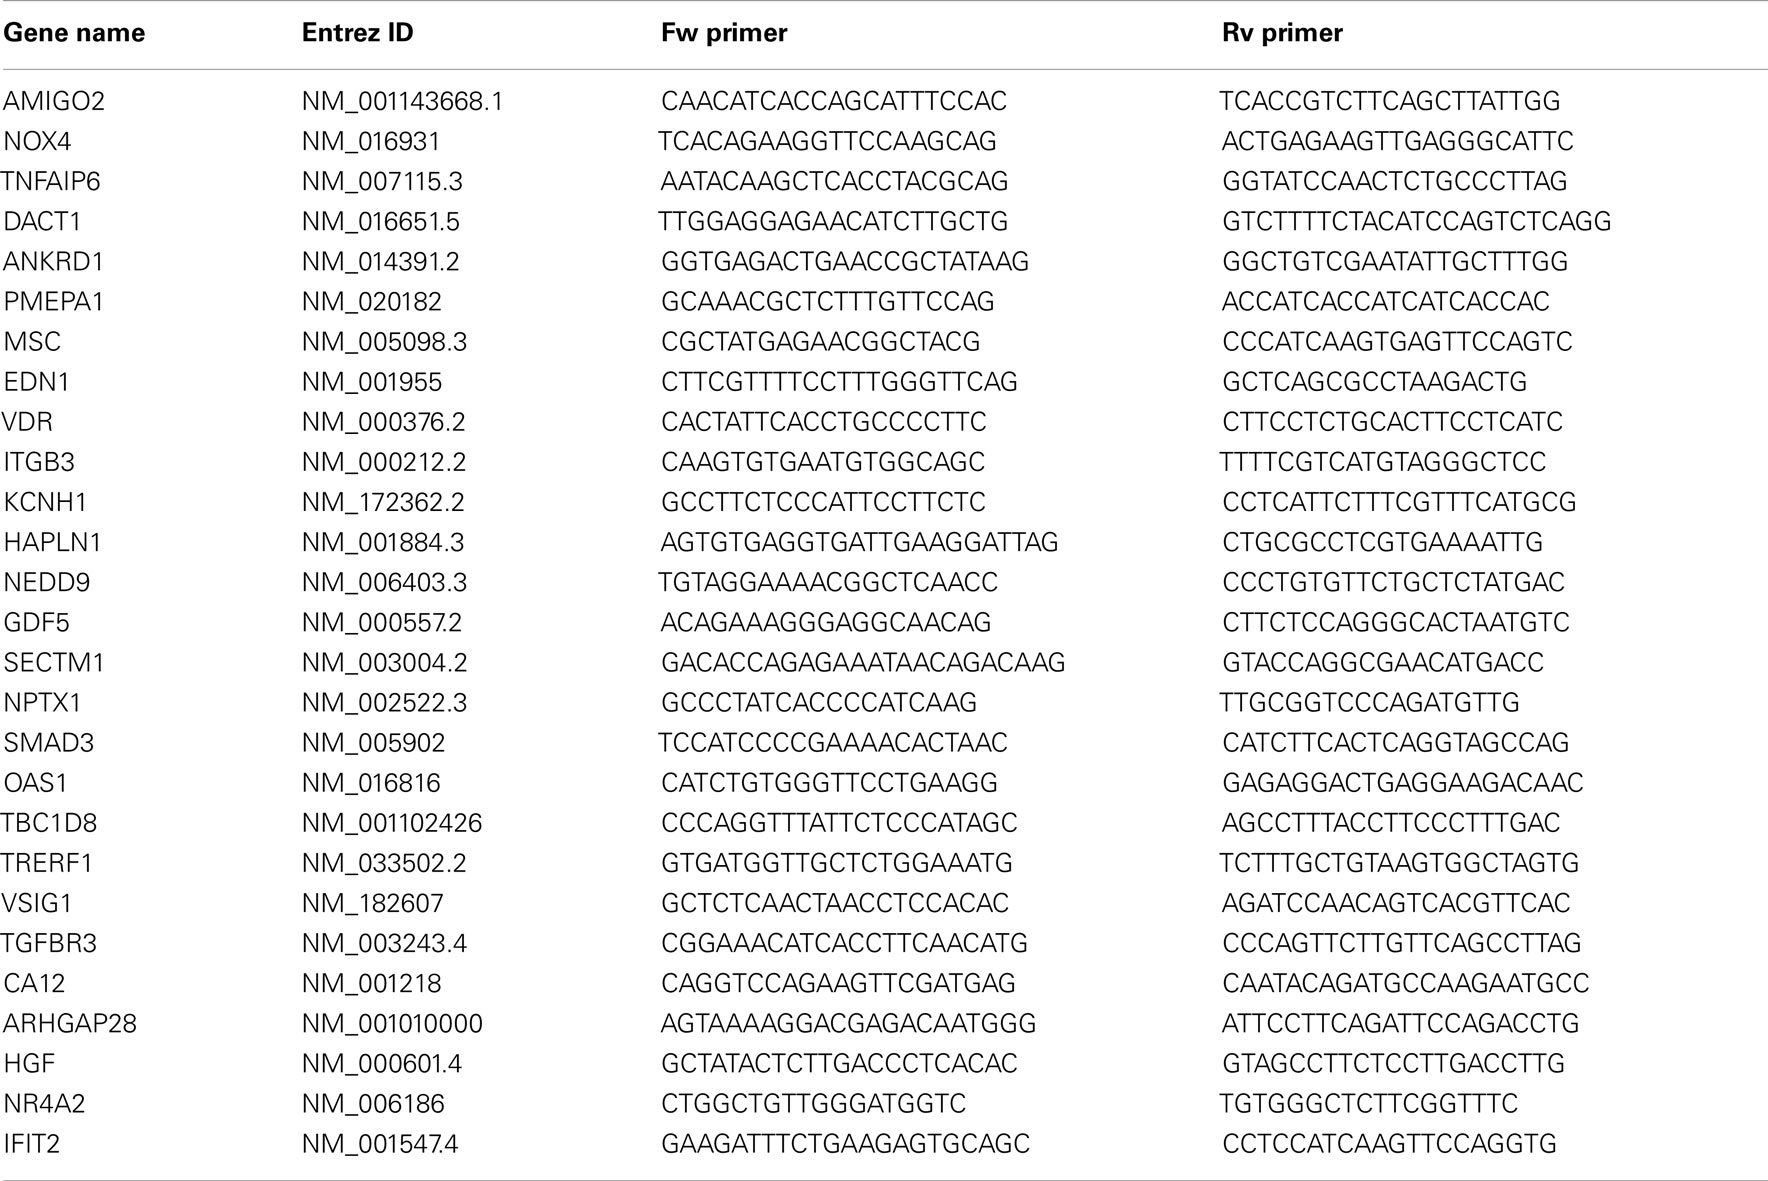
Table A1. Primers for q-RTPCR.
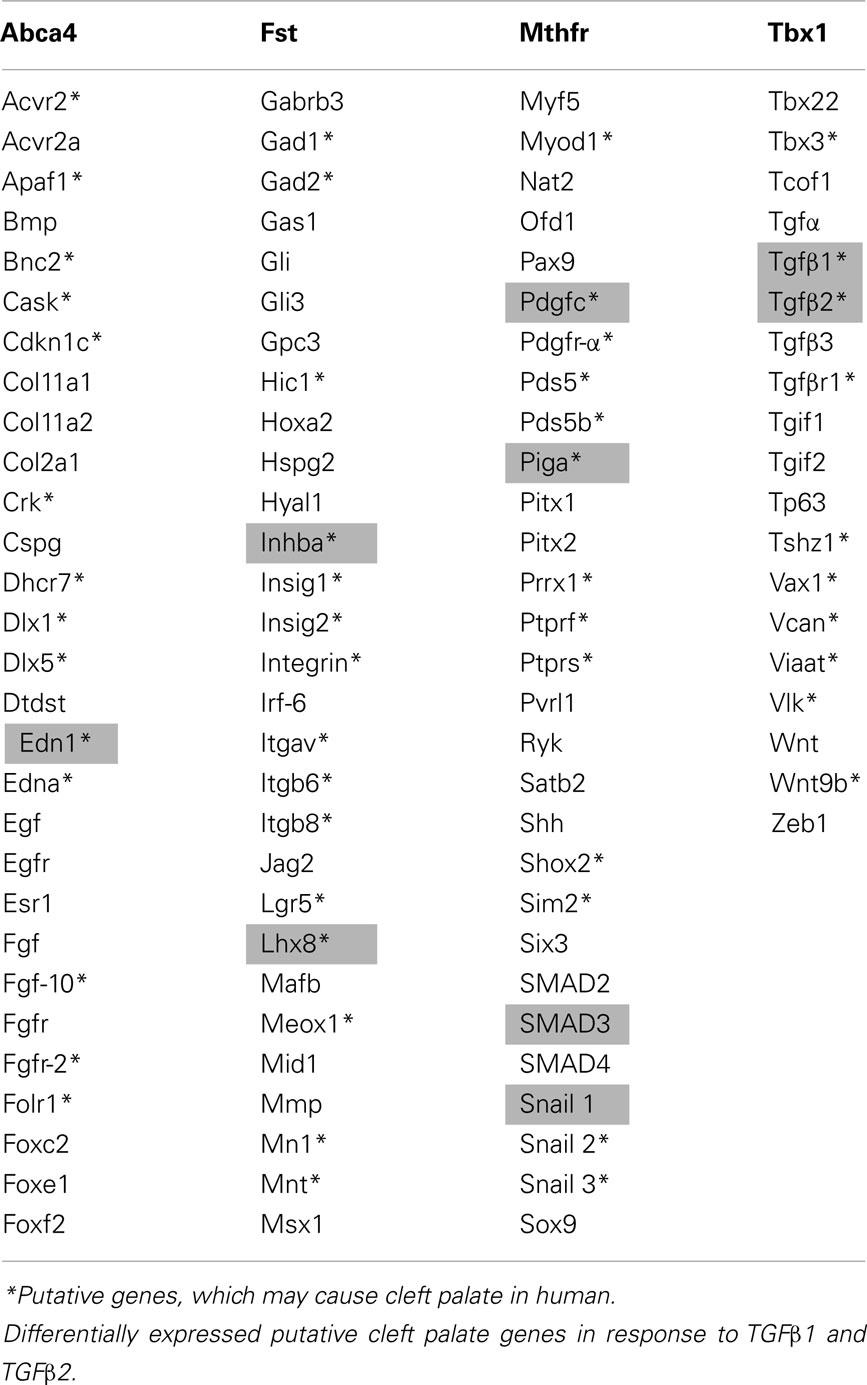
Table A2. Genes susceptible for cleft palate.
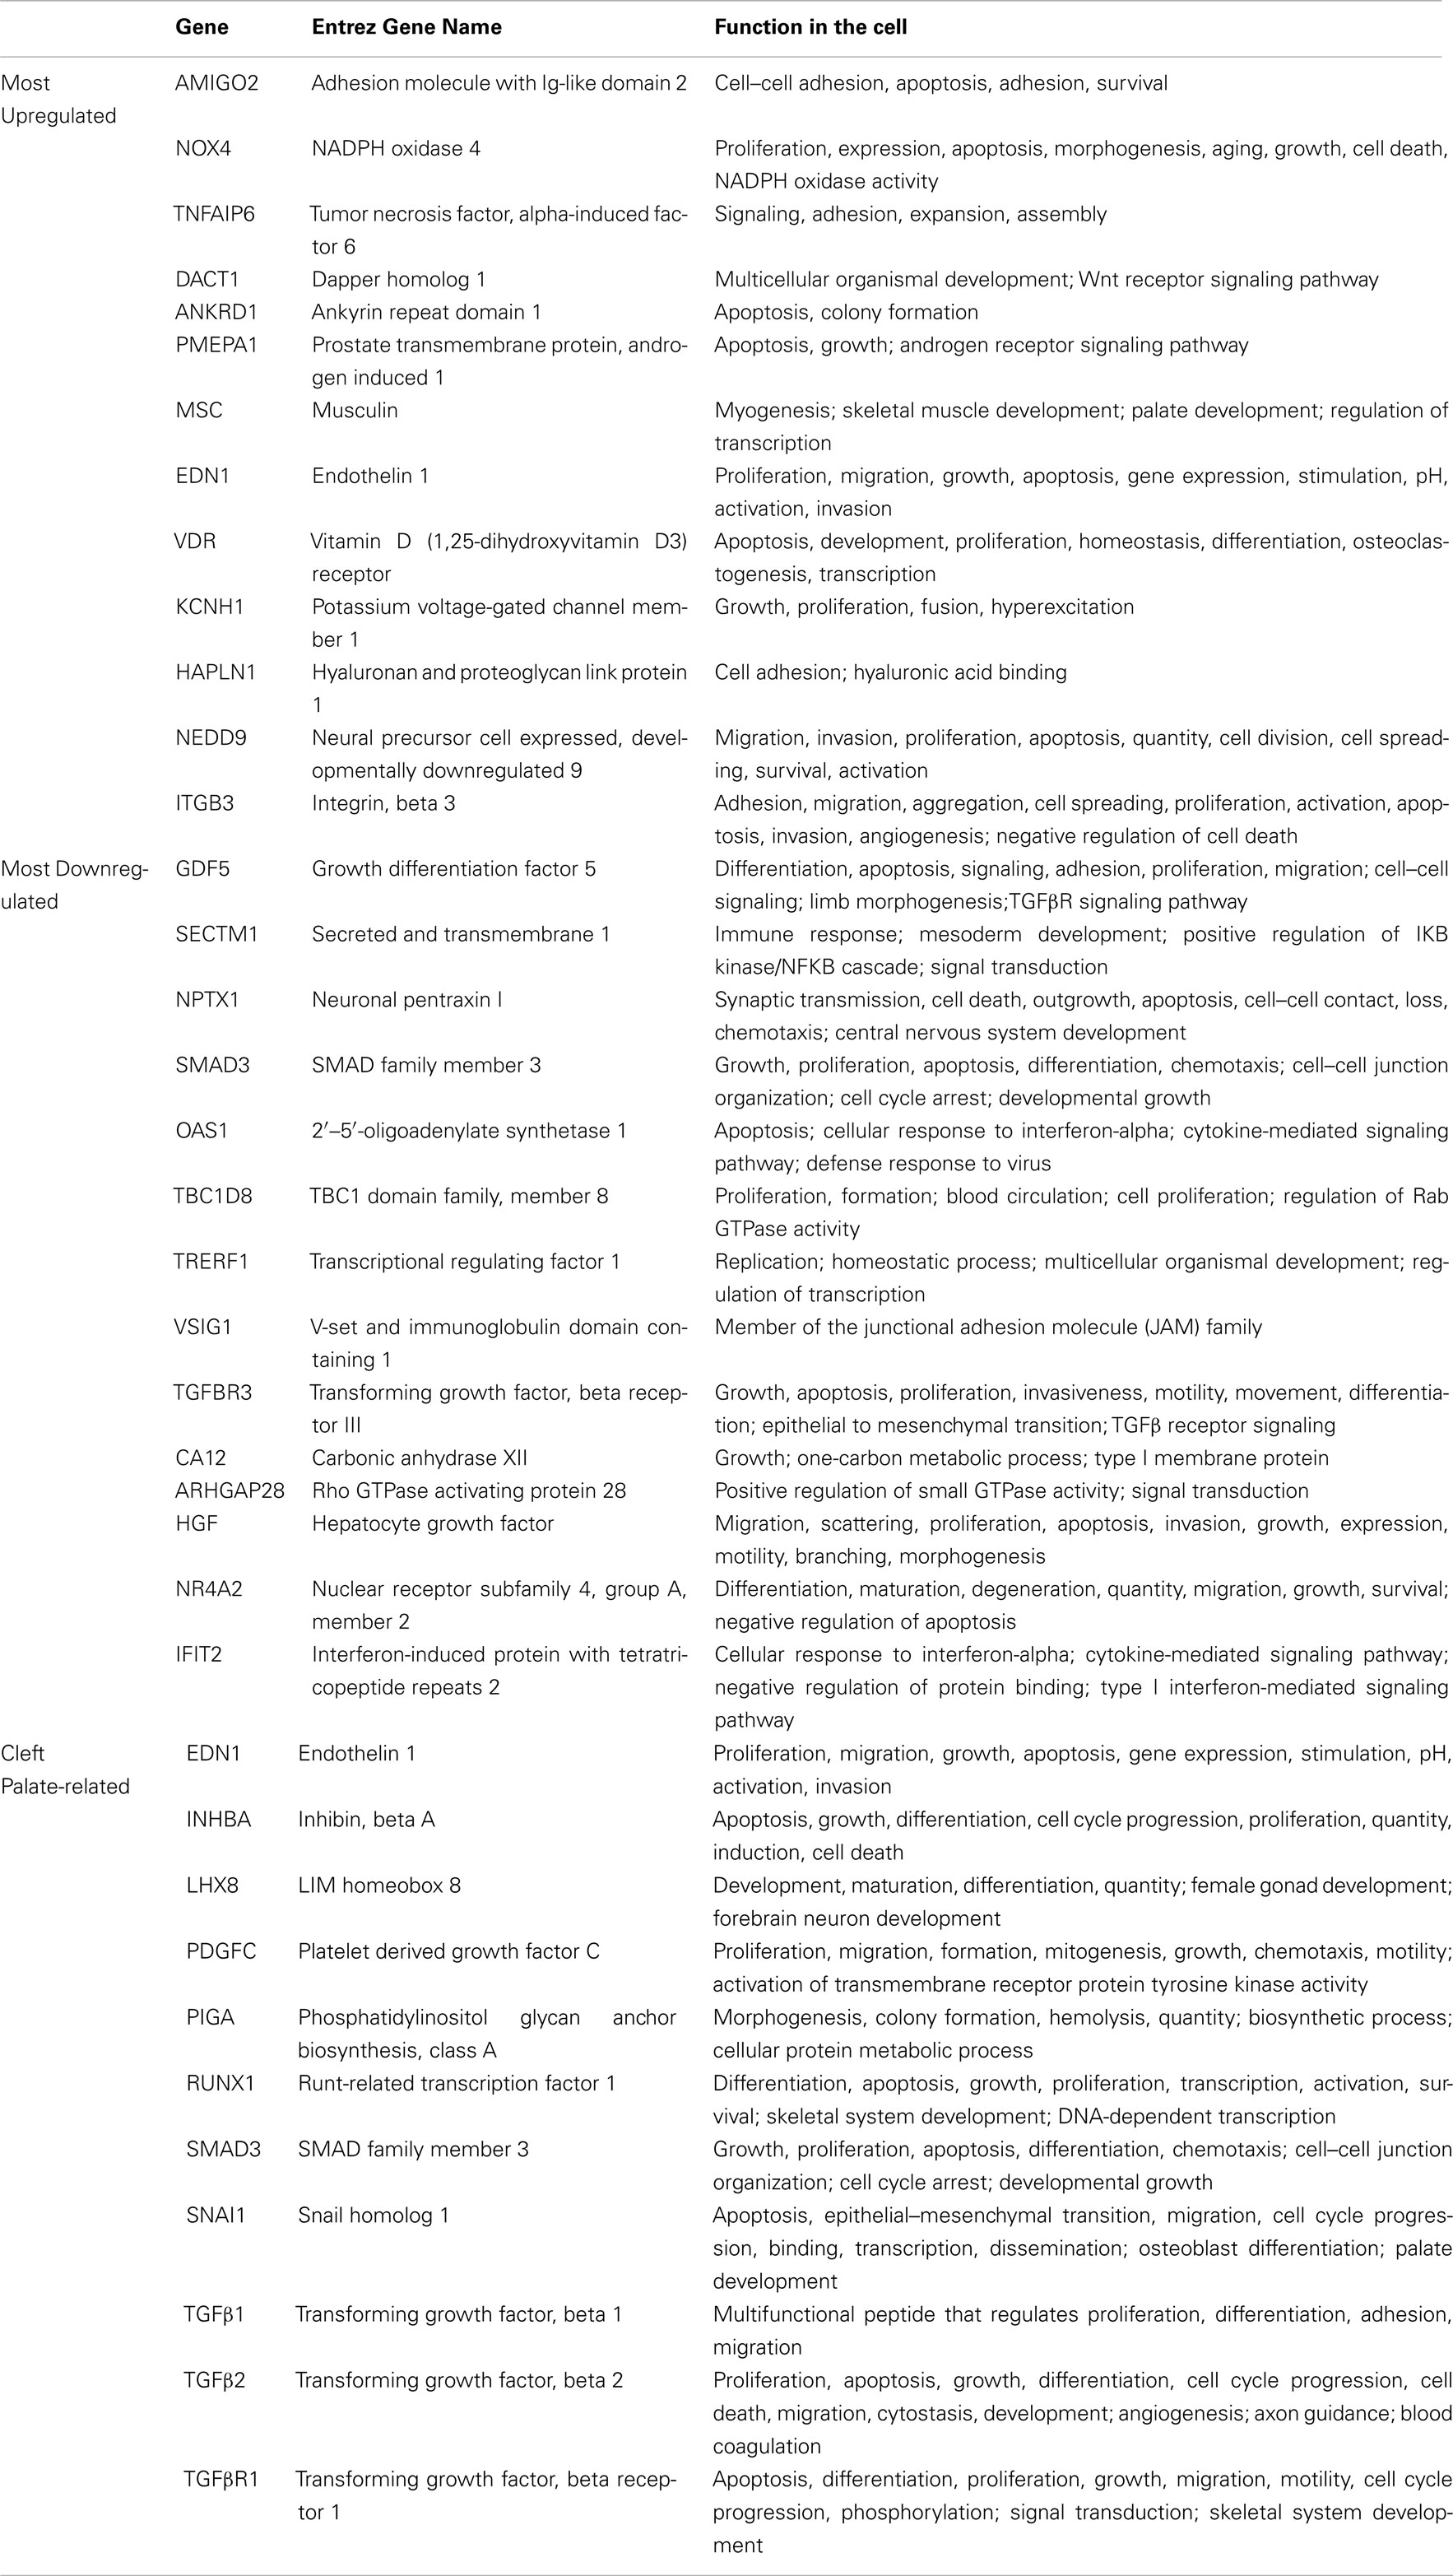
Table A3. Details of the most significantly altered genes within the palatal mesenchyme.
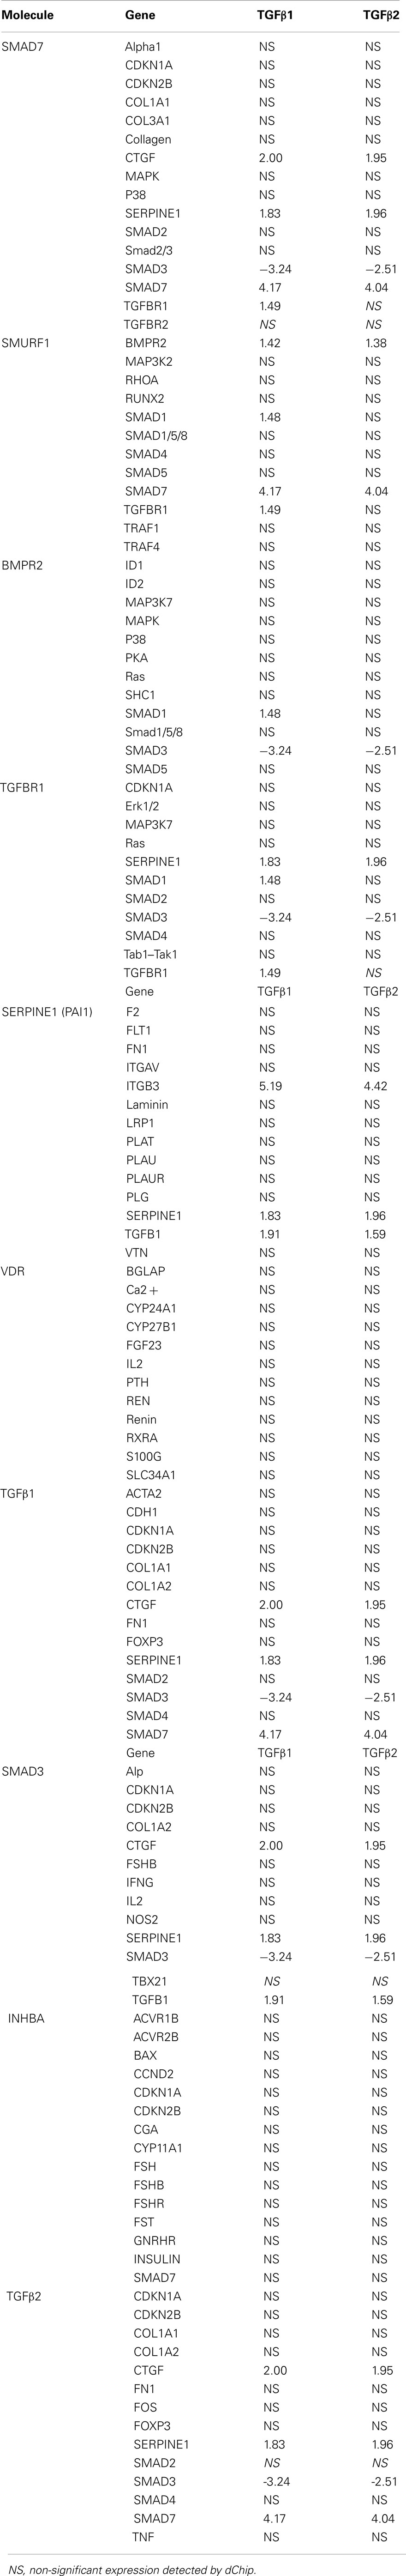
Table A4. The full list of genes regulated by differentially expressed TGFβ signaling molecules and their level of altered expression.
Keywords: TGFβ, microarray, transcriptome, palatogenesis, mesenchyme, HEPM, craniofacial, palate
Citation: Zhu X, Ozturk F, Pandey S, Guda CB and Nawshad A (2012) Implications of TGFβ on transcriptome and cellular biofunctions of palatal mesenchyme. Front. Physio. 3:85. doi: 10.3389/fphys.2012.00085
Received: 23 December 2011; Accepted: 21 March 2012;
Published online: 10 April 2012.
Edited by:
Daniel Graf, University of Zurich, SwitzerlandReviewed by:
Xiu-Ping Wang, Harvard School of Dental Medicine, USACopyright: © 2012 Zhu, Ozturk, Pandey, Guda and Nawshad. This is an open-access article distributed under the terms of the Creative Commons Attribution Non Commercial License, which permits non-commercial use, distribution, and reproduction in other forums, provided the original authors and source are credited.
*Correspondence: Ali Nawshad, Department of Oral Biology, College of Dentistry, University of Nebraska Medical Center, 40th and Holdrege Street, Lincoln, NE 68583, USA. e-mail:YW5hd3NoYWRAdW5tYy5lZHU=
†Xiujuan Zhu and Ferhat Ozturk have contributed equally to this work.
Disclaimer: All claims expressed in this article are solely those of the authors and do not necessarily represent those of their affiliated organizations, or those of the publisher, the editors and the reviewers. Any product that may be evaluated in this article or claim that may be made by its manufacturer is not guaranteed or endorsed by the publisher.
Research integrity at Frontiers
Learn more about the work of our research integrity team to safeguard the quality of each article we publish.