- Biomedical Engineering Department, University of Southern California, Los Angeles, CA, USA
Long-term exposure to intermittent hypoxia and sleep fragmentation introduced by recurring obstructive sleep apnea (OSA) has been linked to subsequent cardiovascular disease and Type 2 diabetes. The underlying mechanisms remain unclear, but impairment of the normal interactions among the systems that regulate autonomic and metabolic function is likely involved. We have extended an existing integrative model of respiratory, cardiovascular, and sleep–wake state control, to incorporate a sub-model of glucose–insulin–fatty acid regulation. This computational model is capable of simulating the complex dynamics of cardiorespiratory control, chemoreflex and state-related control of breath-to-breath ventilation, state-related and chemoreflex control of upper airway potency, respiratory and circulatory mechanics, as well as the metabolic control of glucose–insulin dynamics and its interactions with the autonomic control. The interactions between autonomic and metabolic control include the circadian regulation of epinephrine secretion, epinephrine regulation on dynamic fluctuations in glucose and free-fatty acid in plasma, metabolic coupling among tissues and organs provided by insulin and epinephrine, as well as the effect of insulin on peripheral vascular sympathetic activity. These model simulations provide insight into the relative importance of the various mechanisms that determine the acute and chronic physiological effects of sleep-disordered breathing. The model can also be used to investigate the effects of a variety of interventions, such as different glucose clamps, the intravenous glucose tolerance test, and the application of continuous positive airway pressure on OSA subjects. As such, this model provides the foundation on which future efforts to simulate disease progression and the long-term effects of pharmacological intervention can be based.
Introduction
The current obesity epidemic is contributing to the increasing prevalence of the “metabolic syndrome,” the clustering of symptoms that include insulin resistance, hypertension, and dyslipidemia (Reilly and Rader, 2003). The components of metabolic syndrome individually or collectively constitute high-risk factors for cardiovascular disease and Type 2 diabetes. Since obstructive sleep apnea (OSA) commonly occurs among obese individuals, there is a growing recognition of the possibility that OSA may constitute an independent risk factor for the metabolic syndrome (Tasali and Ip, 2008). Indeed, OSA has been found to be strongly associated with insulin resistance (Punjabi et al., 2002), Type 2 diabetes (Chasens, 2007), as well as hypertension and various kinds of cardiovascular disease (Reaven, 1980). The causal pathways that link OSA to hypertension and insulin resistance remain unclear. However, it has been demonstrated that exposure to intermittent hypoxia (IH) in humans can lead to prolonged elevation of muscle sympathetic nerve activity following termination of the chemical stimulation (Xie et al., 2000). As well, in an elegant canine model, artificially induced periodic airway obstruction during sleep led to sustained elevation of daytime blood pressure after several weeks of nocturnal exposure (Brooks et al., 1997). Thus, a plausible scenario is that the sympathetic overactivity resulting from OSA leads to increased catecholamine release, which produces hyperglycemia and, in turn, hyperinsulinemia, which promotes insulin resistance. Increased sympathetic activity is also known to stimulate lipolysis from adipose tissue and thus contribute to the elevation of circulating free-fatty acids (FFAs; Bamshad et al., 1998). Increased FFAs impair net glucose uptake by the tissues, contributing further to the hyperglycemia and hyperinsulinemia (Roy and Parker, 2006). Since hyperinsulinemia stimulates sympathetic activity, a vicious cycle could well develop that leads to worsening autonomic function and insulin resistance.
As mentioned in our previous work (Cheng et al., 2010), many simulation models of cardiovascular and respiratory systems have been developed since 1950s and some models were designed for special disorders in cardiorespiratory physiology but very few were involved in the interactions between these systems and none of them have studied the interactions of cardiorespiratory response with sleep. Also, over the past several decades, a large number of mathematical models of glucose and insulin dynamics have appeared in the literature. Most of the earlier models were aimed at gaining a better understanding of glucose–insulin dynamics during diagnostic tests (Himsworth and Ker, 1939; Steele, 1959; Bolie, 1961; Ackerman et al., 1965; Andres et al., 1966; DeFronzo et al., 1979). The models employed primarily for purposes of parameter estimation have generally been simple in terms of the small number of free parameters, such as Bergman’s minimal model (Bergman et al., 1979) and Turner’s homeostatic model assessment (HOMA, Turner et al., 1979). However, there are also many models that have more complex structures, such as those used for quantifying β-cell mass, glucose disappearance, β-cell glucose sensitivity, and insulin secretion and resistance (Srinivasan et al., 1970; Sherwin et al., 1974; Insel et al., 1975; Howard et al., 1984; Berger and Rodbard, 1989; Bergman, 1989; Berman et al., 1993; Genter et al., 1998; Bergman et al., 2006). Some of these models have been designed to account for glucose–insulin dynamics observed in subjects with Type 1 diabetes (Skowronski et al., 1991; Parker et al., 1999; Porksen et al., 2002). Other models also incorporate the dynamics of fatty acids (Skowronski et al., 1991; Nolan et al., 2006; Hucking et al., 2007). Most of these models are useful in providing better insight into metabolic regulation and for developing therapeutic approaches to Type 1 and Type 2 diabetes, but none have taken into account the potential mechanisms with which autonomic dysfunction may contribute to metabolic dysfunction and vice versa. To date, we know of no other modeling study that has linked cardiovascular autonomic and respiratory control with metabolic control, especially in the context of sleep-disordered breathing.
As a first exploration of the hypothesis that the sympathetic nervous system may be the crucial factor that lies at the center of the causal pathways that link OSA to hypertension and metabolic dysfunction, we extended our existing integrative model of respiratory, cardiovascular, and sleep regulation (Cheng et al., 2010) to incorporate a sub-model of metabolic function, capable of simulating the dynamics of glucose–insulin, and FFA dynamics in wakefulness and sleep. The extended model includes features such as the circadian regulation of sympathetic nervous activity and epinephrine secretion, and the effects of epinephrine on the dynamic fluctuations of glucose and FFA in plasma. The extended model also incorporates the effect of hyperinsulinemia on the peripheral sympathetic nervous system.
Materials and Methods
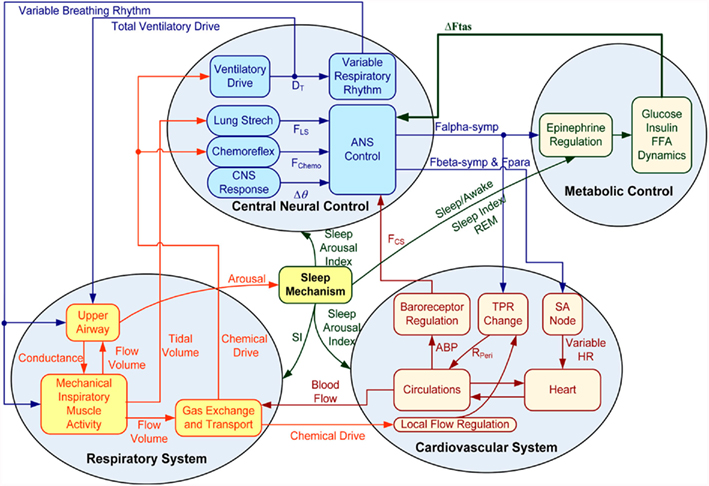
Our existing comprehensive model of sleep-cardiorespiratory control, heretofore referred to as “PNEUMA,” includes the autonomic control of the cardiovascular system, chemoreflex and state-related control of breath-to-breath ventilation, state-related and chemoreflex control of upper airway potency, as well as respiratory and circulatory mechanics. It provides realistic predictions of the physiological responses under a wide variety of conditions, including the day-to-day sleep–wake cycle, hypoxia-induced periodic breathing, Cheyne–Stokes respiration in chronic heart failure, and OSA. It can be used to investigate the effects of virtual experiments and interventions such as isocapnic and hypercapnic and/or hypoxic gas administration, the Valsalva and Mueller maneuvers, and the application of continuous positive airway pressure (CPAP) on OSA patients. A detailed account of “PNEUMA” is given in Cheng et al. (2010).
To better understand the causal link between OSA and insulin resistance, it is necessary to extend “PNEUMA” to include a metabolic model of glucose and insulin that involves with energy metabolism and its interaction with the autonomic function. One of the most widely used and validated models of glucose and insulin dynamics is the three compartment minimal model method by Bergman et al. (1981), which is commonly used to estimate insulin sensitivity from an intravenous glucose tolerance test (IVGTT). The model is “minimal” in the sense that it is sufficiently complex enough to characterize the key features of the dynamic interaction between glucose and insulin, and yet simple enough to be fully estimated from blood measurements of insulin and glucose in individual subjects. It provides a sufficient level of complexity for characterizing glucose and insulin dynamics in our large-scale model with minimum numbers of model parameters, while the other metabolic models are either too simple or too complex. FFA provides about 90% of the muscle energy at rest and FFA has been shown to play an important role in glucose and insulin dynamics in last three decades (Randle et al., 1988; Rebrin et al., 1995). However, the metabolic regulation of FFA and its incorporation with glucose and insulin has been largely ignored by others. The extended minimal model (Roy and Parker, 2006) takes into account the contribution of FFA metabolism and its interaction with glucose and insulin, thereby allowing the synthesis “lipid-based” metabolic models with meals. For this reason, we have based our metabolic regulation sub-model on the Roy–Parker extended minimal model. Furthermore, it is known that sympathetic activation affects glucose and FFA metabolism. In this model, we postulate that sympathetic activity directly affects plasma epinephrine levels, and that epinephrine modulates glucose and FFA metabolism via mechanisms modeled by Kim et al. (2006).
The model of glucose dynamics employed here is a modified version of the minimal model by Bergman et al. (1981). Plasma glucose disappearance occurs in the peripheral tissues by oxidation and in the liver mainly by glycogenesis. The dynamics of glucose metabolism is given by Eq. 1, where G(t) is the plasma glucose concentration, X(t) is “remote” insulin action that accelerates glucose utilization in the peripheral tissues and liver and inhibits hepatic glucose production, Z(t) is the plasma FFA concentration and is described in the FFA dynamics section, subscript “b” stands for basal level, u2int(t) is the internal glucose flux rate, u2ext(t) is the glucose external input rate that could be food intake or external infusion rate of glucose, and VolG is the glucose distribution space.

Plasma insulin dynamics is described using a two-compartment model with three first-order functions given by Eqs 2–4 below, where I(t) is the plasma insulin concentration, X(t) is time-course of insulin action which presents a receptor for insulin in periphery, Y(t) is added in the extended minimal model to represent the insulin in peripheral tissues that promotes FFA storage and inhibits FFA release from adipose tissue into the circulations, Gh is the threshold glucose concentration, TDi is the variable time delay, and u1(t) is the external input rate for the insulin model.


Although FFA metabolism accounts for most of the energy production in the body at rest, the role of FFA has been overlooked in most models of glucose–insulin regulation. To incorporate the contribution of FFA in metabolic control, we employed the model introduced by Roy and Parker (2006). A schematic diagram of the dynamics of FFA and the interactions among glucose, insulin, and FFA is displayed in Figure 1; the model is characterized by Eqs 5–7 below, where F(t) is the FFA concentration in plasma, Z(t) is the additional first-order filter, acting as the remote plasma FFA concentration that promotes the glucose uptake, subscript b represents basal level in the plasma, u3int(t) is the internal FFA flux rate, and u3ext(t) is the external FFA uptake rate. Table 1 provides a detailed listing of all model parameters and their values.
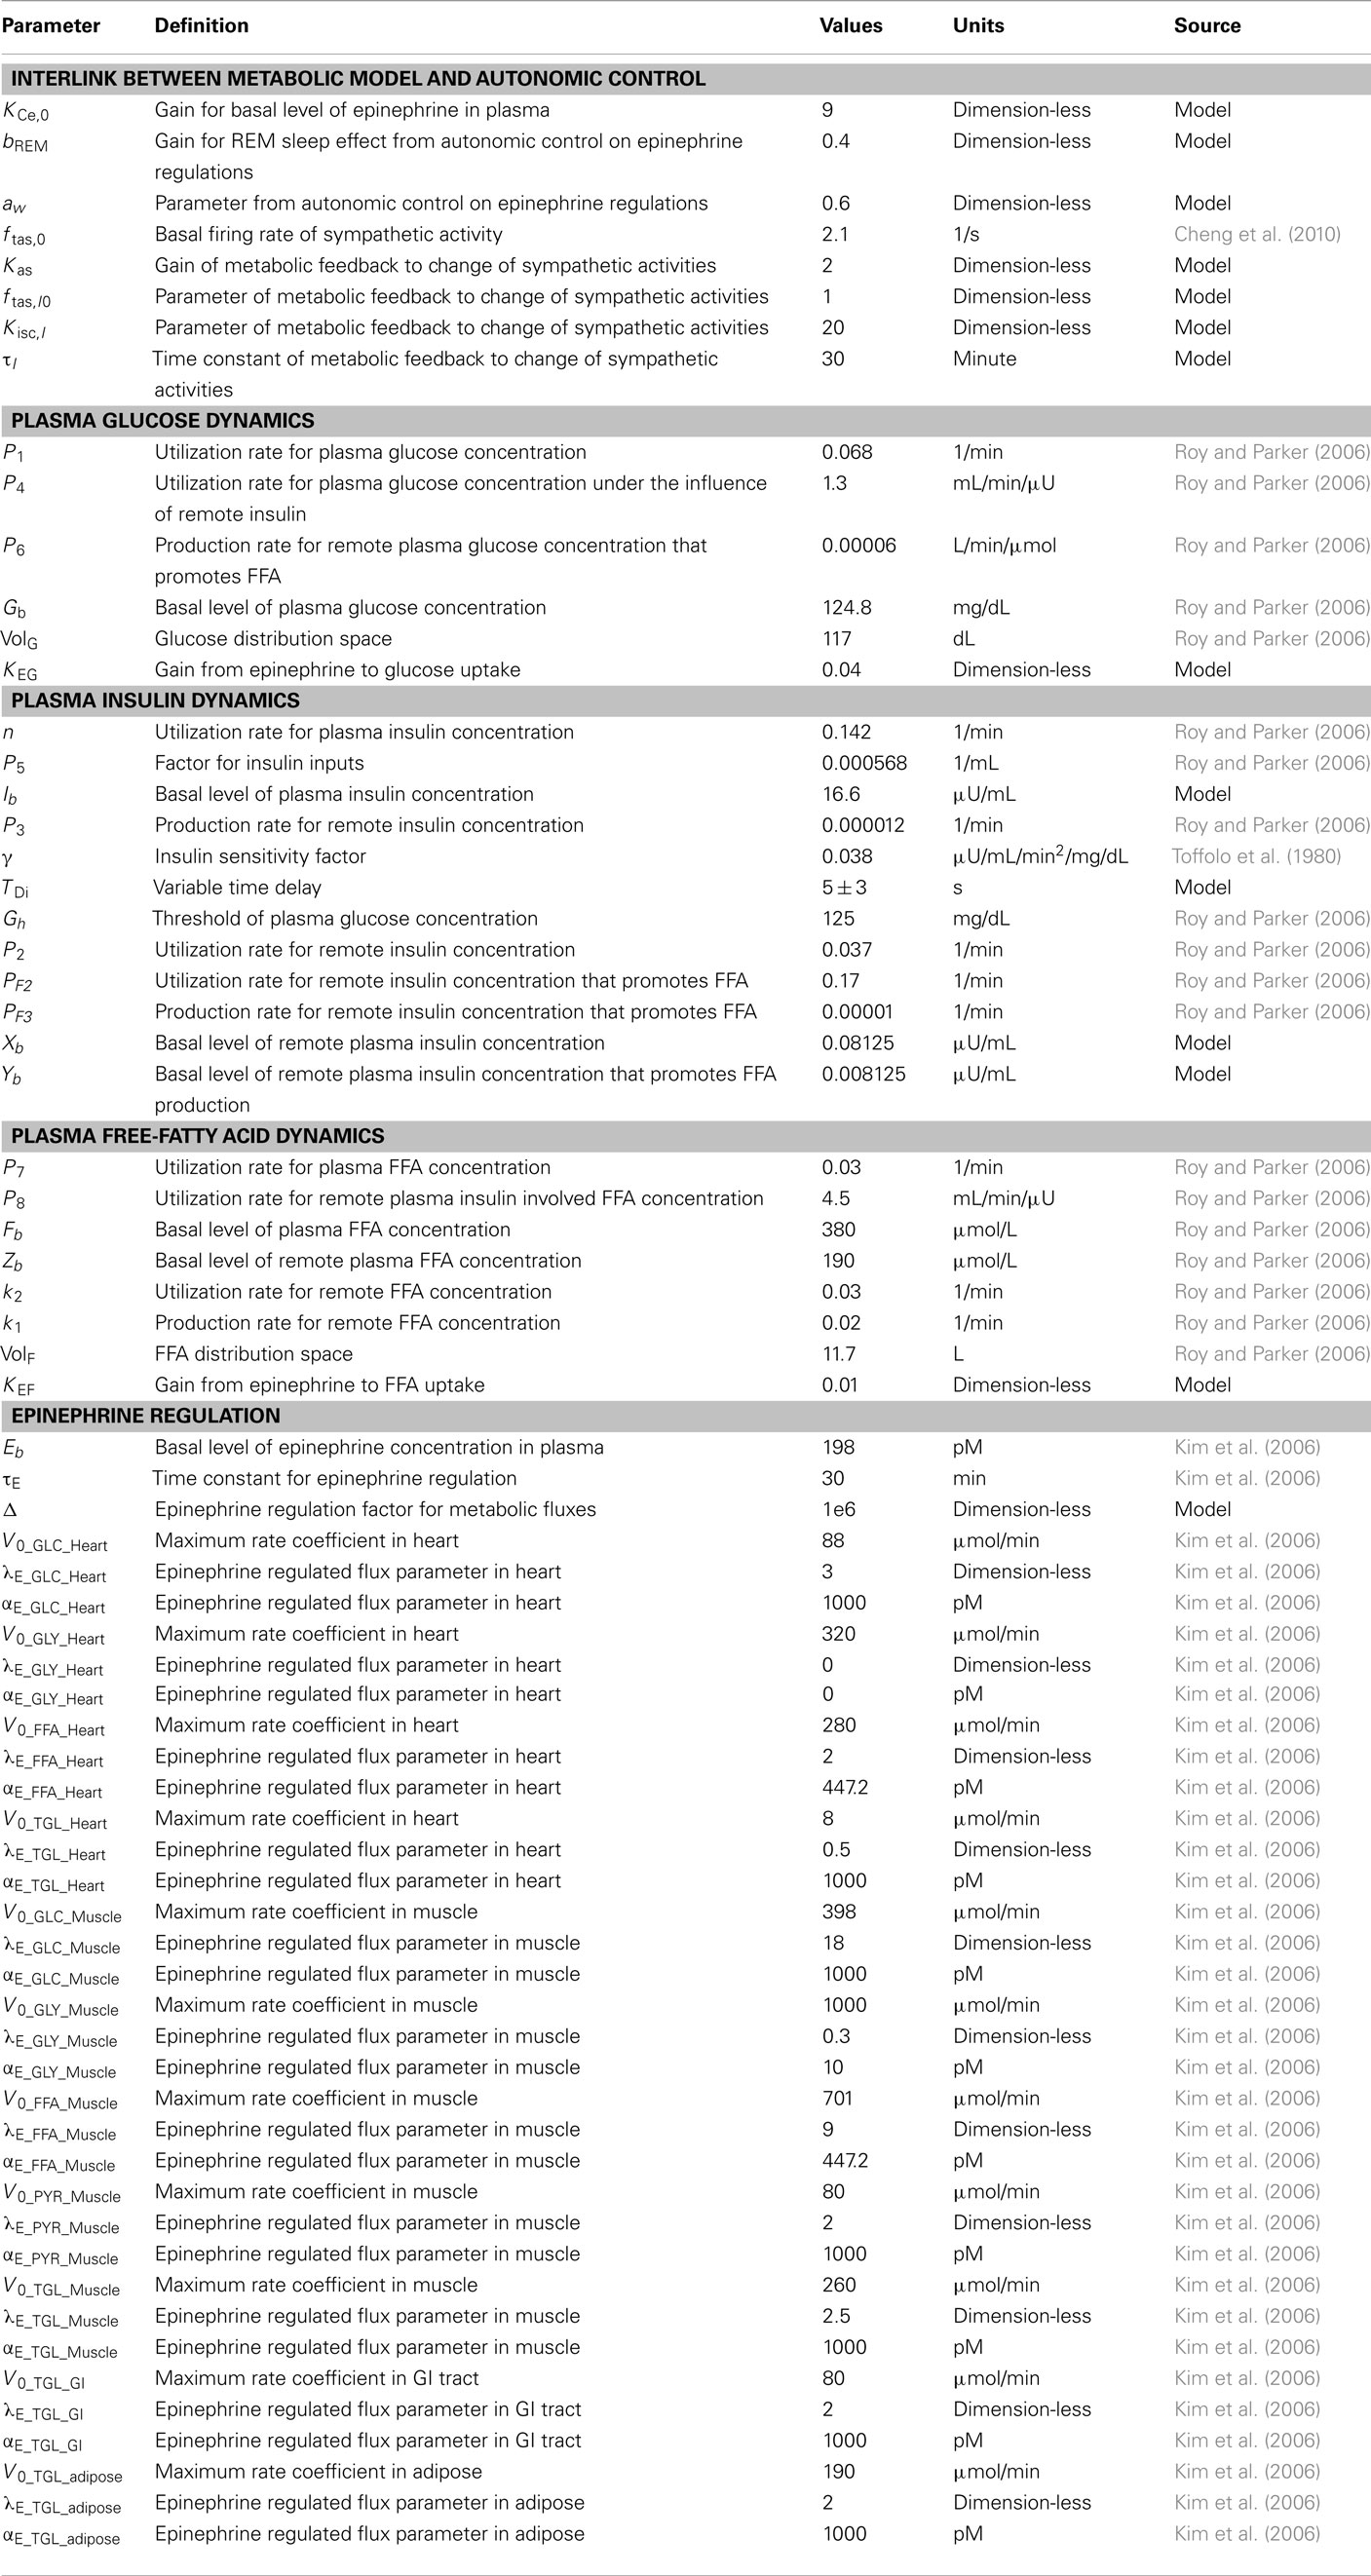
Table 1. Simulation parameters and initial conditions in metabolic model and its link with autonomic control.
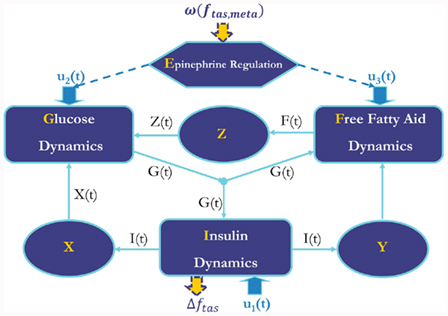
Figure 1. Diagram of metabolic model with epinephrine regulation. X, remote insulin level; Y, remote insulin promotes FFA production and utilization; Z, remote FFA level. Δftas, feedback from metabolic system to autonomic control; ω(ftas,meta), effect of efferent sympathetic activity and circadian process on metabolic system. u1(t), u2(t), and u3(t): inputs for insulin, glucose, and FFA dynamics, respectively.


where

The model allows for insulin to be introduced intravenously into the system (as external input rate u1(t) in Figure 1) for simulation of IVGTT and hyperinsulinemic interventions. Glucose can be introduced intravenously into the system for simulation of hyperglycemia, euglycemia, and hypoglycemia in the form of external infusion rate u2ext(t). Another external source of glucose is in the form of dietary glucose intake rate [u2ext(t)]; in this case, we assume periodic pulses that represent three meals which occur at regular times each day.
In the extended model, we assume that the peripheral sympathetic activity and state index generated by PNEUMA affects epinephrine dynamics, which in turn influences the neuroendocrine inputs to the heart, skeletal muscle, and pancreas (Figure 1). “Feedback” from the metabolic sub-model to the autonomic part of PNEUMA is represented by the stimulatory effect of insulin on alpha-sympathetic activity (ANS Control block on Figure 2). The metabolic fluxes for glucose and FFA in heart, skeletal muscle, gastrointestinal tract, adipose tissue, and other tissues (including kidney) are modulated by epinephrine and given in the form displayed as Eq. 8, which is derived from the multi-scale model of Kim et al. (2006). The flux i in tissue/organ x is mathematically characterized as the following flux rates:

where subscript x = “heart,” “muscle,” “gastrointestinal tract,” “adipose tissue,” or “other tissues”; subscript i = “glucose” (assuming the metabolic pathway: GLC ← → G6P ← GLY) or “FFA” (assuming the metabolic pathway: TGL ← → FFA → ACoA).
For the heart, there are both glucose fluxes and FFA fluxes from epinephrine regulation which provide inputs to glucose dynamics and FFA dynamics in the whole metabolic control system; for muscle, there are both glucose fluxes and FFA fluxes from epinephrine regulation; and for the gastrointestinal tract, there is only FFA flux involved. The internal input rates for glucose and FFA kinetics are the sum of metabolic flux rates given by epinephrine regulation as Eqs 9A and 9B, respectively. The arterial epinephrine concentration is a static function of alpha-sympathetic activity given by Eq. 10.


Figure 3 shows the results of a simulation in which the extension to PNEUMA is run on a stand-alone basis (prior to being linked with the rest of PNEUMA). Here, epinephrine regulation is driven by the function ω(αsymp) which represents the time-course of relative sympathetic activity over the circadian period of 24 h. ω(αsymp) is assumed to remain at a constant level of zero over 16 h of quiet wakefulness. During sleep, ω(αsymp) assumes the form of the negative half of a sine wave, representing decreased sympathetic activity in sleep. This decreased baseline in sympathetic activity is punctuated by relatively short pulses, representing increases in sympathetic activity during REM sleep over the subsequent 8 h of sleep (Figure 3A). The corresponding fluctuations in epinephrine concentration [E(t)], glucose concentration [G(t)], insulin concentration [I(t)], and FFA concentration [F(t)] are shown in Figure 3B. Gin represents the time-course of the external glucose inputs that arise from meal ingestion three times a day.
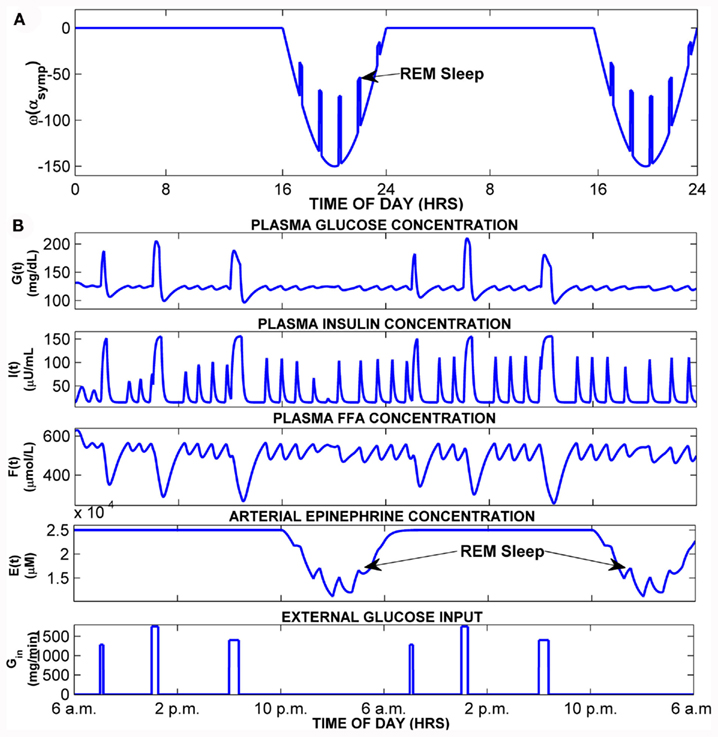
Figure 3. Simulation of normal subject in stand-alone model extension. (A) Time-course of ω(αsymp), the function that converts changes in alpha-sympathetic activity into changes in epinephrine amount. (B) Model simulation showing 2-day time-courses of blood glucose, insulin, FFA, epinephrine, and external glucose inputs (meals).
When the model extension is linked with the rest of PNEUMA (see Figure 2), ω(αsymp) is replaced by ω(ftas,meta) which contains the sum of all efferent alpha-sympathetic firing rates and a modulatory factor that reflects sleep–wake state changes, as shown in Eq. 11 below. E(0) is now no longer a constant (Eb) as in the stand-alone version of the model extension, but this variable is assumed to vary dynamically around its basal level Eb and is controlled by the efferent alpha-sympathetic firing rate and sleep state index as given in Eq. 14.


When the extended version of PNEUMA is said to operate “with metabolic feedback,” we are referring to the configuration in which plasma insulin concentration is allowed to influence alpha-sympathetic firing rate dynamically through Eq. 15 through Eq. 17.


where ftas = ftas, res and ftas, vein, respectively.
The extended version of PNEUMA has been tested for simulation durations as long as 84 days (12 weeks). Each simulation generally begins with sleep onset (10 pm) on the first day. Meals during the day are simulated as step increases in blood glucose, with “breakfast” starting 90 min after the end of sleep cycle. However, since the model of sleep–wake regulation employed by PNEUMA can produce variable sleep durations, depending on whether the factor known as “sleep propensity” is sufficiently reduced to a threshold value during sleep (Cheng et al., 2010), the start times for breakfast can vary from 7 am to 9 am. Simulations with PNEUMA have previously shown that the sleep fragmentation resulting from repetitive arousals during the night in OSA delays the rate at which sleep propensity is reduced in the model during sleep (Cheng et al., 2010). As such, simulated sleep duration is longer in the subject with OSA compared to the subject with normal breathing, if sleep is not artificially interrupted. However, in reality, total sleep duration is constrained due to the occurrence of time cues, such as a clock alarm that goes off at a set time each day. If one factors this in, then the “subject” who has OSA will suffer from a small amount of sleep deprivation each day, since the sleep propensity index is not allowed to decrease to its natural minimum before sleep is terminated and wakefulness occurs. In the results that are presented here, we assume that sleep is terminated 7 h after the start of sleep onset.
The implementation of the model using Simulink® (The Mathworks, Natick, MA, USA) introduces the advantages of modularity, flexibility, and platform-independence, and provides a convenient basis for any future model extensions for modeling, simulating, and analyzing dynamic physiological systems. In its current implementation, PNEUMA is a large model with 557 parameters and 92 states. It takes approximately 12 h of computational time to run a 10-day simulation with variable time step where maximum time step is 10 ms on a PC with an Intel Core 2 Duo E8500 central processing unit. PNEUMA is implemented using a combination of discrete and continuous states, solving ordinary differential and algebraic equations that characterize physiological processes that cover a broad temporal scale, ranging from milliseconds (e.g., heartbeat) to hours (e.g., changes in blood glucose) to days (e.g., circadian rhythm).
An accompanying graphical user interface (GUI) panel allows users to conveniently change the values of a large number of parameters or impose a variety of physiological conditions without having to modify the program directly. Advanced users can vary parameter values or make changes to the underlying models by directly modifying the graphical objects in the Simulink® code. The details of the software are described in the PNEUMA manual. The software and manual can be downloaded free of charge from the following web-link: http://bmsr.usc.edu/Software/BMSRsoftware.html
Results
Stand-Alone Model Extension Results
In the stand-alone version of the model extension, epinephrine dynamics are generated through Eq. 10 with its own generated input source of ω(αsymp) plotted in Figure 3A which presents the effects from autonomic function to the metabolic system. Within this initial closed-loop model without any external inputs and external links, the resulting glucose–insulin and FFA dynamics with epinephrine regulation for a 2-day simulation in the middle of a 60-day simulation is shown in Figure 3B. During sleep, sympathetic tone is reduced below the wakefulness baseline, but in REM sleep, the model assumes that there are transient surges in sympathetic activity, which lead to small elevations of epinephrine during the REM episodes. In wakefulness, during each meal, the blood glucose level increases followed by a corresponding increase in plasma insulin and subsequent drop in the plasma FFA, illustrating the antilipolytic effect of insulin. The model predicts the occurrence of oscillations (with periodicities of ∼120 min) that arise from the dynamic interactions among glucose, insulin, and FFA, in particular between the meals. However, these “ultradian” oscillations, most evident in insulin and FFA, persist during sleep when there are no meals. In general, higher baseline levels of plasma epinephrine enhance the frequency and amplitude of these oscillations. These predictions are consistent with observations of ultradian oscillations of insulin and glucose reported in the literature (Polonsky et al., 1988; Sturis et al., 1991; Simon, 1998).
Simulation of Normal Subject: Effects of “Metabolic Feedback”
Figure 4 shows the results for a normal subject on day 10 of simulation time. Breakfast is assumed to start 90 min after the end of sleep. The predicted time-courses of the cardiovascular, respiratory, and metabolic variables following 10 days of simulation without metabolic feedback (Δftas) are displayed in blue, whereas the corresponding model predictions with metabolic feedback are shown in red. The mean levels of systolic blood pressure (SBP) and diastolic blood pressure (DBP) are higher in the case with metabolic feedback relative to the case without metabolic feedback, consistent with the increased epinephrine amount in heart and skeleton muscle during wakefulness when metabolic feedback is present (Figure 4A – only a segment of 200 s is displayed for purposes of clarity). On average, SBP/DBP values in wakefulness are 117/82 mmHg with metabolic feedback vs. 105/73 mmHg without metabolic feedback. During sleep, the corresponding SBP/DBP values are 108/72 with metabolic feedback vs. 102/67 without metabolic feedback. There is a certain amount of autonomic compensation for the elevation in blood pressure via the baroreflex through a decrease in heart rate (HR). In wakefulness, mean HR is approximately 78 beats/min with metabolic feedback vs. 85 beats/min without metabolic feedback, whereas in sleep, the corresponding mean HR values are 74 vs. 76 beats/min.
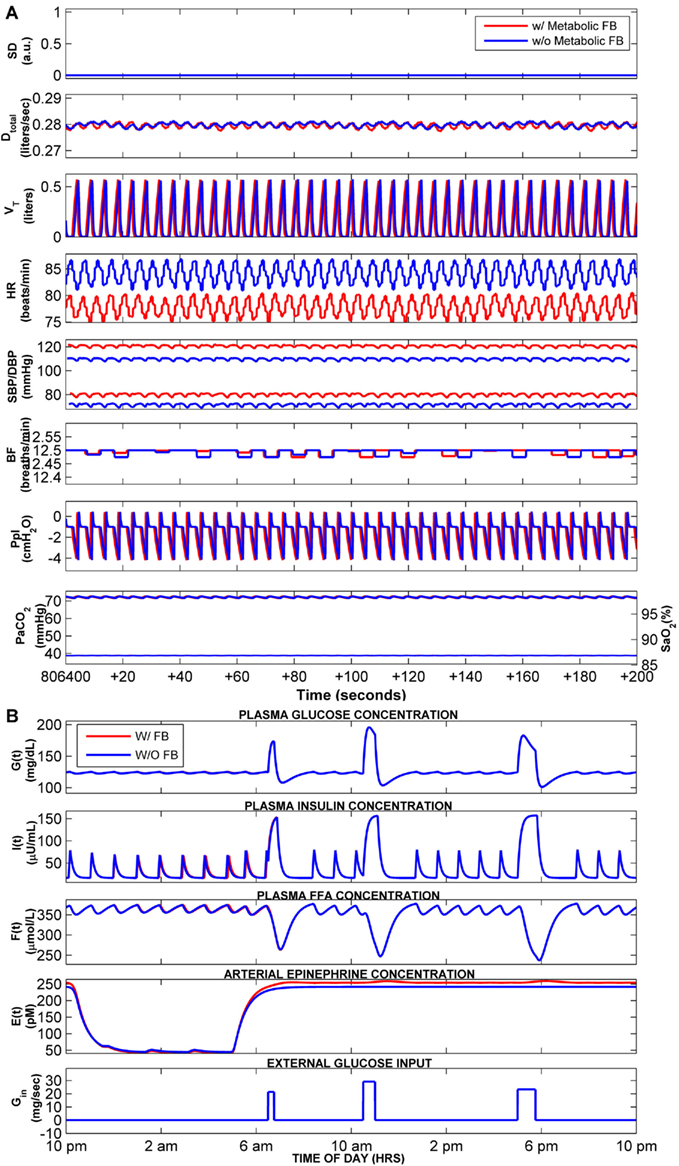
Figure 4. Cardiorespiratory and metabolic responses predicted by the extended model on Day 10 of total simulation duration. The case with metabolic feedback (red) is compared with the case without metabolic feedback (blue). Sleep starts at 10 pm and ends at 5 am every day. (A) Time-courses of the key cardiorespiratory variables – a segment of only 200 s duration, starting at 6 am of Day 10, is displayed for clarity. SD, sleep state index (wake/sleep = 0/1); Dtotal, total ventilatory drive (L/s); VT, tidal volume (L); HR, heart rate (beat/min); SBP/DBP, systolic and diastolic blood pressure (mmHg); BF, breathing frequency (breaths/min); Ppl, pleural pressure (cmH2O); PaCO2 (Thin Lines), arterial PCO2 (mmHg); SO2 (Thick Lines), saturation of oxygen (%). (B) Predicted time-courses of plasma glucose, insulin, FFA, epinephrine, and the external glucose inputs to the model (representing three meals during wakefulness).
The dynamics of glucose, insulin, FFA, and epinephrine over the course of 24 h on “Day 10” are shown in Figure 4B. The surges in glucose concentration represent the impact of meals taken during the wakefulness period. As in the stand-alone case presented in the previous section, the model predicts the occurrence of ultradian oscillations in insulin, FFA, and (to a smaller extent) glucose. These oscillations are most evident during sleep, consistent with the ultradian fluctuations observed by others (Sturis et al., 1991; Simon, 1998; Porksen et al., 2002; Kim et al., 2007). These display a periodicity of ∼54 min, which is within the range consistent with experimental observations (Polonsky et al., 1988; Simon and Brandenberger, 2002). During REM sleep, the epinephrine concentration in plasma is slightly higher than NREM sleep due to increased sympathetic activity – this has also been reported in the experimental literature (Linares et al., 1987). The plasma epinephrine concentration is slightly higher with metabolic feedback vs. no feedback during wakefulness. However, the model predicts that the effect of metabolic feedback on the predicted time-courses of glucose, insulin, and FFA is minimal. This result is somewhat surprising and contrary to initial expectations that the plasma insulin level would be higher in the case with metabolic feedback. We believe that this prediction reflects saturation effects that are derived from the non-linear relationship between epinephrine level and its effects on plasma glucose and FFA.
Normal Breathing vs. OSA with Metabolic Feedback
As in our previous work (Cheng et al., 2010), to allow the model to simulate OSA sleep, the upper airway sensitivity parameter (Sua) was increased from its control value of 0.01 in normal breathing to at least 0.38. Figure 5A (second through eighth panels) displays the predicted time-courses of the key cardiovascular and respiratory variables for the OSA “subject” during sleep (displayed as blue tracings) on the 10th day of simulated time, contrasted against the corresponding time-courses in a normal control (displayed as red tracings). In both cases, the model simulations have been run with metabolic feedback, and sleep duration has been limited to 7 h. The first panel of Figure 5A shows the sleep state index (“SD”), with SD = 1 representing deep sleep and SD = 0 representing wakefulness. The normal subject remains asleep (SD = 1) throughout the duration displayed, whereas in the OSA subject, arousals are triggered (SD changes from 1 to 0) at the end of the obstructive episodes. Without or with metabolic feedback, simulations of OSA during sleep produce the cardiovascular, respiratory, and neural responses similar in form to what we had shown previously, as well as to observations reported in the literature (Bradley and Floras, 2003). With the metabolic feedback, the model still predicts periodicities on the order of ∼52 s, which is consistent with our previous work and literature (Leung and Bradley, 2001; Cheng et al., 2010). The corresponding dynamics of glucose, insulin, FFA, and epinephrine over the 10th day of simulation are shown in Figure 5B. During sleep, reduced sympathetic nervous system activity decreases epinephrine amount in heart and skeleton muscle in both normal breathing and OSA, but there is higher level of epinephrine in OSA sleep than in normal sleep due to the elevated level of sympathetic activity in OSA sleep. Epinephrine levels in OSA are further enhanced in REM sleep relative to non-REM sleep, reflecting the relatively higher sympathetic activity in REM. Because of the elevated epinephrine levels during sleep in OSA, the ultradian oscillations in insulin in the OSA subject are noticeably higher in amplitude compared to the corresponding insulin oscillations in the normal subject.
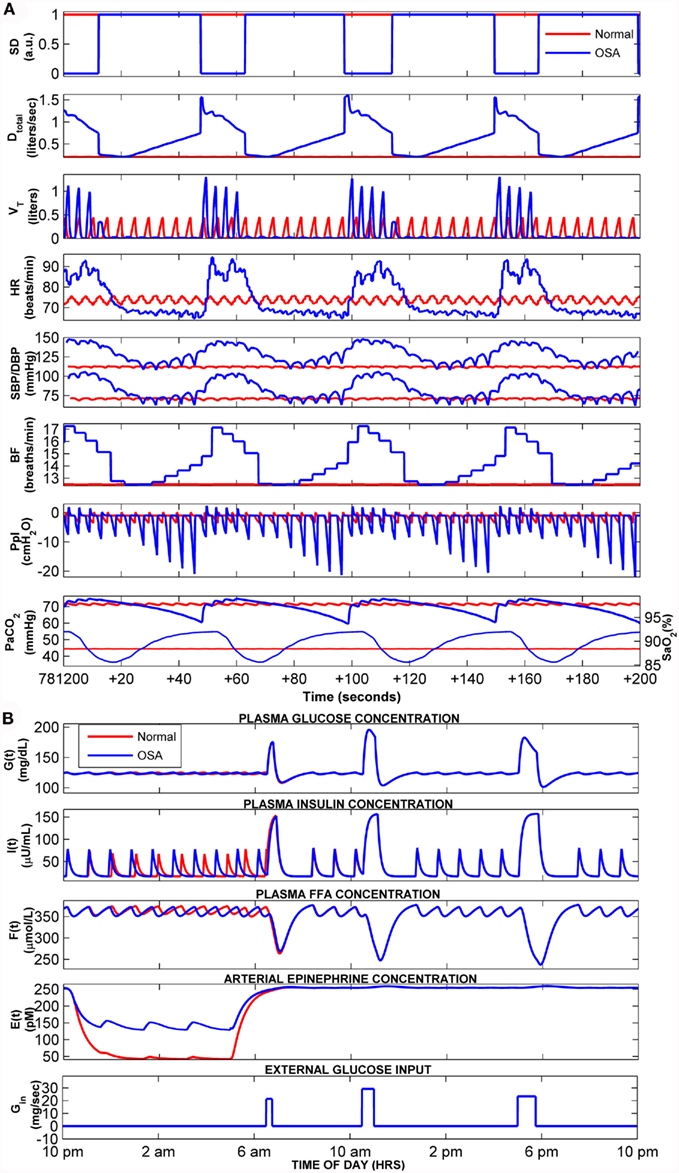
Figure 5. Comparison of cardiorespiratory and metabolic responses in normal breathing (red) vs. OSA (blue). Results displayed are from Day 10 of the total simulation duration. Sleep starts at 10 pm and ends at 5 am each day. (A) Time-courses of the key cardiorespiratory variables – a segment of only 200 s duration, starting at 11 pm of Day 10, is displayed for clarity. SD, sleep state index (wake/sleep = 0/1); Dtotal, total ventilator drive (L/s); VT, tidal volume (L); HR, heart rate (beat/min); SBP/DBP, systolic and diastolic blood pressure (mmHg); BF, breathing frequency (breaths/min); Ppl, pleural pressure (cmH2O); PaCO2 (Thin Lines), arterial PCO2 (mmHg); SO2 (Thick Lines), saturation of oxygen (%). (B) Predicted time-courses of plasma glucose, insulin, FFA, epinephrine, and the external glucose inputs to the model (representing three meals during wakefulness).
Time-Course of Development of Metabolic and Autonomic Effects in OSA
Figure 6 displays the results of a simulation (N → OSA) in which the model is first run with the upper airway parameter Sua set at 0.01 for several days until a clear steady state has been achieved, following which Sua is increased to 0.38 and the simulation trial is continued for 10 more days. This simulation is equivalent to conducting a hypothetical experiment in which a normal subject “abruptly” develops OSA, allowing us to track, on a day-to-day basis, the time-course of development of the metabolic and cardiovascular effects of OSA, as predicted by the extended model. In Figure 6, “Day 0” marks the point at which the change in Sua occurs. The top two panels of Figure 6 show the serial values of fasting plasma glucose (FPG) level and the fasting plasma insulin (FPI) level, determined by averaging the predicted plasma glucose and insulin values that appear during wakefulness in the hour before “breakfast” occurs. The third panel displays the day-to-day values of plasma epinephrine obtained by averaging predicted epinephrine concentration over 1-h duration before and after breakfast in each day. The remaining panels in Figure 6 show averages of the key cardiovascular variables calculated over the corresponding simulation segment between 120 and 60 min before sleep ends for each day. Mean HR, SBP, and DBP attain their new steady-state levels within a day following the “switchover” from normal to OSA status. Also displayed in Figure 6 are the corresponding amplitudes of the dominant oscillations in HR, SBP, and DBP; these oscillations occur at the tidal breathing frequencies (respiratory sinus arrhythmia for HR and pulsus paradoxus for blood pressure) in normal breathing, but in OSA, they occur with considerably larger amplitudes and cycle durations consistent with the repetitive episodes of apnea and arousals. FPG, FPI, and epinephrine attain their new steady-state levels after 2 days. All three variables are higher in the OSA vs. normal states, consistent to what has been reported in clinical studies (McArdle et al., 2007).
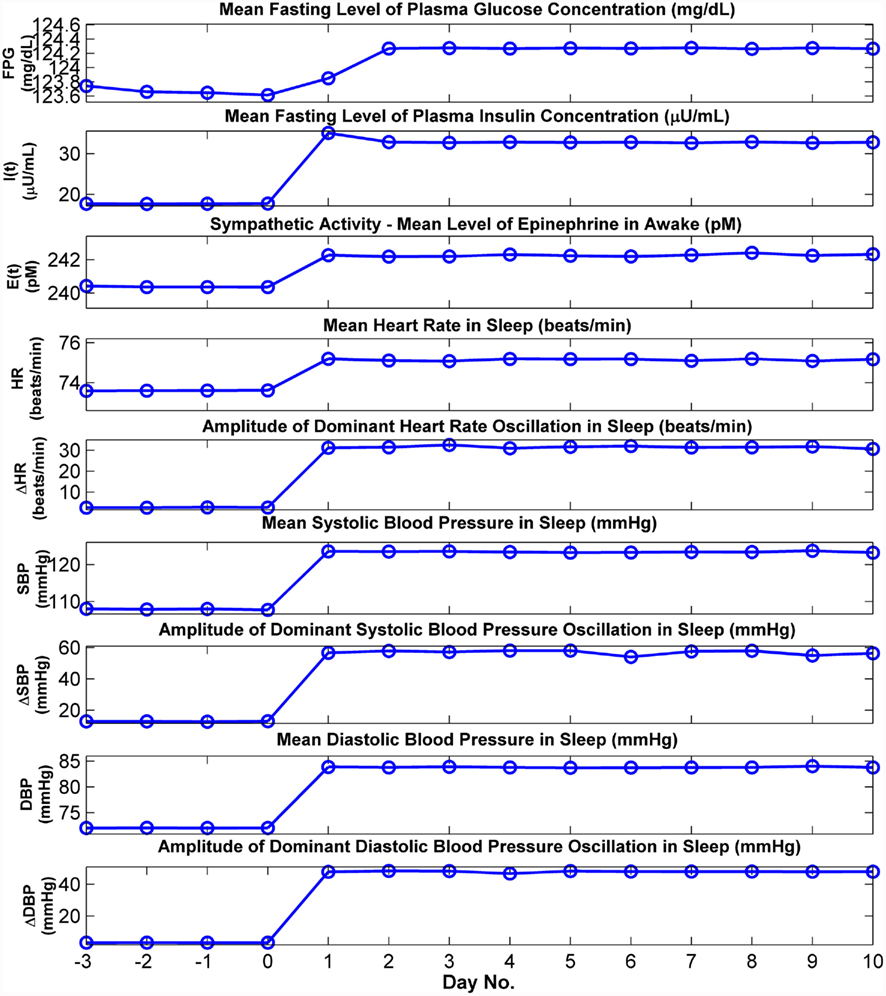
Figure 6. Cardiovascular and metabolic responses predicted by model before, during, and after abrupt transition from normal breathing to OSA. In this simulation, the model is run in normal breathing mode until a steady state has been achieved, and at the end of “Day 0,” the upper airway sensitivity parameter (Sua) is abruptly increased to simulate OSA. FPG and FPI: mean levels of plasma glucose and insulin, respectively, calculated from the 30 min segment immediately before the start of breakfast. Other cardiovascular and metabolic values for wakefulness displayed above are the means derived from the corresponding simulation segment between 60 and 120 min. after sleep ends. All cardiovascular values for sleep displayed above are the means derived from the corresponding simulation segment between 120 and 60 min before sleep ends.
The autonomic and metabolic effects of artificially eliminating OSA by administering CPAP are presented in the simulation results displayed in Figure 7. Here, the model is first run with Sua set at a value of 0.4 to represent OSA for several days in simulation time. Subsequently, during the duration of sleep on “Day 1,” CPAP at a level of 15 cmH2O is applied. This eliminates the obstructive apnea episodes, thus drastically reducing the large amplitude cyclic swings in HR, SBP, and DBP. Mean SBP and DBP attain their new lower steady-state levels within a day of this change. FPG, FPI, and epinephrine are lowered to their new steady-state levels after 2 days, consistent with observations reported in the clinical literature (Harsch et al., 2004).
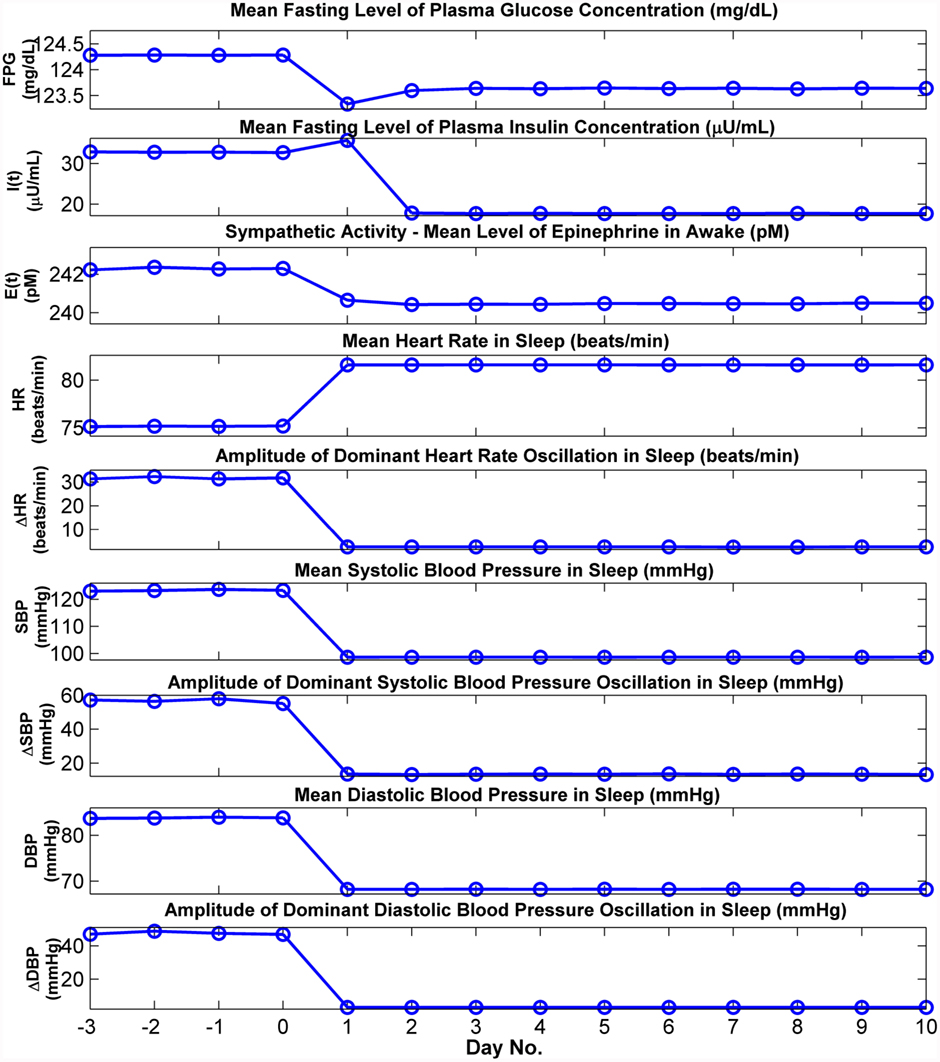
Figure 7. Cardiovascular and metabolic responses predicted by model before and after the start of CPAP administration. In this simulation, the model is run in OSA mode until a steady state has been achieved, and at the end of “Day 0,” continuous positive airway pressure (CPAP) at 15 cmH2O is applied. FPG and FPI: mean levels of plasma glucose and insulin, respectively, calculated from the 30 min segment immediately before the start of breakfast. Other cardiovascular and metabolic values for wakefulness displayed above are the means derived from the corresponding simulation segment between 60 and 120 min. after sleep ends. All cardiovascular values for sleep displayed above are the means derived from the corresponding simulation segment between 120 and 60 min before sleep ends.
Figure 8 summarizes and compares the magnitudes of the changes in steady-state autonomic and metabolic responses for the two cases ((N → OSA and OSA → OSA + CPAP) discussed above. It is clear that the results produced by OSA → OSA + CPAP are, in general, opposite in direction to those obtained in N → OSA, except that mean HR is elevated in both cases. We believe that this apparent inconsistency can be explained as follows. In N → OSA, the onset of OSA led to an overall increase in sympathetic tone (as manifested in the elevation of epinephrine), which increased both blood pressure and HR. In OSA → OSA + CPAP, CPAP administration led to a decrease in sympathetic tone and epinephrine level, which decreased blood pressure – however, the reduction in blood pressure triggered the baroreflexes, and this increased HR.
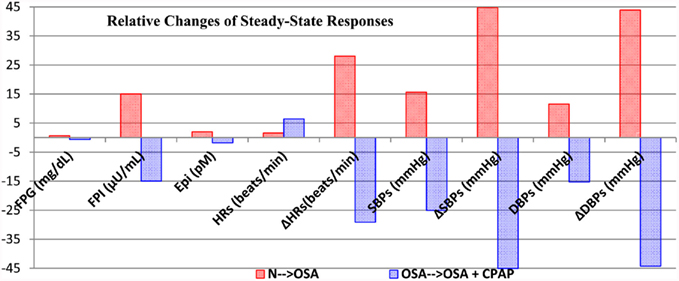
Figure 8. Summary and comparison of the changes in steady-state autonomic and metabolic responses for the two cases, N → OSA (red) and OSA → OSA + CPAP (blue), displayed in Figures 6 and 7, respectively. Each column represents the relative change from previous steady-state value to the post-transition steady-state response. FPG, fasting plasma glucose; FPI, fasting plasma insulin; Epi, arterial epinephrine concentration. ΔHR, ΔSBP, and ΔDBP correspond to maximum amplitude of fluctuation in heart rate (beats/min), maximum amplitude of fluctuation in systolic blood pressure (mmHg), and maximum amplitude of fluctuation in diastolic blood pressure (mmHg), respectively. Subscript “s” represents sleep.
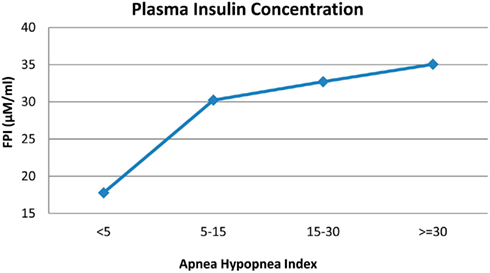
Simulations of the OSA case were conducted over a range of Sua values, representing varying degrees of upper airway obstruction. Figure 9 summarizes the model predictions: FPI concentration increases as severity of OSA, as assessed using the apnea–hypopnea index, increases. We believe that the mechanistic basis for this result, as implemented in the model, is as follows. Greater severity of OSA leads to increased sympathetic tone, which increases epinephrine levels. The latter stimulates glycogenolysis and gluconeogenesis, thus increasing the plasma glucose level. This, in turn, stimulates the production of insulin, which is also enhanced by the elevated epinephrine level. The increased insulin level helps to attenuate the rise in blood glucose. However, the system is left with a consequent hyperinsulinemia. Thus, although the parameters that collectively represent insulin sensitivity remain unchanged in the model, whole-body insulin resistance is effectively increased. These results are consistent with several recent studies that point to the independent contribution of OSA to insulin resistance (Manzella et al., 2002; Punjabi et al., 2002).
Simulation of External Interventions: Glucose Clamps
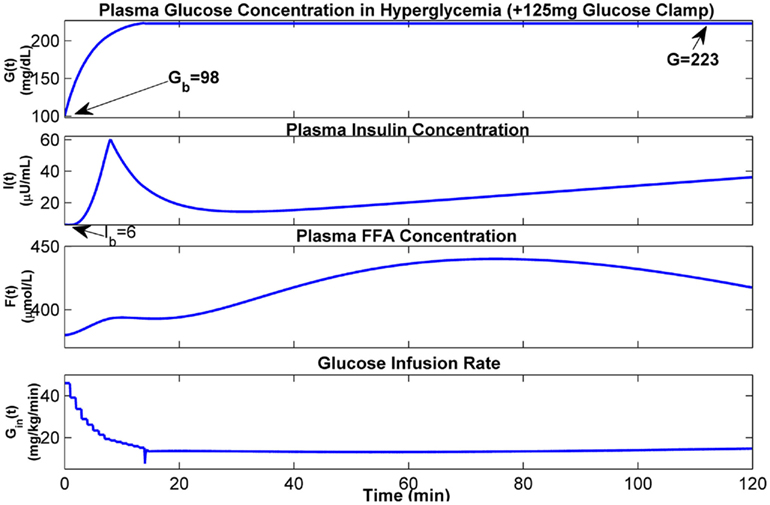
The hyperglycemic glucose clamp technique is used for the quantification of beta-cell sensitivity to glucose and the euglycemic hyperinsulinemic clamp technique is used for measuring tissue sensitivity to insulin. The extended model has been tested using virtual experiments to simulate these intervention techniques. To simulate a hyperglycemic +125 mg glucose clamp, the glucose concentration in plasma is first gradually increased to 125 mg/dl above its basal level (Gb) by a series of stair-like priming blood glucose infusion, and then maintained at the hyperglycemic level by dynamically and continuously adjusting the rate of glucose infusion. The dynamics of glucose, insulin, and FFA and corresponding glucose infusion rate during first 2 h of hyperglycemic clamp are shown in Figure 10, where the basal level of plasma glucose concentration (Gb) is given as 98 mg/dL, the basal levels of plasma insulin concentration (Ib) and plasma FFA concentration (Fb) are assumed to be 6 μU/mL and 380 μmol/L, respectively. The glucose and insulin responses predicted by our model are comparable to the corresponding observations reported in the literature (Figure 1 in DeFronzo et al., 1979).
To determine the response of the extended model to various euglycemic clamps, assuming Gb to be 98 mg/dL and Ib to be 6 μU/mL, simulations have been conducted in which insulin is infused at dynamically changing rates to maintain plasma insulin concentration at various hyperinsulinemic levels. Figure 11 displays the results at the three hyperinsulinemic levels of 20, 30, and 100 μU/ml above its basal level (Ib), respectively, with two stair-like inputs in the priming dose of glucose infusion for each hyperglycemic level. These results also confirm that the predicted dynamics of glucose, insulin, and FFA concentrations in plasma are consistent with the literature (Figure 1 in Howard et al., 1984; Figure 3 in Roy and Parker, 2006).
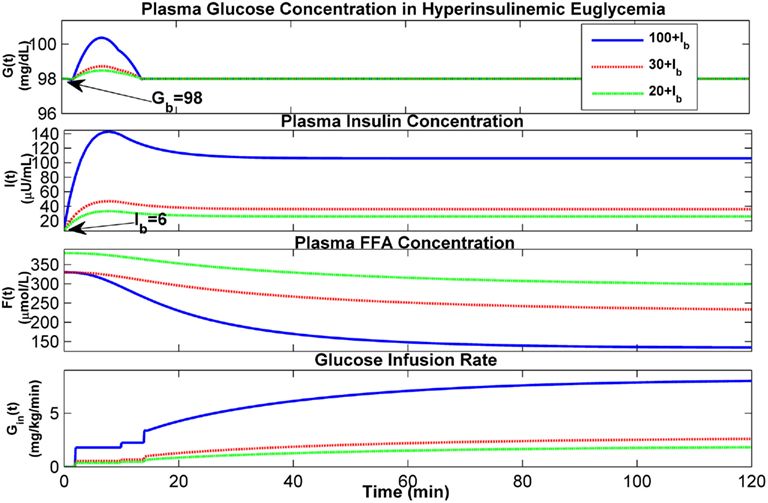
Figure 11. Dynamics of glucose–insulin and FFA during hyperinsulinemic euglycemia with glucose clamps.
Sensitivity Analyses
The extended model contains 557 parameters, each of which is assigned a value (if available) that is consistent with the subject group and condition under study. This represents 85 parameters more than the 472 parameters employed in PNEUMA prior to this study. Thus we focused on identifying the key parameters that mediate the most significant interactions between the autonomic and metabolic subsystems, in order to minimize the number of free parameters that have to be specified prior to running a simulation. Sensitivity analyses were conducted to determine the relative contributions of the key parameters that played the most significant roles in various conditions. These sensitivity analyses were also useful as checks of internal consistency and model stability within the ranges of the parameter values considered physiologically “realistic.”
Interaction between key parameters contributing to autonomic and metabolic interactions
Table 2 displays the model predictions obtained from different values of key parameters (gains Kas and Kisc,I) that influence the impact of metabolic feedback on autonomic function, as well as the key parameters (gains Kce,0 and Gb) that control how sympathetic activity influences the metabolic subsystem. In the control set of normal subject and OSA subject, these key parameters are set to equal to their initial values described in Table 1. For each simulation, there is only one parameter changed by the desired percentage or amount. We found, as might be expected, that the ability to simulate the effect of metabolic feedback on α-sympathetic activity depends most sensitively on its gain Kas. This is shown in the percentage change of mean HR, SBP/DBP from their control values in both normal and OSA subject and during both wakefulness and sleep, as well as in the epinephrine level from its control corresponding to the change of α-sympathetic activity. Also, as might be expected, the analysis shows that the gain (Kce,0) for basal level of epinephrine is the most sensitive parameter for epinephrine regulation in wakefulness.
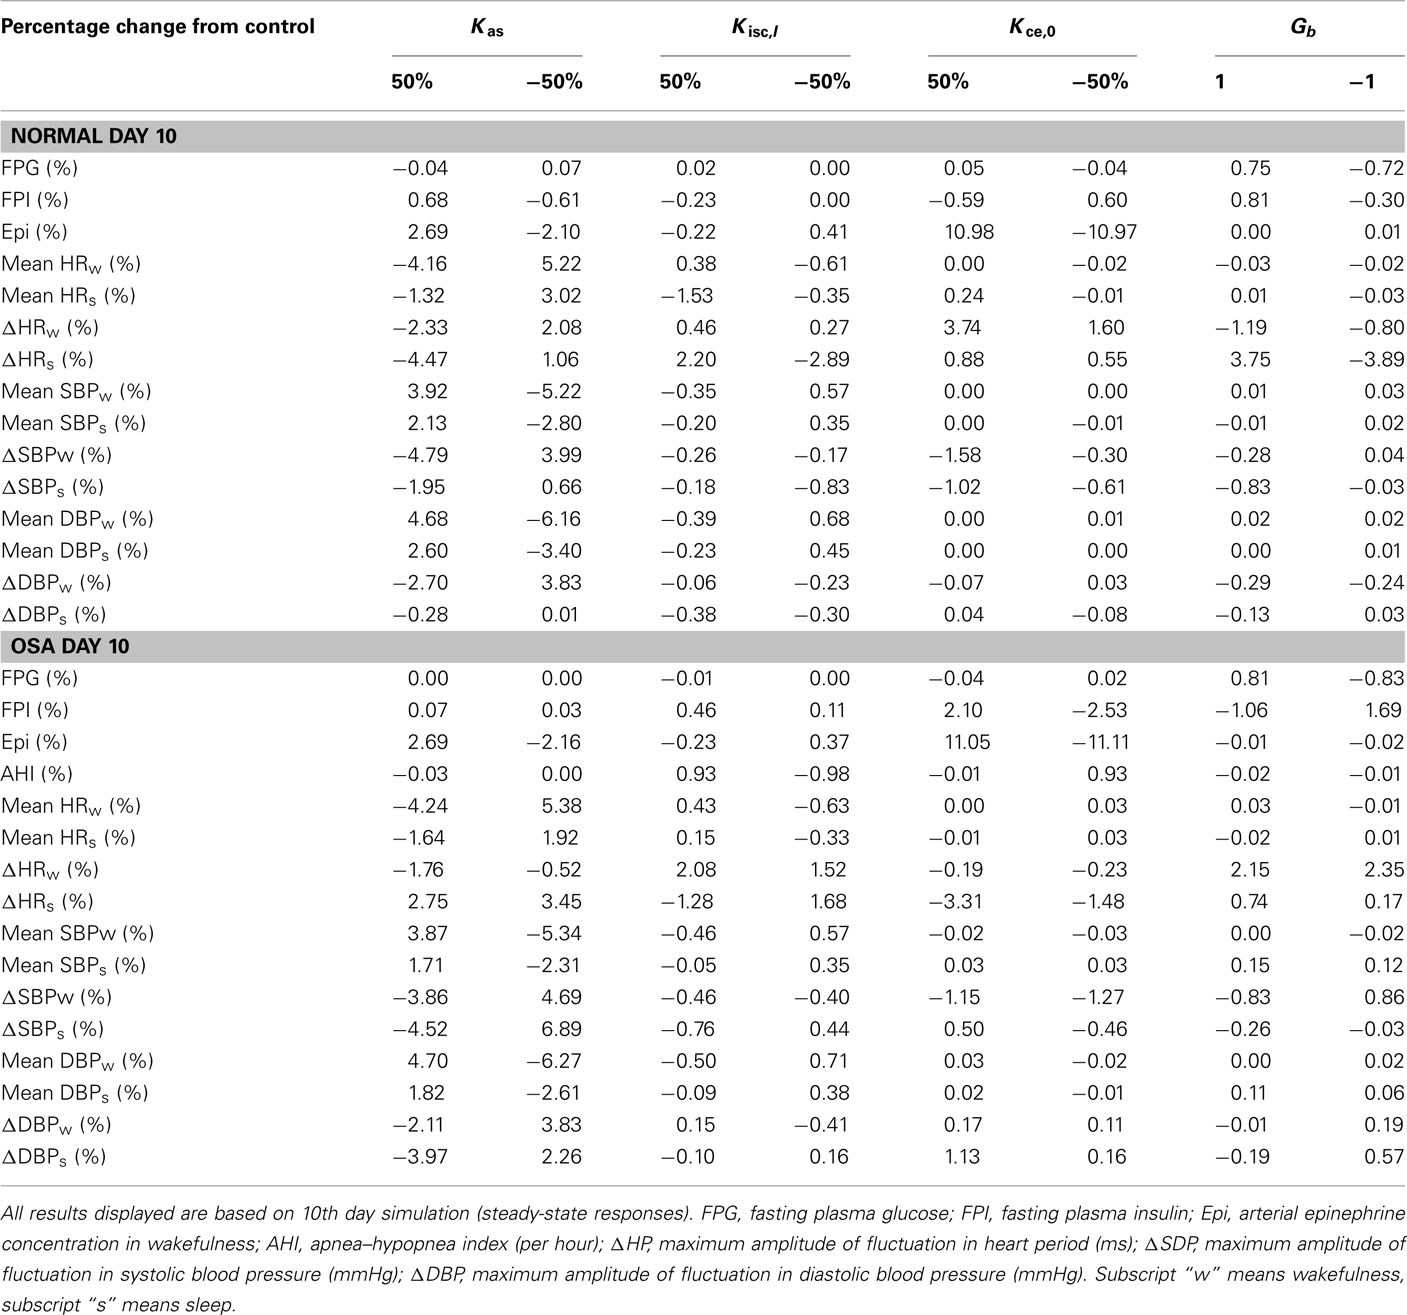
Table 2. Sensitivity analysis of key parameters in metabolic model that contribute to autonomic and metabolic interactions.
Interactions between key parameters contributing to epinephrine regulation on glucose and FFA dynamics
Table 3 displays the model results of different levels of internal inputs controlled by the gains from epinephrine to glucose and FFA, Keg and Kef, respectively. To start the simulations, basal levels of glucose and insulin concentrations in plasma are set to 98 mg/dL and 6 μU/mL, respectively. As the gains gradually increase, both FPG and FPI levels are elevated as the epinephrine concentration in plasma increases. This leads to more oscillations in insulin concentration between meals. Also, as the gains increase, blood pressure is increased slightly and this leads to slightly decreased HR in wakefulness and during sleep.
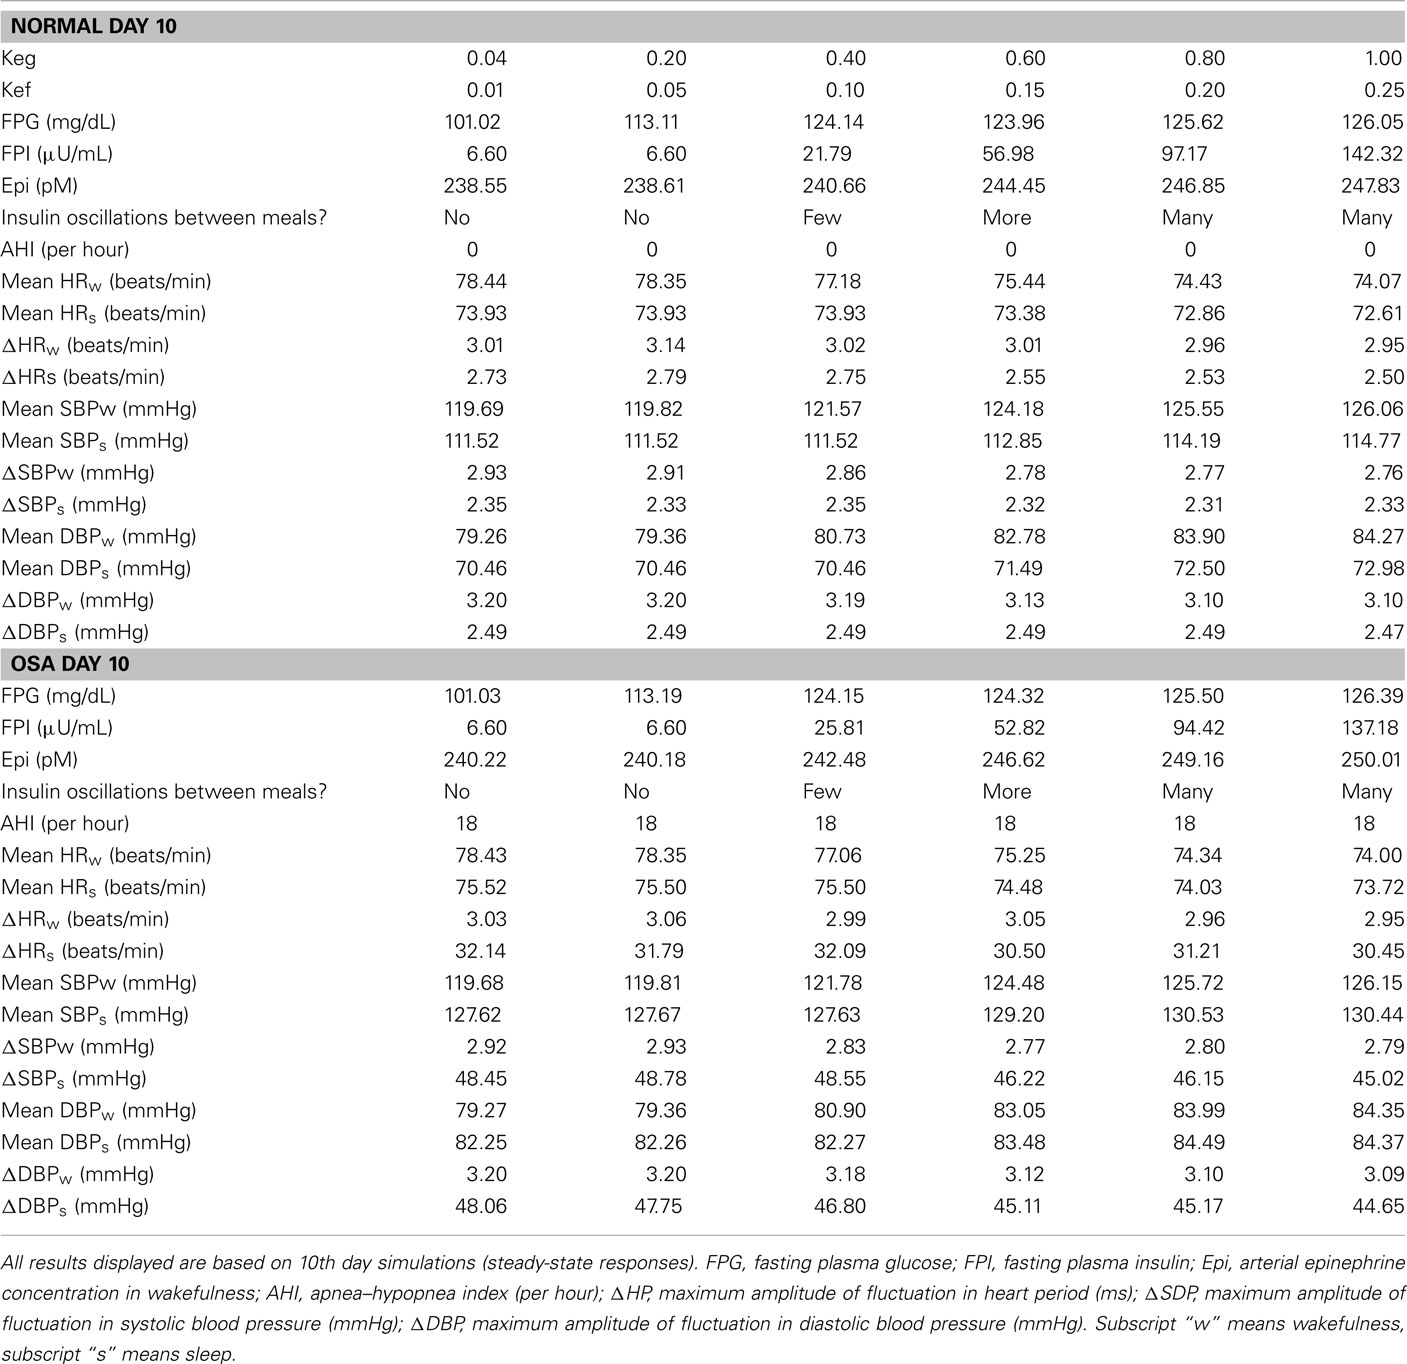
Table 3. Sensitivity analysis of gains from epinephrine to glucose and FFA that have effects on autonomic and metabolic interactions.
Interactions between key parameters contributing to the severity of obstructive sleep apnea effects
Table 4 shows the model predictions obtained from various combinations of values for the upper airway sensitivity to collapse, Sua, and the arousal threshold upper limit. In normal subject, Sua is set equal to 0.01 and the critical closing pressure, Pcrit, for upper airway during sleep is −29.6 cmH2O. With stable sleep, apnea–hypopnea index (AHI) is zero and maximum fluctuations in HR, SBP, and DBP are consistent with normal respiration. When Sua is increased to 0.38, Pcrit is less negative and obstructive apnea starts to appear and be terminated by non-frequent arousals (AHI = 9) with large amplitudes of fluctuations in HR, SBP, and DBP during sleep and a large growth in FPI and slightly increase in FPG and epinephrine level in plasma in wakefulness. Raising Sua a little more to 0.4 leads to greater periodicity of obstructive apnea and arousals (AHI = 18) and slightly increases in FPI and epinephrine level in plasma, and increasing Sua further to 0.5 produces more apnea and arousals (AHI = 46) and slightly more increases in FPI and epinephrine level in plasma. But the maximum amplitudes of the swings in HR, SBP, and DBP remain relatively constant, and FPG remains slightly increased from its control level. Increasing arousal threshold delays the appearance of obstructive apnea and arousals as Sua is progressively increased. For the same value of Sua, the periodicity of AHI is lower for mild and moderate OSA and approximately the same for severe OSA. However, the amplitudes of the swings in HR, SBP, and DBP are substantially higher, FPG is relatively unchanged and FPI and epinephrine amount in plasma are lower.
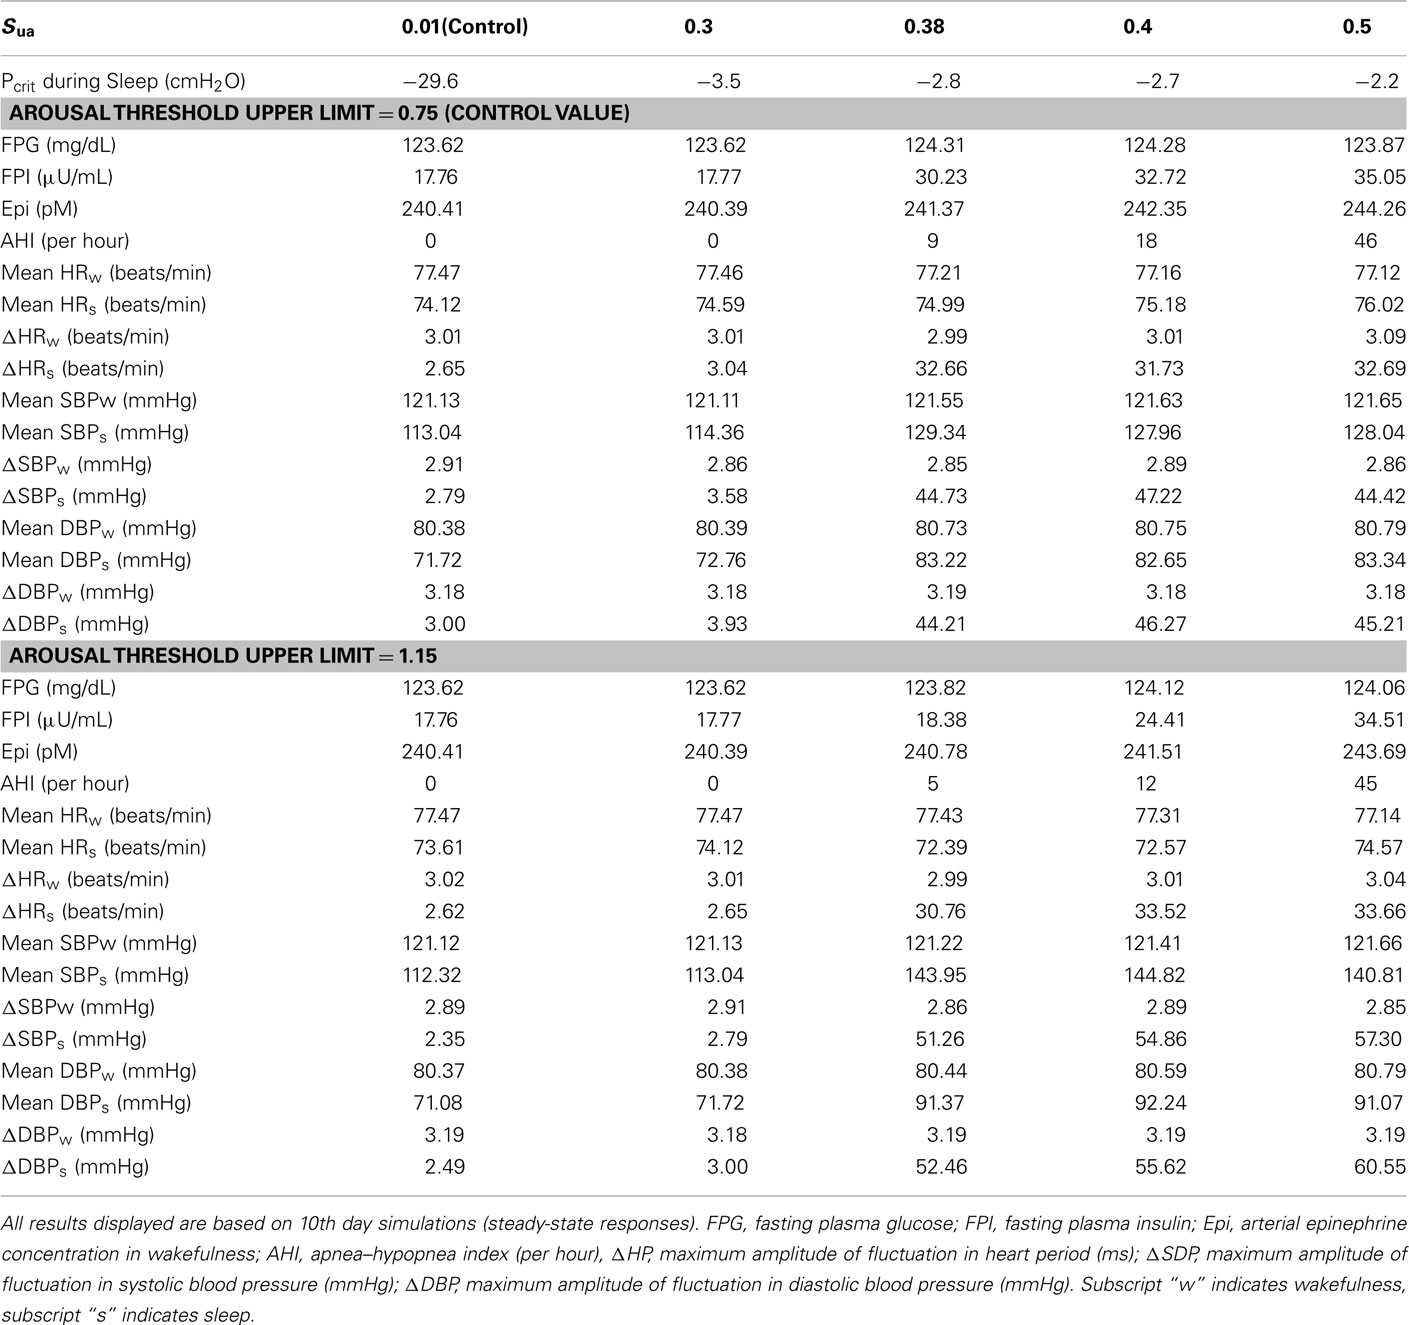
Table 4. Sensitivity analysis of OSA effects on autonomic and metabolic interactions by changing key parameters in upper airway model.
Discussion
In this study, we have introduced the first comprehensive, structured physiological model that incorporates dynamic interactions between the autonomic and metabolic control systems. The approach we have taken has been to extend an existing integrative model of cardiorespiratory system with sleep–wake state control (“PNEUMA”) to include the regulation of epinephrine, glucose, insulin, and FFAs. Although extended PNEUMA is based largely on previously published models of the various subsystems in question, our contribution has been to adapt the existing sub-models for integration into the overall model structure. In particular, we have incorporated the following new features: a direct link between sympathetic activity and epinephrine level, the coupling between the epinephrine sub-model and the metabolic sub-model that characterizes glucose, insulin, and FFA dynamics, the effect of insulin on peripheral vascular sympathetic activity, and the effect of sleep–wake state on epinephrine regulation. The primary focus of extended PNEUMA is the simulation of a range of sleep-related breathing disorders and the physiological consequences of these disorders on cardiorespiratory control, sleep–wake regulation, and metabolic regulation, along with the interactions among these various subsystems. The comprehensive simulation model allows the user to conduct virtual experiments such as isocapnic and hypercapnic and/or hypoxic gas administration, the Valsalva and Mueller maneuvers, and the application of CPAP on OSA subjects, as well as external metabolic interventions such as different glucose clamps, IVGTT, and insulin pumps.
Food intake triggers the release of insulin which acts to regulate glucose metabolism. However, excessive feeding in obese individuals can lead to chronic hyperinsulinemia, which predisposes to insulin resistance. Since OSA is highly prevalent in obese individuals, it is likely that chronic exposure to the IH and sleep fragmentation that accompany upper airway obstruction and transient arousal from sleep would constitute another factor that contributes to metabolic dysfunction. Moreover, OSA is associated with sympathetic overactivity (Leung and Bradley, 2001) and a number of prospective studies, such as the canine model of Brooks et al. (1997), have demonstrated that OSA can lead to systemic hypertension. Thus, it is reasonable to expect that OSA could play an important role in the development of hyperinsulinemia. Recently, a couple of studies have demonstrated significant correlations among OSA, type 2 diabetes, and metabolic syndrome (Shaw et al., 2008; Tasali and Ip, 2008; Jun and Polotsky, 2009). A comprehensive simulation model, such as extended PNEUMA, provides a systematic framework with which we can investigate in silico potential mechanistic pathways that could lead to the observed correlations. For instance, with the extended model, the metabolic feedback can be attenuated or eliminated to simulate pharmaceutical blockade of autonomic nervous system activities. Such interventions may be difficult to implement or sometimes impossible to conduct in real experiments. In silico investigations would also allow us to determine the relative importance of the various potential mechanisms, including sympathetic overactivity, that link OSA to metabolic dysfunction.
As mentioned in previous work, this model is largely an integration of smaller sub-models that have already been peer-reviewed and validated; many of the other parameters were assigned values employed in these previously published sub-models (Cheng et al., 2010). For the extended model with the new metabolic system, wherever possible, the parameter values employed in the model are based on population values published in the literature, as indicated in Table 1 for the new parameters. In some cases where the physiological values are unclear, the parameters have been tuned to ensure that the dynamic behavior of the model under the various conditions explored remains realistic. Model verification and validation are performed by comparing the simulation output under baseline conditions in normal breathing and sleep-disordered breathing and under different interventions to the general population-averaged cardiorespiratory data and glucose–insulin–FFA dynamics reported in the literature. Since the focus of this study is on the dynamic interactions among the various mechanisms between autonomic and metabolic interactions, verification, and validation are guided by employing a qualitative goodness of fit approach. This contrasts with smaller, more focused models in which the key parameters are estimated based on quantitative fits to experimental data obtained from individual subjects. In the present case, there is no single complete experimental dataset that the model can be validated against. Rather, we focus on comparing the model responses with the empirically derived responses that represent the “average subject” in each patient/subject population. The utility of this comprehensive, highly parameterized model is “proven” by testing the internal consistency of the simulated responses of a significant number of state variables over a range of perturbations and conditions.
Limitations of the Model
The model that we have proposed here focuses on the question of whether the autonomic changes resulting from sleep apnea characterized with IH and repetitive arousal from sleep can lead to chronic changes of metabolic consequences in glucose, insulin, and fatty acid levels. This is the first quantitative model that has ever addressed this question – and as such, it should be seen as a first step in many further explorations in this area of work. Animal models of IH have shown that chronic IH induces augmented sympathetic activities, insulin resistance, systemic inflammation, oxidative stress, hyperlipidemia, hepatic inflammation, and increase in cholesterol content and glycogen content in the liver. Nevertheless, very little is known about the ways in which IH and OSA can lead directly to changes in the glucose–insulin–fatty acid metabolic system –even in the experimental literature. Our approach is to attack this problem one layer at a time – first start with how the autonomic changes affect the metabolic control system – and then move on to other mechanistic pathways that may link IH and metabolic dysfunction more directly. A key premise in the present model is that OSA leads to sympathetic overactivity (partly due to chronic IH) which increases plasma epinephrine levels which, in turn, alters the regulation of glucose, insulin, and FFA, leading eventually to hyperinsulinemia.
The mechanisms for the long-term effects of IH on autonomic and metabolic control are not well understood, but current studies have shown that the systemic and cellular responses for a given level and duration of hypoxia exposure are more potent with IH than with the sustained hypoxia (Prabhakar and Kumar, 2004). There are several potential alternative pathways by which IH can lead to insulin resistance and impaired insulin secretion. Results from IH animal models show that IH can lead directly to hyperlipidemia. The mechanism of dyslipidemia induced by IH is unclear, but it is believed to be stimulated through (1) up-regulation of key hepatic transcription factors of lipid biosynthesis, (2) increased lipolysis which might induce increased FFA delivery and impaired beta oxidation which in turn can associate with OSA and fat liver, liver injury, oxidative stress, and non-alcoholic steatohepatitis, and (3) inhibited very-low density lipoprotein clearance (Drager et al., 2010). Hepatic dyslipidemia can cause hepatic insulin resistance. In addition, IH involves hypoxia-reoxygenation cycles that could increase oxidative stress by hypoxia-inducible factor 1 (HIF-1; Semenza, 1998) and thus may influence glucose metabolism by modulating glucose transport and utilization through HIF-1. The effect of IH in oxidative stress is similar to the effect of ischemia–reperfusion injury. However, oxidative stress in OSA and IH has not been clearly described (Svatikova et al., 2005) and the mechanism by which it can produce metabolic dysfunction is under investigation. It is likely that the IH associated with OSA could also lead directly to insulin resistance by reducing the rate of oxidative metabolism and decreasing the rate of glycolysis in some tissues, and thus making insulin less effective in disposing glucose (Iiyori et al., 2008). IH can alter both acute and chronic glucose homeostasis through decreased oxidative phosphorylation, leptin signaling, and growth hormone axis suppression (Jun and Polotsky, 2009). IH could also affect many other processes, such as circadian glucose homeostasis, lipid metabolism, and cholesterol synthesis. However, much remains unknown and further studies are needed to answer these questions. As such, these alternative pathways have not been included in the model. Moreover, our goal in this paper is to first introduce a basic model structure that allows interactions between the autonomic and metabolic aspects of the model. Subsequently, we will add other relevant pathways that can more accurately characterize the effect of IH on autonomic and metabolic consequences of OSA.
The current model postulates that α-sympathetic activity influences insulin production indirectly through the effect of epinephrine on plasma glucose and FFA concentrations, and that insulin affects α-sympathetic activity only. Some studies have shown that insulin also has a direct vasodilatory effect (Anderson and Mark, 1993), and this may offset the vasoconstrictive effect of insulin through its action on sympathetic activity. Thus, the “feedback effect” of insulin on sympathetic drive may not be as important as one might generally surmise. Another major factor not included in the present model is the effect of sympathetic drive, and thus epinephrine, on insulin production in the pancreas (Kim et al., 2006).
While recent clinical research shows that high-fat diets contribute to progressive insulin resistance, in the present model, meals are represented simply as step boluses of blood glucose without consideration of the digestion process and the inevitable lags between oral ingestion and appearance of glucose and FFA in the bloodstream.
The time-course of “disease progression,” as currently predicted by the model in terms of the development of elevated epinephrine, insulin, and FFA levels, is substantially more rapid than one might expect based on clinical observation. This is likely related to the fact that the model parameters in both the autonomic and metabolic subsystems remain unchanged, even though the model variables (e.g., mean blood pressures, insulin levels, and FFA levels) are altered by the presence or absence of OSA. This limitation stems from the lack of information about how the disease process leads to time-varying changes in the model parameters. Clearly, future efforts to improve the model will require the incorporation of this knowledge from either empirical observations or an advanced understanding of the underlying mechanistic processes that give rise to such time-varying alterations.
Conclusion
We have extended an existing integrative model of respiratory, cardiovascular, and sleep–wake state control, to incorporate a sub-model of glucose–insulin–fatty acid regulation. This computational model is capable of simulating the complex dynamics of cardiorespiratory control, chemoreflex and state-related control of breath-to-breath ventilation, state-related and chemoreflex control of upper airway potency, respiratory and circulatory mechanics, as well as the metabolic control of glucose–insulin dynamics and its interactions with the autonomic control. The interactions between autonomic and metabolic control include the circadian regulation of epinephrine secretion, epinephrine regulation on dynamic fluctuations in glucose and FFA in plasma, metabolic coupling among tissues and organs provided by insulin and epinephrine, as well as the effect of insulin on peripheral vascular sympathetic activity. This extended model represents a starting point from which further in silico investigations into the interaction between the autonomic nervous system and the metabolic control system can proceed. The predictions generated from this model may provide insight into the relative importance of the various mechanisms that determine the acute and chronic physiological effects of sleep-disordered breathing.
Conflict of Interest Statement
The authors declare that the research was conducted in the absence of any commercial or financial relationships that could be construed as a potential conflict of interest.
Acknowledgments
This work was supported by the USC Biomedical Simulations Resource through NIH Grant EB-001978, as well as by NIH Grant HL090451 and the USC Center for Transdisciplinary Research on Energetics and Cancer (TREC U54 CA116848).
References
Ackerman, E., Gatewood, L. C., Rosevear, J. W., and Molnar, G. D. (1965). Model studies of blood-glucose regulation. Bull. Math. Biophys. 27, 21–38.
Anderson, E. A., and Mark, A. L. (1993). The vasodilator effect of insulin: implications for the insulin hypothesis of hypertension. Hypertension 21, 136–141.
Andres, R., Swerdloff, R., Pozesky, T., and Coleman, D. (1966). “Manual feedback technique for control of glucose concentration,” in Automation in Analytical Chemistry, ed. J. L. Skeggs (New York: Medicaid), 486–501.
Bamshad, M., Aoki, V. T., Adkison, M. G., Warren, W. S., and Bartness, T. J. (1998). Central nervous system origins of the sympathetic nervous system outflow to white adipose tissue. Am. J. Physiol. Regul. Integr. Comp. Physiol. 275, R291–R299.
Berger, M., and Rodbard, D. (1989). Computer simulation of plasma insulin and glucose dynamic after subcutaneous insulin injection. Diabetes Care 12, 725–736.
Bergman, R. N. (1989). Toward physiological understanding of glucose tolerance: minimal-model approach. Diabetes 38, 1512–1527.
Bergman, R. N., Ider, Y. Z., Bowden, C. R., and Cobelli, C. (1979). Quantitative estimation of insulin sensitivity. Am. J. Physiol. 236, E667–E677.
Bergman, R. N., Kim, S. P., Catalano, K. J., Hsu, I. R., Chiu, J. D., Kabir, M., Hucking, K., and Ader, M. (2006). Why visceral fat is bad: mechanisms of the metabolic syndrome. Obesity 14, S16–S19.
Bergman, R. N., Phillips, L. S., and Cobelli, C. (1981). Physiologic evaluation of factors controlling glucose tolerance in man. J. Clin. Invest. 68, 1456–1467.
Berman, N., Chou, H. F., Berman, A., and Ipp, E. (1993). A mathematical model of oscillatory insulin secretion. Am. J. Physiol. Regul. Integr. Comp. Physiol. 264, 839–851.
Bolie, V. W. (1961). Coefficients of normal blood glucose regulation. J. Appl. Physiol. 16, 783–788.
Bradley, T. D., and Floras, J. S. (2003). Sleep apnea and heart failure part I: obstructive sleep apnea. Circulation 107, 1671–1678.
Brooks, D., Horner, R. L., Kozar, L. F., Render-Teixera, C. L. B., and Phillipson, E. A. (1997). Obstructive sleep apnea as a cause of systemic hypertension: evidence from a canine model. J. Clin. Invest. 99, 106–119.
Chasens, E. R. (2007). Obstructive sleep apnea, daytime sleepiness, and type 2 diabetes. Diabetes Educ. 33, 475–482.
Cheng, L., Ivanova, O., Fan, H., and Khoo, M. C. K. (2010). An integrative model of respiratory and cardiovascular control in sleep-disordered breathing. Respir. Physiol. Neurobiol. 174, 4–28.
DeFronzo, R. A., Tobin, J. D., and Andres, R. (1979). Glucose clamp technique: a method of quantifying insulin secretion and resistance. Am. J. Physiol. 237, E214–E233.
Drager, L. F., Jun, J. C., and Polotsky, V. Y. (2010). Metabolic consequences of intermittent hypoxia: relevance to obstructive sleep apnea. Best Pract. Res. Clin. Endocrinol. Metab. 24, 843–851.
Genter, P., Berman, N., Jacob, M., and Ipp, E. (1998). Counterregulatory hormones oscillate during steady-state hypoglycemia. Am. J. Physiol. Endocrinol. Metab. 275, E821–E829.
Harsch, I. A., Schahin, S. P., Radespiel-Troger, M., Weintz, O., Jahreiss, H., Fuchs, F. S., Wiest, G. H., Hahn, E. G., Lohmann, T., Konturek, P. C., and Ficker, J. H. (2004). Continuous positive airway pressure treatment rapidly improves insulin sensitivity in patients with obstructive sleep apnea syndrome. Am. J. Respir. Crit. Care Med. 169, 156–162.
Himsworth, H., and Ker, R. (1939). Insulin-sensitive and insulin insensitive types of diabetes mellitus. Clin. Sci. 4, 119–122.
Howard, B. V., Klimes, I, Vasquez, B., Brady, D., Nagulesparan, M., and Unger, R. H. (1984). The antilipolytic action of insulin in obese subjects with resistance to its glucoregulatory action. J. Clin. Endocrinol. Metab. 58, 544–548.
Hucking, K., Hsu, I. R., Ionut, V., and Bergman, R. N. (2007). Deconvolution as a novel approach to analyze moment-to-moment free fatty acid release. Obesity 15, 2416–2423.
Iiyori, N., Alonso, L. C., Li, J., Sanders, M. H., Garcia-Ocana, A., O’Doherty, R. M., Polotsky, V. Y., and O’Donnell, C. P. (2008). Intermittent hypoxia causes insulin resistance in lean mice independent of autonomic activity. Am. J. Respir. Crit. Care Med. 175, 851–857.
Insel, P. A., Liljenquist, J. E., Tobin, J. D., Sherwin, R. S., Watkins, P., Andres, R., and Berman, M. (1975). Insulin control of glucose metabolism in man: a new kinetic analysis. J. Clin. Invest. 55, 1057–1056.
Jun, J., and Polotsky, V. Y. (2009). Metabolic consequences of sleep-disordered breathing. ILAR J. 50, 289–306.
Kim, J., Saidel, G. M., and Cabrera, M. E. (2006). Multi-scale computational model of fuel homeostasis during exercise: effect of hormonal control. Ann. Biomed. Eng. 35, 69–90.
Kim, S. P., Catalano, K. J., Hsu, I. R., Chiu, J. D., Richey, J. M., and Bergman, R. N. (2007). Nocturnal free fatty acids are uniquely elevated in the longitudinal development of diet-induced insulin resistance and hyperinsulinemia. Am. J. Physiol. Endocrinol. Metab. 292, E1590–E1598.
Leung, R. S., and Bradley, T. D. (2001). Sleep apnea and cardiovascular disease. Am. J. Respir. Crit. Care Med. 164, 2147–2165.
Linares, O. A., Jacquez, J. A., Zech, L. A., Smith, M. J., Sanfield, J. A., Morrow, L. A., Rosen, S. G., and Halter, J. B. (1987). Norepinephrine metabolism in humans. J. Clin. Invest. 80, 1332–1341.
Manzella, D., Parillo, M., Razzino, T., Gnasso, P., Buonanno, S., Gargiulo, A., Caputi, M., and Paolisso, G. (2002). Soluble leptin receptor and insulin resistance as determinant of sleep apnea. Int. J. Obes. Relat. Metab. Disord. 26, 370–375.
McArdle, N., Hillman, D., Beilin, L., and Watts, G. (2007). Metabolic risk factors for vascular disease in obstructive sleep apnea: a matched controlled study. Am. J. Respir. Crit. Care Med. 175, 190–195.
Nolan, C. J., Madiraju, M. S. R., Delghingaro-Augusto, V., Peyot, M.-L., and Prentki, M. (2006). Fatty acid signaling in the β-cell and insulin secretion. Diabetes 55, S16–S23.
Parker, R. S., Doyle, F. J. III, and Peppas, N. A. (1999). A model-based algorithm for blood glucose control in type I diabetic patients. IEEE Trans. Biomed. Eng. 46, 148–156.
Polonsky, K. S., Given, B. D., and Van Cauter, E. (1988). Twenty-four-hour profiles and pulsatile patterns of insulin secretion in normal and obese subject. J. Clin. Invest. 81, 442–448.
Porksen, N., Hollingdal, M., Juhl, C., Butler, P., Veldhuis, J. D., and Schmitz, O. (2002). Pulsatile insulin secretion: detection, regulation, and role in diabetes. Diabetes 51, S245–S254.
Prabhakar, N. R., and Kumar, G. K. (2004). Oxidative stress in the systemic and cellular responses to intermittent hypoxia. Biol. Chem. 385, 217–221.
Punjabi, N. M., Sorkin, J. D., Katzel, L. I., Goldberg, A. P., Schwartz, A. R., and Smith, P. L. (2002). Sleep-disordered breathing and insulin resistance in middle-aged and overweight men. Am. J. Respir. Crit. Care Med. 165, 677–682.
Randle, P. J., Kerbey, A. L., and Esinol, J. (1988). Mechanisms decreasing glucose oxidation in diabetes and starvation: role of lipid fuels and hormones. Diabetes Metab. Rev. 4, 623–628.
Reaven, G. M. (1980). Insulin-independent diabetes mellitus: metabolic characteristics. Metab. Clin. Exp. 29, 445–454.
Rebrin, K., Steil, G. M., Getty, L., and Bergman, R. N. (1995). Free fatty acid as a link in regulation of hepatic glucose production by peripheral insulin. Diabetes 44, 1038–1045.
Reilly, M. P., and Rader, D. J. (2003). The metabolic syndrome: more than the sum of its parts? Circulation 108, 1546–1551.
Roy, A., and Parker, R. S. (2006). Dynamic modeling of free fatty acid, glucose, and insulin: an extended “Minimal Model”. Diabetes Technol. Ther. 8, 617–626.
Semenza, G. L. (1998). Hypoxia-inducible factor 1: master regulation of O2 homeostasis. Curr. Opin. Genet. Dev. 8, 588–594.
Shaw, J. E., Punjabi, N. M., Wilding, J. P., Alberti, K. G. M. M., and Zimmet, P. Z. (2008). Sleep-disordered breathing and type 2 diabetes: a report from the international diabetes federation taskforce on epidemiology and prevention. Diabetes Res. Clin. Pract. 8, 2–12.
Sherwin, R. S., Kramer, K. J., Tobin, J. D., Insel, P. A., Liljenquist, J. E., Berman, M., and Andres, R. (1974). A model of the kinetics of insulin in man. J. Clin. Invest. 53, 1481–1492.
Simon, C. (1998). Ultradian pulsatility of plasma glucose and insulin secretion rate: circadian and sleep modulation. Horm. Res. 49, 185–190.
Simon, C., and Brandenberger, G. (2002). Ultradian oscillations of insulin secretion in humans. Diabetes 51, S258–S261.
Skowronski, R., Hollenbeck, C. B., Varasteh, B. B., Chen, Y.-D. I., and Reaven, G. M. (1991). Regulation of non-esterified fatty acid and glycerol concentration by insulin in normal individuals and patients with type 2 diabetes. Diabet. Med. 8, 330–333.
Srinivasan, R., Kadish, A. H., and Sridhar, R. (1970). A mathematical model for the control mechanism of free fatty acid-glucose metabolism in normal human. Comput. Biomed. Res. 3, 146–165.
Steele, R. (1959). Influences of glucose loading and of injected insulin on hepatic glucose output. Ann. N. Y. Acad. Sci. 82, 420–430.
Sturis, J., Polonsky, K. S., Mosekilde, E., and Cauter, E. V. (1991). Computer model for mechanisms underlying ultradian oscillations of insulin and glucose. Am. J. Physiol. 260, E801–E809.
Svatikova, A., Wolk, R., Lerman, L. O., Juncos, L. A., Greene, E. L., McConnell, J. P., and Somers, V. K. (2005). Oxidative stress in obstructive sleep apnoea. Eur. Heart J. 26, 2435–2439.
Tasali, E., and Ip, M. S. M. (2008). Obstructive sleep apnea and metabolic syndrome: alterations in glucose metabolism and inflammation. Proc. Am. Thorac. Soc. 5, 207–217.
Toffolo, G., Bergman, R. N., Finegood, D. T., Bowden, C. R., and Cobelli, C. (1980). Quantitative estimation of beta cell sensitivity to glucose in the intact organism: a minimal model of insulin kinetics in the dog. Diabetes 29, 979–990.
Turner, R. C., Holman, R. R., Matthews, D., Hockaday, T. D. R., and Peto, J. (1979). Insulin deficiency and insulin resistance interaction in diabetes: Estimation of their relative contribution by feedback analysis from basal plasma insulin and glucose concentrations. Metab. Clin. Exp. 28, 1086–1096.
Keywords: physiological model simulation, obstructive sleep apnea, sleep regulation, metabolic function, autonomic–metabolic interactions, computational modeling, integrative modeling, metabolism
Citation: Cheng L and Khoo MCK (2012) Modeling the autonomic and metabolic effects of obstructive sleep apnea: a simulation study. Front. Physio. 2:111. doi: 10.3389/fphys.2011.00111
Received: 28 September 2011;
Accepted: 09 December 2011;
Published online: 04 January 2012.
Edited by:
Zhe Chen, Massachusetts Institute of Technology, USAReviewed by:
Luca Citi, Harvard Medical School, USAPremananda Indic, University of Massachusetts Medical School, USA
Sandun Kodituwakku, Australian National University, Australia
Copyright: © 2012 Cheng and Khoo. This is an open-access article distributed under the terms of the Creative Commons Attribution Non Commercial License, which permits non-commercial use, distribution, and reproduction in other forums, provided the original authors and source are credited.
*Correspondence: Michael C. K. Khoo, Biomedical Engineering Department, University of Southern California, DRB-140, University Park, Los Angeles, CA 90089-1111, USA. e-mail:a2hvb0BibXNyLnVzYy5lZHU=


