- 1 Department of Medicine (Cardiology), David Geffen School of Medicine, University of California Los Angeles, Los Angeles, CA, USA
- 2 Department of Integrative Biology and Physiology, David Geffen School of Medicine, University of California Los Angeles, Los Angeles, CA, USA
- 3 Department of Physiology, David Geffen School of Medicine, University of California Los Angeles, Los Angeles, CA, USA
T-wave alternans, a manifestation of repolarization alternans at the cellular level, is associated with lethal cardiac arrhythmias and sudden cardiac death. At the cellular level, several mechanisms can produce repolarization alternans, including: (1) electrical restitution resulting from collective ion channel recovery, which usually occurs at fast heart rates but can also occur at normal heart rates when action potential is prolonged resulting in a short diastolic interval; (2) the transient outward current, which tends to occur at normal or slow heart rates; (3) the dynamics of early after depolarizations, which tends to occur during bradycardia; and (4) intracellular calcium cycling alternans through its interaction with membrane voltage. In this review, we summarize the cellular mechanisms of alternans arising from these different mechanisms, and discuss their roles in arrhythmogenesis in the setting of cardiac disease.
Introduction
T-wave alternans (TWA), a precursor of lethal cardiac arrhythmias and sudden death (Rosenbaum et al., 1994; Armoundas et al., 2002; Narayan, 2006; Verrier and Nieminen, 2010b), has been associated with many cardiac diseases, such as heart failure (Luomanmaki et al., 1975), long QT syndromes (Zareba et al., 1994; Shimizu and Antzelevitch, 1999; Armoundas et al., 2000; Kroll and Gettes, 2002; Wegener et al., 2008; Verrier and Nieminen, 2010a), ischemia (Nakashima et al., 1978; Giudici and Savage, 1990), Brugada syndrome (Chinushi et al., 2001; Morita et al., 2002, 2006; Takagi et al., 2002; Nishizaki et al., 2005; Fish and Antzelevitch, 2008; Tada et al., 2008), etc. TWA is a manifestation of cellular repolarization alternans and can also result from localized 2:1 block in tissue. Several mechanisms of repolarization alternans have been demonstrated and linked to arrhythmogenesis in different diseases. Understanding the mechanisms of TWA for different diseases is important for developing antiarrhythmic strategies. Here we review recent progress on understanding cardiac alternans to provide readers an integrative view of TWA on cardiac arrhythmogenesis. We summarize the following aspects of alternans: the dynamical mechanisms, ionic mechanisms underlying the dynamical factors, and how different mechanisms may lead to arrhythmias in different diseases.
Alternans Due to Electrical Restitution Resulting from Collective Ion Channel Recovery
Alternans may occur at very fast heart rates (200–300 bpm) (Karagueuzian et al., 1993; Koller et al., 1998; Cao et al., 1999; Pastore et al., 1999; Christini et al., 2006; Hayashi et al., 2007; Mironov et al., 2008), and is promoted by a steep slope of action potential duration (APD) restitution at short diastolic interval (DI). APD restitution, defined as the dependence of APD on the preceding DI, is determined by the collective recovery of many ionic currents. In tissue, conduction velocity (CV) also slows at short DI, known as CV restitution, which is a key dynamical factor promoting spatially discordant APD alternans.
APD and CV Restitution
Action potential duration is traditionally defined by a voltage criterion, such as 90% recovery from the peak voltage, or simply by setting a voltage threshold above and below which the time duration is defined as APD or DI, respectively. APD restitution can be measured by gradually incrementing the pacing cycle length (PCL), or suddenly altering the coupling interval between two consecutive beats to change the DI (Figure 1A). In general, a shorter DI gives rise to a shorter APD due to incomplete recovery of the ion channels, such that APD typically decreases monotonically as DI decreases (Figure 1B) (Nolasco and Dahlen, 1968; Koller et al., 1998; Goldhaber et al., 2005). However, non-monotonic APD restitution curves have also been observed (Franz et al., 1988; Watanabe et al., 1995). CV restitution curves can be similarly defined by a plot of CV versus DI (Figure 1C) (Qu et al., 1999).
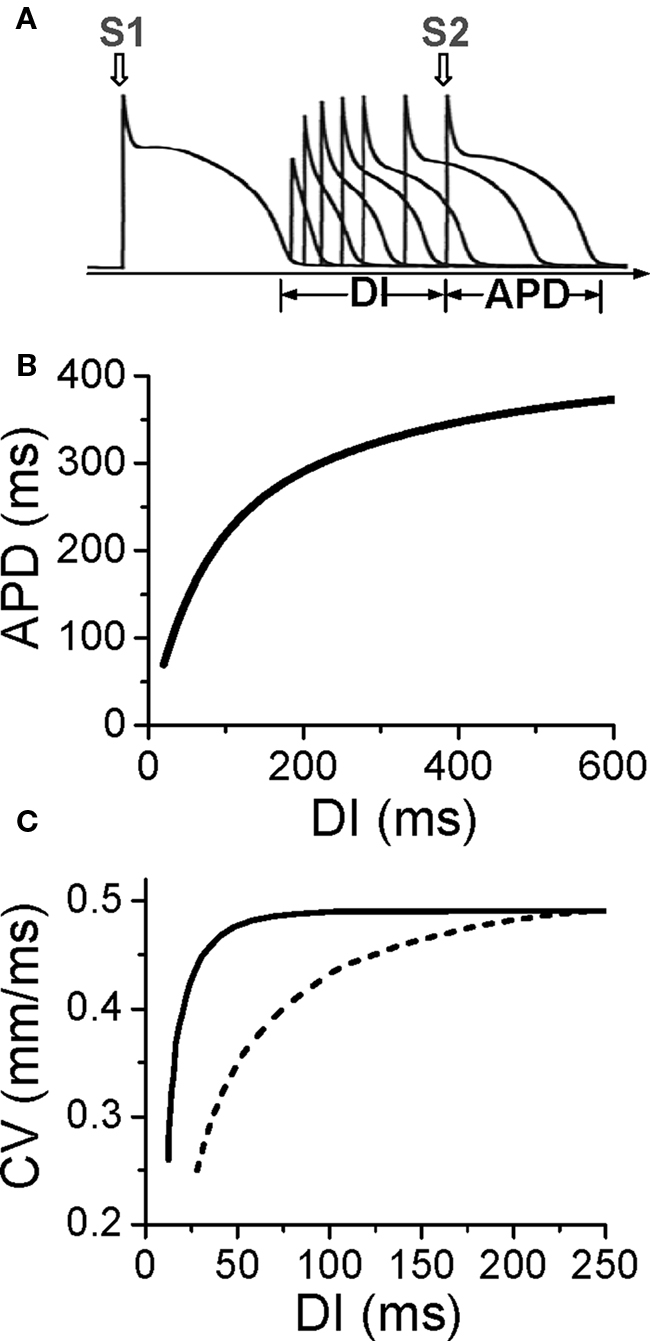
Figure 1. Electrical restitution. (A) S1S2 protocol for determining APD restitution, in which the myocyte is paced with several or many beats (S1) and then a premature stimulus (S2) is given to determine the response of APD to DI. (B) An APD restitution curve (APD versus previous DI). (C). CV restitution curves (CV versus previous DI) for normal Na channel recovery (solid) and slowed Na channel recovery (dashed).
The slope of the APD restitution curve is a collective measure of the recovery processes of all the ion channels and their interactions with voltage during the action potential (Qu et al., 2000b). Since Na channels recover from inactivation quickly, their effect on APD restitution occur mainly in the short DI range (0–40 ms) but can be extended to long DIs under ischemic conditions (Qu et al., 2004) in which Na channel recovery is slowed (Joyner et al., 1991; Pu and Boyden, 1997). Since normal Na channels are mainly inactivated during the plateau of the AP, they have minor direct effects on APD, but incomplete recovery of Na channel reduces the amplitude of the action potential, which affects the activation of other channels influencing APD. Since the action potential upstroke is determined by Na channel, CV restitution is almost completely governed by Na channel recovery (Qu et al., 2004). The L-type Ca channel (LCC) recovers more slowly than the Na channel, and its effect is manifested at short and intermediate DI ranges (0–100 ms). Since LCC provide the major inward current maintaining the action potential plateau, APD is more sensitive to LCC than other channels, so that LCC recovery plays a major role on APD restitution slope. Blocking LCC reduces the slope of APD restitution curve. Time-dependent K channels (such as IKr and IKs) recover even more slowly, so their effects span to a much longer DI range. However, due to reverse use-dependence (Hondeghem and Snyders, 1990), K channels also have non-trivial effects on the slope of APD restitution at short and intermediate DI ranges, and blocking K channels generally steepens the APD restitution curve.
Due to slow recovery of ion channels or gradual accumulation of ions (Hund and Rudy, 2000; Fox et al., 2002a,c; Li and Otani, 2003; Kalb et al., 2004; Goldhaber et al., 2005), cardiac myocytes exhibit memory. For example, the S1S2 APD restitution curves depends on the S1 PCL (Boyett and Jewell, 1978; Elharrar and Surawicz, 1983; Franz et al., 1983; Bjornstad et al., 1993; Koller et al., 1998; Kalb et al., 2004). Similarly, if the PCL changes suddenly (from long to short, or short to long), it takes many beats for APD to accommodate to the steady state (Franz et al., 1988; Watanabe and Koller, 2002). In the presence of memory, APD does not depend solely on the previous DI, but on a longer history of remote DI’s and APD’s (Choi et al., 2004).
Mechanism of Alternans Promoted by a Steep APD Restitution Curve
The mechanism of APD alternans was first elucidated by Nolasco and Dahlen (1968) who used graphical method to show that APD alternans occurred when the slope of the APD restitution curve was greater than one. Assume no cardiac memory, APD restitution is defined as the functional relationship between APD and its previous DI. Under this condition, one can denote the APD restitution by the following equation (see Figure 2A for notion):

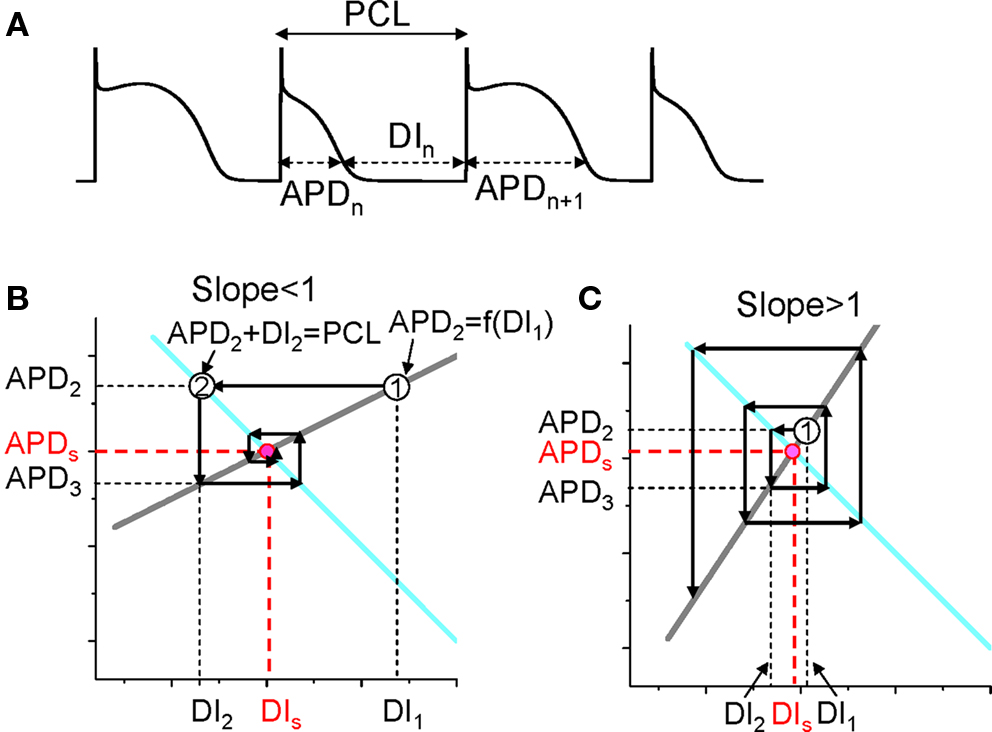
Figure 2. Dynamical instability caused by steep APD restitution curve. (A) A voltage trace illustrating the relationship between DI, APD, and PCL. (B) Cobweb diagram showing that the equilibrium point is stable when the slope of the restitution curve is smaller than one. Thick gray line is the linear APD restitution curve. The cyan line satisfying PCL = APDn + DIn. The intersection of these two lines is the equilibrium point at which APD = APDs and DI = DIs. The cobweb diagram to determine the stability was obtained as follows: starting a DI (DI1) which is away from the equilibrium point, a vertical line intersects the APD restitution curve at point “1” which is equivalent to map DI1 into APD2; a horizontal line from point “1” intersects the cyan curve at a point “2” which graphically determines the next DI (DI2); then the vertical line from point “2” intersect with the restitution curve, determining APD3. A cobweb forms as this process continues. Note that cobweb is a standard technique to graphically track, not only the instability of an equilibrium point, but also the non-linear solutions including chaos of any iterated map. This technique can be found in any text book on non-linear dynamics and chaos, such as the one by Strogatz (2000). (C) Cobweb diagram obtained as in B showing that the equilibrium point is unstable when the slope of the APD restitution curve is greater than one. The stability of the equilibrium point can be also obtained mathematically as follows. Assume that the APD restitution curve is a linear curve described by the function APDn + 1 = APDα + αDIn. At the equilibrium point, APDs = APDα + αDIs. An initial DI (DI1) that is away from the equilibrium value DIs (ΔDI1 = DI1 − DIs) results in an APD at the next beat as APD2 = APDα + αDI1 = APDα + αDIs + α(DI1 − DIs) = APDs + αΔDI1. Using the relationship PCL = APDn + DIn, one can calculate the DI (DI2) of the next beat as DI2 = PCL − APD2 = PCL − (APDs + αΔDI1) = DIs − αΔDI1, and the APD (APD3) of the following beat as APD3 = APDα + αDI2 = APDs + α(DIs − αΔDI1) = APDs − α2ΔDI1. By iterating this same process, one obtains APD of any beat as APDn = APDs + (−1)nαn−1ΔDI1. Therefore, if α < 1, αnΔDI1 < αn−1ΔDI1, so that APDn becomes closer and closer to APDs as the beat number n increases, and thus the equilibrium point is stable (as in B). If α > 1, αnΔDI1 > αn−1ΔDI1, so that APDn becomes further away from APDs as the beat number n increases, and thus the equilibrium point is unstable (as in C).
Also, PCL is the summation of the APD and DI at any beat n (see Figure 2A), i.e.,

For each PCL, there is a steady state or equilibrium point. Graphically, the equilibrium point is the intersection point (Figures 2B and C) of the restitution curve (Eq. 1) and the straight line (Eq. 2). When the slope of APD restitution curve at the equilibrium point is smaller than unity, as illustrated in Figure 2B, APD and DI, which are initially away from their equilibrium values, approach their equilibrium values as more and more iterations occur, eventually converging to the equilibrium point. Therefore, the equilibrium point is stable. Note that the system develops transient alternans and the smaller the slope, the faster APD alternans disappears. However, if the heart rate is fast so that the slope of the APD restitution curve at the equilibrium point is greater than unity, then this equilibrium point is unstable (Figure 2C). In this case, any perturbation of DI or APD from its equilibrium value will grow in amplitude. For a linear APD restitution curve, the amplitude of alternans will keep on growing until 2:1 block occurs. Since in general the slope of APD restitution curve becomes smaller for larger DI, the growth rate will be attenuated by the shallow slope region of the curve, and eventually the system may settle into a new state that alternates between two states, resulting in stable APD alternans. Figure 3 shows how two APD restitution curves with different slope properties respond differently to periodic pacing. For the restitution curve with slope smaller than one everywhere (gray line in Figure 3A), the equilibrium state is always stable, i.e., a stable 1:1 response occurs for all pacing rates until 2:1 activation occurs (Figure 3B). For the restitution curve with slope greater than one at short DI, APD alternans, and other complex dynamics can occur (Figure 3C). In this case, as PCL decreases, bifurcations from the stable equilibrium state (1:1) to alternans (2:2), from 2:2 alternans to 2:1 block are observed, and more complex AP dynamics at faster pacing rates. Although the two APD restitution curves do not look very different except for their slopes, the responses to periodic pacing are dramatically different. Note that the structure of the bifurcation shown Figure 3C is very similar to that of an experimental bifurcation diagram (Figure 3D) (Chialvo et al., 1990), indicating that the non-linear dynamics caused by steep APD restitution may indeed be responsible for the complex dynamics observed in real cardiac myocytes.
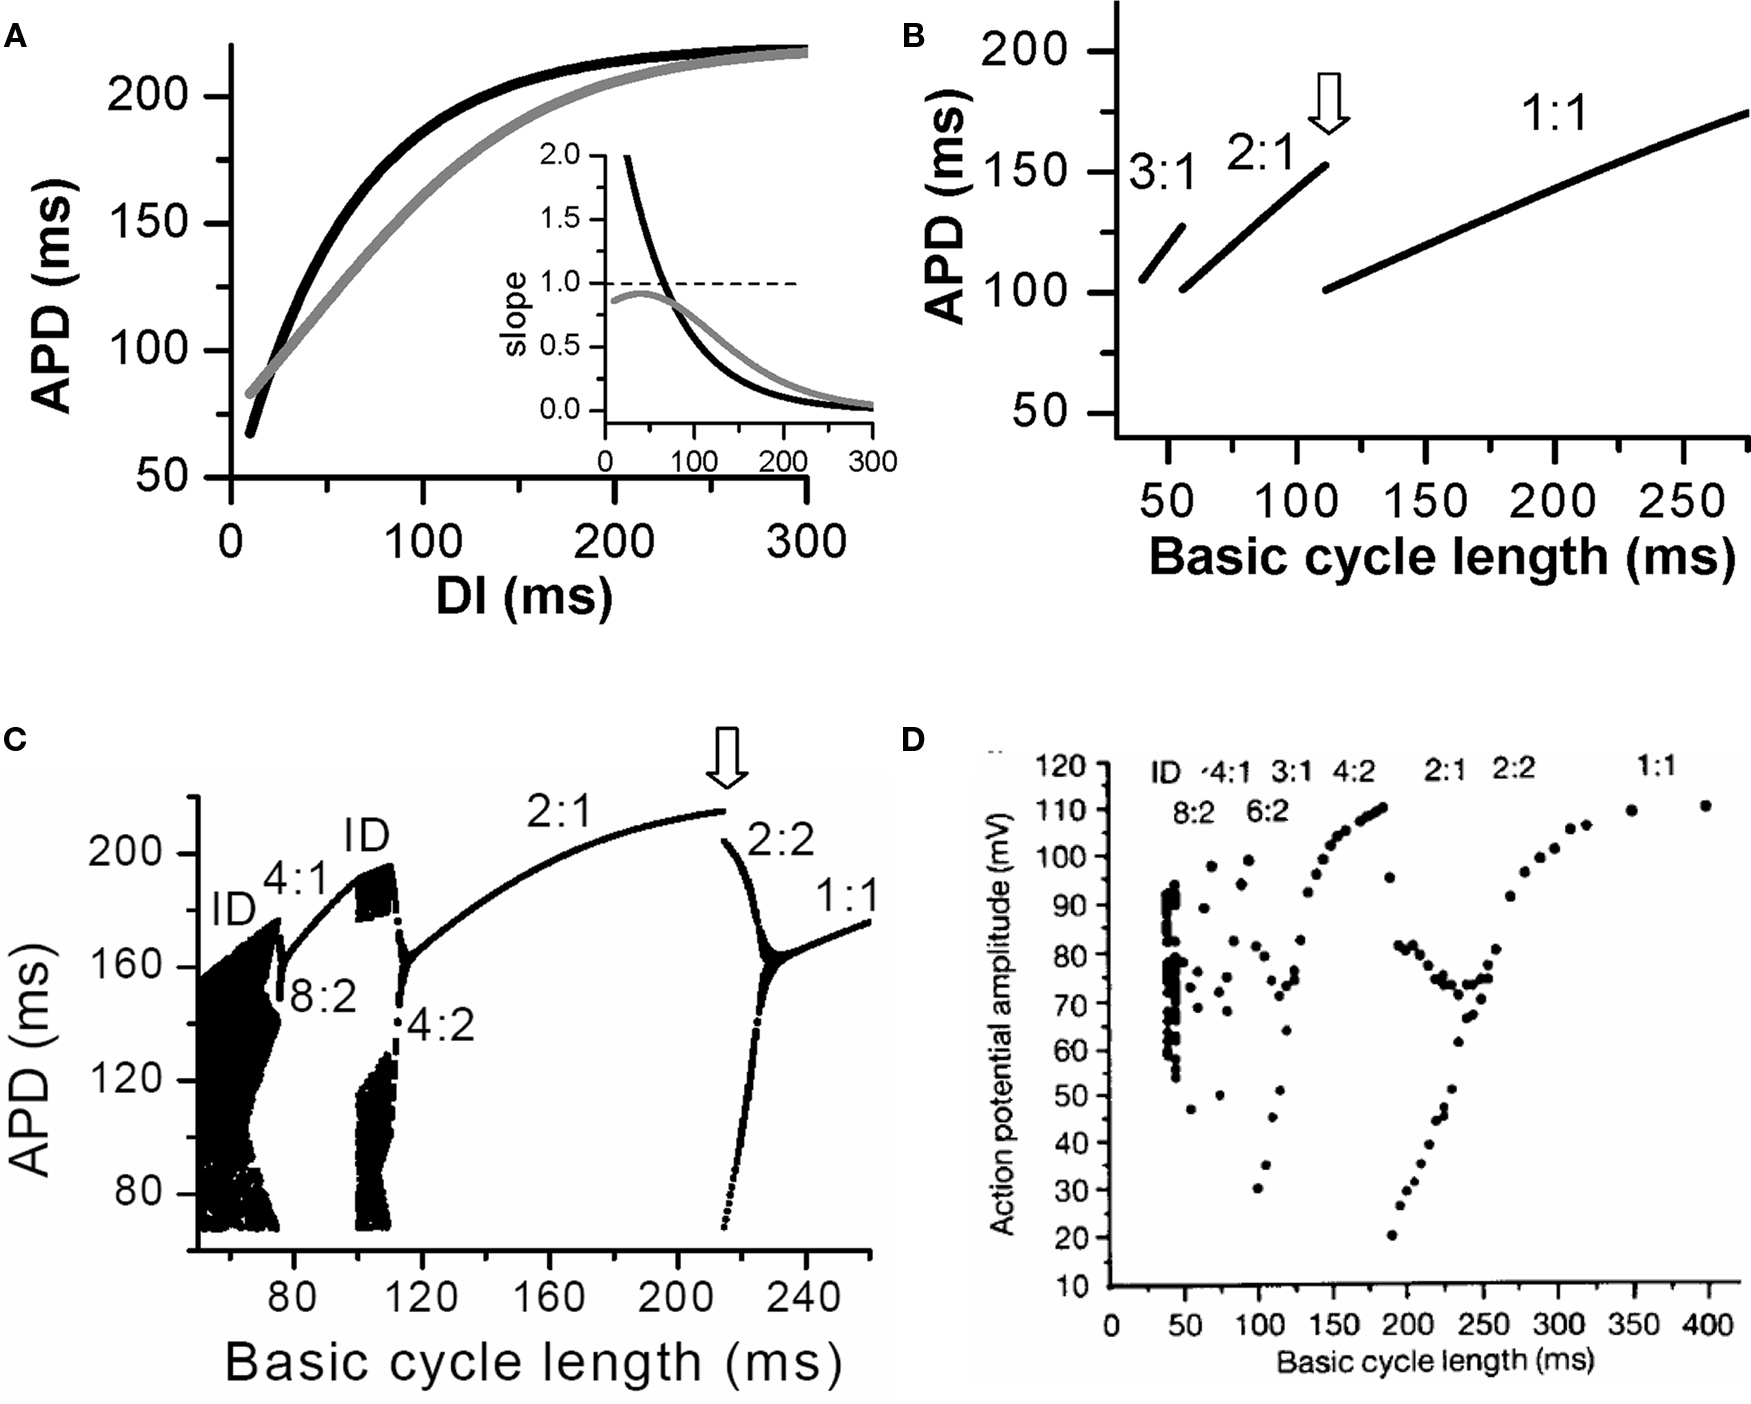
Figure 3. Action potential duration alternans and complex dynamics due to APD restitution. (A) APD restitution curves with different slope properties. Inset shows the slopes of the two APD restitution curves. (B). A bifurcation diagram by plotting APD versus PCL for the shallow APD restitution curve. The figure was obtained by iterating Eqs. 1 and 2 with many iterations for a given PCL. For each PCL, the first 100 APDs were dropped and the next 100 APDs were plotted. Since the equilibrium point is always stable, only one point for each PCL shows up on the plot in this case. However, if alternans (or chaos) occurs, two (or many) APD points will show up as is the case in C. (C) A bifurcation diagram for the steep APD restitution curve. (D) Bifurcation diagram from an experiment (Chialvo et al., 1990).
In reality, due to memory effects, APD relies on more than just the previous DI, i.e., APDn + 1 = f(DIn, DIn−1, …). In addition, due to slow APD adaptation to PCL change, it may take many seconds for APD to reach its steady state value (Franz et al., 1988; Franz, 2003), and thus depending on the number of S1 beats given, the S1S2 APD restitution curve may be very different. In general, as PCL shortens, APD becomes shorter (Franz et al., 1988; Franz, 2003), and APD restitution curve becomes less steep (Baher et al., 2007), and thus alternans caused by initially steep APD restitution curve may only be transient, which will eventually disappear due to APD shortening and slope reduction. Therefore, in the presence of memory, the slope of the S1S2 APD restitution (or any type of APD restitution curve (Koller et al., 1998; Kalb et al., 2004; Goldhaber et al., 2005) cannot be used to accurately predict the existence of steady state alternans, and more complicated non-linear dynamics analyses are required (Fox et al., 2002a). The slope of APD restitution curve may also fail to predict the onset of alternans when Ca cycling has a strong influence on action potential, as the Ca cycling system can itself exhibit alternans (Goldhaber et al., 2005; Shiferaw et al., 2005; Qu et al., 2007). APD restitution slope is also not an accurate parameter for predicting alternans under certain other conditions, as shown in simulations of atrial myocytes (Xie et al., 2002) and in experiments in ventricular myocytes during hypokalemia (Osadchii et al., 2010), in which effective refractory period (ERP) restitution is a better indicator. Another case is acute and chronic ischemia in which postrepolarization refractoriness is present (Janse and Wit, 1989), so that APD no longer approximate ERP. In this case, the ERP restitution slope may be a better indicator for instability, which needs to be evaluated in future studies.
CV Restitution and Spatially Discordant Alternans
In cardiac tissue, APD alternans can be either spatially concordant or spatially discordant (Cao et al., 1999; Pastore et al., 1999; Qian et al., 2001; Hayashi et al., 2007). In concordant alternans, APD is long throughout the entire tissue on one beat and short throughout the next beat (Figure 4A). In discordant alternans, which occurs at shorter PCLs, APD alternates out of phase in neighboring regions (Figure 4B), i.e., APD is long in one region and short in an adjacent region on one beat, and changes phase on the next beat. CV restitution as a mechanism of spatially discordant alternans was first shown by Cao et al. (1999), and was more rigorously proven in later theoretical studies (Qu et al., 2000a; Echebarria and Karma, 2002), and demonstrated in experiments (Hayashi et al., 2007; Mironov et al., 2008). The major conclusion is that if APD alternans occurs in a DI range in which CV is not also changing, alternans in tissue is spatially concordant. However, if APD alternans occurs in the DI range in which CV is also varying with DI (at short DI), then spatially discordant alternans can form if the tissue size is adequate. Since the QT interval and the T-wave in ECG correlate with APD and its spatial distribution, APD alternans is manifested as TWA in ECG. During spatially discordant alternans, CV varies, which affects the width and amplitude of QRS in ECG, resulting in both T-wave and QRS alternans. This prediction agrees with the experimental observation that only TWA occurred during concordant alternans (bottom panel of Figure 4A), but both QRS and TWA occurred during discordant alternans (bottom panel of Figure 4B).
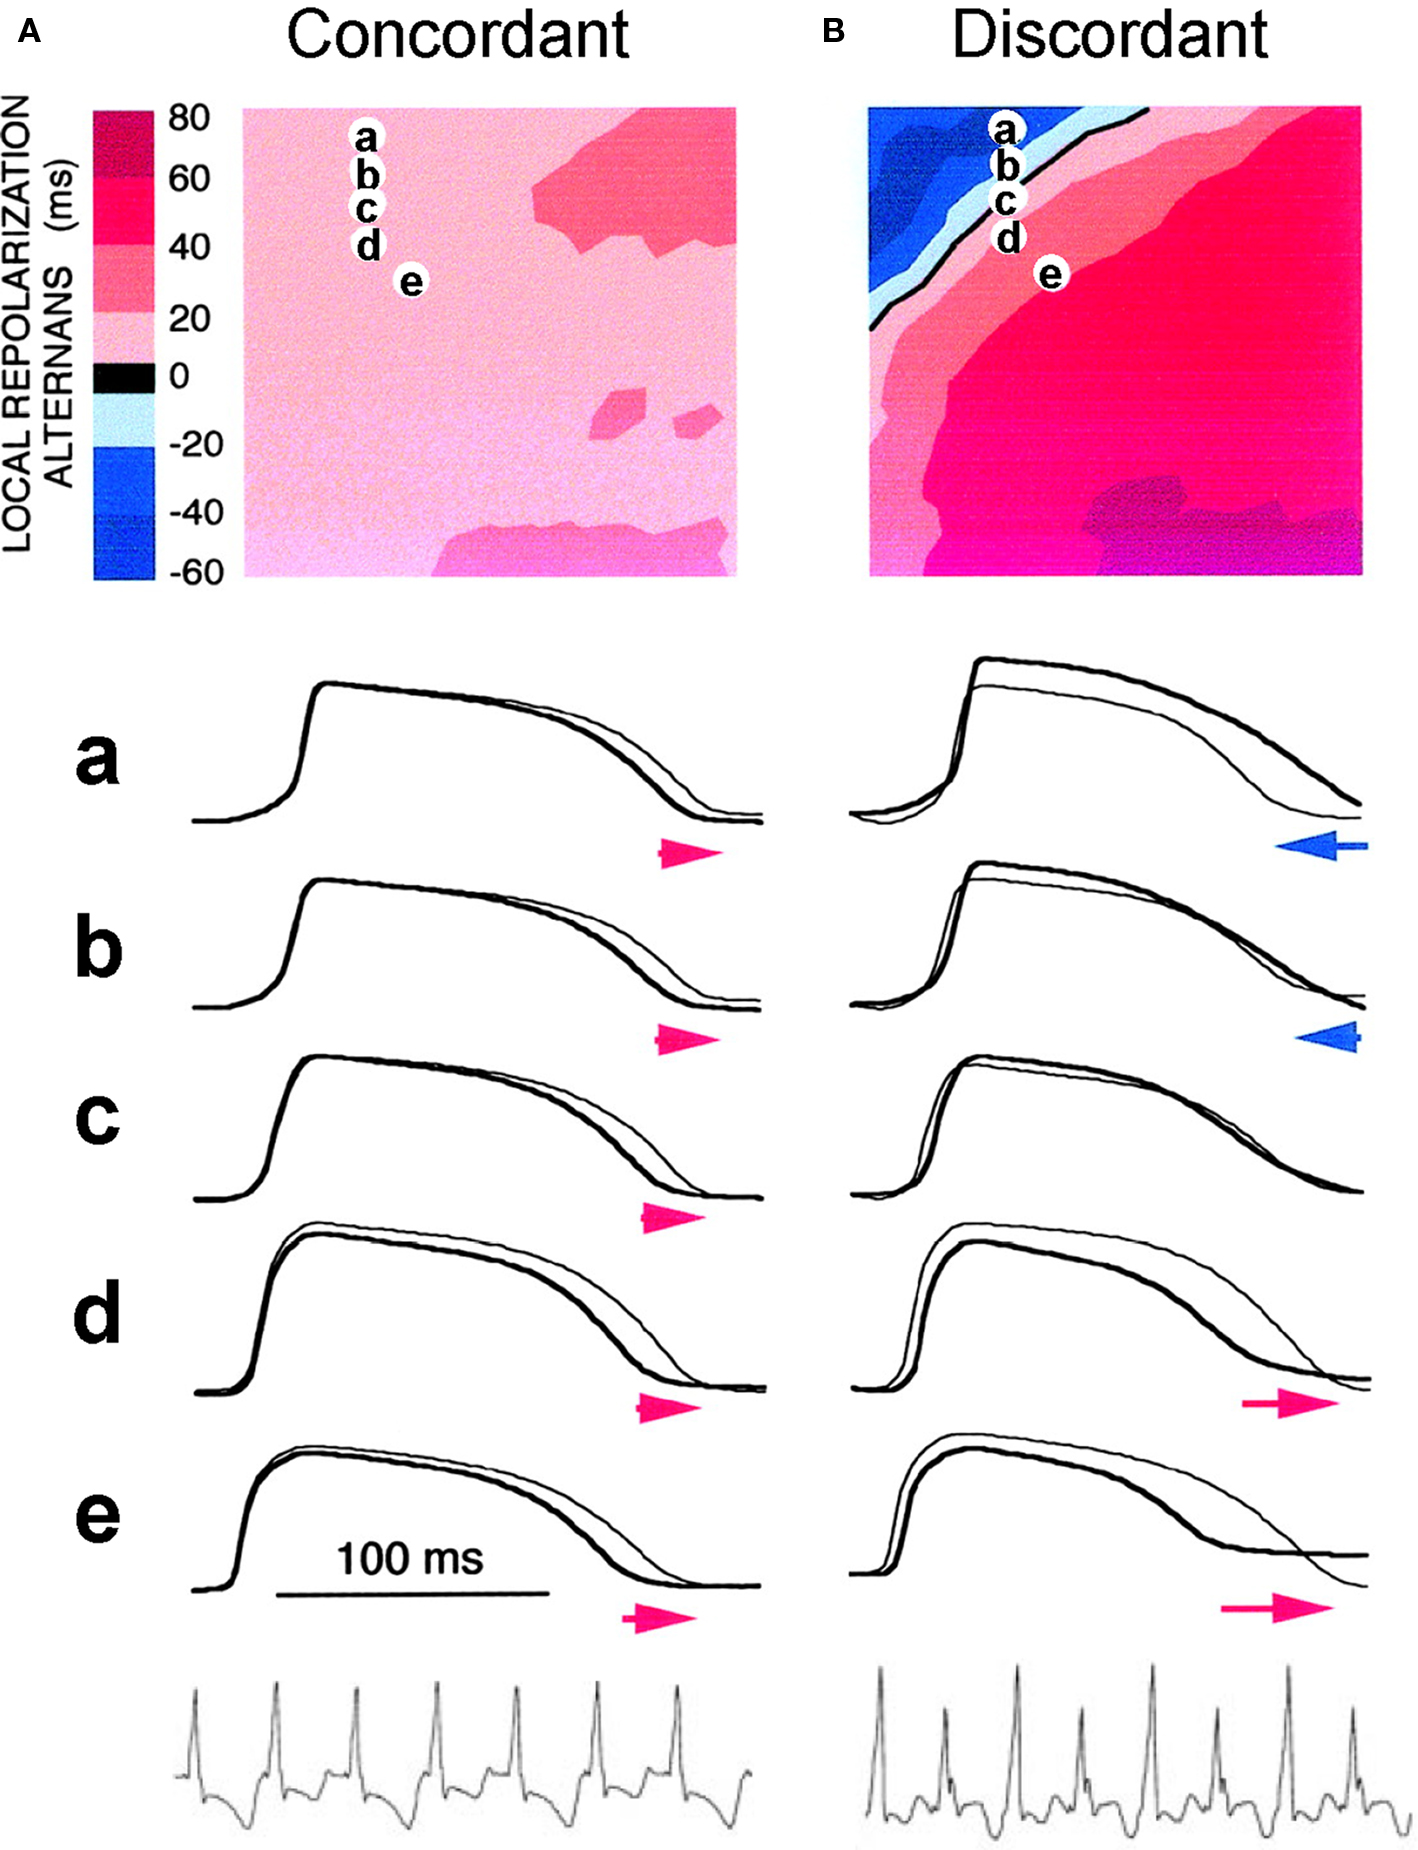
Figure 4. Spatially concordant and discordant alternans (modified from Pastore et al. (1999)). (A) Concordant alternans. Top: ΔAPD = APDn + 1 − APDn distribution in space; Middle: sample action potential recordings for two consecutive beats from the sites marked on the upper panel; Bottom: Pseudo-ECG showing TWA. Since APD alternans is concordant, the color in the top panel is uniform in space (ΔAPD everywhere is positive in one beat and negative in the following beat) and since no CV restitution is engaged, no QRS alternans in the ECG. (B) Same as A but for discordant alternans. Since APD alternans is discordant, the color in the top panel is no longer uniform in space, but change from one to the other (ΔAPD changes from negative to positive as the color changes from blue to red in space, and color map reverse in the following beat), and since CV restitution is engaged, QRS alternans occurs in the ECG.
Arrhythmogenesis
The arrhythmogenic effects of APD alternans due to steep APD restitution curve occurring at short DIs can be understood as follows. First, spatially discordant alternans results in large spatial gradients of APD or refractoriness. This generates a tissue substrate that can potentiate local conduction block of a premature ventricular complex (PVC) to induce reentry (Pastore et al., 1999; Qu et al., 2000a, 2006). Second, alternans itself promotes conduction block (Fox et al., 2002b). For example, the two APD restitution curves in Figure 3 look not very different, but 2:1 block occurs at a much shorter PCL (∼110 ms) when the APD restitution curve has a slope smaller than one everywhere than in the case of steep APD restitution curve (at PCL ∼220 ms). Therefore, APD alternans not only promotes a susceptible reentry substrate, but also potentiates conduction block to initiate reentry. Since steep APD restitution curve-induced instabilities occur at fast heart rates, their arrhythmogenic effects can be potentiated under the following conditions: (1) fast sinus rhythm due to exercise or fast pacing, as in clinical and experimental pacing studies to induce reentrant arrhythmias; (2) the transition from focal VT to multiple wavelet VF, or transition from reentrant VT (such as anatomical reentry) to multiple wavelets VF (Garfinkel et al., 2000; Wu et al., 2004). In addition to its arrhythmogenic effects at fast heart rates, APD alternans may be applicable to arrhythmogenesis when APD is substantially prolonged, such as in the long QT syndromes or heart failure, so that DI becomes short enough to engage the steep slope range of the APD restitution curve, even at normal heart rates. Another example is ischemia, in which the Na channel conductance is reduced and recovery slowed (Joyner et al., 1991; Pu and Boyden, 1997), causing postrepolarization refractoriness. This not only broadens the range over which CV restitution occurs, potentiating spatially discordant alternans, but it also makes alternans occur at slower heart rates (Qu et al., 2004).
Alternans Induced by the Transient Outward Current (Ito)
In an experimental study in isolated canine ventricular tissue and myocytes, Lukas and Antzelevitch (1993) showed that APD alternans occurred in epicardial myocytes under “simulated ischemia” conditions with alternating loss-of-dome of the action potential (Figure 5A). The APD alternans resolved when the outward transient current (Ito) was blocked, indicating that the alternans was associated with Ito. In a recent modeling study, Hopenfeld (2006) was able to simulate the same alternans phenomenon and show that the alternans was caused by the interaction of Ito and ICa,L. By adding Ito to the Luo–Rudy phase 1 (LR1) model (Luo and Rudy, 1991), one can also easily induce APD alternans similar to the experimental observations (Figure 5B). This type of APD alternans can also be induced by fibroblast–myocyte coupling since fibroblast–myocyte coupling generates a gap junction current to the myocyte similar to Ito (Xie et al., 2009). Different from alternans in other conditions (Karagueuzian et al., 1993; Koller et al., 1998; Cao et al., 1999; Pastore et al., 1999; Christini et al., 2006; Hayashi et al., 2007; Mironov et al., 2008), alternans in this case occurs at normal heart rates (PCL 800 ms or 75 bpm) where the DI is still very long. Ito-mediated spike-and-dome action potential morphology is linked to Brugada syndrome, and TWA is widely observed in Brugada syndrome (Chinushi et al., 2001; Morita et al., 2002, 2006; Takagi et al., 2002; Nishizaki et al., 2005; Fish and Antzelevitch, 2008; Tada et al., 2008). In agreement with the Ito-mediated APD alternans shown in Figures 5A and B, TWA in Brugada syndrome also occurs at normal heart rates in which the DIs (TQ intervals in the ECG) of the alternating beats are still very long (Figure 5C) (Nishizaki et al., 2005).
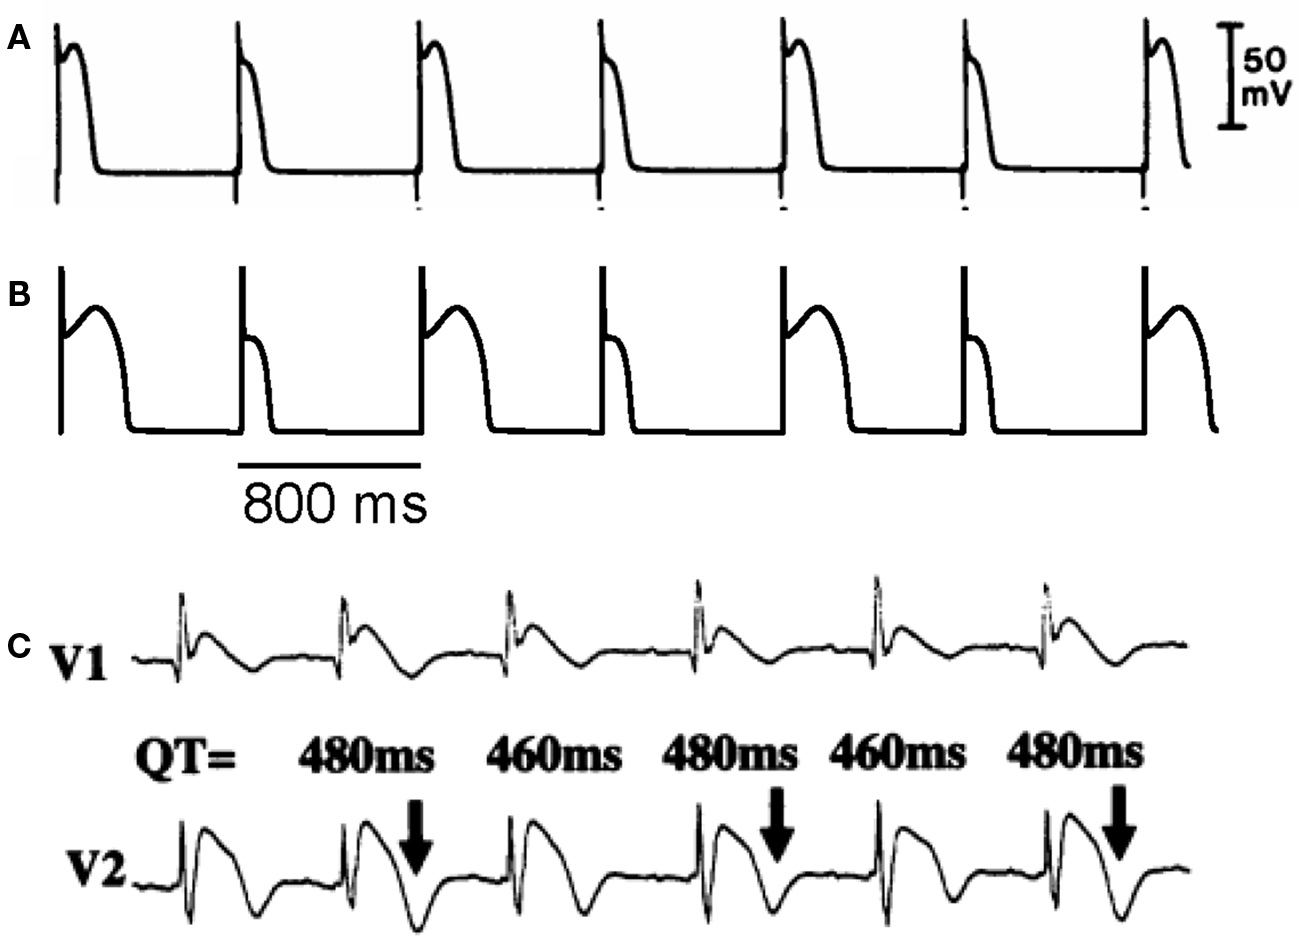
Figure 5. Action potential duration alternans induced by Ito. (A) APD alternans from a canine epicardial myocyte under “simulated ischemia” condition (Lukas and Antzelevitch, 1993). (B) APD alternans from the LR1 model with an Ito added. PCL = 800 ms which is the same as in the experiment in A. (C) ECG from a patient with Brugada syndrome showing TWA (Nishizaki et al., 2005).
Mechanisms of Alternans Induced by Ito
After adding Ito to the LR1 model, APD alternans only occurred in the middle range of PCLs (Figure 6A). To determine the relationship to APD restitution, S1S2 APD restitution curves were calculated. Figure 6B shows two APD restitution curves for two different S1 pacing intervals, exhibiting a strong memory effect. The slope of the restitution curves is maximum in the middle range of DI, and exceeds one in a DI range much narrower than the range over which APD alternans occurs (DI range for alternans changed from 355 to 640 ms). Therefore, none of the S1S2 restitution curves predict the occurrence of alternans. However, when we took into account the memory effects by constructing a restitution relation in which APD also depends on DIs over a longer history, i.e., APDn + 1 = f(DIn, DIn−1, …, DIn−k), we accurately predicted the bifurcation leading to APD alternans (unpublished results). In this case, instead of using the slope of the APD restitution curve to predict the occurrence of alternans, we followed the standard linear stability analysis by calculating the eigenvalues of the system to determine the stability of the system (Strogatz, 2000).
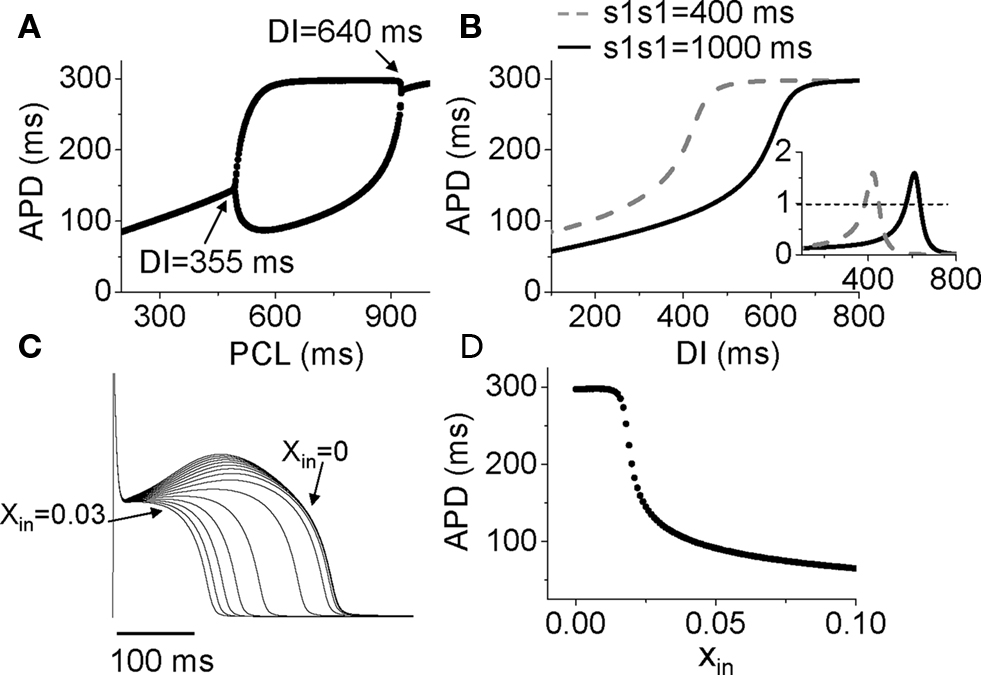
Figure 6. Mechanisms of Ito induced alternans. (A) A bifurcation diagram by APD versus PCL. (B) APD restitution curves for two different S1S1 intervals. Inset shows the slopes of the two APD restitution curves. (C) Action potentials for different initial values of x (xin = 0 to 0.03). (D) APD versus the initial values of x (xin).
Therefore, APD restitution slope is still a general, but not highly accurate, predictor for alternans in this case. In other words, if the APD restitution curve is made to be shallower, APD alternans can be suppressed. A question, then, is how does Ito cause a steep region in the APD restitution curve, and why does Ito-mediated alternans can occur at very slow heart rates. In the LR1 model, there is no ion accumulation, and the Na channel and LCC recover completely at the long DIs at which alternans occurs. The only variable that still varies with DI is the gating variable x of the time-dependent K channel, which recovers slowly. To show how K channel recovery affects the action potential in the presence of Ito, we plot a family of action potentials by varying the gating variable x at the moment of stimulation (i.e., the initial value of x, denoted as xin) while maintaining the initial values of the other variables unchanged (Figure 6C), and plot APD versus this initial x value in Figure 6D. As x increases, the action potential gradually loses its spike-and-dome morphology, which results in a sensitive dependence of APD on xin. The sensitive range occurs at the small x values, which means that the x gate is almost recovered, explaining why APD is sensitive to small changes in DI in slow heart rates. As to why the spike-and-dome morphology is sensitive to the K channel recovery, this is a complex issue. As shown by Greenstein et al. (2000), ICa,L plays an important but complex role in regulating the action potential morphology and duration. The APD restitution property in the presence of Ito is due to a complex interaction among IK, Ito, and ICa,L. We will present a detailed dynamical analysis on this issue in a future publication (unpublished data). Also note that in real systems, other slow changes, such as the slow recovery of Ito itself, can be responsible to the sensitivity at slow heart rate, not necessarily the K channel recovery per se.
Arrhythmogenesis
Since Ito-mediated APD alternans occurs at normal heart rates at which the DIs of the alternating beats are still very long, CV restitution may not be engaged. Therefore, spatially discordant alternans mediated by CV restitution is not likely to occur. For the same reason, 2:1 regional conduction block due to wave front–tail interaction is also unlikely. Therefore, whether alternans induced by Ito or TWA in Brugada syndrome has any causal relationship to arrhythmogenesis is unclear. On the other hand, phase-2 reentry has been proposed as a tissue mechanism of arrhythmias in Brugada syndrome (Antzelevitch, 1999; Yan and Antzelevitch, 1999; Morita et al., 2006; Fish and Antzelevitch, 2008). In phase-2 reentry, action potential with a spike-and-dome morphology in one region reenters a neighboring region with earlier recovery due a shorter APD without a dome. Computer simulations simply following this hypothesis showed that phase-2 reentry could be induced only in narrow parameter regions even when the large spike-and-dome morphology is maximized (Miyoshi et al., 2003, 2005; Maoz et al., 2009). In a recent study, Maoz et al. (2009) showed that when alternans and other complex APD patterns occurred, phase-2 reentry could be induced in a much wider parameter range, even in homogeneous tissue (Figure 7). This indicates that dynamical instabilities that cause alternans and other complex action potential dynamics promote dynamical tissue substrates that are different from static heterogeneities to potentiate phase-2 reentry in Brugada syndrome. Therefore, APD alternans induced by Ito or TWA in Brugada syndrome, although it occurs at slow or normal heart rate, may still have a causal relationship to arrhythmogenesis.
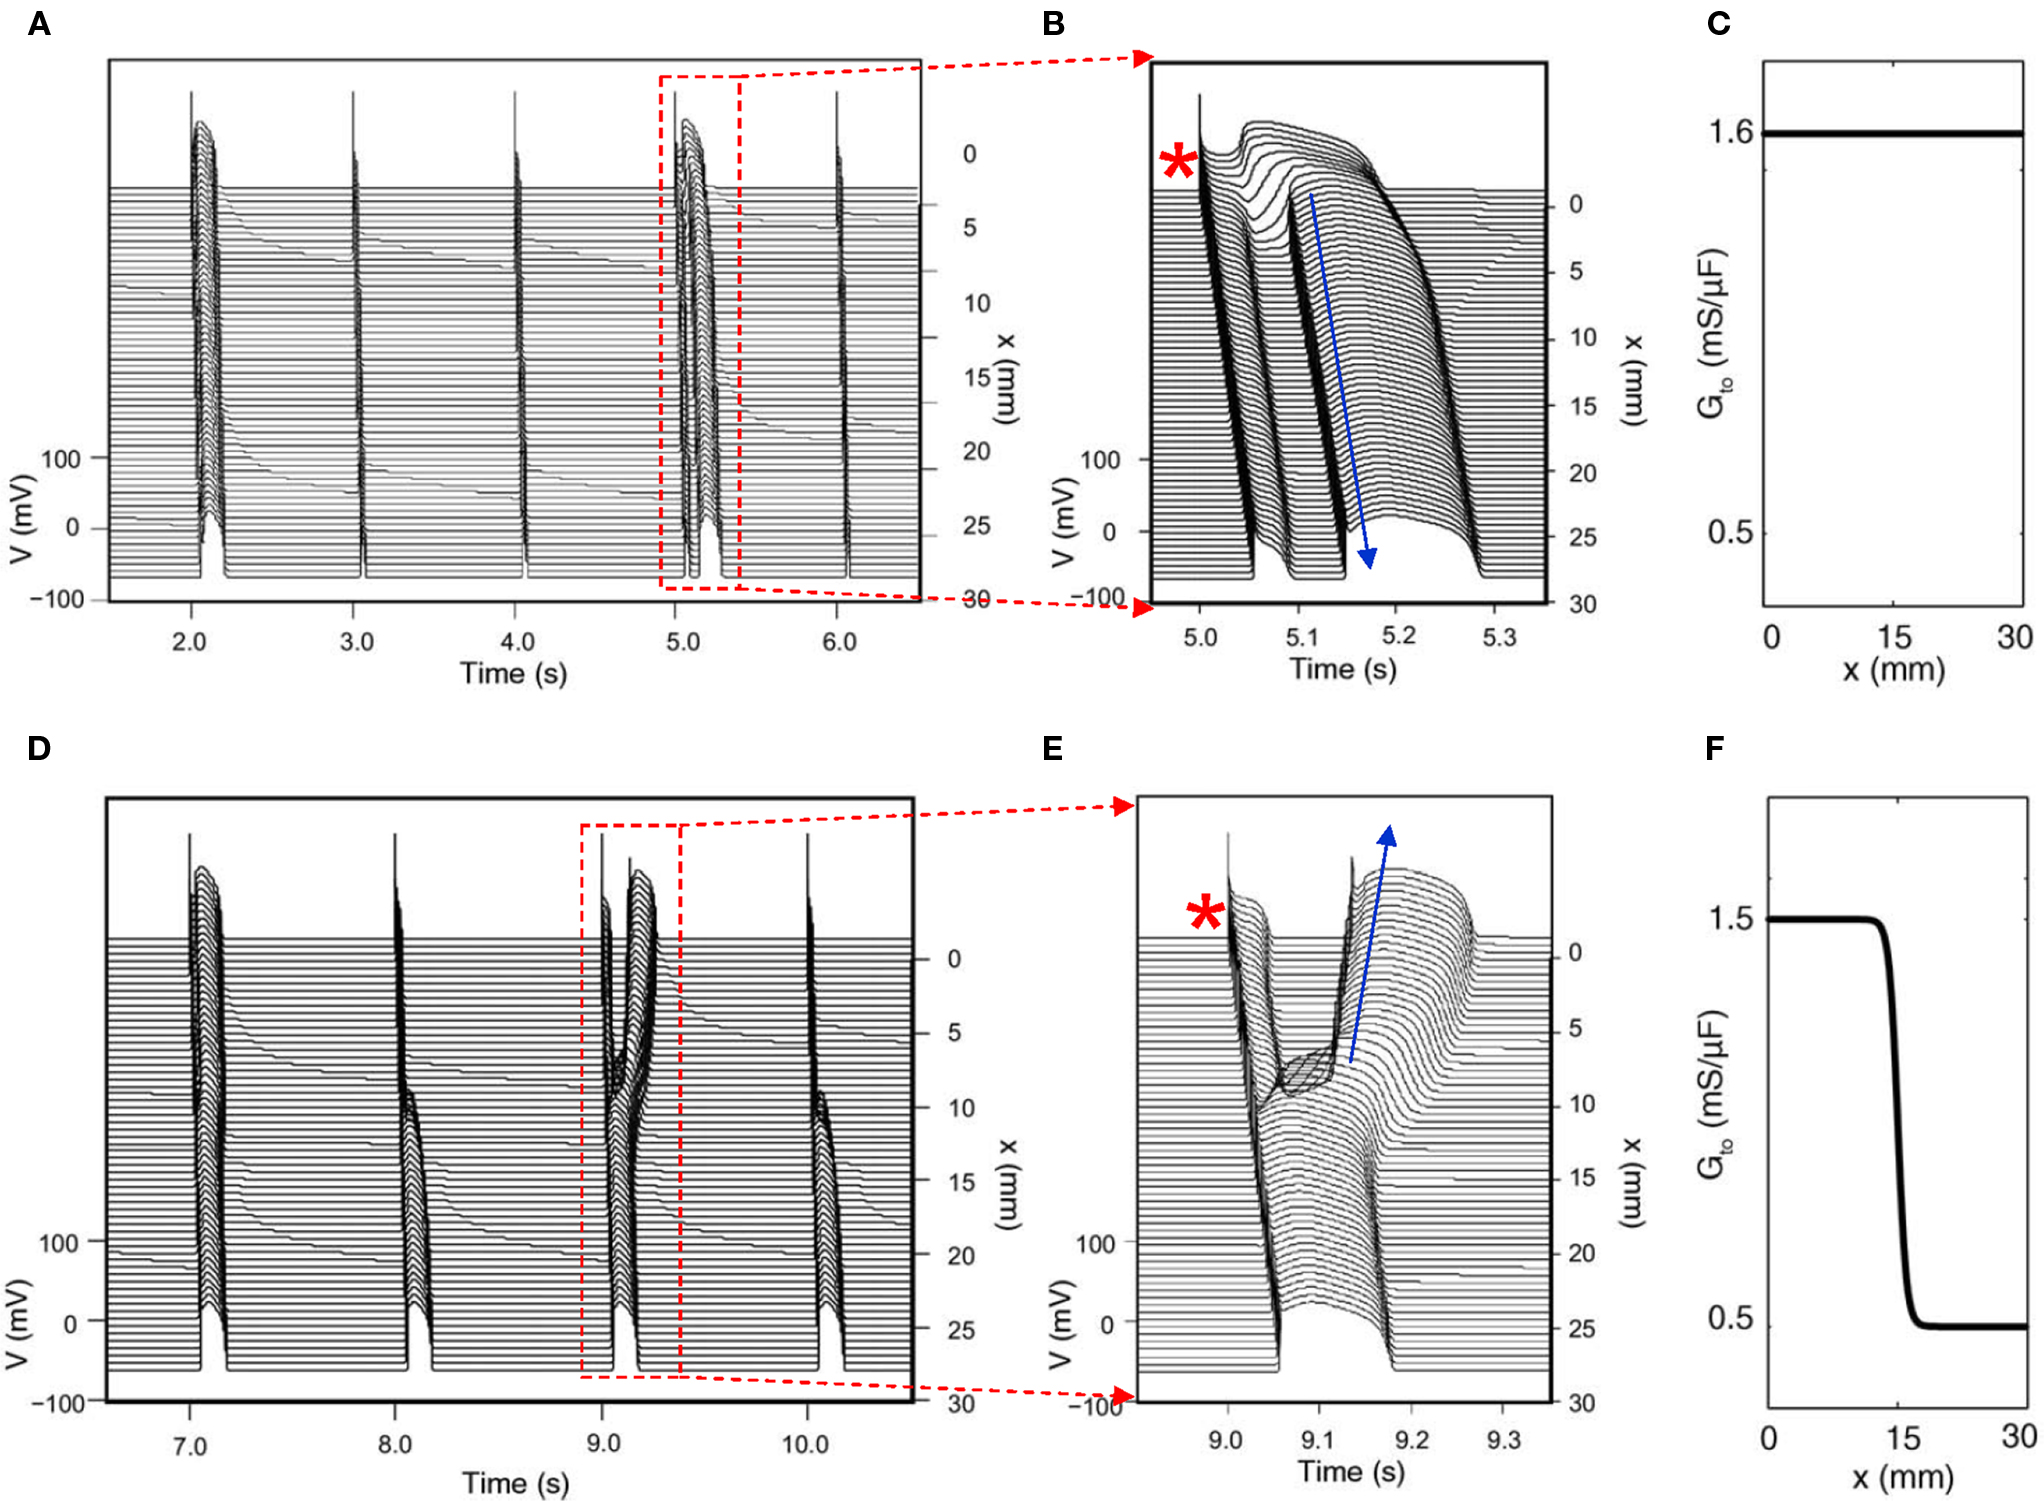
Figure 7. Phase-2 reentry due to dynamical instabilities (Modified from Maoz et al. (2009)). (A) Phase-2 reentry in a homogeneous 1D cable (Ito distribution in C). On the first beat shown, the action potential is long and exhibits spike-and-dome morphology for all cells. On the second and third beats, the action potential is short with no dome. On the fourth beat (close-up in B), however, the action potential becomes spatially heterogeneous, cells close to the pacing site (*) exhibit spike-and-dome morphology and distal cells lose the dome, leading to an anterograde phase-2 reentry (arrow). (D) Phase-2 reentry in a heterogeneous cable (Ito distribution in F). In the small Ito region, the action potential morphology is always stable, but in the large Ito region, the action potential morphology is unstable, forming retrograde phase-2 reentry on the third beat (Close-up in E).
Alternans Resulting from Early Afterdepolarization Dynamics
Ionic Mechanisms of Eads
Early afterdepolarizations (EADs) are abnormal depolarizations occurring during the plateau or the repolarizing phase of the action potential (Figure 8A). EADs usually occur in the setting of reduced repolarization reserve (Roden, 1998), which can result from a reduction in outward currents, or an increase in inward currents, or both. Specifically, EADs can be induced by reducing the outward currents, such as the two components of the time-dependent potassium current (IKs and IKr) (Keating and Sanguinetti, 2001; Sanguinetti and Tristani-Firouzi, 2006), which are the causes of arrhythmias for LQT1 and LQT2. EADs can also be induced by promoting the late sodium current (INa) (Clancy and Rudy, 1999; Song et al., 2006), which is the cause of arrhythmias for LQT3; by increasing the window ICa,L (January and Riddle, 1989; Antoons et al., 2007); or by increasing INCX (Luo and Rudy, 1994; Burashnikov and Antzelevitch, 1998). EADs can also occur when the myocyte is overloaded with Ca causing spontaneous SR Ca release in systole (Volders et al., 2000). Classically, EADs emerge during bradycardia, since repolarization reserve is reduced because time-dependent K currents, such as IKs, enter more deeply closed states, and thus are less activated during an action potential (Silva and Rudy, 2005). However, EADs can also occur at fast heart rates (Huffaker et al., 2004), due to Ca accumulation enhancing inward currents, such as INCX or the Ca-activated non-selective cation current Ins(Ca), especially in late phase 3 when inward INCX is potentiated by negative membrane potential (Luo and Rudy, 1994).
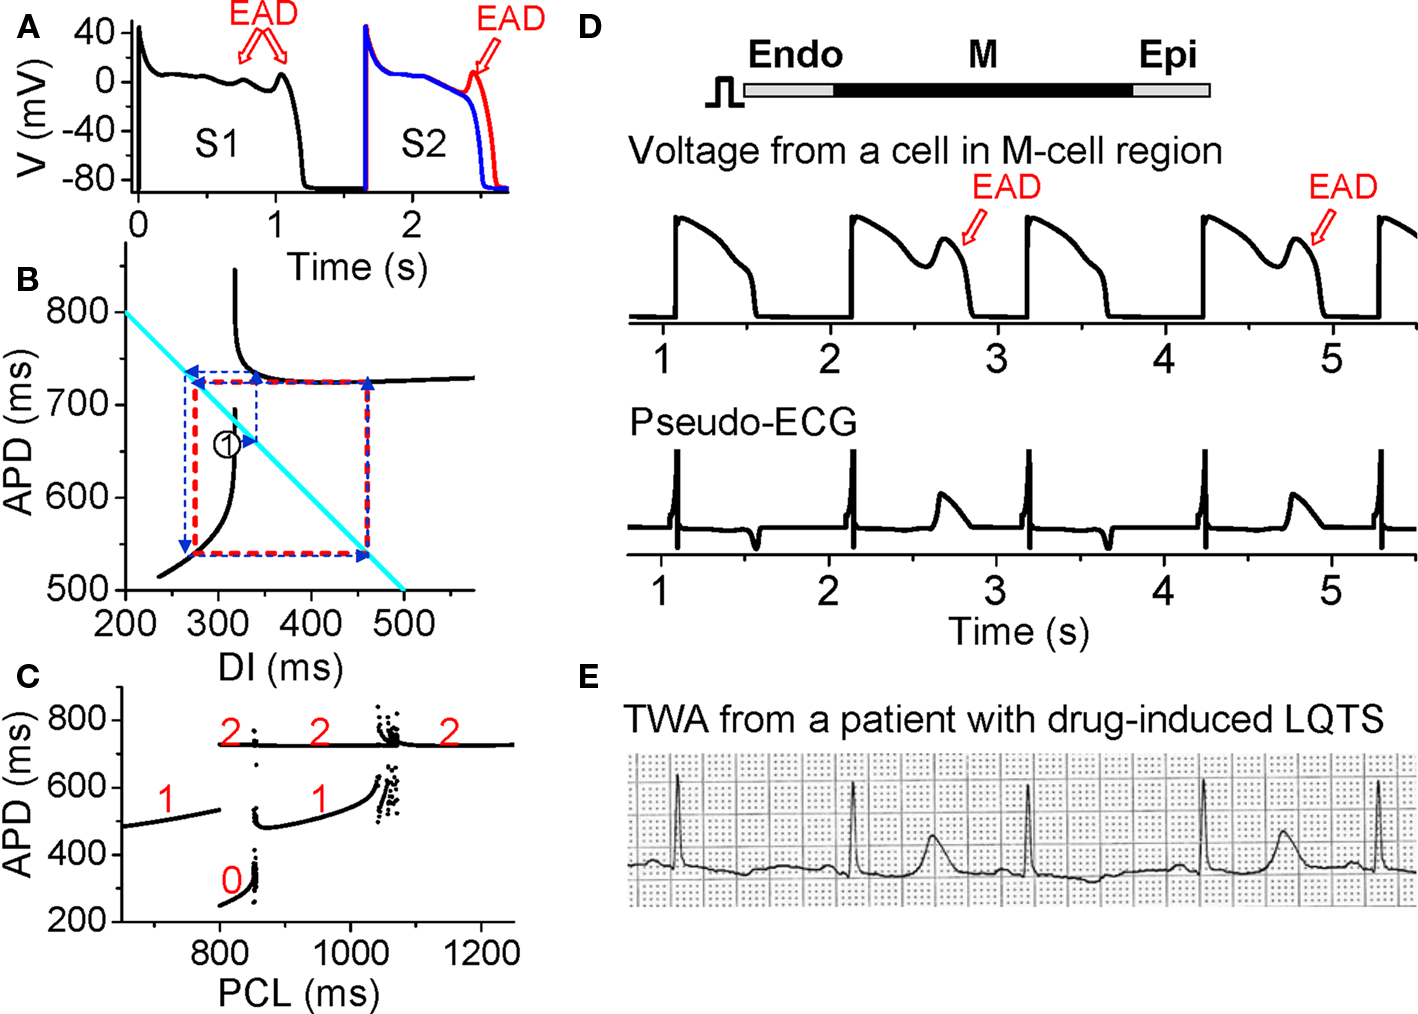
Figure 8. Action potential duration alternans resulting from EAD dynamics. (A) S1S2 restitution protocol (as explained in Figure 1A). After the S1 beat, two S2 beats are shown in which the DI of the read trace is 1 ms larger than the blue one, showing that at the APD discontinuous point, a very small increase in DI results in an action potential with an EAD. (B) S1S2 APD restitution curve (black lines) when EADs occur at slow heart rates. The discontinuous jump in APD indicates that the action potential changes from no EAD to one EAD, or from one to two EADs, an all-or-none behavior. The cyan line satisfying PCL = APDn + DIn. The arrowed blue lines illustrated cobweb diagram leading to alternans (red dashed square). (C). A bifurcation diagram showing steady state APD versus PCL obtained by iterating the map as shown in B. The numbers indicate number of EADs in an action potential for the corresponding APD value. (D) Simulation results of a 1D cable showing EAD alternans and TWA. (E). ECG showing TWA from a patient with drug-induced long QT syndrome (Wegener et al., 2008). Panels A–C were modified from Sato et al., 2009, 2010.
Alternans Resulting from EADs
Despite the various complex ionic mechanisms, we showed recently that EADs are caused by dynamical instabilities and can exhibit many complex temporal patterns including APD alternans under periodic pacing (Sato et al., 2009, 2010; Tran et al., 2009). The major non-linear dynamics can also be captured by the APD restitution curve. When EADs are present, the APD restitution curve becomes non-monotonic and discontinuous (black lines in Figure 8B). As DI increases, APD first increases steeply, after which a discontinuous jump occurs [where one more EAD occurs in the action potential (Figure 8A)] and then APD decreases and saturates. Using the same cobweb technique as shown in Figure 2, one can obtain complex action potential dynamics including alternans (Figure 8C). The cobweb in Figure 8B illustrates how APD alternans forms in this system. Figure 8D shows a simulation in a 1D cable, demonstrating that EAD alternans causes TWA. The ECG morphology from the simulation agrees well with TWA recorded from a long QT patient (Figure 8E) (Wegener et al., 2008).
Arrhythmogenesis
While EADs are known to increase substrates vulnerability (by increasing APD dispersion) and promote triggers (PVCs) for reentry formation, especially in long QT syndromes and heart failure, the role of EAD-induced TWA in arrhythmogenesis is not known. On the other hand, TWA is frequently observed in long QT patients and often precedes Torsades de Pointes (TdP) (Armoundas et al., 2000; Kroll and Gettes, 2002; Wegener et al., 2008; Verrier and Nieminen, 2010a). TWA in long QT syndromes can be caused by steep APD restitution at short DI, especially since APD is prolonged which shortens DI at all heart rates. However, as shown in Figure 8E, during TWA alternans in long QT patients, the DI (or TQ interval in the ECG) may not be short, which agrees with the mechanism of EAD-induced APD alternans at slow heart rates. In addition, multiple ectopic foci resulting from EADs have been hypothesized (Dessertenne, 1966) and demonstrated (Asano et al., 1997; Choi et al., 2002) as a mechanism of TdP. Since EADs are associated with both TWA and TdP, this may explain the clinical observation that TWA often precedes TdP. The question of whether TWA plays any role in causing TdP is not clear. However, based on our recent study (Sato et al., 2009), the dynamical instabilities caused by EADs are important for initiating arrhythmias and maintaining the multiple foci to manifest TdP. Therefore, TWA in long QT syndromes may potentiate the substrates for TdP, similar to the role of TWA in Brugada syndrome. Nevertheless, if both TWA and TdP are caused by EADs, then preventing EADs can prevent the arrhythmias.
Alternans Arising from Instabilities of Intracellular Ca Cycling
Intracellular Ca Alternans
Action potential duration is influenced by the intracellular Ca transient, and conversely, the Ca transient affects APD. If APD alternates due to electrical instabilities, the Ca transient will also alternate. However, Ca alternans can also be primary, since it can occur under voltage clamp conditions (Chudin et al., 1999; Diaz et al., 2002, 2004; Figure 9). Thus, if voltage is not clamped, primary Ca alternans can cause APD alternans and thus TWA. Several mechanisms of Ca alternans have been described. The first mechanism, proposed by Eisner et al. (2000), postulates that Ca alternans is due to a steep non-linear dependence of sarcoplasmic reticulum (SR) Ca release upon the diastolic SR Ca load immediately preceding the release (a steep fractional release–load relationship). This mechanism requires that diastolic SR Ca load alternate concomitantly with SR Ca release. Subsequent experimental (Diaz et al., 2002, 2004; Xie et al., 2008) and theoretical (Shiferaw et al., 2003; Weiss et al., 2006; Qu et al., 2007; Tao et al., 2008) studies have provided evidence supporting this mechanism. However, later experimental studies in rabbit ventricular myocytes by Picht et al. (2006) and in cat atrial myocytes by Hüser et al. (2000) showed that under some conditions, SR always refilled to the same level before each beat during Ca alternans, indicating that Ca alternans may not rely on SR content.
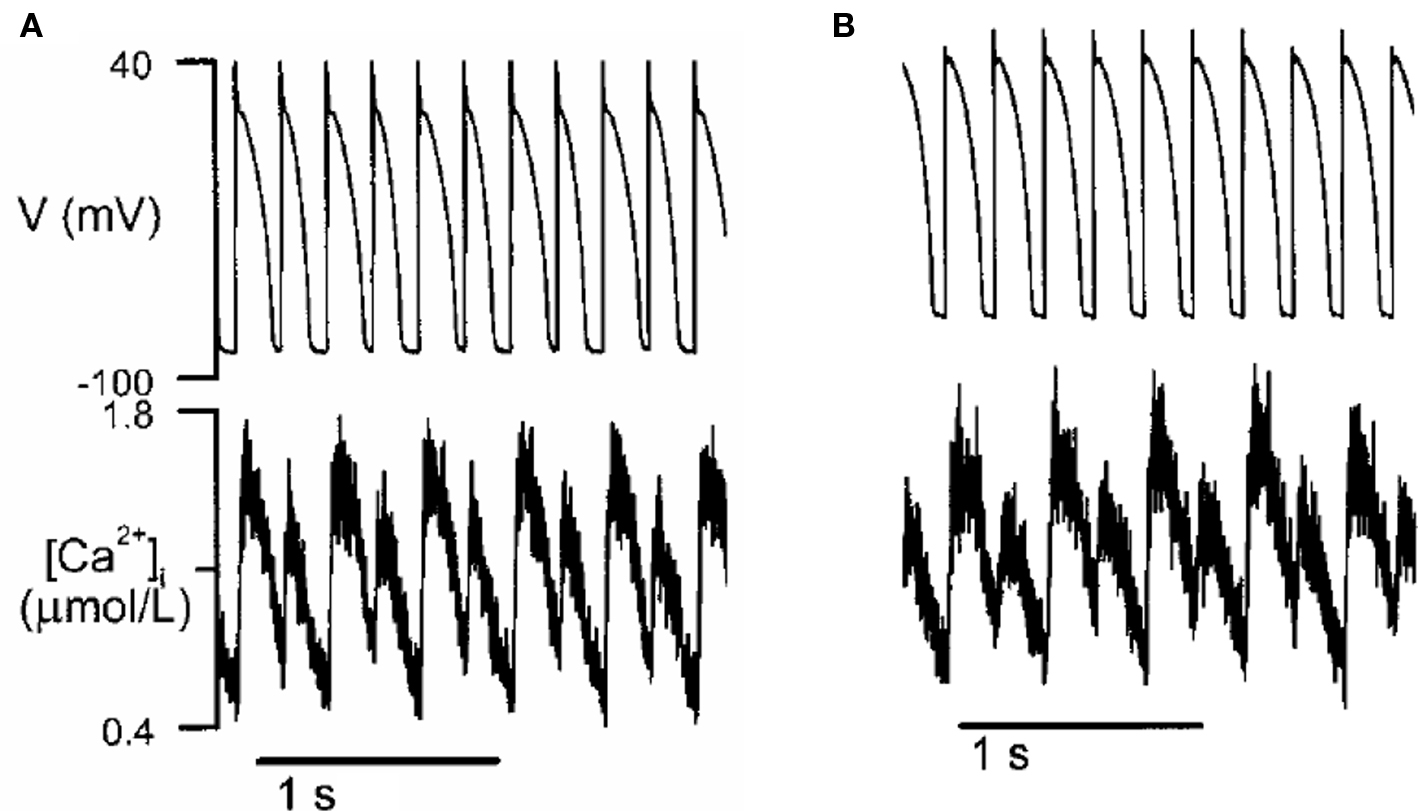
Figure 9. Ca alternans in a rabbit myocyte (modified from Chudin et al. (1999)). (A) APD and Ca alternans at PCL = 180 ms. (B) Same as A but the action potential was clamped, i.e., the myocyte was paced with a fixed action potential.
3R Theory
In a recent study (Rovetti et al., 2010), we developed a computational model of Ca cycling which is composed of a network of coupled Ca release units (CRUs, also called couplons). In this model, Ca alternans occurs in the SR Ca load range in which the fractional release curve is steep. However, Ca alternans continues even if the SR Ca content is held constant. During Ca alternans, individual Ca sparks occur irregularly, and thus the spatial distribution of myoplasmic Ca exhibits a random spatial pattern, which changes from beat to beat (Figure 10A). Space-time plots (line-scan) exhibit random and patch-like patterns, resembling the experimental data by Diaz et al. (2002) (Figures 10B and C). Using the same “ramp pacing” protocol by Picht et al. (2006), we obtained similar SR depletion dependence on SR Ca content (Figures 10D and E). Therefore, the simulation results seem to agree with both sets of experimental observations.
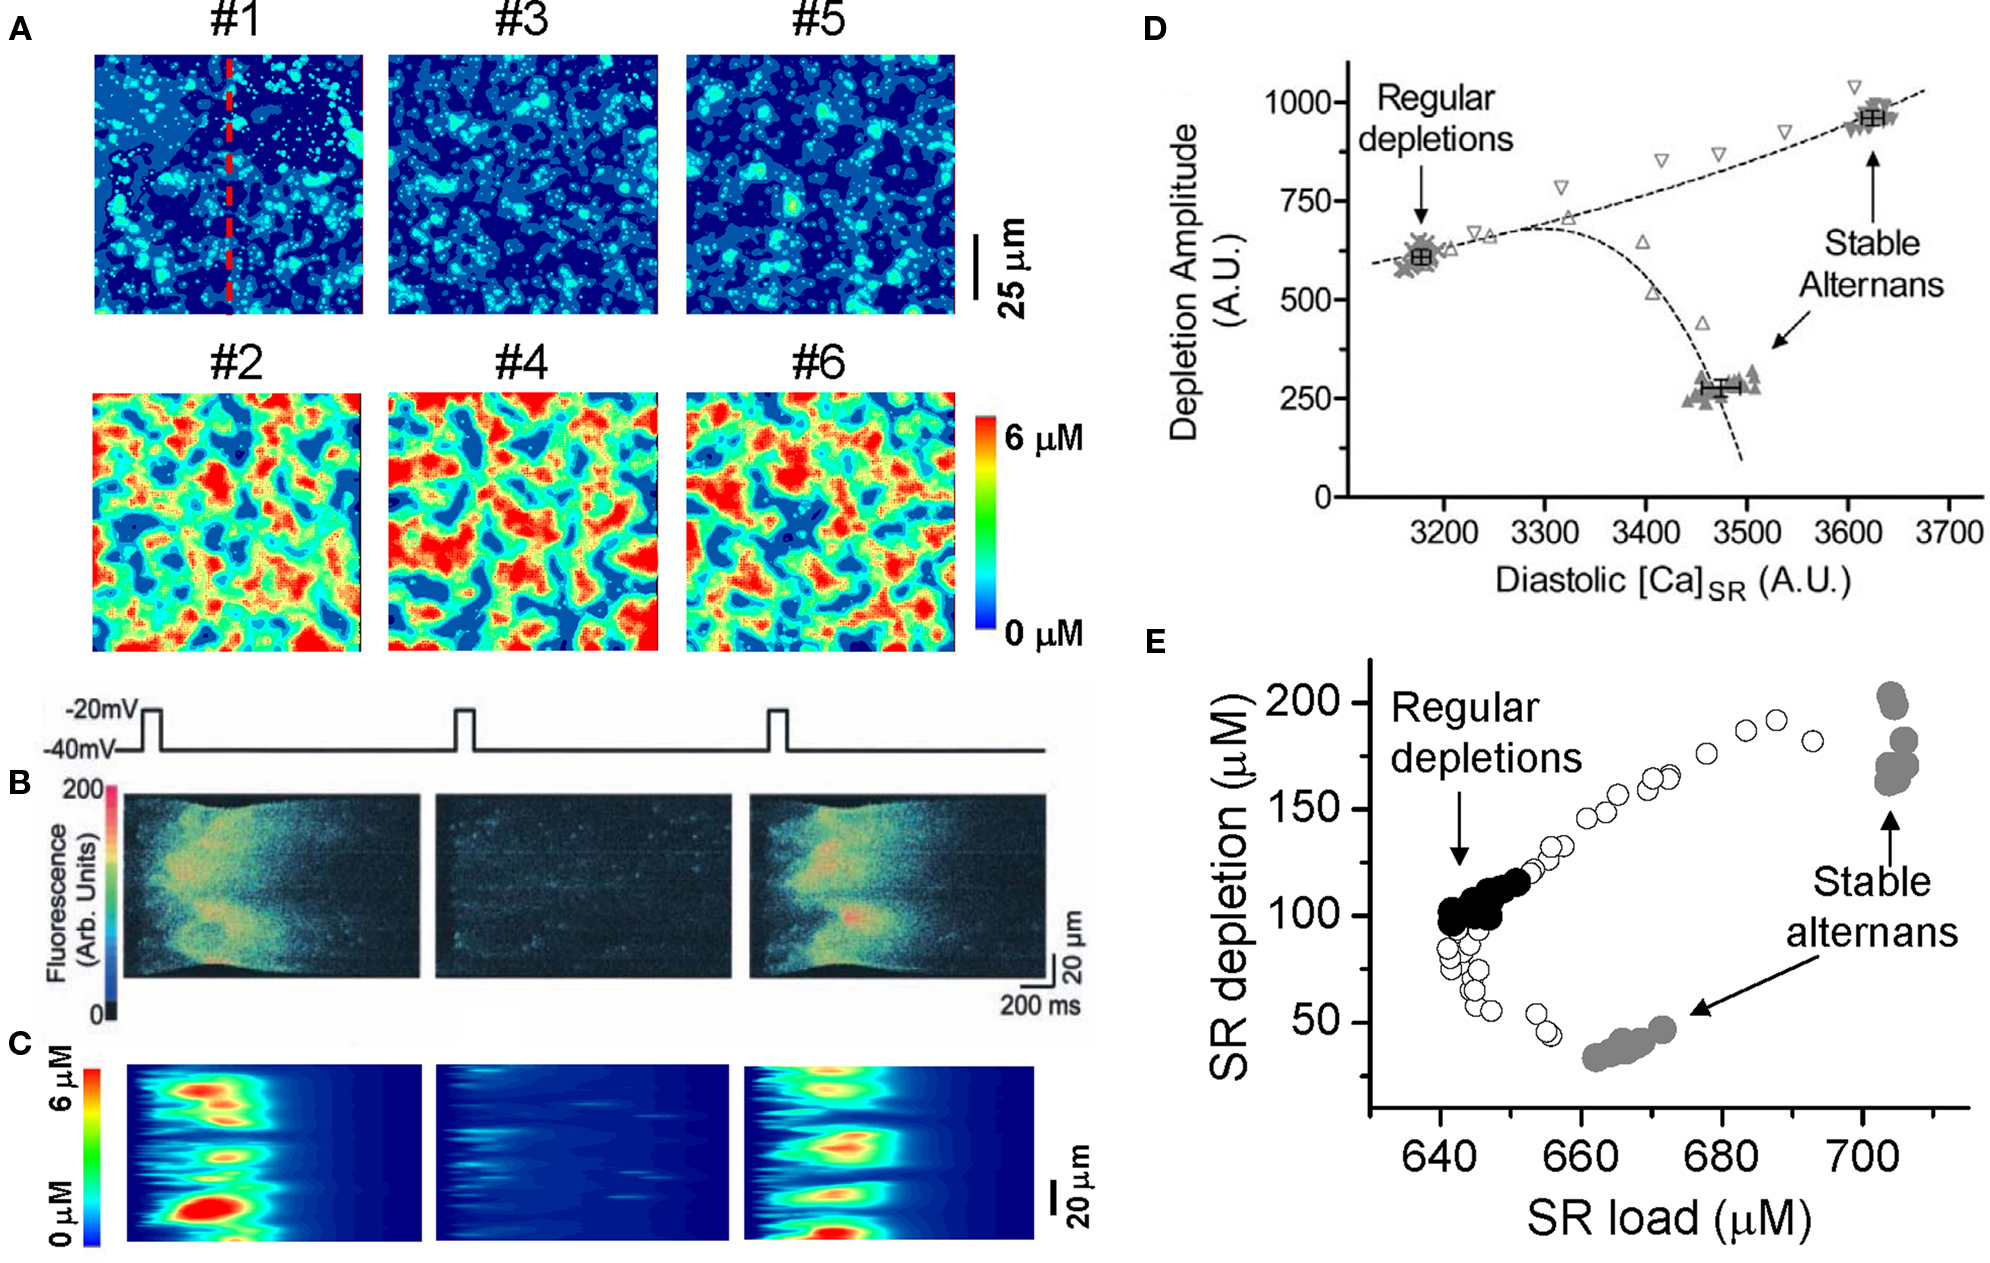
Figure 10. Ca alternans from a CRU network model. (A) Ca distribution in the cytoplasmic space at the peak each beat for the six alternating beats (Rovetti et al., 2010). (B) A time–space plot (line scan) of optical signal showing Ca alternans from an experiment by Diaz et al. (2004). (C) A time–space plot of Ca from the simulation in B. The scanned line is marked in A. (D) SR depletion versus load using a “ramp pacing” by Picht et al. (2006). (E) The simulation data using a similar pacing protocol. In the simulations, the system was first paced with PCL = 500 ms for 20 beats and exhibited stable alternans (gray dots), and then increased PCL gradually (open dots), until PCL = 2000 ms at which the system exhibited regular Ca release with no alternans (black dots). For each PCL, Ca depleted from the SR was plotted against the SR Ca content right before the stimulation. In the experiment by Picht et al., the pacing frequency was decreased from 2.2 Hz (stable alternans) to 1.5 Hz (regular depletions).
To develop a unified theory of Ca alternans and reconcile the contradictory experimental observations, we proposed a novel theory in which Ca alternans emerges as a collective behavior of Ca sparks, determined by three critical properties of the CRU network from which Ca sparks arise: randomness (of Ca spark activation), refractoriness (of a CRU after a Ca spark), and recruitment (Ca sparks inducing Ca sparks in adjacent CRUs). We called this theory as “3R” theory (Cui et al., 2009; Rovetti et al., 2010). Here we summarize this basic theory. As illustrated in Figure 11A, a Ca spark may occur spontaneously (due to high SR Ca load or leakiness) or be activated directly by opening of LCCs in the CRU. Due to stochastic openings of LCCs and RyRs, spontaneous or triggered sparks occur randomly. We call these types of sparks primary sparks, and assume their probability to be α. As a consequence of Ca-induced Ca release, a spark from one CRU may recruit another neighboring CRU to spark, which has also been observed in experiments (Parker et al., 1996; Izu et al., 2007) and is the basis of Ca waves. We called this type of spark a secondary spark, and assume the recruitment probability to be γ. After a CRU sparks, it remains refractory for a certain period of time after which it becomes available for release again (Sobie et al., 2006). Taking into account these three important features, we derived a simple mathematical model for the theory which links the number of sparks at the present beat (n + 1) to the number of Ca sparks in the previous beat (n) as follows (Cui et al., 2009; Rovetti et al., 2010):

where f is a function satisfying

where β is the probability of recovery from a previous spark, N0 is the total number of CRUs, and n is number of neighbors for a CRU. Following the same procedure as for the APD restitution case, one can determine the steady state (or equilibrium) of the system and its stability. The steady state can be unstable, leading to alternans for properly chosen values of parameters α, β, and γ. The behaviors of Eq. 3 are shown in the α-γ parameter space in Figure 11B, and two examples shown in Figures 11C and D. Alternans occurs in an intermediate range of α, large γ (high recruitment), and large β (long refractoriness).
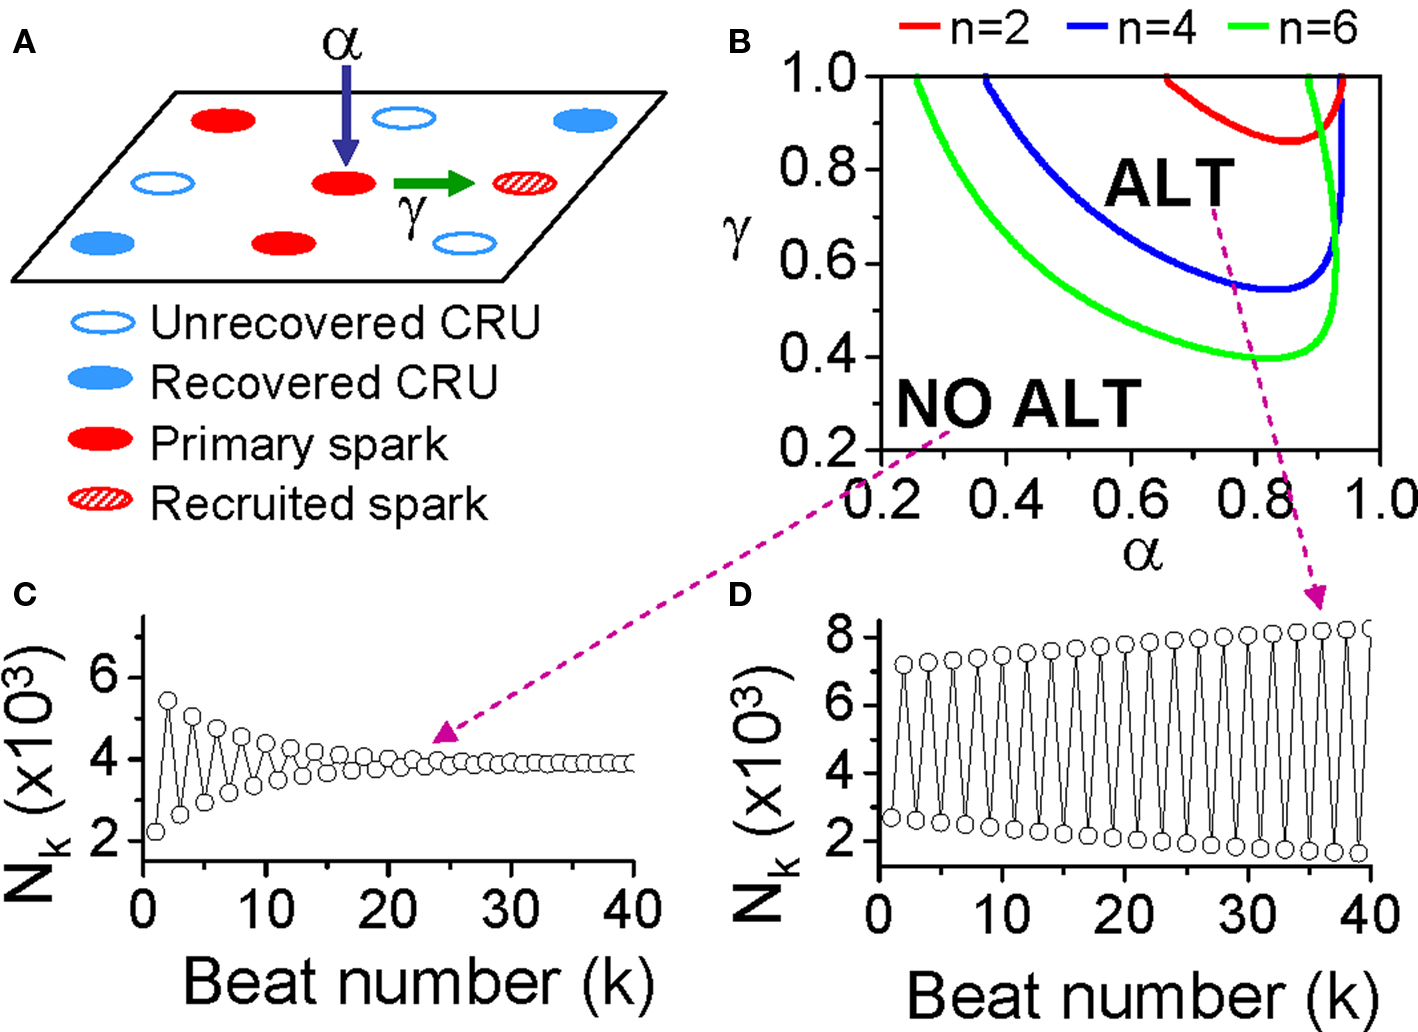
Figure 11. The “3R theory” of Ca alternans. (A) A schematic plot illustrating that a CRU has primary sparking probability α, and once it sparks, has a probability γ to recruit a neighbor to spark. (B) The alternans (ALT) region in α-γ parameter space obtained from Eq. 7 for β = 0.98 and different number (n) of neighbors. (C,D) Spark number Nk versus beat number k in the NO ALT region and in the ALT region.
The parameters α, β, and γ are dynamical parameters which are determined by many physiological factors. For example, α is determined by the properties of LCCs and RyRs, such as their conductance and open probability which are also affected by the Ca content in the cytosol and SR. β is determined by the CRU refractory properties and the cycle length of activation. The refractoriness of a CRU can be attributed to either intrinsic RyR channel properties or RyR regulation by SR luminal Ca, such as by calsequestrin binding to the RyR protein complex (Schmidt et al., 2000; Terentyev et al., 2002; Gyorke et al., 2004; Jiang et al., 2004). γ is determined by the sensitivity of RyR opening on cytosolic Ca, Ca uptake and buffering, the Ca diffusion rate, and the spacing between CRUs, etc.
Applications of the 3R Theory to Ca Alternans
In the experiments by Diaz and colleagues (Diaz et al., 2002, 2004; Li et al., 2009), Ca alternans was induced by either reducing LCC open probability (with LCC blockers or mild depolarized voltage clamp pulses), or reducing RyR open probability (with RyR blockers or acidosis), this agrees with the 3R theory prediction that alternans occurs in the intermediate α. Schmidt et al. (2000) showed in mouse heart that overexpression of calsequestrin promoted pulsus alternans and Restrepo et al. (2008) showed in a modeling study that increasing calsequestrin concentration prolonged RyR refractoriness promoted alternans, which agree with the prediction of the 3R theory that alternans occurs when β is very large. In a recent experimental study by Cutler et al. (2009), Ca alternans was suppressed by overexpressing SERCA2a. This can also be explained by the 3R theory, since increasing SR Ca uptake causes less Ca to diffuse to the neighboring CRUs and thus makes recruitment less efficient, suppressing Ca alternans.
Many studies have shown that ischemia and heart failure promote alternans (Luomanmaki et al., 1975; Qian et al., 2001; Kapur et al., 2009; Wilson et al., 2009). Insight into the mechanisms of alternans under these diseased conditions can be also gained using the 3R theory. It has been shown that in both failing and infarct hearts (Litwin et al., 2000; Gomez et al., 2001; Harris et al., 2005), Ca release becomes asynchronous, which may be caused by a lower primary spark rate (α) resulting from remodeling processes, such as T-tubule disruption (Brette and Orchard, 2003; Louch et al., 2006), and altered excitation–contraction coupling, etc. As indicated by the 3R theory, lower α and asynchronous Ca release promote Ca alternans, predisposing heart failure and ischemia to Ca alternans. In addition, the RyR cluster spacing is decreased in heart failure (Chen-Izu et al., 2007), which increases the recruitment rate. Based on the 3R theory, enhancing recruitment promotes Ca alternans.
In genetic mouse models of catecholaminergic polymorphic ventricular tachycardia (Lehnart et al., 2006; Cerrone et al., 2007), the mutated RyR becomes leaky, which is considered to be the cause of Ca waves causing delayed after depolarizations (DADs). Ca alternans has also been shown in the calstabin-2-deficient mice (Lehnart et al., 2006). When RyR becomes leaky, it becomes easier for a spark to recruit the neighboring CRU to spark, which, based on the 3R theory, can promote Ca alternans.
Arrhythmogenesis
Ca alternans may be responsible for TWA in many diseases such as ischemia and heart failure. Since the effects of Ca transient on arrhythmias are mediated through voltage, the coupling between voltage and Ca becomes important for arrhythmogenesis due to Ca alternans. If the coupling is weak, large amplitude Ca alternans results in only small amplitude APD alternans, and thus the arrhythmogenic effects of Ca alternans may be very limited. If the coupling is strong, however, such that large amplitude Ca alternans results in large amplitude APD alternans and thus larger dispersion of refractoriness, the arrhythmogenic consequences are potentiated. In addition, as shown theoretically (Shiferaw et al., 2005; Jordan and Christini, 2006, 2007; Qu et al., 2007), the interactions of APD restitution steepness and Ca cycling instabilities can synergistically cause new instabilities, leading to alternans and complex dynamics, which may substantially potentiate the effects of Ca cycling on arrhythmogenesis. Another possible mechanism linking Ca alternans to arrhythmias follows from the observation that alternans tends to occur under Ca overload condition, or when SR is leaky, which are the same conditions when Ca waves occur. In fact, our theory of spark-induced sparks and the experimental observations that Ca waves occur during alternans (Diaz et al., 2002, 2004; Blatter et al., 2003) demonstrate that Ca alternans and Ca waves are linked to each other. Therefore, the association of TWA with arrhythmias under these conditions may not be causal, but reflect a predisposition to Ca waves which induce DADs. This hypothesis needs to be evaluated theoretically and experimentally in future studies.
Summary and Conclusions
Numerous clinical and basic studies investigating TWA have greatly advanced our understanding of this dynamical phenomenon and its relation to lethal arrhythmias. In this review, we summarized different dynamical mechanisms of alternans and their possible arrhythmogenic consequences in different diseases. Figure 12 presents a schematic diagram summarizing our current understanding, ranging from ionic channel function to arrhythmia pathways in tissue. Alternans can either originate from dynamical instabilities of membrane voltage or Ca cycling or their interactions. In the voltage system, instabilities are mainly governed by electrical (APD and CV) restitution, which are determined by ion channel properties dually affected by voltage and Ca. Depending on its origin, alternans can cause arrhythmias through the following pathways: (1) spatially discordant alternans which causes large dispersion of refractoriness and thus a substrate for reentry initiation by a PVC; (2) 2:1 conduction block; (3) phase-2 reentry; (4) EAD related foci and reentry. Since EADs are rate dependent, electrical restitution also plays an important role in EAD genesis itself. In the Ca cycling system, the dynamical factors that cause Ca cycling instabilities are beginning to be understood. We recently identified the 3 R’s as dynamical factors promoting instabilities leading to Ca alternans (Cui et al., 2009; Rovetti et al., 2010). The 3 R’s are themselves collective behaviors of many sub-cellular factors, such as ion channel properties and coupling of the CRUs, etc. The key of the 3 R’s is Ca spark recruitment, or spark-induced sparks, which is required for Ca waves. Therefore, Ca alternans may be linked to arrhythmias through Ca waves causing DADs. Ca is also known to play an important role in EAD genesis (Volders et al., 2000). Although TWA is closely associated with arrhythmias and sudden death, it may not be always causal, but rather be a precursor. In either case, however, alternans is definitely a manifestation of electrical instability in the heart, and understanding the mechanisms of these instabilities is essential for developing effective therapeutic strategies.
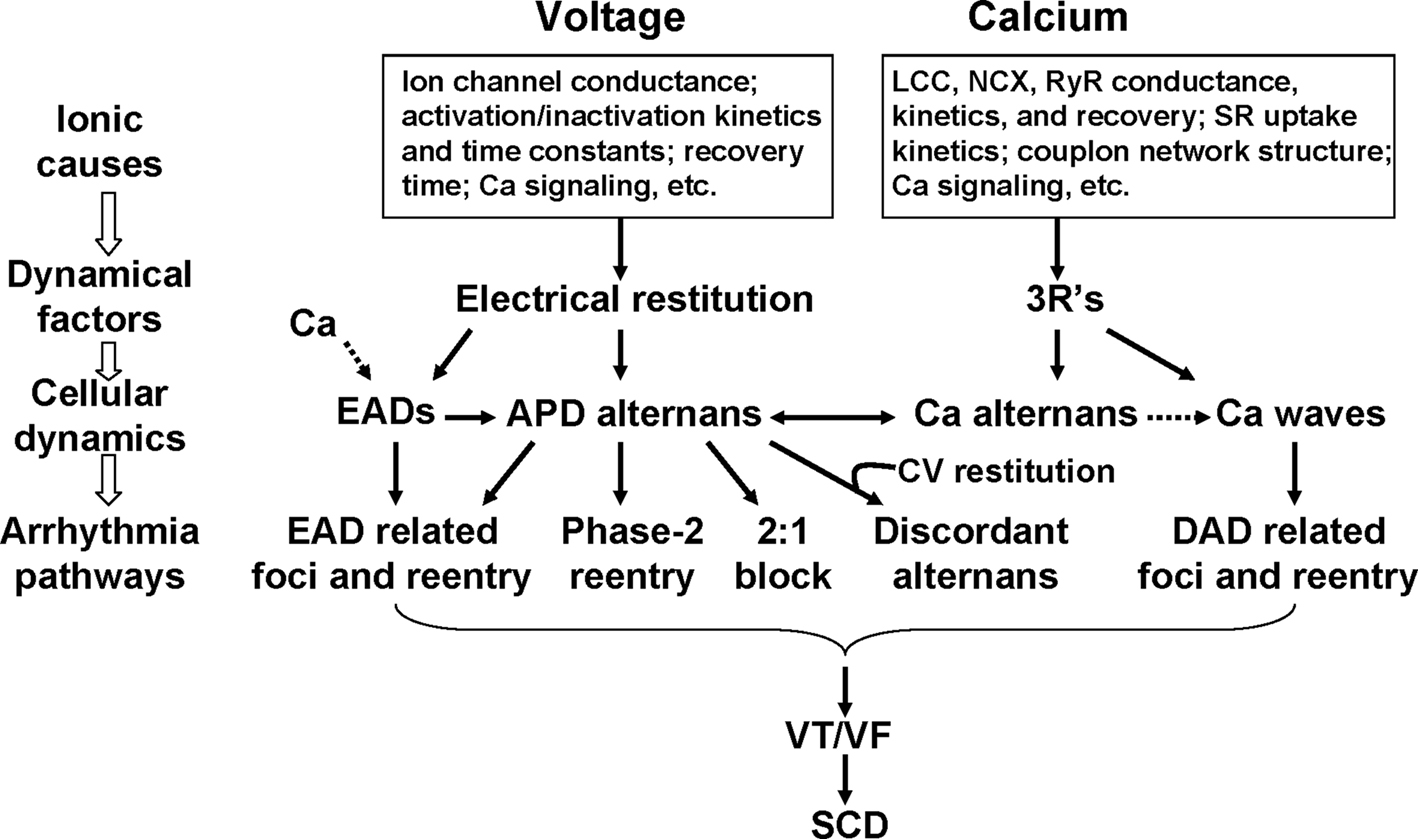
Figure 12. Schematic diagram illustrating the mechanisms of alternans and their roles in arrhythmogenesis. See text for detailed description.
Finally, we note that besides repolarization alternans arising from dynamical instabilities described in this review, TWA can also result from regional 2:1 block. This can happen when APD in one region is substantially lengthened, such as in the long QT syndromes and heart failure, or when the refractory period is substantially lengthened due to slowed Na channel recovery (Joyner et al., 1991; Pu and Boyden, 1997; Qu et al., 2004), such as postrepolarization refractoriness in ischemia (Janse and Wit, 1989). Under these conditions, the propagation of the electrical wave blocks locally on one beat, but then propagates successfully through the same region on the next beat, resulting in TWA as well as QRS alternans. Since conduction block is already present, reentrant arrhythmias may be easily initiated when this type of TWA occurs.
Conflict of Interest Statement
The authors declare that the research was conducted in the absence of any commercial or financial relationships that could be construed as a potential conflict of interest.
Acknowledgments
This work is supported by NIH/NHLBI P01 HL078931, R01 HL103662, a postdoctoral fellowship award from the American Heart Association, Western States Affiliate (to Yuanfang Xie), and the Laubisch and Kawata Endowments.
References
Antoons, G., Volders, P. G., Stankovicova, T., Bito, V., Stengl, M., Vos, M. A., and Sipido, K. R. (2007). Window Ca2+ current and its modulation by Ca2+ release in hypertrophied cardiac myocytes from dogs with chronic atrioventricular block. J. Physiol. 579, 147–160.
Antzelevitch, C. (1999). Ion channels and ventricular arrhythmias: cellular and ionic mechanisms underlying the Brugada syndrome. Curr. Opin. Cardiol. 14, 274–279.
Armoundas, A. A., Nanke, T., and Cohen, R. J. (2000). Images in cardiovascular medicine. T-wave alternans preceding torsade de pointes ventricular tachycardia. Circulation 101, 2550.
Armoundas, A. A., Tomaselli, G. F., and Esperer, H. D. (2002). Pathophysiological basis and clinical application of T-wave alternans. J. Am. Coll. Cardiol. 40, 207–217.
Asano, Y., Davidenko, J. M., Baxter, W. T., Gray, R. A., and Jalife, J. (1997). Optical mapping of drug-induced polymorphic arrhythmias and torsade de pointes in the isolated rabbit heart. J. Am. Coll. Cardiol. 29, 831–842.
Baher, A., Qu, Z., Hayatdavoudi, A., Lamp, S. T., Yang, M. J., Xie, F., Turner, S., Garfinkel, A., and Weiss, J. N. (2007). Short-term cardiac memory and mother rotor fibrillation. Am. J. Physiol. Heart Circ. Physiol. 292, H180–H189.
Bjornstad, H., Tande, P. M., Lathrop, D. A., and Refsum, H. (1993). Effects of temperature on cycle length dependent changes and restitution of action potential duration in guinea pig ventricular muscle. Cardiovasc. Res. 27, 946–950.
Blatter, L. A., Kockskamper, J., Sheehan, K. A., Zima, A. V., Huser, J., and Lipsius, S. L. (2003). Local calcium gradients during excitation-contraction coupling and alternans in atrial myocytes. J. Physiol. 546, 19–31.
Boyett, M. R., and Jewell, B. R. (1978). A study of the factors responsible for rate-dependent shortening of the action potential in mammalian ventricular muscle. J. Physiol. 285, 359–380.
Brette, F., and Orchard, C. (2003). T-tubule function in mammalian cardiac myocytes. Circ. Res. 92, 1182–1192.
Burashnikov, A., and Antzelevitch, C. (1998). Acceleration-induced action potential prolongation and early afterdepolarizations. J. Cardiovasc. Electrophysiol. 9, 934–948.
Cao, J. M., Qu, Z., Kim, Y. H., Wu, T. J., Garfinkel, A., Weiss, J. N., Karagueuzian, H. S., and Chen, P. S. (1999). Spatiotemporal heterogeneity in the induction of ventricular fibrillation by rapid pacing: importance of cardiac restitution properties. Circ. Res. 84, 1318–1331.
Cerrone, M., Noujaim, S. F., Tolkacheva, E. G., Talkachou, A., O’Connell, R., Berenfeld, O., Anumonwo, J., Pandit, S. V., Vikstrom, K., Napolitano, C., Priori, S. G., and Jalife, J. (2007). Arrhythmogenic mechanisms in a mouse model of catecholaminergic polymorphic ventricular tachycardia. Circ. Res. 101, 1039–1048.
Chen-Izu, Y., Ward, C. W., Stark, W. Jr., Banyasz, T., Sumandea, M. P., Balke, C. W., Izu, L. T., and Wehrens, X. H. (2007). Phosphorylation of RyR2 and shortening of RyR2 cluster spacing in spontaneously hypertensive rat with heart failure. Am. J. Physiol. Heart Circ. Physiol. 293, H2409–H2417.
Chialvo, D. R., Gilmour, R. F., and Jalife, J. (1990). Low dimensional chaos in cardiac tissue. Nature 343, 653–657.
Chinushi, M., Washizuka, T., Okumura, H., and Aizawa, Y. (2001). Intravenous administration of class I antiarrhythmic drugs induced T wave alternans in a patient with Brugada syndrome. J. Cardiovasc. Electrophysiol. 12, 493–495.
Choi, B. R., Burton, F., and Salama, G. (2002). Cytosolic Ca2+ triggers early afterdepolarizations and Torsade de Pointes in rabbit hearts with type 2 long QT syndrome. J. Physiol. (Lond.) 543, 615–631.
Choi, B. R., Liu, T., and Salama, G. (2004). Adaptation of cardiac action potential durations to stimulation history with random diastolic intervals. J. Cardiovasc. Electrophysiol. 15, 1188–1197.
Christini, D. J., Riccio, M. L., Culianu, C. A., Fox, J. J., Karma, A., and Gilmour, R. F. Jr. (2006). Control of electrical alternans in canine cardiac purkinje fibers. Phys. Rev. Lett. 96, 104101.
Chudin, E., Goldhaber, J., Garfinkel, A., Weiss, J., and Kogan, B. (1999). Intracellular Ca2+ dynamics and the stability of ventricular tachycardia. Biophys. J. 77, 2930–2941.
Clancy, C. E., and Rudy, Y. (1999). Linking a genetic defect to its cellular phenotype in a cardiac arrhythmia. Nature 400, 566–569.
Cui, X., Rovetti, R. J., Yang, L., Garfinkel, A., Weiss, J. N., and Qu, Z. (2009). Period-doubling bifurcation in an array of coupled stochastically excitable elements subjected to global periodic forcing. Phys. Rev. Lett. 103, 044102–044104.
Cutler, M. J., Wan, X., Laurita, K. R., Hajjar, R. J., and Rosenbaum, D. S. (2009). Targeted SERCA2a gene expression identifies molecular mechanism and therapeutic target for arrhythmogenic cardiac alternans. Circ. Arrhythm. Electrophysiol. 2, 686–694.
Dessertenne, F. (1966). Ventricular tachycardia with 2 variable opposing foci (translated from French). Arch. Mal. Coeur Vaiss. 59, 263–272.
Diaz, M. E., Eisner, D. A., and O’Neill, S. C. (2002). Depressed ryanodine receptor activity increases variability and duration of the systolic Ca2+ transient in rat ventricular myocytes. Circ. Res. 91, 585–593.
Diaz, M. E., O’Neill, S. C., and Eisner, D. A. (2004). Sarcoplasmic reticulum calcium content fluctuation is the key to cardiac alternans. Circ. Res. 94, 650–656.
Echebarria, B., and Karma, A. (2002). Instability and spatiotemporal dynamics of alternans in paced cardiac tissue. Phys. Rev. Lett. 88, 208101.
Eisner, D. A., Choi, H. S., Diaz, M. E., O’Neill, S. C., and Trafford, A. W. (2000). Integrative analysis of calcium cycling in cardiac muscle. Circ. Res. 87, 1087–1094.
Elharrar, V., and Surawicz, B. (1983). Cycle length effect on restitution of action potential duration in dog cardiac fibers. Am. J. Physiol. 244, H782–H792.
Fish, J. M., and Antzelevitch, C. (2008). Cellular mechanism and arrhythmogenic potential of T-wave alternans in the Brugada syndrome. J. Cardiovasc. Electrophysiol. 19, 301–308.
Fox, J. J., Bodenschatz, E., and Gilmour, R. F. (2002a). Period-doubling instability and memory in cardiac tissue. Phys. Rev. Lett. 89, 138101.
Fox, J. J., Gilmour, R. F., and Bodenschatz, E. (2002b). Conduction block in one-dimensional heart fibers. Phys. Rev. Lett. 89, 198101.
Fox, J. J., McHarg, J. L., and Gilmour, R. F. (2002c). Ionic mechanism of electrical alternans. Am. J. Physiol. Heart Circ. Physiol. 282, H516–H530.
Franz, M. R. (2003). The electrical restitution curve revisited: steep or flat slope – which is better? J. Cardiovasc. Electrophysiol. 14, S140–S147.
Franz, M. R., Schaefer, J., Schottler, M., Seed, W. A., and Noble, M. I. M. (1983). Electrical and mechanical restitution of the human heart at different rates of stimulation. Circ. Res. 53, 815–822.
Franz, M. R., Swerdlow, C. D., Liem, L. B., and Schaefer, J. (1988). Cycle length dependence of human action potential duration in vivo: effects of single extrastimuli, sudden sustained rate acceleration and deceleration, and different steady-state frequencies. J. Clin. Invest. 82, 972–979.
Garfinkel, A., Kim, Y. H., Voroshilovsky, O., Qu, Z., Kil, J. R., Lee, M. H., Karagueuzian, H. S., Weiss, J. N., and Chen, P. S. (2000). Preventing ventricular fibrillation by flattening cardiac restitution. Proc. Natl. Acad. Sci. U.S.A. 97, 6061–6066.
Giudici, M. C., and Savage, M. P. (1990). Transient pulsus alternans during acute myocardial ischemia and its resolution following beta-adrenergic blockade. Am. Heart J. 119, 960–962.
Goldhaber, J. I., Xie, L. H., Duong, T., Motter, C., Khuu, K., and Weiss, J. N. (2005). Action potential duration restitution and alternans in rabbit ventricular myocytes: the key role of intracellular calcium cycling. Circ. Res. 96, 459–466.
Gomez, A. M., Guatimosim, S., Dilly, K. W., Vassort, G., and Lederer, W. J. (2001). Heart failure after myocardial infarction: altered excitation-contraction coupling. Circulation 104, 688–693.
Greenstein, J. L., Wu, R., Po, S., Tomaselli, G. F., and Winslow, R. L. (2000). Role of the calcium-independent transient outward current I(to 1) in shaping action potential morphology and duration. Circ. Res. 87, 1026–1033.
Gyorke, I., Hester, N., Jones, L. R., and Gyorke, S. (2004). The role of calsequestrin, triadin, and junctin in conferring cardiac ryanodine receptor responsiveness to luminal calcium. Biophys. J. 86, 2121–2128.
Harris, D. M., Mills, G. D., Chen, X., Kubo, H., Berretta, R. M., Votaw, V. S., Santana, L. F., and Houser, S. R. (2005). Alterations in early action potential repolarization causes localized failure of sarcoplasmic reticulum Ca2+ release. Circ. Res. 96, 543–550.
Hayashi, H., Shiferaw, Y., Sato, D., Nihei, M., Lin, S. F., Chen, P. S., Garfinkel, A., Weiss, J. N., and Qu, Z. (2007). Dynamic origin of spatially discordant alternans in cardiac tissue. Biophys. J. 92, 448–460.
Hondeghem, L. M., and Snyders, D. J. (1990). Class III antiarrhythmic agents have a lot of potential but a long way to go: reduced effectiveness and dangers of reverse use dependence. Circulation 81, 686–690.
Hopenfeld, B. (2006). Mechanism for action potential alternans: the interplay between L-type calcium current and transient outward current. Heart Rhythm 3, 345–352.
Huffaker, R., Lamp, S. T., Weiss, J. N., and Kogan, B. (2004). Intracellular calcium cycling, early afterdepolarizations, and reentry in simulated long QT syndrome. Heart Rhythm 1, 441–448.
Hund, T. J., and Rudy, Y. (2000). Determinants of excitability in cardiac myocytes: mechanistic investigation of memory effect. Biophys. J. 79, 3095–3104.
Huser, J., Wang, Y. G., Sheehan, K. A., Cifuentes, F., Lipsius, S. L., and Blatter, L. A. (2000). Functional coupling between glycolysis and excitation-contraction coupling underlies alternans in cat heart cells. J. Physiol. 524(Pt 3), 795–806.
Izu, L. T., Banyasz, T., Balke, C. W., and Chen-Izu, Y. (2007). Eavesdropping on the social lives of Ca2+ sparks. Biophys. J. 93, 3408–3420.
Janse, M. J., and Wit, A. L. (1989). Electrophysiological mechanisms of ventricular arrhythmias resulting from myocardial ischemia and infarction. Physiol. Rev. 69, 1046–1169.
January, C. T., and Riddle, J. M. (1989). Early afterdepolarizations: mechanism of induction and block. A role for L-type Ca2+ current. Circ. Res. 64, 977–990.
Jiang, D., Xiao, B., Yang, D., Wang, R., Choi, P., Zhang, L., Cheng, H., and Chen, S. R. (2004). RyR2 mutations linked to ventricular tachycardia and sudden death reduce the threshold for store-overload-induced Ca2+ release (SOICR). Proc. Natl. Acad. Sci. U.S.A. 101, 13062–13067.
Jordan, P. N., and Christini, D. J. (2006). Action potential morphology influences intracellular calcium handling stability and the occurrence of alternans. Biophys. J. 90, 672–680.
Jordan, P. N., and Christini, D. J. (2007). Characterizing the contribution of voltage- and calcium-dependent coupling to action potential stability: implications for repolarization alternans. Am. J. Physiol. Heart Circ. Physiol. 293, H2109–H2118.
Joyner, R. W., Ramza, B. M., Osaka, T., and Tan, R. C. (1991). Cellular mechanisms of delayed recovery of excitability in ventricular tissue. Am. J. Physiol. 260, H225–H233.
Kalb, S. S., Dobrovolny, H. M., Tolkacheva, E. G., Idriss, S. F., Krassowska, W., and Gauthier, D. J. (2004). The restitution portrait: a new method for investigating rate-dependent restitution. J. Cardiovasc. Electrophysiol. 15, 698–709.
Kapur, S., Wasserstrom, J. A., Kelly, J. E., Kadish, A. H., and Aistrup, G. L. (2009). Acidosis and ischemia increase cellular Ca2+ transient alternans and repolarization alternans susceptibility in the intact rat heart. Am. J. Physiol. Heart Circ. Physiol. 296, H1491–H1512.
Karagueuzian, H. S., Khan, S. S., Hong, K., Kobayashi, Y., Denton, T., Mandel, W. J., and Diamond, G. A. (1993). Action potential alternans and irregular dynamics in quinidine-intoxicated ventricular muscle cells. Implications for ventricular proarrhythmia. Circulation 87, 1661–1672.
Keating, M. T., and Sanguinetti, M. C. (2001). Molecular and cellular mechanisms of cardiac arrhythmias. Cell 104, 569–580.
Koller, M. L., Riccio, M. L., and Gilmour, R. F. Jr. (1998). Dynamic restitution of action potential duration during electrical alternans and ventricular fibrillation. Am. J. Physiol. 275, H1635–H1642.
Kroll, C. R., and Gettes, L. S. (2002). T wave alternans and Torsades de Pointes after the use of intravenous pentamidine. J. Cardiovasc. Electrophysiol. 13, 936–938.
Lehnart, S. E., Terrenoire, C., Reiken, S., Wehrens, X. H. T., Song, L.-S., Tillman, E. J., Mancarella, S., Coromilas, J., Lederer, W. J., Kass, R. S., and Marks, A. R. (2006). Stabilization of cardiac ryanodine receptor prevents intracellular calcium leak and arrhythmias. Proc. Natl. Acad. Sci. U.S.A. 103, 7906–7910.
Li, M., and Otani, N. F. (2003). Ion channel basis for alternans and memory in cardiac myocytes. Ann. Biomed. Eng. 31, 1213–1230.
Li, Y., Diaz, M. E., Eisner, D. A., and O’Neill, S. (2009). The effects of membrane potential, SR Ca2+ content and RyR responsiveness on systolic Ca2+ alternans in rat ventricular myocytes. J. Physiol. 587, 1283–1292.
Litwin, S. E., Zhang, D., and Bridge, J. H. (2000). Dyssynchronous Ca2 + sparks in myocytes from infarcted hearts. Circ. Res. 87, 1040–1047.
Louch, W. E., Mork, H. K., Sexton, J., Stromme, T. A., Laake, P., Sjaastad, I., and Sejersted, O. M. (2006). T-tubule disorganization and reduced synchrony of Ca2 + release in murine cardiomyocytes following myocardial infarction. J. Physiol. 574, 519–533.
Lukas, A., and Antzelevitch, C. (1993). Differences in the electrophysiological response of canine ventricular epicardium and endocardium to ischemia. Role of the transient outward current. Circulation 88, 2903–2915.
Luo, C. H., and Rudy, Y. (1991). A model of the ventricular cardiac action potential: depolarization, repolarization, and their interaction. Circ. Res. 68, 1501–1526.
Luo, C. H., and Rudy, Y. (1994). A dynamical model of the cardiac ventricular action potential: II. Afterdepolarization, triggered activity, and potentiation. Circ. Res. 74, 1097–1113.
Luomanmaki, K., Heikkila, J., and Hartikainen, M. (1975). T-wave alternans associated with heart failure and hypomagnesemia in alcoholic cardiomyopathy. Eur. J. Cardiol. 3, 167–170.
Maoz, A., Krogh-Madsen, T., and Christini, D. J. (2009). Instability in action potential morphology underlies phase 2 reentry: a mathematical modeling study. Heart Rhythm 6, 813–822.
Mironov, S., Jalife, J., and Tolkacheva, E. G. (2008). Role of conduction velocity restitution and short-term memory in the development of action potential duration alternans in isolated rabbit hearts. Circulation 118, 17–25.
Miyoshi, S., Mitamura, H., Fujikura, K., Fukuda, Y., Tanimoto, K., Hagiwara, Y., Ita, M., and Ogawa, S. (2003). A mathematical model of phase 2 reentry: role of L-type Ca current. Am. J. Physiol. Heart Circ. Physiol. 284, H1285–H1294.
Miyoshi, S., Mitamura, H., Fukuda, Y., Tanimoto, K., Hagiwara, Y., Kanki, H., Takatsuki, S., Murata, M., Miyazaki, T., and Ogawa, S. (2005). Link between SCN5A mutation and the Brugada syndrome ECG phenotype: simulation study. Circ. J. 69, 567–575.
Morita, H., Nagase, S., Kusano, K., and Ohe, T. (2002). Spontaneous T wave alternans and premature ventricular contractions during febrile illness in a patient with Brugada syndrome. J. Cardiovasc. Electrophysiol. 13, 816–818.
Morita, H., Zipes, D. P., Lopshire, J., Morita, S. T., and Wu, J. (2006). T wave alternans in an in vitro canine tissue model of Brugada syndrome. Am. J. Physiol. Heart Circ. Physiol. 291, H421–H428.
Nakashima, M., Hashimoto, H., Kanamaru, M., Nagaya, T., Hashizume, M., and Oishi, H. (1978). Experimental studies and clinical report on the electrical alternans of ST segment during myocardial ischemia. Jpn. Heart J. 19, 396–408.
Narayan, S. M. (2006). T-wave alternans and the susceptibility to ventricular arrhythmias. J. Am. Coll. Cardiol. 47, 269–281.
Nishizaki, M., Fujii, H., Sakurada, H., Kimura, A., and Hiraoka, M. (2005). Spontaneous T wave alternans in a patient with Brugada syndrome – responses to intravenous administration of class I antiarrhythmic drug, glucose tolerance test, and atrial pacing. J. Cardiovasc. Electrophysiol. 16, 217–220.
Nolasco, J. B., and Dahlen, R. W. (1968). A graphic method for the study of alternation in cardiac action potentials. J. Appl. Physiol. 25, 191–196.
Osadchii, O. E., Larsen, A. P., and Olesen, S. P. (2010). Predictive value of electrical restitution in hypokalemia-induced ventricular arrhythmogenicity. Am. J. Physiol. Heart Circ. Physiol. 298, H210–H220.
Parker, I., Zang, W. J., and Wier, W. G. (1996). Ca2 + sparks involving multiple Ca2 + release sites along Z-lines in rat heart cells. J. Physiol. 497(Pt 1), 31–38.
Pastore, J. M., Girouard, S. D., Laurita, K. R., Akar, F. G., and Rosenbaum, D. S. (1999). Mechanism linking T-wave alternans to the genesis of cardiac fibrillation. Circulation 99, 1385–1394.
Picht, E., DeSantiago, J., Blatter, L. A., and Bers, D. M. (2006). Cardiac alternans do not rely on diastolic sarcoplasmic reticulum calcium content fluctuations. Circ. Res. 99, 740–748.
Pu, J., and Boyden, P. A. (1997). Alterations of Na+ currents in myocytes from epicardial border zone of the infarct heart: a possible ionic mechanism for reduced excitability and postrepolarization refractoriness. Circ. Res. 81, 110–119.
Qian, Y. W., Clusin, W. T., Lin, S. F., Han, J., and Sung, R. J. (2001). Spatial heterogeneity of calcium transient alternans during the early phase of myocardial ischemia in the blood-perfused rabbit heart. Circulation 104, 2082–2087.
Qu, Z., Garfinkel, A., Chen, P. S., and Weiss, J. N. (2000a). Mechanisms of discordant alternans and induction of reentry in simulated cardiac tissue. Circulation 102, 1664–1670.
Qu, Z., Xie, F., Garfinkel, A., and Weiss, J. N. (2000b). Origins of spiral wave meander and breakup in a two-dimensional cardiac tissue model. Ann. Biomed. Eng. 28, 755–771.
Qu, Z., Garfinkel, A., and Weiss, J. N. (2006). Vulnerable window for conduction block in a one-dimensional cable of cardiac cells, 2: multiple extrasystoles. Biophys. J. 91, 805–815.
Qu, Z., Karagueuzian, H. S., Garfinkel, A., and Weiss, J. N. (2004). Effects of Na+ channel and cell coupling abnormalities on vulnerability to reentry: a simulation study. Am. J. Physiol. Heart Circ. Physiol. 286, H1310–H1321.
Qu, Z., Shiferaw, Y., and Weiss, J. N. (2007). Nonlinear dynamics of cardiac excitation-contraction coupling: an iterated map study. Phys. Rev. E 75, 011927.
Qu, Z., Weiss, J. N., and Garfinkel, A. (1999). Cardiac electrical restitution properties and the stability of reentrant spiral waves: a simulation study. Am. J. Physiol. 276, H269–H283.
Restrepo, J. G., Weiss, J. N., and Karma, A. (2008). Calsequestrin-mediated mechanism for cellular calcium transient alternans. Biophys. J. 95, 3767–3789.
Roden, D. M. (1998). Taking the “Idio” out of “Idiosyncratic”: predicting Torsades de Pointes. Pacing Clin. Electrophysiol. 21, 1029–1034.
Rosenbaum, D. S., Jackson, L. E., Smith, J. M., Garan, H., Ruskin, J. N., and Cohen, R. J. (1994). Electrical alternans and vulnerability to ventricular arrhythmias. N. Engl. J. Med. 330, 235–241.
Rovetti, R., Cui, X., Garfinkel, A., Weiss, J. N., and Qu, Z. (2010). Spark-induced sparks as a mechanism of intracellular calcium alternans in cardiac myocytes. Circ. Res. 106, 1582–1591.
Sanguinetti, M. C., and Tristani-Firouzi, M. (2006). hERG potassium channels and cardiac arrhythmia. Nature 440, 463–469.
Sato, D., Xie, L. H., Nguyen, T. P., Weiss, J. N., and Qu, Z. (2010). Irregularly appearing early afterdepolarizations in cardiac myocytes: random fluctuations or dynamical chaos? Biophys. J. 99, 765–773.
Sato, D., Xie, L. H., Sovari, A. A., Tran, D. X., Morita, N., Xie, F., Karagueuzian, H., Garfinkel, A., Weiss, J. N., and Qu, Z. (2009). Synchronization of chaotic early afterdepolarizations in the genesis of cardiac arrhythmias. Proc. Natl. Acad. Sci. U.S.A. 106, 2983–2988.
Schmidt, A. G., Kadambi, V. J., Ball, N., Sato, Y., Walsh, R. A., Kranias, E. G., and Hoit, B. D. (2000). Cardiac-specific overexpression of calsequestrin results in left ventricular hypertrophy, depressed force-frequency relation and pulsus alternans in vivo. J. Mol. Cell. Cardiol. 32, 1735–1744.
Shiferaw, Y., Sato, D., and Karma, A. (2005). Coupled dynamics of voltage and calcium in paced cardiac cells. Phys. Rev. E. Stat. Nonlin. Soft Matter Phys. 71, 021903.
Shiferaw, Y., Watanabe, M. A., Garfinkel, A., Weiss, J. N., and Karma, A. (2003). Model of intracellular calcium cycling in ventricular myocytes. Biophys. J. 85, 3666–3686.
Shimizu, W., and Antzelevitch, C. (1999). Cellular and ionic basis for T-wave alternans under long-QT conditions. Circulation 99, 1499–1507.
Silva, J., and Rudy, Y. (2005). Subunit interaction determines IKs participation in cardiac repolarization and repolarization reserve. Circulation 112, 1384–1391.
Sobie, E. A., Song, L. S., and Lederer, W. J. (2006). Restitution of Ca2+ release and vulnerability to arrhythmias. J. Cardiovasc. Electrophysiol. 17(Suppl. 1), S64–S70.
Song, Y., Shryock, J. C., Wagner, S., Maier, L. S., and Belardinelli, L. (2006). Blocking late sodium current reduces hydrogen peroxide-induced arrhythmogenic activity and contractile dysfunction. J. Pharmacol. Exp. Ther. 318, 214–222.
Strogatz, S. H. (2000). Nonlinear Dynamics and Chaos: with Applications to Physics, Biology, Chemistry, and Engineering. Cambridge: Westview Press.
Tada, T., Kusano, K. F., Nagase, S., Banba, K., Miura, D., Nishii, N., Watanabe, A., Nakamura, K., Morita, H., and Ohe, T. (2008). Clinical significance of macroscopic T-wave alternans after sodium channel blocker administration in patients with Brugada syndrome. J. Cardiovasc. Electrophysiol. 19, 56–61.
Takagi, M., Doi, A., Takeuchi, K., and Yoshikawa, J. (2002). Pilsicanide-induced marked T wave alternans and ventricular fibrillation in a patient with Brugada syndrome. J. Cardiovasc. Electrophysiol. 13, 837.
Tao, T., O’Neill, S. C., Diaz, M. E., Li, Y. T., Eisner, D. A., and Zhang, H. (2008). Alternans of cardiac calcium cycling in a cluster of ryanodine receptors: a simulation study. Am. J. Physiol. Heart Circ. Physiol. 295, H598–H609.
Terentyev, D., Viatchenko-Karpinski, S., Valdivia, H. H., Escobar, A. L., and Gyorke, S. (2002). Luminal Ca2+ controls termination and refractory behavior of Ca2+-induced Ca2+ release in cardiac myocytes. Circ. Res. 91, 414–420.
Tran, D. X., Sato, D., Yochelis, A., Weiss, J. N., Garfinkel, A., and Qu, Z. (2009). Bifurcation and Chaos in a Model of Cardiac Early Afterdepolarizations. Phys. Rev. Lett. 102, 258103.
Verrier, R. L., and Nieminen, T. (2010a). Macroscopic T-wave alternans: the tip of the iceberg in drug-induced torsade de pointes? J. Am. Coll. Cardiol. 56, 241.
Verrier, R. L., and Nieminen, T. (2010b). T-wave alternans as a therapeutic marker for antiarrhythmic agents. J. Cardiovasc. Pharmacol. 55, 544–554.
Volders, P. G., Vos, M. A., Szabo, B., Sipido, K. R., de Groot, S. H., Gorgels, A. P., Wellens, H. J., and Lazzara, R. (2000). Progress in the understanding of cardiac early afterdepolarizations and torsades de pointes: time to revise current concepts. Cardiovasc. Res. 46, 376–392.
Watanabe, M. A., and Koller, M. L. (2002). Mathematical analysis of dynamics of cardiac memory and accommodation: theory and experiment. Am. J. Physiol. Heart Circ. Physiol. 282, H1534–H1547.
Watanabe, M., Otani, N. F., and Gilmour, R. F. (1995). Biphasic restitution of action potential duration and complex dynamics in ventricular myocardium. Circ. Res. 76, 915–921.
Wegener, F. T., Ehrlich, J. R., and Hohnloser, S. H. (2008). Amiodarone-associated macroscopic T-wave alternans and torsade de pointes unmasking the inherited long QT syndrome. Europace 10, 112–113.
Weiss, J. N., Karma, A., Shiferaw, Y., Chen, P. S., Garfinkel, A., and Qu, Z. (2006). From pulsus to pulseless: the saga of cardiac alternans. Circ. Res. 98, 1244–1253.
Wilson, L. D., Jeyaraj, D., Wan, X., Hoeker, G. S., Said, T. H., Gittinger, M., Laurita, K. R., and Rosenbaum, D. S. (2009). Heart failure enhances susceptibility to arrhythmogenic cardiac alternans. Heart Rhythm 6, 251–259.
Wu, T. J., Lin, S. F., Baher, A., Qu, Z., Garfinkel, A., Weiss, J. N., Ting, C. T., and Chen, P. S. (2004). Mother rotors and the mechanisms of D600-induced type 2 ventricular fibrillation. Circulation 110, 2110–2118.
Xie, F., Qu, Z., Garfinkel, A., and Weiss, J. N. (2002). Electrical refractory period restitution and spiral wave reentry in simulated cardiac tissue. Am. J. Physiol. Heart Circ. Physiol. 283, H448–H460.
Xie, L. H., Sato, D., Garfinkel, A., Qu, Z., and Weiss, J. N. (2008). Intracellular Ca alternans: coordinated regulation by sarcoplasmic reticulum release, uptake, and leak. Biophys. J. 95, 3100–3110.
Xie, Y., Garfinkel, A., Weiss, J. N., and Qu, Z. (2009). Cardiac alternans induced by fibroblast-myocyte coupling: mechanistic insights from computational models. Am. J. Physiol. Heart Circ. Physiol. 297, H775–H784.
Yan, G. X., and Antzelevitch, C. (1999). Cellular basis for the Brugada syndrome and other mechanisms of arrhythmogenesis associated with ST-segment elevation. Circulation 100, 1660–1666.
Keywords: T-wave alternans, arrhythmias, restitution, calcium cycling, afterdepolarizations, cardiac diseases
Citation: Qu Z, Xie Y, Garfinkel A and Weiss JN (2010) T-wave alternans and arrhythmogenesis in cardiac diseases. Front. Physio. 1:154. doi: 10.3389/fphys.2010.00154
Received: 01 September 2010;
Accepted: 03 November 2010;
Published online: 29 November 2010.
Edited by:
Tobias Opthof, Academic Medical Center, NetherlandsReviewed by:
Michael Franz, Georgetown University, USAYukiomi Tsuji, Nagoya University, Japan
Peter Taggart, University College London, UK
Copyright: © 2010 Qu, Xie, Garfinkel and Weiss. This is an open-access article subject to an exclusive license agreement between the authors and the Frontiers Research Foundation, which permits unrestricted use, distribution, and reproduction in any medium, provided the original authors and source are credited.
*Correspondence: Zhilin Qu, Department of Medicine (Cardiology), David Geffen School of Medicine at University of California Los Angeles, A2-237 CHS, 650 Charles E. Young Drive South, Los Angeles, CA 90095, USA. e-mail:enF1QG1lZG5ldC51Y2xhLmVkdQ==

 Yuanfang Xie1