 Mingyue Wang
 Rui Kong
 Jianfu Luo
 Wenjing Hao1
94% of researchers rate our articles as excellent or good
Learn more about the work of our research integrity team to safeguard the quality of each article we publish.
Find out more
ORIGINAL RESEARCH article
Front. Phys., 14 March 2025
Sec. Social Physics
Volume 13 - 2025 | https://doi.org/10.3389/fphy.2025.1557361
This article is part of the Research TopicFinance and Production Complex SystemsView all 10 articles
Stock price and consumer sentiment consistently serve as pivotal economic indicators for the performance and growth of e-commerce enterprises. It is essential to comprehend and forecast the co-movement between the two to inform financing and investment decision-making effectively. Prior research has focused on predicting individual indicators, but not much of them attempt to forecast their co-movement. We propose a novel Rule Combination based on Bivariate Co-movement Network (RC-BCN) approach for bivariate co-movement forecasting. Bivariate co-movement features extracted utilizing the BCN’s topological nature instruct the entropy optimization in order to enhance the RC-BCN’s predictions. We conduct four sets of experiments on 1,135 data sets from JD.com between 2018 and 2022, where consumer sentiment is measured using text sentiment analysis of online reviews. The results indicate that RC-BCN’s prediction accuracy reaches at most 91% under distortion preference and is improved by 18% compared without entropy optimization. This study highlights the value of complex network and entropy theory in forecasting bivariate co-movement for e-commerce enterprises.
• Devising a novel approach called Rule Combination based on Bivariate Co-movement Network (RC-BCN) to solve co-movement prediction problem.
• Predicting the co-movement between Consumer Sentiment (CS) and Stock Price (SP) for e-commerce companies.
• Bi-objective optimization achieved through entropy optimization based on BCN topology.
• RC-BCN outperforms in co-movement between CS and SP forecasting.
• Findings in this study have implications for listed e-commerce companies financing decisions and investor decision-making.
For publicly listed enterprises, particularly those in the customer-centric retail sector, forecasting the co-movement between Consumer Sentiment (CS) and Stock Price (SP) is crucial for guiding corporate financing decisions and providing valuable insights for investor decision-making. E-commerce enterprises, as typical customer-centric businesses, are significantly influenced by CS in terms of their firm value. Additionally, the e-commerce industry has become a vital component of the global economy. CS and SP are economic signal towers of e-commerce platform performance. Numerous studies have independently examined and forecasted them [1–3]. In contrast, a few studies have integrated these two aspects and established a confirmed correlation between them [4, 5]. These studies have primarily explored the relationship between CS and SP via regression analysis, and employed machine learning to predict SP using CS, thereby enhancing predictive accuracy. Despite these advancements, the dynamic interdependence between CS and SP, particularly regarding co-movement forecasting, has received limited attention in existing literature.
Extant literature indicates that CS impacts SP through multiple pathways. (1) CS can indirectly affect investor behavior through media reports, social media interactions, and other channels, thereby impacting SP [6, 7]. (2) CS reflects the market preferences for a firm’s products or services, signaling sales expectations and investor confidence, which in turn affect SP [8, 9]. (3) Some studies suggest that CS can directly and positively influence SP [4, 10]. Positive sentiment boosts market expectations of a firm’s future performance, enhancing investor confidence, while negative sentiment undermines market trust, potentially leading to a decline in SP. In addition, related studies have found that: (1) there is a bidirectional causal relationship between sentiment and SP, with potentially positive or negative dynamic [11]. (2) the relationship between CS and SP is complex and nonlinear [5]; and (3) sentiment has a short-term transient effect on SP, suggesting that sentiment changes can serve as early signals of SP movements [11–13].
The relationship between CS and SP is dynamic. However, in contrast to previous studies focusing on the static aspect, this paper examines their dynamic interaction and co-movement forecasting, providing valuable insights into the dynamic relationship between consumer behavior and financial markets. Furthermore, investors can better capture market trends and mitigate potential investment risks by analyzing changes in CS. For customer-centric listed companies, understanding these dynamics enables them to improve financing efficiency and secure greater capital support. Hence, the research question in this study is: how to explore and forecast the co-movement of CS and SP? This research aims to uncover the co-movement’s features and forecast them, serving as a reference for corporate financing decisions and investor investment strategies.
Forecasting the co-movement of CS and SP involves obtaining daily CS data and addressing the challenges of nonlinear time series forecasting. Currently, vast quantities of CORs are archived on e-commerce platforms, providing real-time insights into CS. Moreover, text sentiment analysis is employed to extract the CS from CORs at a finer time scale. Complex network theory has emerged as a powerful tool for analyzing nonlinear time series [14]. Given the dynamic, nonlinear relationship between CS and SP, and the complexity of their interaction patterns, complex network methods are particularly well-suited to uncover and forecast their co-movement. It excels in accurately capturing temporal fluctuations, leading to highly accurate predictions.
In response to the above problems, we propose a novel Rule Combination approach, integrating Bivariate Co-movement Network (RC-BCN) analysis with entropy optimization. It consists of four sequential steps: CS data acquisition, Bivariate Co-movement Network (BCN) construction, feature extraction, and co-movement prediction based on rule combination and entropy optimization. CS data acquisition uses web crawler and text sentiment analysis. We project bivariate time series data into phase space to construct BCN. Particularly, features derived from network topology are used to instruct entropy optimization innovatively. To validate the proposed approach, we conduct four sets of experiments on one dataset. The experiments show that the proposed approach outperforms baseline model.
Our work contributions are summarized as follows:
• Employ complex network to the problem of bivariate co-movement forecasting and develop a novel RC-BCN approach based on entropy optimization for the first time, which performs well.
• Propose a new feature extraction framework, using network topological nature to extract features by projecting bivariate time series into phase space.
• Design a fusion method of combining co-movement features with prediction methods through entropy optimization, which results in high prediction accuracy.
The rest of this paper is organized as follows. Section 2 discusses the related works. Section 3 describes the methodology. Section 4 presents the experiments, and Section 5 discusses the results. Section 6 concludes and outlooks the work.
To address the research question, we conducted a literature review from three aspects. Lastly, we highlighted the extant research gaps and outlined the objectives of our study.
CS data can be sourced from two main categories: (1) Authoritative databases, which provide established metrics like the Consumer Confidence Index (CCI), and (2) Evaluating CS through online reviews. Authoritative databases may have limitations in providing real-time, flexible, and fine-grained analysis when supporting detailed research perspectives. Therefore, obtaining CS through CORS have become popular.
Evaluating CS through CORs primarily entails identifying the influencing factors and calculating CS. Various techniques, such as text regression analysis, machine learning, and the Latent Dirichlet allocation, are employed to ascertain the factors and their respective weights that impact CS, consequently pinpointing the key determinants [15–17]. Additionally, evaluating CS through CORs predominantly utilizes text sentiment analysis methods based on dictionaries, machine learning, and deep learning [18–20]. Among these, the dictionary-based text sentiment analysis method is widely adopted, due to its simplicity. For instance, one approach involves constructing a CS evaluation system by content analysis, followed by the utilization of Probabilistic Linguistic Term sets and improved Analytic Hierarchy Process method to calculate CS based on word frequency statistics [21]. Other approaches include the Center Term Short Sentence Sentiment Orientation, the Probabilistic Linguistic Group Decision-FlowSort, and the Data Envelopment Analysis method to calculate sentiment intensity and dynamically measure CS across multiple dimensions [22–24].
These studies highlight the significance of CORs as a valuable data source for measuring CS, using relatively established evaluation methods. However, it is worth noting that CS in our study refers to consumers’ overall sentiment on shopping platforms. While influenced by multiple factors, CS cannot be directly quantified as the sum of sentiment values derived from these individual factors. Hence, in quantifying CORs, we adopt a dictionary-based algorithm that matches overall CS vocabulary to measure the sentiment intensity of CORs. This approach effectively captures overall CS.
Co-movement analysis between CS and SP typically focuses on their correlation, particularly in predicting SP volatility utilizing CS. However, limited research has been conducted on the co-movement features between CS and SP, while an extensive body of literature exists on bivariate co-movement features, showcasing more mature methodologies. The research subjects include inter-country currency exchange rates, the intersection of artificial intelligence and energy sectors, as well as the relationship between dirty and clean energy [25–27]. These research covers both static co-movement features, such as bivariate interdependence and quantile co-movement, and dynamic features, including co-movement structure and fluctuations. Although studies on CS and SP co-movement are typically classified as static, their co-movement is inherently dynamic.
Common methods for analyzing dynamic co-movement features include wavelet analysis, DCC-GARCH model, the Thick Pen method, Temporal Convolutional Network (TCN), and complex network analysis [25, 28–31]. Among these, wavelet analysis has high sensitivity to the selected wavelet basis function and scale parameters. The DCC-GARCH model generally assumes that the data are normally distributed. The Thick Pen method tends to be subjective in parameter setting. TCN depends on the quality of input data and is sensitive to the hyperparameter. In contrast, the co-movement between CS and SP does not necessarily conform to the normal distribution. Complex network analysis provides an objective means to visualize nonlinear and nonintuitive relationships between bivariate.
Scholars have employed symbolic dynamics methods to map time series data into BCN, and have utilized network indicators to analyze bivariate dynamic co-movement features. This approach is grounded on coarse-graining partitions of phase space, involves constructing coarse-grained rules to transform time series into symbols, defining symbol sequence vectors as nodes, establishing a network resulting from the transition frequency of the symbol sequence vectors in the time series [14]. The co-movement features are mainly extracted by using network topology indicators such as node strength, node centrality, weighted cluster coefficient and community detection [32, 33]. Despite employing various network indicators in prior research, there remains a gap in the literature regarding a comprehensive analytical framework for identifying bivariate co-movement features and guiding the development of a bivariate co-movement prediction model.
The research area of bivariate co-movement forecasting includes different stock prices, the multi-step network traffic states, innovative and traditional financial assets in different regions [34–36]. Research topics in co-movement forecasting focus on the future trends of bivariate co-movement, including correlations between stock prices [34], crude oil prices volatility [37], and volatility spillovers across economic sectors [38]. Given the high volatility of both CS and SP, this study aims to forecast the co-movement trend between CS and SP, consistent with prior research.
In the absence of distinct regularities, nonlinear systems commonly adopt integrated forecasting models, incorporating techniques such as data mining, cross entropy, Convolutional Neural Network-Long Short Term Memory (CNN-LSTM), Back Propagation (BP) Neural Networks, and link prediction methods, to improve predictive accuracy [39–42]. The aforementioned methods, particularly machine learning techniques, have demonstrated significant efficacy in predicting bivariate co-movement by optimizing model hyperparameters. However, these methods face challenges in explaining the underlying mechanisms driving the observed results. In contrast, the complex network approach not only uncovers the co-movement characteristics of bivariate relationships but also effectively predicts their dynamics, eliminating the need for resource-intensive and time-consuming experimental processes.
Time series forecasting algorithms based on complex network have shown significant advancements in recent years. These methods, such as maximum node weight and maximum visibility forecasting have been developed based on the principles of complex network link prediction [43, 44]. The current widely used link prediction algorithms are often based on various node similarities, including local similarity, weighted similarity and random walk similarity [45–47]. Typically, the greater the similarity between two nodes in the network, the higher the likelihood of connectivity between them. While numerous algorithms exist for bivariate co-movement prediction, each validated in different fields, it is worth mentioning that the co-movement features within a network can vary significantly across different time series networks. As a result, predictions made by a single forecasting method may exhibit biases when compared to actual outcomes.
Bivariate co-movement forecasting has been studied on mostly macroeconomic indicators. Limited by the availability of data, previous studies have less often landed on firm-level economic indicators, especially on the co-movement of CS and SP. For e-commerce companies, the abundance of CORs on e-commerce platforms provides valuable opportunities for in-depth analysis. Previous studies have developed various methods to extract co-movement features and demonstrated promising results in bivariate co-movement prediction. However, challenges persist in systematically extracting these features, applying them for prediction, and interpreting results, particularly in nonlinear systems. These gaps underscore the necessity of exploring novel approaches to predict the co-movement between CS and SP in the context of e-commerce enterprises.
Addressing the gaps identified in the extant literature, this study introduces a novel approach, grounded in complex network theory, to forecast the co-movement dynamics between CS and SP of e-commerce platforms. The basic approach is: design an algorithm for collecting and quantifying CORs on e-commerce platforms to obtain a more finely-grained CS; and then transform the time series data of CS and SP into BCN and extract the co-movement features based on the network’s topology; construct a rule combinations model based on the co-movement features to forecast future co-movement mode. Moreover, model optimization involves entropy optimization guided by co-movement features.
The closing price is a crucial indicator that reflects daily market trends and is easily accessible through stock trading platforms. The process of obtaining the CS involved four key steps (see Figure 1). Firstly, CORs are collected using web crawling techniques. Secondly, a dictionary-based text sentiment analysis method is applied, utilizing the Jieba text segmentation tool to segment, analyze, and match the text with the dictionary for initial data processing. Then, sentiment values are calculated based on the part-of-speech and weights assigned by the dictionary. Finally, the obtained sentiment values that passed the test are used as the CS. The test algorithm demonstrated an accuracy of 84.77% when applied to the Tan Songbo hotel review corpus, confirming its practical applicability.
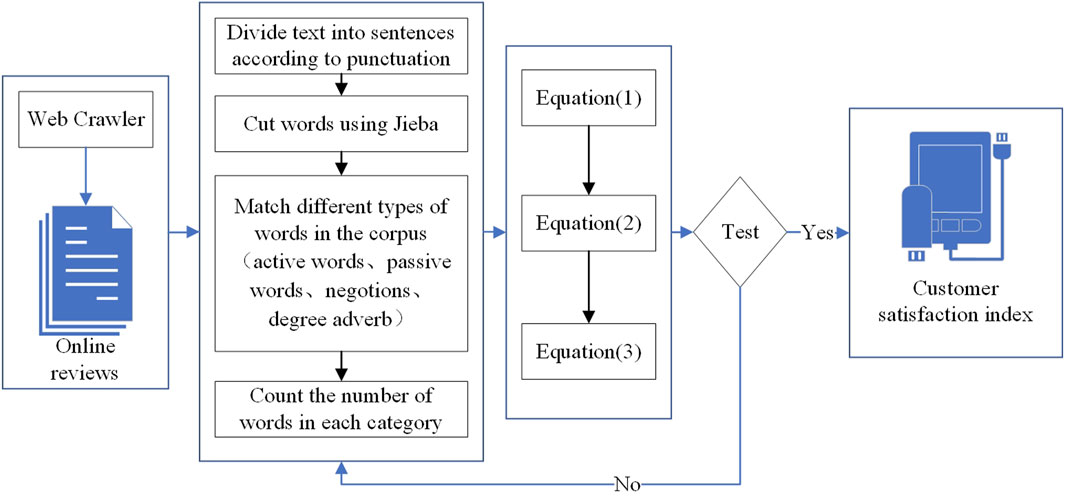
Figure 1. Text sentiment analysis flowchart.
Since reviews consist of sentences, Equation 1 calculates sentiment scores at the sentence level, while Equation 2 aggregates them to determine the review-level sentiment score, and Equation 3 standardizes it.
where
where CS is represented as a numerical value quantified on a scale from 0 to 100, derived from text sentiment analysis.
In this study, co-movement describes the relationship between CS and SP, while the co-movement symbol represents both the direction and magnitude of their interaction. The coarse graining method in symbol dynamics and time series involves defining the co-movement sequence as
Thus, the co-movement between CS and SP can be represented by a continuous symbol sequence, and the corresponding symbol sequence is given in Equation 5.
Given that stock trading typically spans five consecutive days, with statutory holidays excluded from consideration, we define a node as the co-movement of four consecutive days.
Using the coarsened data, edges in the co-movement network are established by connecting the previous co-movement mode combination to the neighboring subsequent co-movement mode combination. The number of transitions between two combinations of the same mode function as the edge weight. Therefore, a weighted directed BCN is constructed to depict the co-movement modes between CS and SP.
If the symbol sequence mapped for the time series is
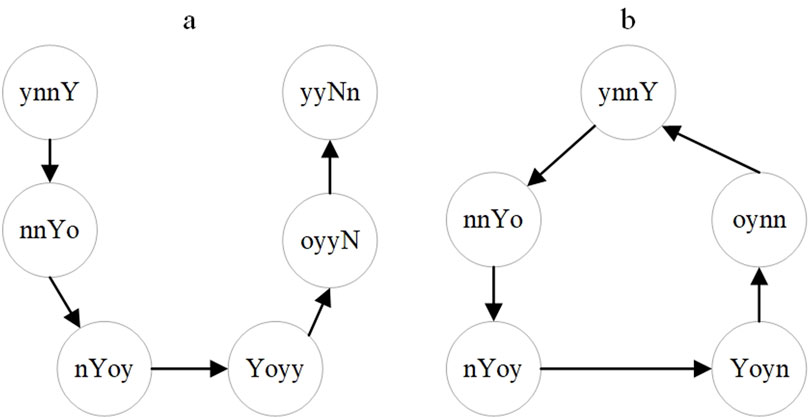
Figure 2. Network structure corresponding to the latest data array.
We derive BCN’s features across four key dimensions to guide the subsequent predictions, with the specific features and indicators detailed in Table 1.

Table 1. Outlines the framework of the feature extraction model for BCN.
Co-movement forecasting is the prediction of the next day’s CS and SP co-movement symbol. For instance, if we observe a co-movement mode on day
To ensure the accuracy of predictions, it is essential to adjust the network structure to enhance its clarity, particularly in cases where chaotic nonlinear systems exhibit strong randomness. Therefore, the partial edge weights are adjusted to improve its predictability based on entropy optimization. Entropy optimization is a method for finding the optimal solution under given constraints by maximizing or minimizing an entropy-based objective function, leveraging the mathematical properties of entropy and principles of information theory [50]. Entropy, as an optimization and correction tool, is used to optimize the return statistics that do not follow Gaussian distribution, and to correct the geometric Brownian motion model by relaxing the assumption of lognormal distribution [51, 52]. Furthermore, entropy optimization is utilized in identifying topological changes in complex networks, assessing network consistency, and reducing knowledge distillation loss in deep neural networks by adjusting network entropy [53–55]. The use of entropy is prevalent in economics, with applications ranging from risk measurement and portfolio optimization to the design of combined economic emission dispatch optimization algorithms, all of which contribute to enhancing the scientific basis for decision-making [51, 56, 57]. The aforementioned studies demonstrate the broad applicability and notable effectiveness of entropy optimization across various economic domains.
The standard network strength entropy is employed as a measurement tool, which extends Shannon entropy to quantify the uncertainty in the distribution of node or edge strength [58]. This measure is standardized to enhance its applicability to network analysis. Building upon this, the approach constructs a bi-objective entropy optimization model that aims to minimize network distortion and simultaneously adjusts the weights of selected edges to reduce the network’s output entropy (see
Where
In the process of constructing a BCN, it is crucial to consider two scenarios for the latest nodes:
(1) If the latest node
(2) If
Based on the preceding analysis (3.2.2), the future nodes at
Rule 1: The principle of the greatest Node Similarity. Link prediction techniques are applied, where the probability of a potential connectivity between nodes is determined by computing the similarity between two nodes. The node with the highest similarity is selected as the predicted node, and in case of tie, preference is given to the relatively most recent node.
Given a pair of nodes (
where
where
If the maximum value of either
Rule 2: The principle of the greatest node strength, that is, select the node with the largest node strength from
Rule 3: The principle of the greatest connection strength, that is, select the node with the largest connection strength from
Following these rules, co-movement modes prediction function was established, as shown in Equation 10.
where
The co-movement prediction of CS and SP refers to forecasting both the direction and strength of their co-movement. Hence, model prediction accuracy is assessed in terms of two aspects: accurately predicting both the co-movement direction and strength, or solely the co-movement direction. The evaluation indicators for accurately predicting both co-movement direction and strength are defined in Equations 11, 12.
The evaluation indicators for accurately predicting the co-movement direction are given in Equations 13, 14.
A set of experiments was conducted using JD.com, a prominent B2C online shopping platform. According to a 2022 Tencent report, electronic products on JD.com accounted for over 60%. Hence, 44 high-selling electronic products were selected from JD. com’s main product categories, encompassing five renowned brands: Huawei, Apple, Samsung, Xiaomi, and OPPO.
A total of 92,722 CORs were collected, spanning from 9 January 2018, to 15 August 2022. The collected CORs include the consumers’ review and the date. Textual sentiment analysis resulted in a 1,645-day CS dataset. Given that multiple data points exist for the same day, we use the daily average to more accurately reflect the overall CS for that day. The closing price from 9 January 2018, to 15 August 2022, was obtained from the Straight Flush website.
After data merging, 1,135 sets of data were obtained. Subsequently, a Spearman correlation coefficient test was conducted, revealing a significant positive correlation between them. The summary statistics indicate that the data do not follow a normal distribution (see Supplementary Appendix A). This suggests that the relationship between the variables is complex and warrants further analysis using nonlinear methods. To further process the data, coarse-graining and sliding window techniques were employed, resulting in the generation of 268 nodes and 1,134 edges.
Figure 3 displays the CS and SP Co-movement Network (CS-SPCN). It shows obvious differences in the influence of the co-movement modes, and the clustering between different modes.

Figure 3. Co-movement network diagram of CS and SP.
Furthermore, as the data volume expands, the increase in node count exhibits a diminishing trend (see Figure 4). The temporal intervals between the occurrence of new co-movement modes and those of old modes eventually grow longer (see Figure 5). This implies that future modes are likely to be once-emerged modes. It also demonstrates that JD. com’s CS-SPCN adheres to the application premise of the co-movement mode prediction model developed in this study.
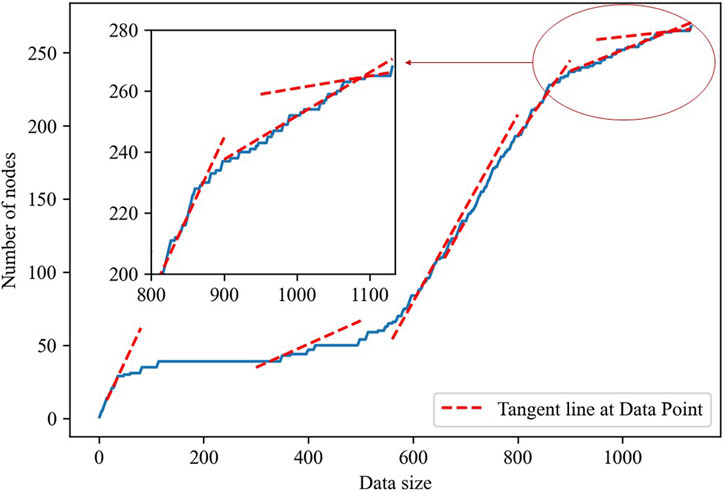
Figure 4. Relationship between Data Size and Number of Nodes.
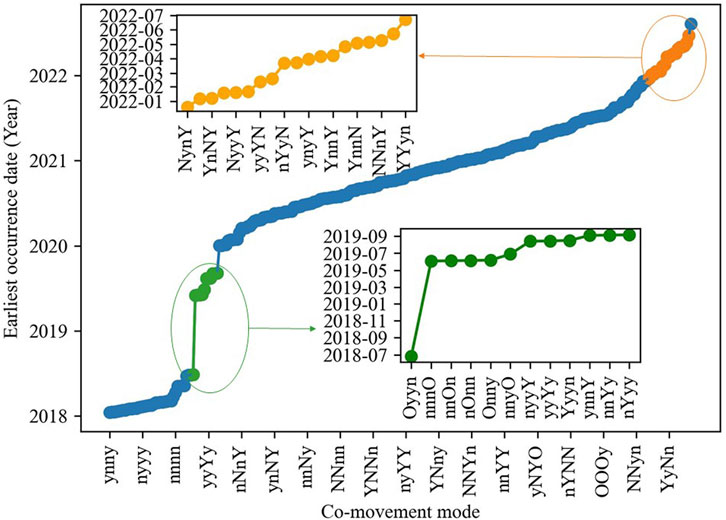
Figure 5. Relationship between Co-movement Modes and Earliest Occurrence Times.
(1) The co-movement between CS and SP is primarily slightly negative. Specifically, there were 98 instances of opposite-direction co-movement over four consecutive days, while only 76 instances of same-direction co-movement occurred (see Table 2). This reflects the risk of reverse reactions and potential misalignment between CS and SP.
(2) The CS-SPCN exhibits an uneven distribution, characterized by significant disparities in nodes and edges. The initial 16 nodes demonstrate substantial node strength, accounting for a cumulative strength distribution of 51.46%. In contrast, there are 113 nodes with a node strength of two or less, representing only 9.96% of the total strength (see Figure 6A). Figure 6B demonstrates that the cumulative strength distribution approximately follows a power-law distribution, indicating that the CS-SPCN is a scale-free network. There are primarily 16 manifestations of co-movement modes. These 16 co-movement modes frequently transition to other modes, or vice versa, demonstrating a high frequency of shifts between modes. This suggests that market reactions are nonlinear and complex, and companies must focus on the most influential factors, concentrating their resources on understanding core sentiment and market responses.
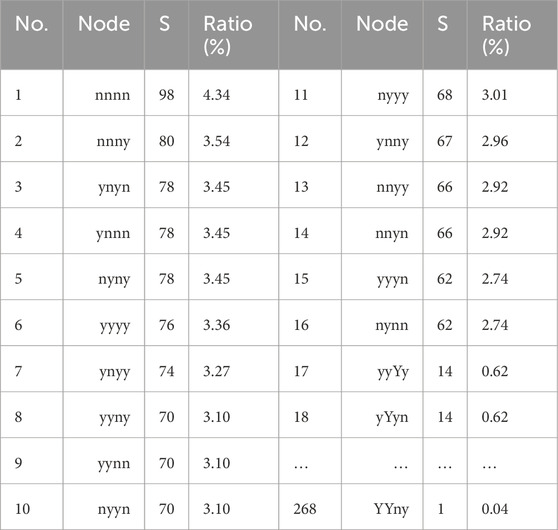
Table 2. Node strength and strength distribution of each co-movement mode.
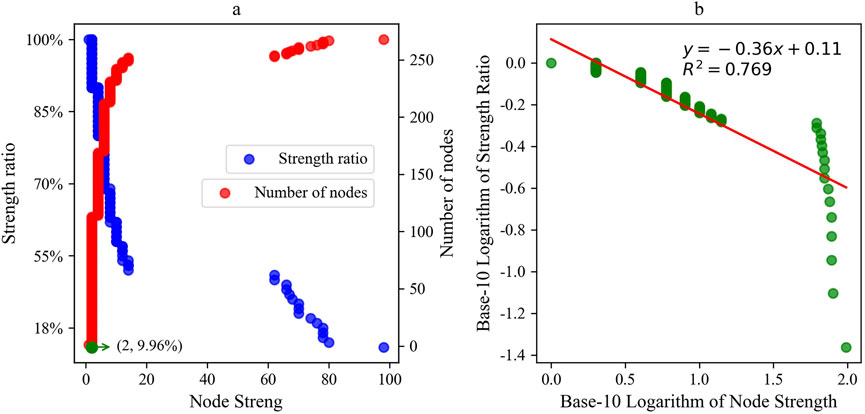
Figure 6. Relationship of Node Strength with Strength Ratio and Number of Nodes. Strength Ratio represents the ratio of the cumulative strength of the nodes to the sum of all nodes’ strength.
The CS-SPCN exhibits a certain degree of clustering, with some nodes having strong connections, forming small and tightly-knit communities or subgroups. There are 29 nodes with a non-zero clustering coefficient. Both
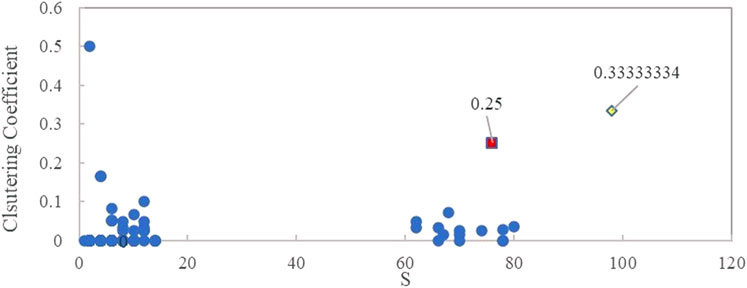
Figure 7. Relationship between Node Strength and Clustering Coefficient.
(1) Nodes with violent co-movement symbols exert substantial network influence. In terms of transition capabilities,
(2) The co-movement between CS and SP exhibits a cyclical pattern, with a periodicity of 8 days. The CS-SPCN demonstrates an average path length of 7.696. Given a mode generation sliding unit of 1 day, transitions between modes span approximately 8 days, thus accentuating the periodic feature of the co-movement. Companies should develop forecasting models to adjust decisions promptly in response to market cycles.
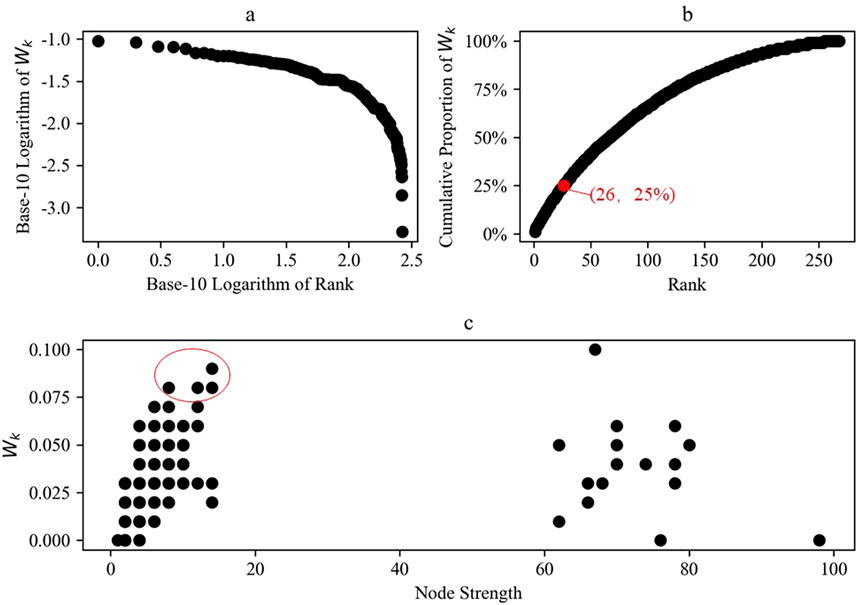
Figure 8. Betweenness centrality distribution. Rank refers to the nodes ordered according to Wk. Cumulative proportion of Wk represents the ratio of the cumulative Wk of the nodes to the sum of all nodes’ Wk.
Overall, the network exhibits a high degree of randomness and disorder, as evidenced by the standard network strength of the BCN exceeding 0.8, which suggests that predicting the next node in the network without relying on local information is highly challenging. This also indicates that businesses operate in a highly uncertain environment, where both businesses and investors face the risk of being unable to accurately predict future market changes, thereby impacting the effectiveness and precision of their decisions. This study addresses the challenge of predicting the nodes at
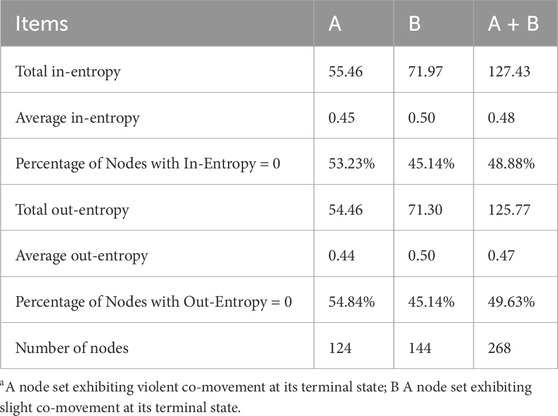
Table 3. Network entropy.
To enhance the network’s predictability, the edge weight of the node set with violent co-movement at the terminal state is adjusted to
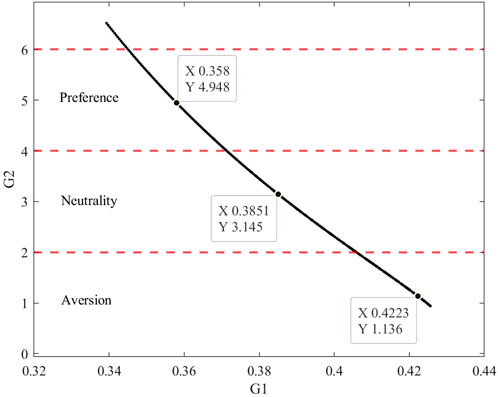
Figure 9. Pareto Frontier in the bi-objective optimization.
Given that
Sample of model estimation. The growth of a business usually follows an “S” curve. In addition, the network structure exhibits annual instability in the post-pandemic period. By utilizing up-to-date data, more precise predictions can be generated. Hence, a sample of co-movement modes from 2022 is employed to evaluate the accuracy of the model.
Implementation details. To assess the effectiveness of BCN optimization, we conducted four experimental sets with varying distortion preferences and baseline model, comparing the prediction accuracy of each model. Experiment A0 serves as the baseline model, where the BCN is not optimized. Experiment A1 represents the predictive model under distortion aversion (
Figure 10A0 shows that M-5 and M-6 demonstrate higher prediction accuracy compared to other models, suggesting that node strength and edge weight are the primary factors influencing the co-movement between CS and SP, while the influence of node similarity appears to be negligible. By comparing with Figure 10A0, it is evident that the prediction accuracy of M-5 and M-6 is significantly improved by entropy optimization, whereas the impact on the prediction accuracy of M-1 to M-4 is less pronounced. This is primarily because the optimization of the network has a direct and significant impact on the strength of nodes and edges, but does not significantly affect the similarity between nodes. Furthermore, as the forecasting length (FL) increases, the prediction accuracy tends to converge around 50%–60%. The prediction accuracy of M-6 is nearly identical under the conditions of distortion aversion and neutrality, with both exceeding 80% (see Figures 10A1, A2). The prediction accuracy of M-5 and M-6 can approach 90% under the distortion preference condition (see Figure 10A3).
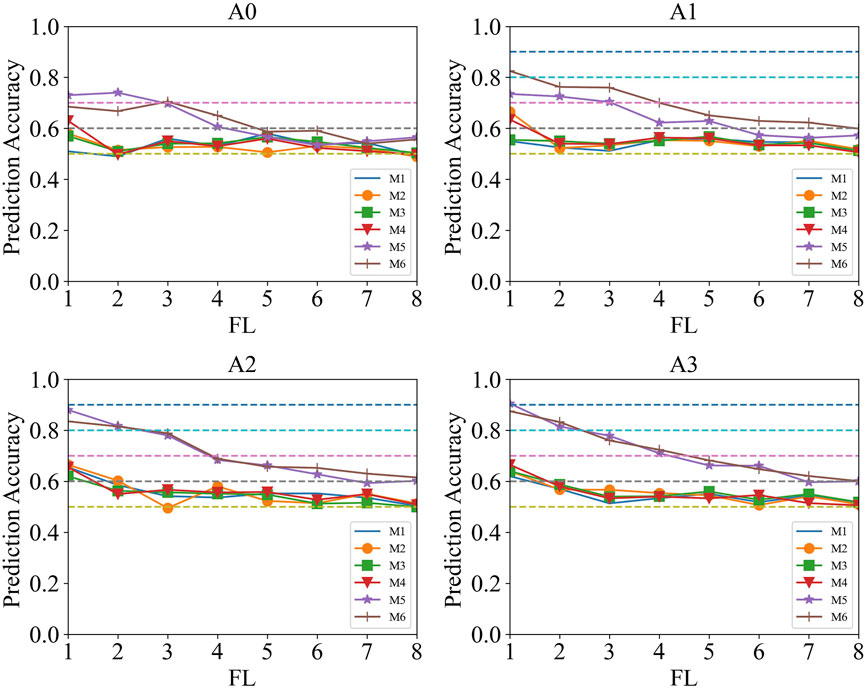
Figure 10. Model prediction accuracy under different FL.
Compared to RC-BCN alone, the prediction accuracy of our proposed RC-BCN based on entropy optimization is, on average, improved by 15.5% under M-6. To further elucidate the contribution of this study, we compare the method proposed herein with the prediction results obtained from the BP neural network and LSTM models. For the problems addressed in this paper, both the BP neural network and LSTM models use the autoregressive method to predict the values of CS and SP, respectively. The co-movement direction of CS and SP is then calculated based on the prediction results, with the methods denoted as
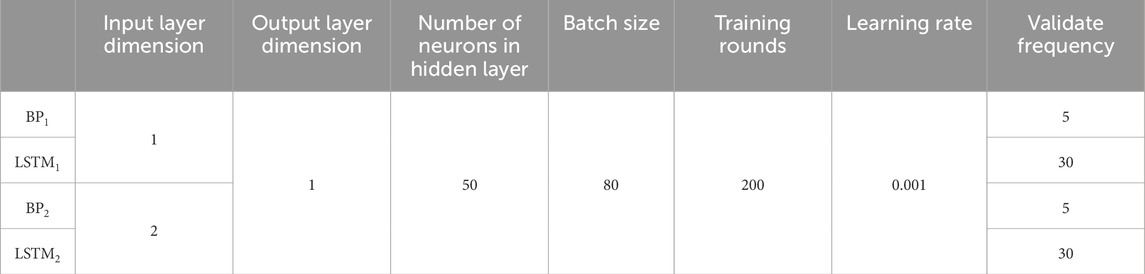
Table 4. Model parameter setting.
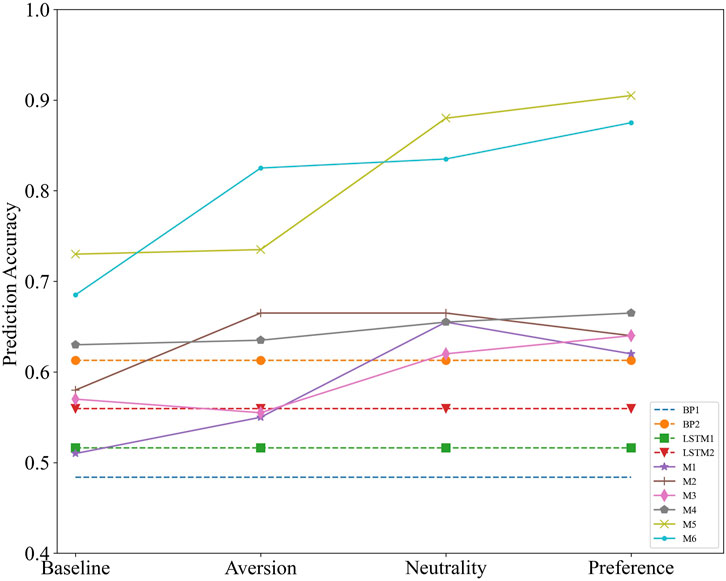
Figure 11. Prediction accuracy across different models when FL = 1.
We employ M-5 and M-6 to predict the next 4 days co-movement modes under the different preferences of decision makers. The latest co-movement mode is
The co-movement forecast between CP and SP could assist publicly listed e-commerce companies in financing decisions and investors in making investment decisions. Motivated by it, we explore the forecast approach of the co-movement modes between the two based on complex network and entropy optimization. Specially we project the time series data into the phase space, and enhance the prediction through rule combination and entropy optimization instructed by features extracted from network topology indicators. We conducted four experimental sets, with results indicating the model’s successful predictive performance. This paper provides a new perspective for the prediction of chaotic nonlinear systems and expands the application of entropy optimization within the field of e-commerce.
This study’s proposed approach for co-movement prediction in CS and SP yielded favorable results. Particularly the study innovatively puts forward entropy optimization guided by network features to enhance co-movement prediction. In our experiment, we construct CS-SP CN using time series data, and combine the designed forecasting rules with network features to form bivariate co-movement forecasting based on rule combination for the first time. We call this novel approach RC-BCN. Comprehensive experiments show that the probability of establishing connections between highly similar modes is minimal in CS-SPCN. This may be attributed to the influence of nonlinear relationships, external variables, or temporal factors within CS-SPCN. The connection among co-movement modes is primarily influenced by node strength and edge weight in CS-SPCN. M-5 involves identifying the node with the strongest strength among the external nodes corresponding to the target node as the prediction outcome. In the case of M-6, the prediction outcome is determined by selecting the mode with the highest connection weight among the externally connected modes of the co-movement mode. These two models perform well. This demonstrates the effective integration of complex networks and entropy optimization into time series analysis, resulting in enhanced performance.
The sample size and data source may limit the generalizability of the results. Nevertheless, the JD platform and the electronic product categories selected in this study are representative, providing valuable insights into typical consumer behavior and financial market dynamics. Moreover, the robustness of the results has been verified using randomized experiments and sensitivity analysis (detailed in Supplementary Appendix B). To extend these findings, future research could explore enterprises across various industries, beyond just e-commerce, further validating and enriching the applicability of the proposed approach.
From a theoretical perspective, three outcomes are worth mentioning. Firstly, we delve into the co-movement between CS and SP on a finer time scale, providing valuable insights to support investor decision-making and corporate financing strategies. Secondly, we introduce a novel co-movement prediction model based on BCN and rule combination. Thirdly, we extend the application of entropy optimization in forecasting the co-movement between CS and SP, offers a new perspective on their relationship, and contributes to the development of entropy theory in economics.
Regarding practical contributions, the co-movement forecasting provides valuable insights for corporate financing and investor decision-making by revealing the intricate relationship between CS and SP. For companies, leveraging this market feedback can help optimize financing strategies and assess potential risks. If negative sentiment is predicted to lead to a decline in stock prices, enterprises may opt to raise funds during periods of more favorable market sentiment, thereby reducing financing costs. For investors, understanding the predicted co-movement patterns, especially sustained opposite trends, can help them make more informed investment decisions and adopt appropriate risk mitigation strategies, ensuring cautious investment in volatile market conditions.
In this study, we integrated complex network theory and entropy optimization into time series analysis, introducing a novel RC-BCN method to forecast the co-movement between CS and SP, which performs well. Additionally, the co-movement between CS and SP of JD is primarily driven by node strength and edge weight, suggesting that nodes and node pairs with higher frequencies of past appearances are more likely to reappear in the future. This indicates that the co-movement between CS and SP is influenced not only by the continuity of existing market behaviors and interaction structures, but also reflects the Matthew effect, that is, frequently occurring co-movement patterns are more likely to continue to dominate the co-movement in the future. Moreover, this study contributes a novel perspective and methodological framework for examining bivariate co-movement, offering significant implications for enterprises and investors in optimizing financing and investment strategies.
Similar to many studies, this research is not without its limitations. First, this study examines co-movement between variables in the same or opposite directions, but does not distinguish whether the co-movement in the same direction is positive or negative. Second, while many variables affect corporate financing and investment, this research focuses solely on two-variable co-movement prediction. Future studies will extend this method to forecast the co-movement among additional economic variables to enhance the generalizability of the findings. By incorporating the specific co-movement directions of each variable, both businesses and researchers can gain deeper insights into the interdependent relationships among complex economic systems in e-commerce.
The original contributions presented in the study are included in the article/Supplementary Material, further inquiries can be directed to the corresponding author.
MW: Conceptualization, Data curation, Formal Analysis, Investigation, Methodology, Software, Writing–original draft, Writing–review and editing. RK: Conceptualization, Supervision, Writing–review and editing. JL: Methodology, Writing–review and editing. WH: Writing–review and editing.
The author(s) declare that no financial support was received for the research, authorship, and/or publication of this article.
The authors appreciate the valuable comments of the editors and reviewers.
The authors declare that the research was conducted in the absence of any commercial or financial relationships that could be construed as a potential conflict of interest.
The author(s) declare that no Generative AI was used in the creation of this manuscript.
All claims expressed in this article are solely those of the authors and do not necessarily represent those of their affiliated organizations, or those of the publisher, the editors and the reviewers. Any product that may be evaluated in this article, or claim that may be made by its manufacturer, is not guaranteed or endorsed by the publisher.
The Supplementary Material for this article can be found online at: https://www.frontiersin.org/articles/10.3389/fphy.2025.1557361/full#supplementary-material
1. Shapiro AH, Sudhof M, Wilson DJ. Measuring news sentiment. J Econom (2022) 228(2):221–43. doi:10.1016/j.jeconom.2020.07.053
2. Wang H, Shen H, Li S. ESG performance and stock price fragility. Finance Res Lett (2023) 56:104101. doi:10.1016/j.frl.2023.104101
3. Chaudhari K, Thakkar A. Data fusion with factored quantization for stock trend prediction using neural networks. Inf Process Manag (2023) 60(3):103293. doi:10.1016/j.ipm.2023.103293
4. Eachempati P, Srivastava PR, Kumar A, Munoz de Prat J, Delen D. Can customer sentiment impact firm value? An integrated text mining approach. Technol Forecast Soc Change (2022) 174:121265. doi:10.1016/j.techfore.2021.121265
5. Abdelfattah BA, Darwish SM, Elkaffas SM. Enhancing the prediction of stock market movement using neutrosophic-logic-based sentiment analysis. J Theor Appl Electron Commer Res (2024) 19(1):116–34. doi:10.3390/jtaer19010007
6. Nguyen H, Calantone R, Krishnan R. Influence of social media emotional word of mouth on institutional investors’ decisions and firm value. Manage Sci (2020) 66:887–910. doi:10.1287/mnsc.2018.3226
7. Li J, Zhang Y, Li J, Du J. The role of sentiment tendency in affecting review helpfulness for durable products: nonlinearity and complementarity. Inf Syst Front (2023) 25(4):1459–77. doi:10.1007/s10796-022-10292-3
8. Bennett B, Stulz R, Wang Z. Does the stock market make firms more productive? J Financ Econ (2020) 136(2):281–306. doi:10.1016/j.jfineco.2019.09.006
9. Zhang H, Chen Y, Rong W, Wang J, Tan J. Effect of social media rumors on stock market volatility: a case of data mining in China. Front Phys (2022) 10:987799. doi:10.3389/fphy.2022.987799
10. Ahmed WMA. Stock market reactions to domestic sentiment: panel CS-ardl evidence. Res Int Bus Finance (2020) 54:101240. doi:10.1016/j.ribaf.2020.101240
11. Tiwari AK, Abakah EJA, Bonsu CO, Karikari NK, Hammoudeh S. The effects of public sentiments and feelings on stock market behavior: evidence from Australia. J Econ Behav Organ (2022) 193:443–72. doi:10.1016/j.jebo.2021.11.026
12. Tetlock PC. Giving content to investor sentiment: the role of media in the stock market. J Finance (2007) 62:1139–68. doi:10.1111/j.1540-6261.2007.01232.x
13. Singal M. Effect of consumer sentiment on hospitality expenditures and stock returns. Int J Hosp Manag (2012) 31(2):511–21. doi:10.1016/j.ijhm.2011.07.009
14. Wang X, Han X, Chen Z, Bi Q, Guan S, Zou Y. Multi-scale transition network approaches for nonlinear time series analysis. Chaos Solitons Fractals (2022) 159:112026. doi:10.1016/j.chaos.2022.112026
15. Xu X. What are customers commenting on, and how is their satisfaction affected? Examining online reviews in the on-demand food service context. Decis. Support Syst (2021) 142:113467. doi:10.1016/j.dss.2020.113467
16. Nilashi M, Fallahpour A, Wong KY, Ghabban F. Customer satisfaction analysis and preference prediction in historic sites through electronic word of mouth. Neural Comput Appl (2022) 34(16):13867–81. doi:10.1007/s00521-022-07186-5
17. Kumar A, Chakraborty S, Bala PK. Text mining approach to explore determinants of grocery mobile app satisfaction using online customer reviews. J Retail Consum Serv (2023) 73:103363. doi:10.1016/j.jretconser.2023.103363
18. Minaee S, Kalchbrenner N, Cambria E, Nikzad N, Chenaghlu M, Gao J. Deep learning-based text classification: a comprehensive review. ACM Comput Surv (2022) 54(3):1–40. doi:10.1145/3439726
19. Alantari HJ, Currim IS, Deng Y, Singh S. An empirical comparison of machine learning methods for text-based sentiment analysis of online consumer reviews. Int J Res Mark (2022) 39(1):1–19. doi:10.1016/j.ijresmar.2021.10.011
20. Li H, Chen Q, Zhong Z, Gong R, Han G. E-word of mouth sentiment analysis for user behavior studies. Inf Process Manag (2022) 59(1):102784. doi:10.1016/j.ipm.2021.102784
21. Liang D, Dai Z, Wang M. Assessing customer satisfaction of O2O takeaway based on online reviews by integrating fuzzy comprehensive evaluation with AHP and probabilistic linguistic term sets. Appl Soft Comput (2021) 98:106847. doi:10.1016/j.asoc.2020.106847
22. Gang Z, Chenglin L. Dynamic measurement and evaluation of hotel customer satisfaction through sentiment analysis on online reviews. J Organ End User Comput (2021) 33(6):1–27. doi:10.4018/JOEUC.20211101.oa8
23. Darko AP, Liang D. Modeling customer satisfaction through online reviews: a FlowSort group decision model under probabilistic linguistic settings. Expert Syst Appl (2022) 195:116649. doi:10.1016/j.eswa.2022.116649
24. Park J. Combined text-mining/DEA method for measuring level of customer satisfaction from online reviews. Expert Syst Appl (2023) 232:120767. doi:10.1016/j.eswa.2023.120767
25. Jiang X, Li SP, Mai Y, Tian T. Study of multinational currency Co-movement and exchange rate stability base on network game. Finance Res Lett (2022) 47:102601. doi:10.1016/j.frl.2021.102601
26. Urom C, Ndubuisi G, Guesmi K, Benkraien R. Quantile Co-movement and dependence between energy-focused sectors and artificial intelligence. Technol Forecast Soc Change (2022) 183:121842. doi:10.1016/j.techfore.2022.121842
27. Farid S, Karim S, Naeem MA, Nepal R, Jamasb T. Co-movement between dirty and clean energy: a time-frequency perspective. Energy Econ (2023) 119:106565. doi:10.1016/j.eneco.2023.106565
28. Wu K, Zhu J, Xu M, Yang L. Can crude oil drive the Co-movement in the international stock market? Evidence from partial wavelet coherence analysis. NORTH Am. J. Econ. Finance (2020) 53:101194. doi:10.1016/j.najef.2020.101194
29. Yu X, Xiao K, Liu J. Dynamic Co-movements of COVID-19 pandemic anxieties and stock market returns. Finance Res Lett (2022) 46:102219. doi:10.1016/j.frl.2021.102219
30. Wadud S, Gronwald M, Durand RB, Lee S. Co-movement between commodity and equity markets revisited-an application of the Thick pen method. Int Rev Financ Anal (2023) 87:102568. doi:10.1016/j.irfa.2023.102568
31. Liu H, Zhao T, Wang S, Li X. A stock rank prediction method combining industry attributes and price data of stocks. Inf Process Manag (2023) 60(4):103358. doi:10.1016/j.ipm.2023.103358
32. Zhu C, Fan R, Sun J, Luo M, Zhang Y. Exploring the fluctuant transmission characteristics of air quality Index based on time series network model. Ecol Indic (2020) 108:105681. doi:10.1016/j.ecolind.2019.105681
33. Li H, Liu Z. Multivariate time series clustering based on complex network. Pattern Recognit (2021) 115:107919. doi:10.1016/j.patcog.2021.107919
34. Fatima S, Uddin M. On the forecasting of multivariate financial time series using hybridization of DCC-GARCH model and multivariate ANNs. Neural Comput Appl (2022) 34(24):21911–25. doi:10.1007/s00521-022-07631-5
35. Tang K, Guo T, Shao F, Ma Y, Khattak AJ. Spatial-temporal traffic performance collaborative forecast in urban road network based on dynamic factor model. Expert Syst Appl (2023) 225:120090. doi:10.1016/j.eswa.2023.120090
36. Zhou Y, Xie C, Wang GJ, Zhu Y, Uddin GS. Analysing and forecasting co-movement between innovative and traditional financial assets based on complex network and machine learning. Int Bus Finance (2023) 64:101846. doi:10.1016/j.ribaf.2022.101846
37. Liu M, Lee CC. Capturing the dynamics of the China crude oil futures: markov switching, co-movement, and volatility forecasting. Energ Econ (2021) 103:105622. doi:10.1016/j.eneco.2021.105622
38. Laborda R, Olmo J. Volatility spillover between economic sectors in financial crisis prediction: evidence spanning the great financial crisis and covid-19 pandemic. Res Int Bus Finance (2021) 57:101402. doi:10.1016/j.ribaf.2021.101402
39. Men B, Long R, Li Y, Liu H, Tian W, Wu Z. Combined forecasting of rainfall based on fuzzy clustering and cross entropy. Entropy (2017) 19(12):694. doi:10.3390/e19120694
40. Wu Y, Qian C, Huang H. Enhanced air quality prediction using a coupled DVMD informer-CNN-LSTM model optimized with dung beetle algorithm. Entropy (2024) 26(7):534. doi:10.3390/e26070534
41. Zhang Z, Sun F, Li Q, Wang W, Hu D, Li S. Establishment of the predicting models of the dyeing effect in supercritical carbon dioxide based on the generalized regression neural network and Back propagation neural network. Processes. Processes (Basel) (2020) 8(12):1631. doi:10.3390/pr8121631
42. Gul H, Amin A, Adnan A, Huang K. A systematic analysis of link prediction in complex network. IEEE Access (2021) 9:20531–41. doi:10.1109/ACCESS.2021.3053995
43. De Souza Moreira FR, Neto Verri FA, Yoneyama T. Maximum visibility: a novel approach for time series forecasting based on complex network theory. IEEE Access (2022) 10:8960–73. doi:10.1109/ACCESS.2022.3143106
44. Awijen H, Ben Ameur H, Ftiti Z, Louhichi W. Forecasting oil price in times of crisis: a new evidence from machine learning versus deep learning models. Ann Oper Res (2023). doi:10.1007/s10479-023-05400-8
45. Nasiri E, Berahmand K, Li Y. A new link prediction in multiplex networks using topologically biased random walks. Chaos Solitons Fractals (2021) 151:111230. doi:10.1016/j.chaos.2021.111230
46. Wen T, Chen H, Cheong KH. Visibility graph for time series prediction and image classification: a review. Nonlinear Dyn (2022) 110(4):2979–99. doi:10.1007/s11071-022-08002-4
47. Hao J, Li Z, Wu Z, Ma J. Role of degree and weighted coreness based on endpoints in link prediction. Front Phys (2022) 10:1016535. doi:10.3389/fphy.2022.1016535
48. Xu G, Yu Z, Yao H, Li F, Meng Y, Wu X. Chinese text sentiment analysis based on extended sentiment dictionary. IEEE access (2019) 7:43749–62. doi:10.1109/access.2019.2907772
49. Wang M, Tian L. From time series to complex networks: the phase space coarse graining. Phys Stat Mech Its Appl (2016) 461:456–68. doi:10.1016/j.physa.2016.06.028
50. Kapur JN, Kesavan HK. Entropy optimization principles and their applications. In: VP Singh, and M Fiorentino, editors. Entropy and energy dissipation in water resources. Dordrecht: Springer Netherlands (1992). p. 3–20. doi:10.1007/978-94-011-2430-0_1
51. Rodriguez-Rodriguez N, Miramontes O. Shannon entropy: an econophysical approach to cryptocurrency portfolios. Entropy (2022) 24(11):1583. doi:10.3390/e24111583
52. Su H, Chen D, Pan GJ, Zeng Z. Identification of network topology variations based on spectral entropy. IEEE Trans Cybern (2022) 52(10):10468–78. doi:10.1109/TCYB.2021.3070080
53. Hao B, Kovács IA. A positive statistical benchmark to assess network agreement. Nat Commun (2023) 14(1):2988. doi:10.1038/s41467-023-38625-z
54. Zhu S, Shang R, Yuan B, Zhang W, Li W, Li Y, et al. DynamicKD: an effective knowledge distillation via dynamic entropy correction-based distillation for gap optimizing. Pattern Recognit (2024) 153:110545. doi:10.1016/j.patcog.2024.110545
55. Gupta R, Drzazga-Szczȩśniak EA, Kais S, Szczȩśniak D. Entropy corrected geometric brownian motion. Sci Rep (2024) 14(1):28384. doi:10.1038/s41598-024-79714-3
56. Kukreti V, Pharasi HK, Gupta P, Kumar S. A perspective on correlation-based financial networks and entropy measures. Front Phys (2020) 8:553825. doi:10.3389/fphy.2020.00323
57. Wang G, Zha Y, Wu T, Qiu J, Peng J, Xu G. Cross entropy optimization based on decomposition for multi-objective economic emission dispatch considering renewable energy generation uncertainties. Energy (2020) 193:116790. doi:10.1016/j.energy.2019.116790
58. Angelidis G, Bratsas C, Makris G, Ioannidis E, Varsakelis NC, Antoniou IE. Global value chains of COVID-19 materials: a weighted directed network analysis. Mathematics (2021) 9(24):3202. doi:10.3390/math9243202
59. Wang M, Tian L, Zhou P. A novel approach for oil price forecasting based on data fluctuation network. Energ Econ (2018) 71:201–12. doi:10.1016/j.eneco.2018.02.021
Keywords: consumer sentiment, stock price, bivariate co-movement network, entropy optimization, text sentiment analysis
Citation: Wang M, Kong R, Luo J and Hao W (2025) Co-movement forecasting between consumer sentiment and stock price in e-commerce platforms using complex network and entropy optimization. Front. Phys. 13:1557361. doi: 10.3389/fphy.2025.1557361
Received: 08 January 2025; Accepted: 10 February 2025;
Published: 14 March 2025.
Edited by:
Ze Wang, Capital Normal University, ChinaReviewed by:
Yuan Ni, Beijing Information Science and Technology University, ChinaCopyright © 2025 Wang, Kong, Luo and Hao. This is an open-access article distributed under the terms of the Creative Commons Attribution License (CC BY). The use, distribution or reproduction in other forums is permitted, provided the original author(s) and the copyright owner(s) are credited and that the original publication in this journal is cited, in accordance with accepted academic practice. No use, distribution or reproduction is permitted which does not comply with these terms.
*Correspondence: Rui Kong, a29uZ3J1aUBjdWdiLmVkdS5jbg==
Disclaimer: All claims expressed in this article are solely those of the authors and do not necessarily represent those of their affiliated organizations, or those of the publisher, the editors and the reviewers. Any product that may be evaluated in this article or claim that may be made by its manufacturer is not guaranteed or endorsed by the publisher.
Research integrity at Frontiers
Learn more about the work of our research integrity team to safeguard the quality of each article we publish.