- Jiangsu Earthquake Disaster Risk Mitigation Center (Jiangsu Province Earthquake Engineering Research Institute), Nanjing, China
Polyurethane polymer-reinforced granular material (PPGM) can be used for ground improvement due to its high strength and drainage capacity. However, in engineering practice, clogging may occur that influence the permeability of PPGM. This study makes a laboratory assessment of the permeability of PPGM with and without clogging. It is found that the permeability coefficient of clean PPGM decreases as the content of polyurethane polymer increases, due to the reduction of its porosity and pore constriction size. To account this effect, a modified constriction size formula of PPGM is proposed. With the increase of the extent of clogging, the permeability coefficient of clogged PPGM decreases due to its decrease in the constriction size. A monotonic increase of the permeability coefficient of the mean constriction size of PPGM is found.
1 Introduction
The urban surfaces in eastern China are usually covered by hard materials such as asphalt and concrete that provide convenience for public transportation. However, due to the poor permeability of these materials, negative impacts, such as the blockage of underground water supply [1] and urban flooding due to insufficient drainage of heavy rains [2], etc., can be also brought to the city. Therefore, there is an increasing demand for the development and application of pervious materials in urban construction, so that the precipitation in the city can be retained and infiltrated, sometimes turning flood disasters into reliable water resources when necessary [3]. In the past few decades, a variety of pervious materials have been developed [4–6]. For example, the pervious concrete consisting of internal pores was often used in pavement engineering to mitigate the stormwater runoff as well as the potential loss of groundwater recharge [3, 4]. However, the pervious concrete can be vulnerable to temperature which causes freeze-thaws of water in its internal pores that deteriorates the strength and durability of the pavement. Furthermore, the particulate matter, e.g., fines, can also block the internal pores and significantly reduce its permeability, as discussed in Shan, et al. [7] and Yu, et al. [8]. In addition to the pervious concrete, porous asphalt was also successfully applied in different countries, e.g., Switzerland [9] and Spain [10], for constructing the urban surface. However, such kind of permeable asphalt can be easily corroded by ultraviolet rays in the long run; it is also not resistant to frost due to cracking at low temperatures, which can cause heavy rutting in pavement.
In recent years, granular materials reinforced with polyurethane polymer [11–13] were proposed as an alternative for engineering construction, e.g., railroad foundation and ground improvement that requires a fast drainage of water to avoid potential liquefaction of the base soil caused by dynamic loads. Due to the larger permeable pores among the granular aggregates when compared to the pervious concrete or asphalt, polyurethane polymer-reinforced granular material (PPGM) can have better drainage capacity. Previous studies [12, 14] showed that the inclusion of polyurethane polymer can improve the strength and resilience of the granular material; but, it can also adversely affect the permeability if a high content of polyurethane polymer was used. For better application of the PPGM, further comprehensive studies concerning its permeability performance should be carried out.
This technical note provides a laboratory assessment of the permeability characteristics of PPGM, where the effects of void ratio, content of polyurethane polymer, and clogging on the permeability coefficient of PPGM are investigated.
2 Test material and test program
2.1 Test material
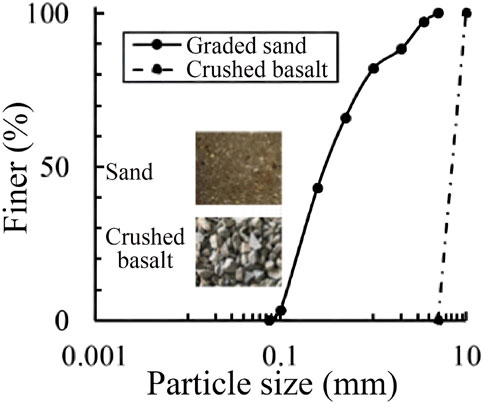
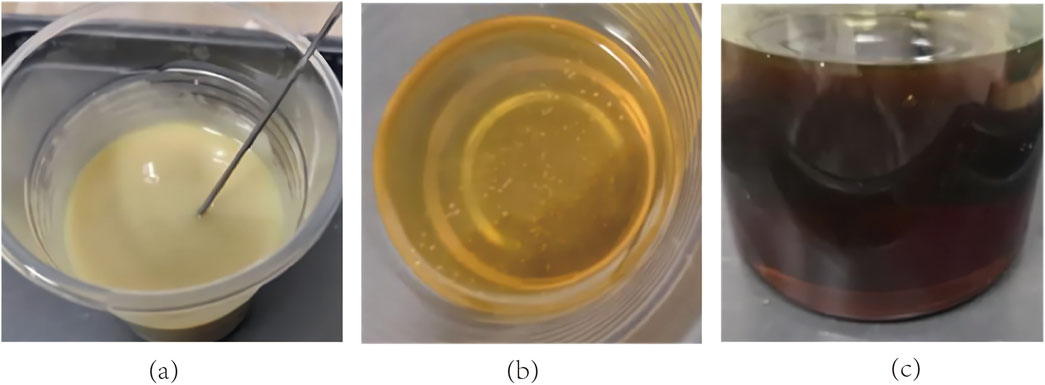
The granular material made of crushed basalt was adopted, where it was uniformly graded between the particle sizes of 5 mm−10 mm, as shown in Figure 1. Its minimum and maximum void ratios were measured to be 0.60 and 0.89, respectively. The permeability coefficient of the gravel was 2.26 cm/s. To investigate the effect of clogging on the permeability behaviour of PPGM, a sand with the gradation shown in Figure 1 was also adopted, where it had a coefficient of uniformity of 3.47, a maximum particle size of 5 mm and a minimum particle size of 0.075 mm. In this experiment, non-foamed polyurethane was used, which mainly consists of two components: component A, the adhesive, and component B, the curing agent, which is prone to oxidation reactions in the air. The polyurethane polymer shown in Figure 2A was produced by mixing the polyol (Figure 2B) and polymethylene polyphenyl isocyanate (Figure 2C), based on a volume ratio of 3:2. Then, the polyurethane polymer was poured into the granular material, based on the contents of 3%, 4%, 5% and 6%, respectively, to produce each PPGM sample tested in this study. The detailed sample preparation steps are as follows: (1) Wash the aggregate thoroughly to remove any surface mud, then allow it to dry; (2) Measure the required amounts of aggregate and polyurethane components A and B according to the design mix and sample volume; (3) Mix polyurethane components A and B thoroughly for about 1 min until they are completely blended; (4) Gradually pour the mixed polyurethane in batches onto the aggregate while stirring, and stop mixing once the surface of the mixture is completely coated with the adhesive; (5) Pack the mixture into the mold in two layers, tamping each layer 15 times, and level the top surface. Once the sample reaches a certain strength (generally after 1 day), demold the sample.
2.2 Test program
The porosity of the PPGM samples with different contents (
where
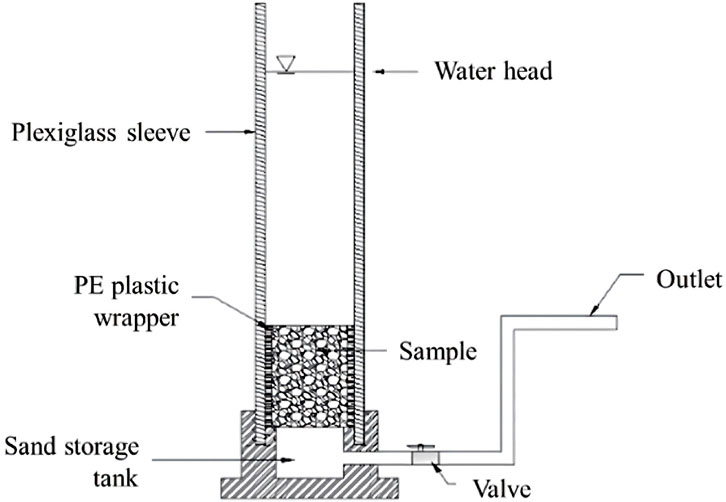
The permeability of each PPGM sample was tested under constant water head. As the effect of clogging on the permeability of PPGM should be considered, a modified permeability test instrument instead of the traditional one [15], as schematically shown in Figure 3, was used. The samples were placed in a cylindrical PVC pipe with a diameter of 7.5 cm and a height of 20 cm. Due to the open channels of PPGM connected to the side wall of the test instrument, the water can easily flow through these channels along the side wall, resulting in an inaccurate measurement of the permeability coefficient (
where
3 Test results
3.1 Permeability behavior of clean PPGM
Figure 4 shows the coefficient of permeability (
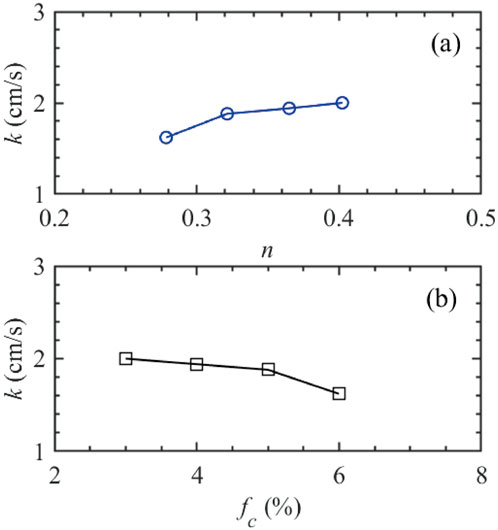
Figure 4. Permeability coefficient of clean PPGM: (A) Influence of porosity; (B) Influence of content of polyurethane polymer.
3.2 Permeability behavior of clean PPGM
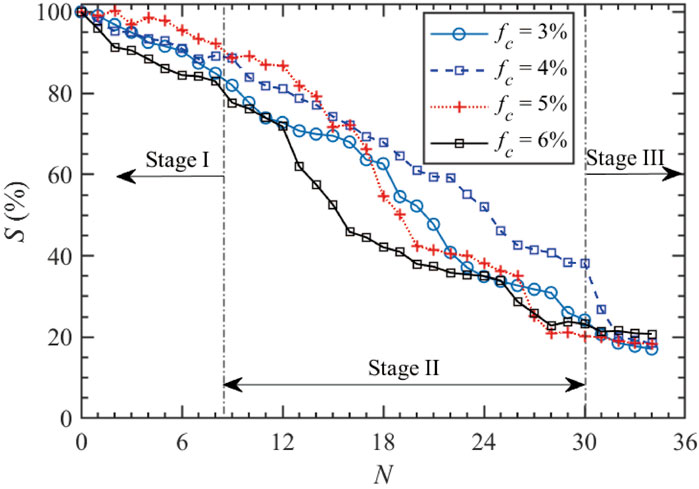
Figure 5 shows the variation of the permeability of clogged PPGM after adding sand. It can be found that the permeability of PPGM decreases after adding sand. As the amount of sand increases, the extent of clogging increases which results in the reduction of the remain permeability,
To further test the permeability of PPGM after clogging, the sand layers at the surface of the PPGM sample were removed. In this case, the loss of permeability was changed from around 16%–21% to around 75%–80%, as shown in Table 1, where
4 Discussions
From the above test results, it can be observed that the permeability of PPGM is influenced by its porosity, particle size (or size distribution), content of polyurethane polymer and clogged particles. However, from the micromechanical perspective, it is the pore constriction that affects the permeability [16, 17]. According to Indraratna, et al. [16], the pore constriction size (
where
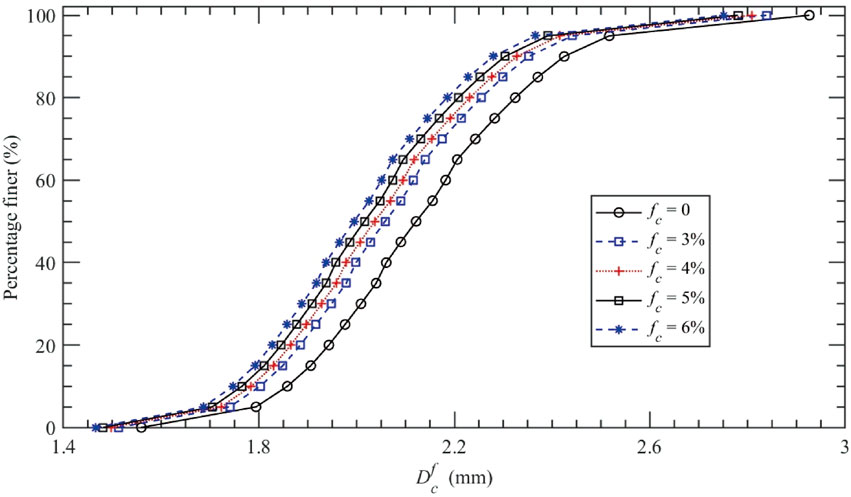
where with the increase of
Figure 6 shows the CSD of PPGM. Obviously, the greater the content of polyurethane polymer, the smaller the constriction sizes, leading to the decrease of permeability. Indraratna, et al. [16] pointed out that the permeability of granular soil had an explicit relationship with the mean constriction size,
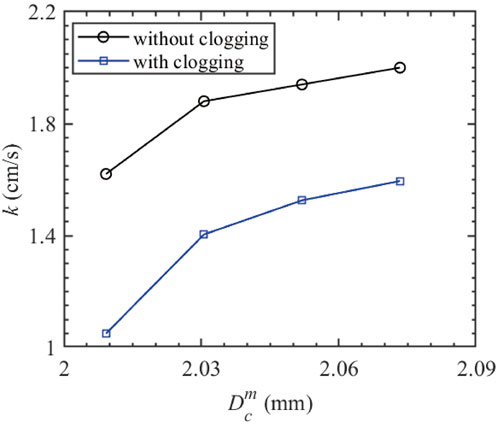
where
Figure 7 shows the variation of the permeability of PPGM with
5 Conclusion
The permeability characteristics of a polyurethane polymer-reinforced granular material (PPGM) with and without clogging was evaluated by laboratory test. The main findings of this study can be summarised as:
(1) With the increase of the content of polyurethane polymer or the decrease of the porosity, the permeability coefficient of PPGM decreased, due to the block of internal channels for water flow.
(2) As the extent of clogging increased, the remain permeability (
(3) Clogging would decrease the pore constriction size and thus the permeability of PPGM; an increase of the permeability coefficient with the increasing mean constriction size can be observed.
Data availability statement
The raw data supporting the conclusions of this article will be made available by the authors, without undue reservation.
Author contributions
XT: Conceptualization, Funding acquisition, Investigation, Methodology, Validation, Writing–original draft, Writing–review and editing. ZG: Data curation, Investigation, Methodology, Writing–original draft.
Funding
The author(s) declare that financial support was received for the research, authorship, and/or publication of this article. The authors acknowledge financial support from the National Natural Science Foundation of China (No. 51639002).
Conflict of interest
The authors declare that the research was conducted in the absence of any commercial or financial relationships that could be construed as a potential conflict of interest.
Generative AI statement
The author(s) declare that no Generative AI was used in the creation of this manuscript.
Publisher’s note
All claims expressed in this article are solely those of the authors and do not necessarily represent those of their affiliated organizations, or those of the publisher, the editors and the reviewers. Any product that may be evaluated in this article, or claim that may be made by its manufacturer, is not guaranteed or endorsed by the publisher.
References
1. Trimble SW. Contribution of stream channel erosion to sediment yield from an urbanizing watershed. Science (1997) 278:1442–4. doi:10.1126/science.278.5342.1442
2. Brattebo BO, Booth DB. Long-term stormwater quantity and quality performance of permeable pavement systems. Water Res (2003) 37:4369–76. doi:10.1016/S0043-1354(03)00410-X
4. Chandrappa AK, Biligiri KP. Pervious concrete as a sustainable pavement material-Research findings and future prospects: a state-of-the-art review. Construction Building Mater (2016) 111:262–74. doi:10.1016/j.conbuildmat.2016.02.054
5. Huang B, Wu H, Shu X, Burdette EG. Laboratory evaluation of permeability and strength of polymer-modified pervious concrete. Construction Building Mater (2010) 24:818–23. doi:10.1016/j.conbuildmat.2009.10.025
6. Sahdeo SK, Ransinchung G, Rahul KL, Debbarma S. Reclaimed asphalt pavement as a substitution to natural coarse aggregate for the production of sustainable pervious concrete pavement mixes. J Mater Civil Eng (2021) 33. doi:10.1061/(asce)mt.1943-5533.0003555
7. Shan J, Zhang Y, Wu S, Lin Z, Li L, Wu Q. Pore characteristics of pervious concrete and their influence on permeability attributes. Construction Building Mater (2022) 327:126874. doi:10.1016/j.conbuildmat.2022.126874
8. Yu F, Guo J, Liu J, Cai H, Huang Y. A review of the pore structure of pervious concrete: analyzing method, characterization parameters and the effect on performance. Construction Building Mater (2023) 365:129971. doi:10.1016/j.conbuildmat.2022.129971
9. Isenring T, Koester H, Scazziga I. Experiences with porous asphalt in Switzerland. Transportation Res Rec (1990) 41–53.
10. Ruiz A, Alberola R, Pérez F, Sánchez B. Porous asphalt mixtures in Spain. Transportation Res Rec (1990) 87–94.
11. Farooq MA, Nimbalkar S. Novel sustainable base material for concrete slab track. Construction Building Mater (2023) 366:130260. doi:10.1016/j.conbuildmat.2022.130260
12. Tan H, Yu C, Sun Y. Improved mechanical performance of gravel reinforced by polyurethane polymer adhesive. J Mater Civil Eng (2023) 35. doi:10.1061/(asce)mt.1943-5533.0004711
13. Kennedy J, Woodward PK, Medero G, Banimahd M. Reducing railway track settlement using three-dimensional polyurethane polymer reinforcement of the ballast. Construction Building Mater (2013) 44:615–25. doi:10.1016/j.conbuildmat.2013.03.002
14. Tan H, Ding B, Chen J. Experimental test on water permeability and clogging characteristic of polymer cemented gravel porous material. J Waterway Harbor (2021) 42:775–82.
15. ASTM. ASTM D2434: standard test method for permeability of granular soils (constant head). West Conshohocken, Pennsylvania: ASTM International (2019). p. 3–5. Available from: https://standards.iteh.ai/catalog/standards/cen/50899458-622b-4b86-b3e9-bfa0755bc727/en-14427-2022. (Accessed November 18, 2023).
16. Indraratna B, Nguyen VT, Rujikiatkamjorn C. Hydraulic conductivity of saturated granular soils determined using a constriction-based technique. Can Geotechnical J (2012) 49:607–13. doi:10.1139/T2012-016
Keywords: permeability, polymer, clogging, granular material, constriction size
Citation: Tao X and Gao Z (2024) Permeability behaviour of polyurethane polymer-reinforced granular material with and without clogging. Front. Phys. 12:1514664. doi: 10.3389/fphy.2024.1514664
Received: 21 October 2024; Accepted: 26 November 2024;
Published: 12 December 2024.
Edited by:
Yifei Sun, Taiyuan University of Technology, ChinaCopyright © 2024 Tao and Gao. This is an open-access article distributed under the terms of the Creative Commons Attribution License (CC BY). The use, distribution or reproduction in other forums is permitted, provided the original author(s) and the copyright owner(s) are credited and that the original publication in this journal is cited, in accordance with accepted academic practice. No use, distribution or reproduction is permitted which does not comply with these terms.
*Correspondence: Xiaosan Tao, dHhzMzg4MEAxMjYuY29t
 Xiaosan Tao
 Zhibing Gao