- Key Laboratory of Fluid and Power Machinery (Xihua University), Ministry of Education, Chengdu, China
Under the influence of the characteristic behavior of the bubbles, the flow pattern in the multiphase pump suffers a serious deterioration and the pressurization performance is significantly reduced. In order to be more close to the engineering practice, the CFD-PBM (Computational Fluid Dynamics-Population Balance Model) coupling model is established and verified on the basis of considering the bubble coalescence and breakup behavior, revealing the bubble distribution characteristics in the pressurization unit, and studying the influence of speed on the internal flow characteristics of the multiphase pump. The results show that the volume fraction of large bubbles in the pressurization unit of the multiphase pump decreases significantly with increasing speed, and the bubble coalescence zone shrinks parallel to the blade profile along the flow direction. The volume fraction of small bubbles increases sharply with speed, and the bubble breakup zone covers almost the entire fluid domain at high speed conditions. The speed has a significantly greater influence on the distribution of the gas phase and the vortex structure in the diffuser domain than in the impeller domain. In the diffuser domain, a pair of mutually separate vortices are formed, and a large number of gas phases are sucked near the vortex center. With the increase of speed, the velocity slip in impeller domain is weakened, but in diffuser domain is intensified. The results of the study can accurately predict the performance variation of the multiphase pump and are important for their optimal design and engineering application.
1 Introduction
Energy serves as a fundamental basis and support for national prosperity and sustainable economic development, and it is being actively and efficiently harnessed in response to the continuous increase in human energy demand. As terrestrial resources become increasingly depleted, research indicates that marine resources possess significant potential; consequently, the exploration and transportation of offshore oil and gas are rapidly emerging as key areas of focus in scientific inquiry. In the transportation of complex mixtures comprising natural gas and impurities such as sand and gravel, multiphase pumps are extensively utilized in offshore oil fields due to their compact design, versatility under varying operating conditions, and resistance to wear [1]. In practical engineering applications, the intricate bubble flow conditions at the pump impeller inlet exhibit a range of dynamic characteristics. The multiphase flow is inevitably accompanied by phenomena such as gas-liquid separation, bubble coalescence, and breakup. When the gas volume fraction (GVF) is high, the air bubbles within the vane pump flow channel frequently collide with one another. This interaction, particularly involving larger bubbles, can lead to blockages in the flow channel or even result in pump air lock phenomena, causing the pump to operate idly [2–4].
This paper focuses on the axial multiphase pump as the subject of study due to its intricate structure and the variability of flow patterns within its passage, which complicates the exploration of flow mechanisms in a multiphase environment. Recent advancements in optics, laser technology, and computer science have led to significant refinements in flow field testing techniques by researchers both domestically and internationally, enabling the precise capture of complex flow patterns. [5, 6] were the first to employ visualization techniques to examine the gas-liquid flow state in a centrifugal pump. Their findings indicated that a small quantity of bubbles present at low gas volume fractions (GVF) exacerbated the non-uniformity of flow velocity, with the mainstream shifting towards the suction side of the blade. Furthermore, as GVF increased, a significant number of bubbles emerged within the pump and gradually evolved into elongated gas pockets accumulating at the impeller inlet. [7] found in his study that the gas pockets formed at very high GVF would lead to plug flow in the passage and defined specific values for the cross-sectional GVF at which bubble flow occurs in the impeller of a centrifugal pump, arguing that the path of motion of the bubbles is shifted along the flow direction from the suction side of the blade to the pressure side. [8] classified the gas-liquid two-phase flow pattern inside a centrifugal pump into four flow patterns: isolated bubble flow, bubble flow, gas pocket flow and gas-liquid separation flow by visualization techniques and found that the pump performance dropped sharply when the inlet GVF was higher than 6.2%. In order to enhance the uniformity of gas-liquid mixing and thus improve the flow pattern, [9] revealed the variation of gas-liquid two-phase flow pattern and bubble diameter at the inlet of the multiphase pump under different working conditions after setting up a homogenizer at the front of the multiphase pump. The results indicate that the incorporation of a homogenizer leads to a more uniform distribution of bubbles within the flow passage and significantly reduces bubble aggregation phenomena, thereby enhancing the delivery performance of the multiphase pump. [10] used high speed photography to obtain the trajectory of bubbles in a centrifugal pump and investigated the effect of parameters such as bubble diameter and liquid phase flow rate on the trajectory of the bubbles in combination with numerical calculations. The results indicate that the movement of bubbles within the impeller is hindered as both the diameter and rotational speed of the impeller increase; conversely, an enhancement in liquid flow rate facilitates bubble movement.
With the rapid development of computer resources and numerical calculation methods, CFD has been widely used in complex engineering and has become an important tool for studying the mechanism of multiphase flow in fluid machinery [11]. [12, 13] used computational fluid dynamics to study the vortex flow patterns and energy loss of a mixed-flow pump and systematically proposed an energy characteristic optimization method based on response surface models. [14, 15] first predicted the gas-liquid two-phase flow in a centrifugal impeller at low GVF conditions based on the bubble flow model, and then proposed a new bubble flow model at high GVF conditions assuming that the bubbles would coalescence with each other and attach to the impeller surface to form fixed cavities. [16, 17] used a two-fluid model to give a three-dimensional numerical calculation of an electric submersible pump and obtained the distribution characteristics of each phase of the medium inside the impeller, and found that the bubble diameter was the key to the simulation accuracy, and the accumulation of bubbles inside the impeller was the main reason for the deterioration of the pump performance. [18] explored the forces acting on bubbles in centrifugal pumps without considering the compressibility of the medium and found that the lift forces on the bubbles themselves and the interaction between the bubble population could not be ignored when the gas content was above 3%. Tremante et al. [19] proposed a modified multiphase flow model that is more applicable to low GVF, and conducted a numerical simulation study of a spiral axial flow pump, revealing the influence of the gas phase fraction on the force between the gas and liquid phases, and the existence of bubbles and stratified flow within the impeller was effectively confirmed. [20] and [21] studied the effect of bubble size on the flow of an electric submersible pump under two-phase flow conditions with numerical simulations as the main focus, supplemented by experimental validation, which provided assistance in the validation and improvement of new bubble analysis models.
As can be seen, the performance of rotating machinery in a gas-liquid environment is inextricably linked to the flow pattern in the flow passage, the dynamics of the bubbles, etc. The movement of the bubbles within the impeller and the morphological changes such as coalescence and breakup will directly lead to changes in the flow pattern within the pump, thus making the performance of the pump affected [22, 23]. To more accurately capture the flow field information of rotating machinery within a gas-liquid mixed transport environment and to comprehend the temporal variations of key parameters for each phase in the flow passage, a CFD-PBM model has been used that integrates the predictive capabilities of computational fluid dynamics (CFD) with the advantages of population balance modeling (PBM) for calculating discrete phase particle size distribution and variation, thereby aligning more closely with actual application systems. Initially, the model was mainly applied to equipment such as bubble towers and stirred kettles with relatively simple structures. [24] first established equilibrium equations for the particle size variation of solid particles in chemical processes, which clearly described the bubble size distribution and the bubble coalescence and breakup phenomena in the reactor. Subsequently, [25, 26] from Tsinghua University proposed a CFD-PBM model in a gas-liquid (slurry) reactors to quantify the bubble size distribution in different bubbling zones and modified the model after considering the forces between the gas and liquid phases. On this basis, [27] revealed the effects of viscosity and distributor on gas phase parameters such as bubble volume fraction, bubble size and gas-liquid phase velocity within the bubbling bed by developing and validating a new breakup model. After the maturity and widespread use of PBM within gas-liquid two-phase flows, scholars have extended them to rotating machines with their complex structures. [28] completed the first numerical simulation of a coupled CFD-PBM model within a split blade pump and compared it with the flow field under fixed size bubble conditions to verify the validity of the PBM model when simulating a centrifugal pump. [29] used CFD-PBM to numerically simulate the full flow passage of a gas-liquid two-phase centrifugal pump, and found that as the inlet GVF increased the bubbles gradually changed from a breakup trend to a coalescence trend, and the broken bubbles mostly gathered at the blade pressure surface and impeller outlet.
Throughout the previous exploration of the internal flow of the multiphase pump under gas-liquid two-phase flow conditions, it can be found that scholars at home and abroad have conducted systematic and in-depth research on the multiphase pump based on the fixed size of the bubble, little has been reported on bubble coalescence, breakup and bubble distribution. Due to the relatively complex structure of the impeller passage of the multiphase pump, the dynamics characteristics held by air bubbles at high rotational speeds cannot be ignored.
2 Mathematical model
2.1 Multiphase flow model
On the premise that the calculation accuracy can be guaranteed, the Eulerian-Eulerian two-fluid model is adopted in this paper after considering the phase velocity slip and the phase force. The model can better reflect the phase distribution and the internal flow characteristics of the mixed-transport pump in the gas-liquid two-phase system. The flow process complies with the conservation of mass and momentum, and its governing equations are as follows: Equations 1–4.
Where, m represents the mass of the phase; ρ represents the density of the phase;
Where, The corner scales q and p stand for phase q and phase p;
2.2 Population balance model
The PBM is an effective method for accurately predicting the size and distribution of bubbles in the flow field of a multiphase pump by showing how the size and distribution characteristics of the discrete phases in a gas-liquid two-phase flow system vary from time to time. In a gas-liquid two-phase system, the expressions are: Equation 10.
In Equation 7,
2.3 Bubble breakup model
In this paper, the bubble breakup behavior was simplified, and it was reasonably assumed that the bubble only broke into two bubbles, and the breakup model of [30] is adopted. In this model, when the energy of the collision between bubbles and turbulent vortices meets a certain relation, bubbles will be broken. The specific expression is as follows: Equations 11–15.
Where,
The probability of bubble
The final form of the probability of any bubble
2.4 Bubble coalescence model
In this paper, the coalescence model of Luo is adopted, and the coalescence probability is the product of the collision frequency and efficiency between bubbles [31]. The specific expression is as follows: Equations 18–23.
Where,
3 Numerical method
3.1 Computing domain model
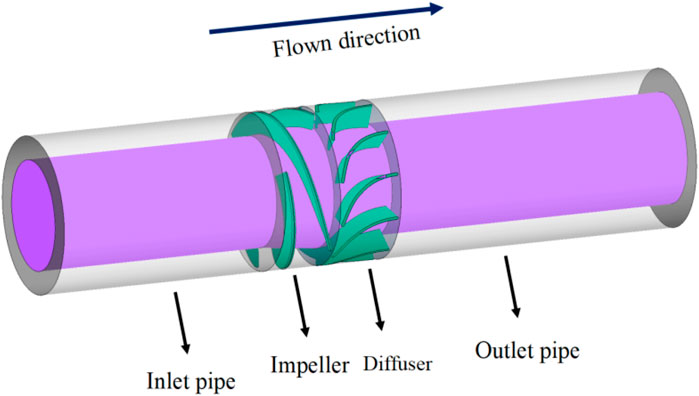
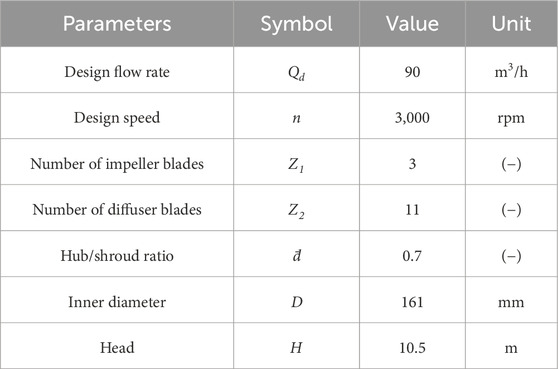
In this paper, the pressurization unit of the multiphase pump is taken as the research object, and the UG software is used to conduct three-dimensional modeling of the calculation domain [32]. The whole calculation domain consists of four parts: the inlet pipe, the impeller, the diffuser and the outlet pipe. In order to ensure the full development of flow in the inlet and outlet section, the inlet of the impeller and the outlet of the diffuser are extended appropriately, as shown in Figure 1.
3.2 Mesh division
The entire calculation domain is meshed using hexahedral structural meshing techniques. The impeller and guide vane are meshed by TurboGrid software and the inlet and outlet pipes are meshed by ICEM CFD software. Considering the fine structure of the tip clearance and extremely complex flow conditions, the mesh in the radial direction of the tip clearance computational domain is refined. The final mesh division can ensure that the y + value meets the requirements of the turbulence model and accurately analyzes the flow characteristics in the multiphase pump. The specific mesh is shown in Figure 2.
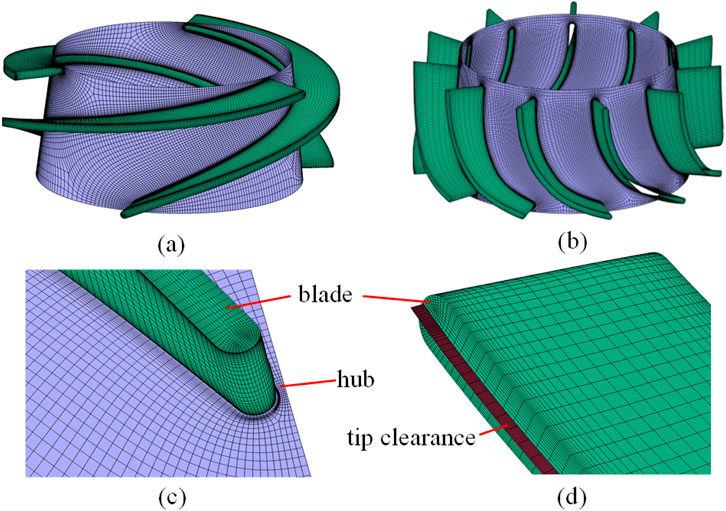
Figure 2. Computational domain meshes (A) impeller, (B) diffuser, (C) blade face, (D) tip clearance).
The number of meshes is one of the most important factors affecting the accuracy of numerical simulations, and a reasonable number of meshes is beneficial to the improvement of computational efficiency. In order to eliminate the interference of the number of meshes on the simulation results, this paper took five groups of meshes under the pure water environment to verify the irrelevance, the detailed calculation results are shown in Table 1. In Table 1, H represents the head of the pump, and η represents the efficiency of the pump. It can be seen from Table 1 that the head and efficiency of the multiphase pump gradually become stable with the increase of the number of meshes. When the mesh number is larger than the fourth group, the pump head and efficiency change values are small enough to ignore the influence of the mesh number on the calculation. Therefore, considering the calculation resources and calculation accuracy comprehensively, the final mesh number of the calculation domain is 4,606,377.
3.3 CFD-PBM coupling numerical calculation method
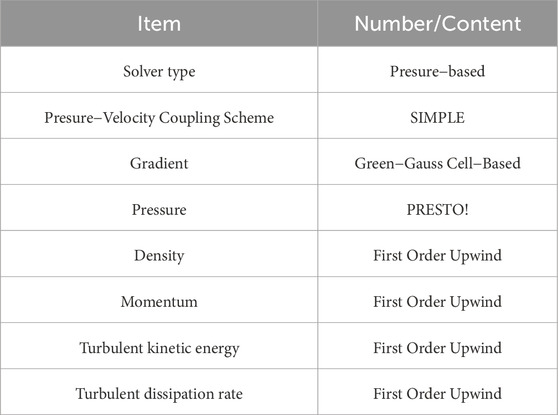
In this paper, coupled CFD-PBM calculations are carried out on a hybrid pump with different speed conditions based on FLUENT software, using boundary conditions of velocity inlet and pressure outlet, in order to perform steady, transient and PBM coupled calculations. The Realizable k-ε model introduces rotation and curvature related contents into turbulent viscosity, and links turbulent viscosity with strain rate [33]. Compared with the Standard k-ε model and the RNG k-ε model, it can simulate rotational flow, strong shear flow and separated flow. So the Realizable k-ε model was chosen for numerical simulations in the more complex flow state of the multiphase pump, considering the applicability of the turbulence model and the calculation time. The model is integrated with an angular deformation correction for the vortex viscosity coefficient, which can be better applied to rotating flow fields. Firstly, the Eulerian-Eulerian two-fluid model for two-phase flow is selected for the steady calculation and the kinematic reference system is chosen for the rotating fluid domain. Subsequently, the rotating fluid domain was changed to a dynamic grid for the transient calculation, setting the time step to 0.000111 s. The discretization method and relaxation factors in this paper are shown in Table 2. In order to investigate the coalescence and breakup behavior of bubbles in the pressurization unit of the multiphase pump, ten discrete sets of bubble sizes are defined in this paper, with the specific size ranges shown in Table 3.
4 Validation of the numerical simulation method
4.1 Experimental model
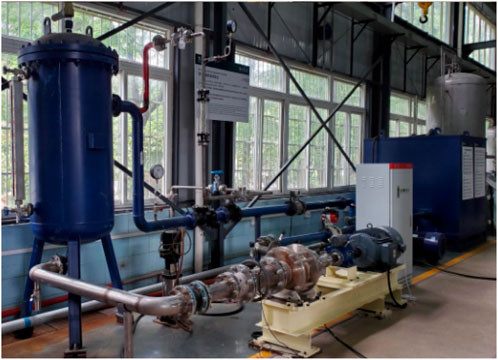
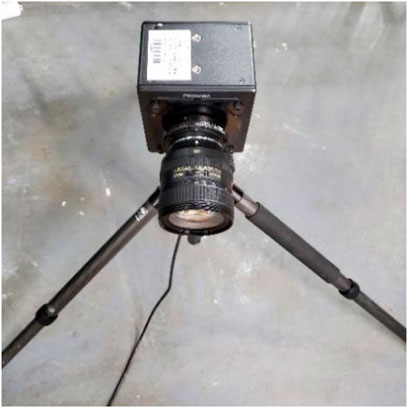
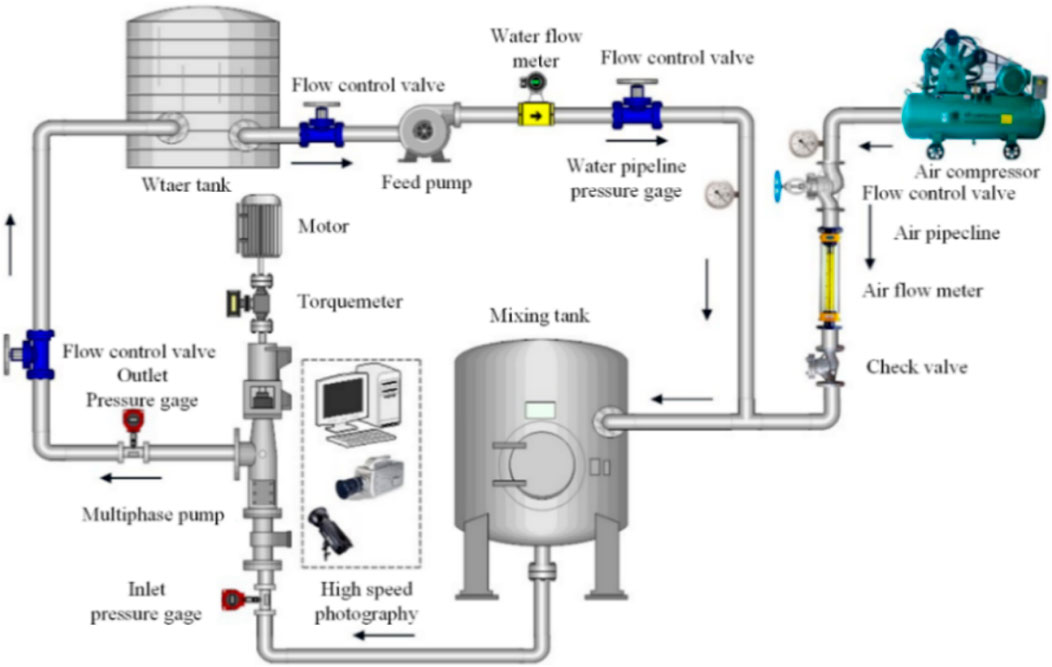
In this study, the shape of the pump body was designed as a transparent Plexiglas material with a square exterior and a round interior, and the inlet pipe of the multiphase pump was designed as a transparent pipe to facilitate the observation of the flow effect (as shown in Figure 3). After starting the oil and gas multiphase pump to adjust the gas-liquid flow rate to stabilize the two phases, high-speed photography was used and a special light source was designed to supplement the light (as shown in Figure 4). The main performance indicators of the test instrumentation are shown in Table 4 and the schematic diagram of the multiphase pump test system is detailed in Figure 5.
4.2 Experimental validation
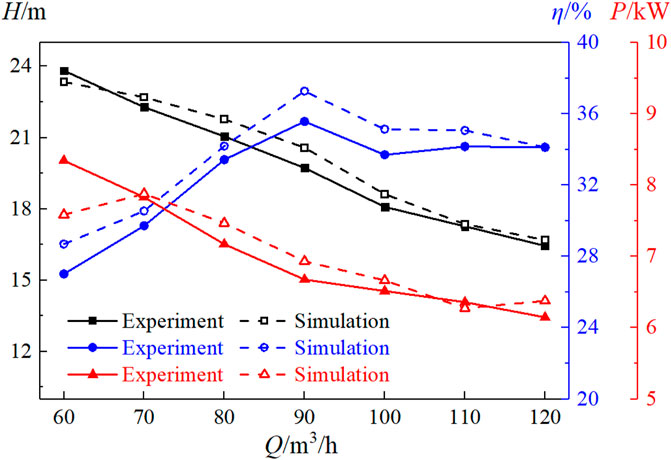
In order to ensure the accuracy of the numerical calculation method and to clearly capture the flow pattern in the pump, this paper has conducted a single-phase and two-phase experimental study of a multiphase pump in turn. Firstly, a transport pump with a tip clearance of 1.0 mm was tested at a speed of 3,000 rpm using pure water as the medium, and the test values of pump head and efficiency were collected on site and combined with the corresponding values obtained from numerical simulations to plot the external characteristics curve of the multiphase pump, as shown in Figure 6. H and η in Figure 6 represent the pump head and efficiency, respectively, and P represents the shaft power of the pump. As can be seen from Figure 6, the error between the test and simulation does not exceed 5% over the range of flow rates tested. This is due to the energy loss during the testing process which inevitably causes the tested values to be smaller than the simulated values, so the numerical calculation method can be considered as an accurate prediction of the energy characteristics of the multiphase pump. Subsequently, the flow pattern of the multiphase pump was tested under gas-liquid two-phase conditions using a mixture of gas and water as the medium.
Figure 7 shows the comparative analysis of the bubble number density (N) of CFD-PBM numerical simulation results and experimental results under different inlet gas volume fractions (IGVF). As illustrated in Figure 7, the simulation results obtained from the coupled CFD-PBM model exhibit a high degree of correlation with the experimental data, with the lift error remaining below 7.5% across all three sets of tested and calculated values. The position of high bubble number in the flow channel of the mixed transport pump in Figure 7 is basically consistent with the photos taken in the test. It can be seen that the numerical calculation method used in this paper is highly reliable. In subsequent studies, the research was conducted at a gas fraction of 9% for the inlet gas.
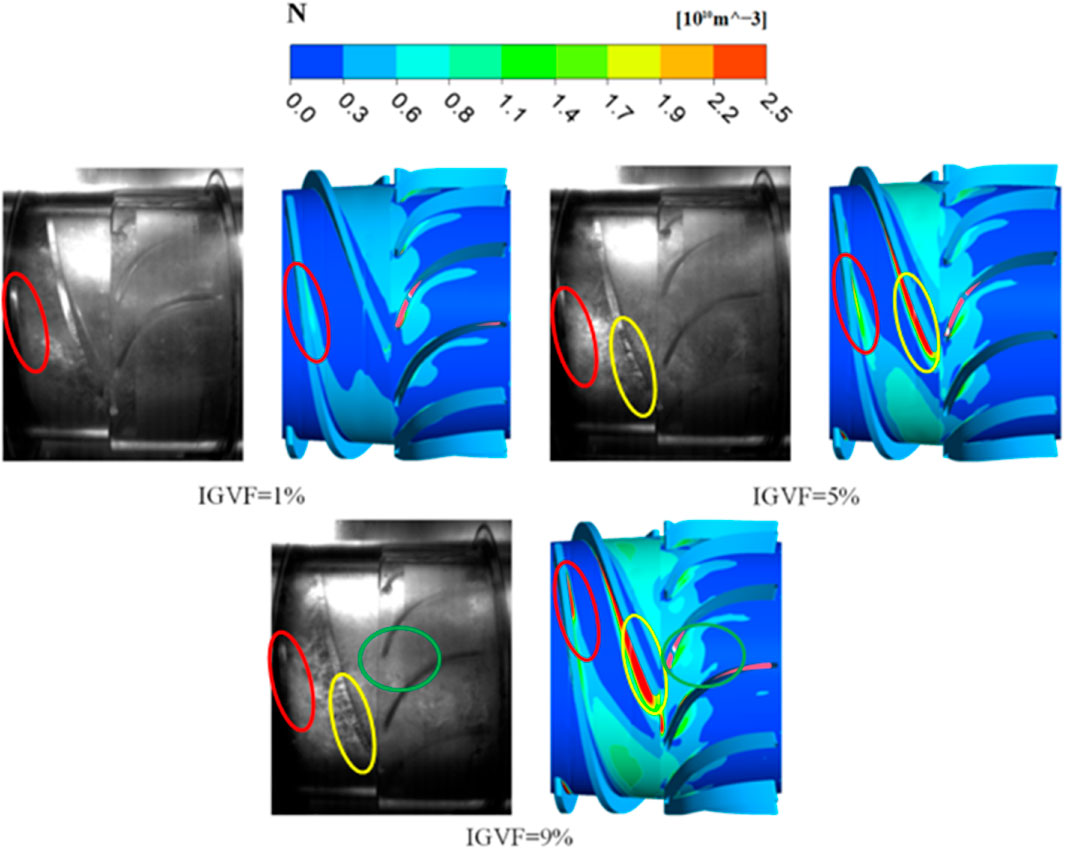
Figure 7. Numerical simulation results of CFD-PBM under different inlet gas volume fractions compared with the experimental bubble number density analysis.
5 Analysis of results
5.1 Effect of speed on bubble distribution
In order to investigate the formation mechanism of the gas-liquid distribution, it is important to understand the distribution characteristics of the bubbles in the multiphase pump. The medium size Bin4 (1.2916 mm) in the discrete bubble has been set as the inlet bubble in the calculations before the flow characteristics of the multiphase pump are analyzed, and the bubble size distribution in the multiphase pump can be easily obtained based on the coupled CFD-PBM model. For the purpose of the following analysis, the following ten groups of bubbles are divided into three categories of bubbles: large, medium and small. Four groups of bubbles from Bin0 to Bin3 are large bubbles, three groups of bubbles from Bin4 to Bin6 are medium bubbles and three groups of bubbles from Bin7 to Bin9 are small bubbles. Figure 8 shows the bubble distribution within the pressurization unit of the multiphase pump for different speed conditions. As can be seen in Figure 8, the bubble distribution in the impeller and blade domains show a similar trend throughout the pressurization unit. The volume fraction of large bubbles larger than Bin4 in the pressurization unit of the mixing pump decreases with increasing speed, while the volume fraction of small and medium bubbles in the group smaller than Bin4 is positively correlated with speed. It can also be found that the distribution pattern of the volume fraction of large bubbles is highly consistent throughout the pressurization unit. In the blade domain, however, the large number of vortices formed due to the special structure makes the tendency of bubble breakup significantly stronger, and the bubble percentage in the Bin5 to Bin7 groups is significantly more than in the impeller domain, but the bubble content in the Bin8 to Bin9 groups is significantly lower than in the impeller domain. This further demonstrates the inconsistent tendency for bubbles to be broken by different external influences, with the shearing effect of the blades in the pressurization unit being significantly stronger than the effect of the vortices generated in the diffuser on bubble breakup.
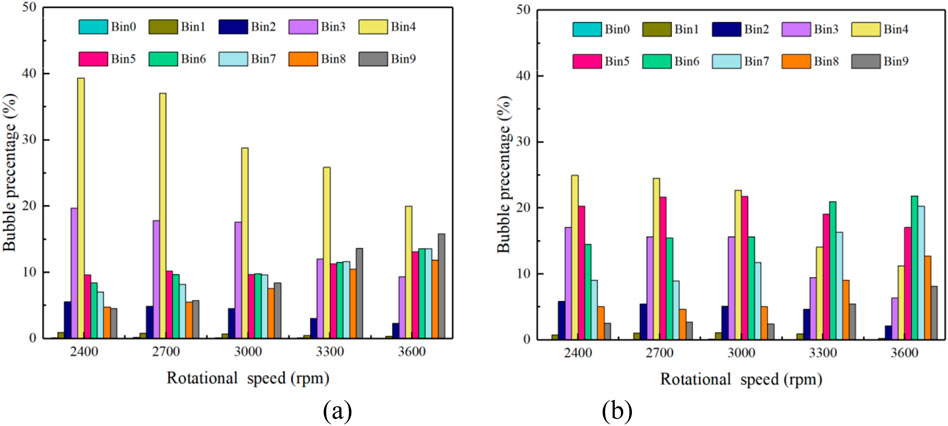
Figure 8. Distribution of bubbles in the pressurization unit of the multiphase pump at different speed conditions. (A)Impeller, (B)Diffuser.
5.2 Effect of speed on the coalescence and breakup behavior of bubbles
To further reveal the effect of speed on the coalescence and breakup behavior of bubbles in the flow passage, this paper uses an equivalent surface in which the average bubble size is greater than or equal to the size of the impeller inlet bubble to represent the coalescence zone of bubbles in the flow passage, and vice versa to represent the bubble breakup zone. Figure 9 shows the distribution of bubble coalescence and breakup at the 0.5 blade height in the pressurization unit of the multiphase pump. Among them, the larger the average bubble size in the coalescence zone and the smaller the size in the breakup zone, the greater the degree of coalescence and breakup. From Figure 9, it is easy to find that the large bubbles in the coalescence zone are mainly located on the suction side of the impeller blade and the pressure side of the diffuser blade, and the small bubbles in the crushing area mainly cover the pressure side of the impeller blade and the suction side of the guide blade. This may be due to the fact that the large bubbles have a larger gas phase content and are mainly adsorbed on the low pressure side of the blade by the pressure gradient within the impeller, while the small bubbles are subjected to a combination of forces within the pressurization unit that cause their trajectory and distribution characteristics to change. In addition, as can be seen in Figure 9A, the increase in speed significantly inhibits the coalescence behavior of the bubbles and the domain of coalescence is significantly reduced. Specifically, the bubble coalescence zone in the impeller domain decreases along the axial direction parallel to the blade profile with the increase of rotational speed, and the degree of bubble coalescence weakens accordingly. The bubble coalescence zone in the diffuser domain is reduced along the axial direction, and the bubble coalescence degree reaches the strongest in the design condition, and the bubble coalescence behavior almost does not occur in the high speed condition. As can be seen from Figure 9B, the bubble breakup zone is just complementary to the coalescence zone, and the law is opposite. Under low speed conditions, fewer bubbles undergo breakup behavior, less shearing by the blades and only sporadic crushing behavior occurs near the blade surface. As the speed increases, the shearing effect intensifies sharply, the turbulence in the flow field increases in intensity, the shear stress on the bubbles increases and most of the area within the domain of the pressurization unit is filled with broken bubbles.
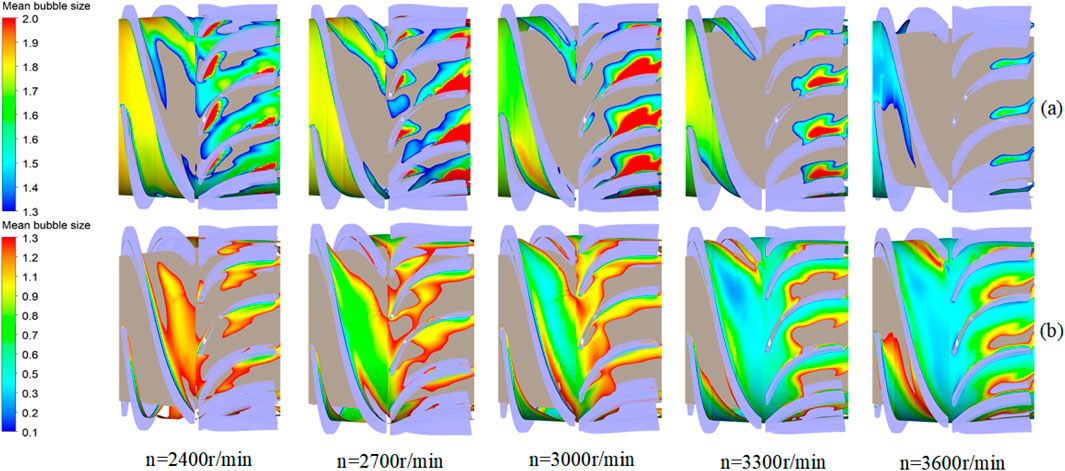
Figure 9. Distribution of bubble coalescence and breakup zones in the pressurization unit of the multiphase pump at different speeds. (A) Bubble coalescence zone, (B) bubble breakup zone.
5.3 Effect of speed on gas phase distribution and vortex structure
Figure 10 shows the distribution of the gas phase and flow lines in the pressurization unit of the multiphase pump under different speed conditions, for the purpose of later discussion the vortices at the leading and trailing edges of the diffuser are noted as vortex A and B, and have been marked with red and orange wireframes respectively. As can be seen in Figure 10, the distribution of the gas phase in the impeller domain passage is generally similar at all operating conditions and the flow patterns are good. The gas phases are all gathered on the suction side of the blade by the pressure gradient and some of the small vortices, and the increase in speed results in a more gentle increase in the degree of gather. In contrast, the gas phase distribution and flow state in the diffuser show obvious change rules under the change of speed. It is not difficult to find that vortex A gradually weakens with the increase of speed, the gas phase it enrolls decreases correspondingly, and vortex B and vortex A show exactly opposite change rules. This is because under the condition of low speed, the fluid at the outlet of the impeller diverts towards the pressure surface and suction surface of the diffuser, and the diverting liquid mixes with each other to form vortex A. Because of its special structure, the guide vane forms a vortex B at the tail of the guide vane to provide a velocity circulation. And the increase in speed makes the impeller outlet liquid flow angle change, impeller outlet at the diffuser pressure surface diversion phenomenon weakened, vortex A gradually disappeared, vortex B gradually enhanced. That is to say, the vortex A, B is a pair of mutually separate vortex, inevitably show the opposite law of change.
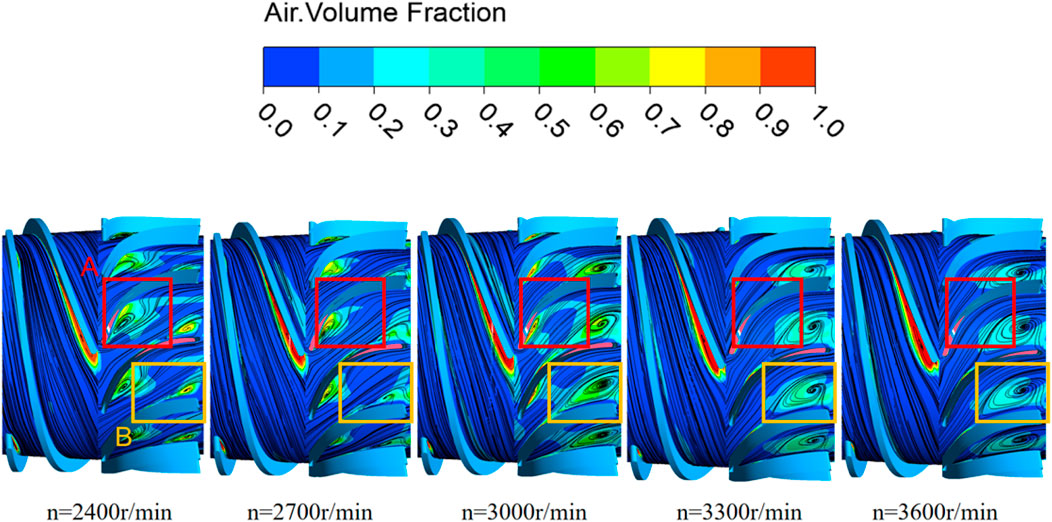
Figure 10. Gas phase and streamline distribution in the pressurization unit of the multiphase pump under different speed conditions.
5.4 Influence of speed on gas-liquid velocity difference and pressure distribution
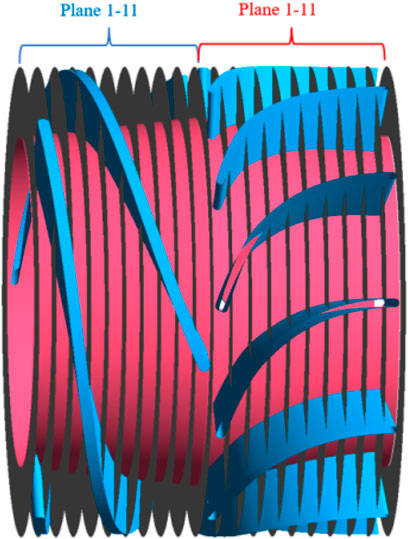
In order to further explore the internal flow law of the multiphase pump, the impeller and diffuser in the pressurization unit are evenly divided into 11 planes along the axial direction from the inlet, among which plane 1 is the inlet surface and plane 11 is the outlet surface, as shown in Figure 11.
In order to quantitatively analysis the distribution of flow characteristics in the axial direction in the pressurization unit of the multiphase pump, the characteristic parameters in the different planes classified above are analyzed. Figure 12 shows the difference in gas-liquid velocity slip (gas phase velocity minus liquid phase velocity) and the pressure distribution along the axial direction in the booster unit of the multiphase pump at different speed at the inlet gas volume fraction of 9%. As can be seen in Figure 12, the effect of speed on the gas-liquid velocity difference within the pressurization unit of the multiphase pump is not consistent in the impeller and diffuser domains. The gas phase velocity is significantly greater than the liquid phase velocity at the impeller inlet and dynamic-static interface, while the gas phase velocity is less than the liquid phase velocity at the remaining axial positions. The increase in impeller speed results in the generation of more small bubbles in the impeller domain to promote the homogeneity of the gas-liquid mixing, the amplitude of the gas-liquid velocity difference curve is significantly reduced and the velocity slip phenomenon is correspondingly weakened. The velocity difference between gas and liquid in the diffuser is mainly influenced by the vortex in the flow passage. The increase in speed accelerates the formation of vortex inside the diffuser, and the vortex center attracts a large number of bubbles to intensify the phenomenon that makes the two phases of gas and liquid separate. It can also be seen in Figure 12 that the speed has a significantly greater effect on the pressure distribution in the impeller, the core work component of the multiphase pump, than in the diffuser domain, and that an increase in speed significantly increases the pressure pressurization performance of the multiphase pump. The diffuser, as a rectification component, is minimally affected by the speed of rotation, except for the obvious pressure fluctuations that occur at the dynamic-static interface.
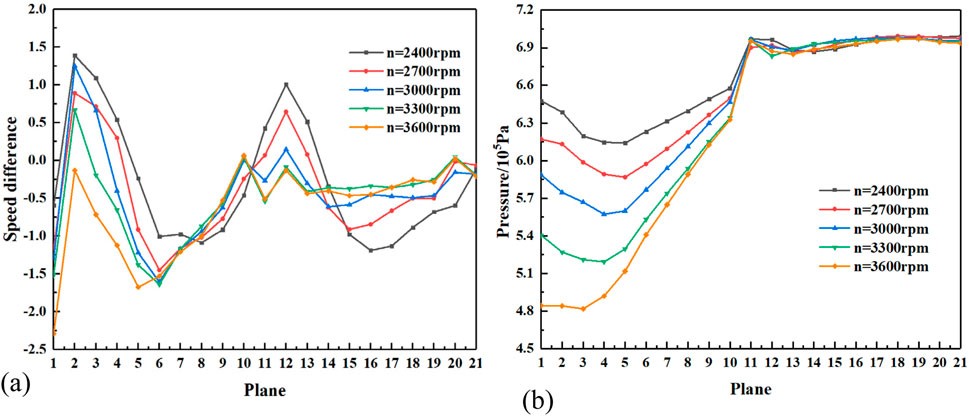
Figure 12. Axial gas-liquid velocity slip difference and pressure distribution in the pressurization unit of the multiphase pump at different speeds. (A) Gas-liquid velocity difference, (B) pressure distribution.
6 Conclusion
In order to grasp the internal flow law and prediction performance of the multiphase pump more accurately, the parameters of the flow field in the pump were solved based on the CFD-PBM coupling model. By analyzing the laws of bubble distribution, gas phase distribution, vortex structure and gas-liquid velocity difference in the pressurization unit of the multiphase pump, the influence of speed on the internal flow characteristics of the multiphase pump was revealed. The main conclusions are as follows:
(1) The volume fraction of large air bubbles in the pressurization unit of the multiphase pump decreases significantly with speed, while the opposite is true for small bubbles. At high speed, bubbles are more likely to break due to blade shear, and the effect of shear on bubble breaking behavior is obviously stronger than that of vortex entrainment.
(2) The bubble coalescence zone in the pressurization unit of the multiphase pump covers the impeller suction surface and diffuser pressure surface, and the law of the breakup zone is opposite to the coalescing zone. Bubble coalescing occurs in a large area of the pump under low speed conditions, and only a few crushing behaviors occur near the surface of the blade. With the increase of rotational speed, the bubble coalescence zone will shrink along the axial direction parallel to the blade profile, and the bubble breakup zone will almost cover the whole domain.
(3) The influence of speed in the pressurization unit of the multiphase pump on the gas phase distribution and vortex structure in the diffuser domain is significantly greater than that in the impeller domain, and the impeller domain has fewer vortices and less gas phase gather. Under the influence of the speed of the flow passage in the diffuser domain, A and B mutually separate vortices are formed at the leading edge and trailing edge of the diffuser. The gas phase is attracted by the vortex and gathers near the vortex center in a large range, and the speed promotes the formation of vortex B.
(4) The increase of speed in the impeller domain promotes the uniformity of gas-liquid mixing and weakens the velocity slip. Under the influence of the structure of diffuser, the speed accelerates the formation of the vortex, which intensifies the velocity slip. The influence of speed on the pressure distribution is mainly reflected in the impeller domain. The increase of speed obviously increases the pressurization performance of the multiphase pump.
Data availability statement
The original contributions presented in the study are included in the article/supplementary material, further inquiries can be directed to the corresponding authors.
Author contributions
XG: Conceptualization, Methodology, Software, Validation, Visualization, Writing–original draft, Writing–review and editing. SHI Guangtai: Conceptualization, Data curation, Formal Analysis, Funding acquisition, Investigation, Project administration, Visualization, Writing–review and editing. HC: Conceptualization, Resources, Supervision, Validation, Writing–review and editing. WL: Formal Analysis, Methodology, Resources, Software, Writing–review and editing. JF: Data curation, Funding acquisition, Investigation, Software, Supervision, Validation, Writing–review and editing.
Funding
The author(s) declare that financial support was received for the research, authorship, and/or publication of this article. This work was supported by the Sichuan Natural Science Foundation Outstanding Youth Science Foundation (2024NSFJQ0012), the Key project of Regional Innovation and Development Joint Fund of National Natural Science Foundation (U23A20669) and the Sichuan Science and Technology Program (2022ZDZX0041).
Conflict of interest
The authors declare that the research was conducted in the absence of any commercial or financial relationships that could be construed as a potential conflict of interest.
Publisher’s note
All claims expressed in this article are solely those of the authors and do not necessarily represent those of their affiliated organizations, or those of the publisher, the editors and the reviewers. Any product that may be evaluated in this article, or claim that may be made by its manufacturer, is not guaranteed or endorsed by the publisher.
References
1. Serena A, Bakken LE. Design of a multiphase pump test laboratory allowing to perform flow visualization and instability analysis. In: POWER 2015 (ASME 2015 power conference) (2015). doi:10.1115/POWER2015-49769
2. Lea JF, Bearden JL. Effect of gaseous fluids on submersible pump performance. J Pet Tech (1982) 34:2922–30. doi:10.2118/9218-PA
3. Schäfer T, Bieberle A, Neumann M, Hampel U. Application of gamma-ray computed tomography for the analysis of gas holdup distributions in centrifugal pumps. Flow Meas Instrumentation (2015) 46:262–7. doi:10.1016/j.flowmeasinst.2015.06.001
4. Tao S, Shi G, Xiao Y, Huang Z, Wen H. Effect of operating parameters on the coalescence and breakup of bubbles in a multiphase pump based on a CFD-PBM coupled model. J Mar Sci Eng (2022) 10:1693. doi:10.3390/jmse10111693
5. Murakami M, Minemura K. Effects of entrained air on the performance of a centrifugal pump: 1st report, performance and flow conditions. Bull JSME (1974) 17:1047–55. doi:10.1299/jsme1958.17.1047
6. Murakami M, Minemura K. Effects of entrained air on the performance of centrifugal pumps: 2nd report, effects of number of blades. Bull JSME (1974) 17:1286–95. doi:10.1299/jsme1958.17.1286
7. Sekoguchi K, Takada S, Kanemori Y. Study of air-water two-phase centrifugal pump by means of electric resistivity probe technique for void fraction measurement: 1st report, measurement of void fraction distribution in a radial flow impeller. Bull JSME (1984) 27:931–8. doi:10.1299/jsme1958.27.931
8. Shao C, Li C, Zhou J. Experimental investigation of flow patterns and external performance of a centrifugal pump that transports gas-liquid two-phase mixtures. Int J Heat Fluid Flow (2018) 71:460–9. doi:10.1016/j.ijheatfluidflow.2018.05.011
9. Zhang J, Cai S, Li Y, Zhu H, Zhang Y. Visualization study of gas–liquid two-phase flow patterns inside a three-stage rotodynamic multiphase pump. Exp Therm Fluid Sci (2016) 70:125–38. doi:10.1016/j.expthermflusci.2015.08.013
10. Stel H, Ofuchi EM, Sabino RHG, Ancajima FC, Bertoldi D, Marcelino Neto MA, et al. Investigation of the motion of bubbles in a centrifugal pump impeller. J Fluids Eng (2018) 141. doi:10.1115/1.4041230
11. Shah SR, Jain SV, Patel RN, Lakhera VJ. CFD for centrifugal pumps: a review of the state-of-the-art. Proced Eng (2013) 51:715–20. doi:10.1016/j.proeng.2013.01.102
12. Li W, Long Y, Ji L, Li H, Li S, Chen Y, et al. Effect of circumferential spokes on the rotating stall flow field of mixed-flow pump. Energy (2024) 290:130260. doi:10.1016/j.energy.2024.130260
13. Li W, Yang Q, Yang Y, Ji L, Shi W, Agarwal R. Optimization of pump transient energy characteristics based on response surface optimization model and computational fluid dynamics. Appl Energ (2024) 362:123038. doi:10.1016/j.apenergy.2024.123038
14. Minemura K, Uchiyama T. Three-dimensional calculation of air-water two-phase flow in centrifugal pump impeller based on a bubbly flow model. J Fluids Eng (1993) 115:766–71. doi:10.1115/1.2910210
15. Kiyoshi M, Uchiyama T. Three dimension calculation of air water two-phase flow in centrifugal pump impeller based on a bubbly flow model with fixed cavity. JSME Intenral J Ser B (1994) 37:726–35.
16. Caridad J, Kenyery F. CFD analysis of electric submersible pumps (ESP) handling two-phase mixtures. J Energ Resour Tech (2004) 126:99–104. doi:10.1115/1.1725156
17. Caridad J, Asuaje M, Kenyery F, Tremante A, Aguillón O. Characterization of a centrifugal pump impeller under two-phase flow conditions. J Pet Sci Eng (2008) 63:18–22. doi:10.1016/j.petrol.2008.06.005
18. Müller T, Limbach P, Skoda R. Numerical 3D RANS simulation of gas-liquid flow in a centrifugal pump with an Euler-Euler two-phase model and a dispersed phase distribution. In: 11 th European conference on turbomachinery fluid dynamics and thermodynamics European turbomachinery society (2015).
19. Tremante A, Moreno N, Rey R, Noguera R. Numerical turbulent simulation of the two-phase flow (liquid/gas) through a cascade of an axial pump. J Fluids Eng (2002) 124:371–6. doi:10.1115/1.1471533
20. Zhu J, Guo X, Liang F, Zhang H-Q. Experimental study and mechanistic modeling of pressure surging in electrical submersible pump. J Nat Gas Sci Eng (2017) 45:625–36. doi:10.1016/j.jngse.2017.06.027
21. Barrios L, Prado MG, Kenyery F. CFD modeling inside an electrical submersible pump in two-phase flow condition. FEDSM (2009) 1:457–69. doi:10.1115/FEDSM2009-78492
22. Barrios L. Visualization and modeling of multiphase performance inside an electrical submersible pump. ProQuest: The University of Tulsa (2007).
23. Barrios L, Prado MG. Experimental visualization of two-phase flow inside an electrical submersible pump stage. J Energ Resour Tech (2011) 133. doi:10.1115/1.4004966
24. Hulburt HM, Katz S. Some problems in particle technology: a statistical mechanical formulation. Chem Eng Sci (1964) 19:555–74. doi:10.1016/0009-2509(64)85047-8
25. Wang T, Wang J, Jin Y. Experimental study and CFD simulation of hydrodynamic behaviours in an external loop airlift slurry reactor. Can J Chem Eng (2004) 82:1183–90. doi:10.1002/cjce.5450820605
26. Wang T, Wang J, Jin Y. A CFD–PBM coupled model for gas–liquid flows. AIChE J (2006) 52:125–40. doi:10.1002/aic.10611
27. Xing C. Experimental study of bubble bed reactor and numerical simulation of CFD-PBM coupling model. Beijing China: Tsinghua University (2014).
28. Chen Y, Patil A, Chen Y, Bai C, Wang Y, Morrison G. Numerical study on the first stage head degradation in an electrical submersible pump with population balance model. J Energ Resour Tech (2018) 141. doi:10.1115/1.4041408
29. Yan S, Sun S, Luo X, Chen S, Li C, Feng J. Numerical investigation on bubble distribution of a multistage centrifugal pump based on a population balance model. Energies (2020) 13:908. doi:10.3390/en13040908
30. Luo H. Coalescence, breakup and liquid circulation in bubble column reactors. Trondheim: The University of Trondheim (1995).
31. Luo H, Svendsen HF. Theoretical model for drop and bubble breakup in turbulent dispersions. AIChE J (1996) 42:1225–33. doi:10.1002/aic.690420505
32. Shu Z, Shi G, Tao S, Tang W, Li C. Three-dimensional spatial-temporal evolution and dynamics of the tip leakage vortex in an oil–gas multiphase pump. Phys Fluids (2021) 33:113320. doi:10.1063/5.0073634
Keywords: multiphase pump, CFD-PBM coupling model, bubble distribution, speed, internal flow characteristic
Citation: Guo X, Shi G, Chai H, Lv W and Fu J (2024) Influence of speed on the internal flow characteristics of a multiphase pump based on a coupled CFD-PBM model. Front. Phys. 12:1498648. doi: 10.3389/fphy.2024.1498648
Received: 19 September 2024; Accepted: 18 November 2024;
Published: 04 December 2024.
Edited by:
Francisco Vega Reyes, University of Extremadura, SpainReviewed by:
Shuihua Zheng, Zhejiang University of Technology, ChinaMichael Booty, New Jersey Institute of Technology, United States
Wei Li, Jiangsu University, China
Copyright © 2024 Guo, Shi, Chai, Lv and Fu. This is an open-access article distributed under the terms of the Creative Commons Attribution License (CC BY). The use, distribution or reproduction in other forums is permitted, provided the original author(s) and the copyright owner(s) are credited and that the original publication in this journal is cited, in accordance with accepted academic practice. No use, distribution or reproduction is permitted which does not comply with these terms.
*Correspondence: Guangtai Shi, MTU4ODQ5ODU3MTJAMTYzLmNvbQ==
 Xin Guo
 Guangtai Shi
 Hongqiang Chai