- 1Consorzio RFX (Consiglio Nazionale delle Ricerche, ENEA, Istituto Nazionale di Fisica Nucleare, Università di Padova, Acciaierie Venete SpA), Padova, Italy
- 2CRF – University of Padova, Padova, Italy
- 3Istituto per la Scienza e la Tecnologia dei Plasmi, CNR, Padova, Italy
- 4Università degli Studi di Milano-Bicocca, Milano, Italy
- 5Istituto per la Scienza e Tecnologia dei Plasmi, Consiglio Nazionale delle Ricerche, Milano, Italy
- 6ENEA, C.R. Frascati, Rome, Italy
Introduction: In this work, we aim to explore numerically the behavior of beam energetic particles in the Divertor Tokamak Test (DTT), a superconductive device equipped with a Neutral Beam Injection (NBI) system capable of injecting neutrals up to 510 keV.
Method: We explore beam ionization and beam slowing down for different DTT plasma scenarios. Numerical simulations are performed using the ASCOT suite of codes, including a wide-range scan of plasma density and beam injection energy. For different plasma conditions, we estimate shine-through losses, including the heat fluxes on the first wall thanks to dedicated particle tracing simulations. Orbits of newly-born fast ions are characterized by means of the constant of motion phase space, showing how trapped energetic particles’ population and prompt losses change with plasma density and NBI energy.
Results and discussion: Slowing down simulations show that NBI injection at 510 keV is well coupled to DTT plasmas. DTT NBI will be one of the sources of auxiliary ion heating, with an absorbed power ratio of up to ∼50% depending on plasma and beam parameters. At low plasma densities, energetic particle confinement is less efficient, and NBI power and/or energy reduction is expected.
1 Introduction
The Divertor Tokamak Test (DTT) facility is a superconductive device (R0 = 2.19 m, a = 0.7 m, B0 ≤ 6 T, Ip ≤ 5.5 MA) proposed to support ITER operations and DEMO design [1–3]. DTT aims to investigate solutions to the power exhaust problem in future fusion power plants, with adimensional plasma parameters relevant to ITER and DEMO. To obtain reactor-relevant plasmas, DTT will be equipped with three different auxiliary heating systems [4] capable of providing up to 45 MW of power to the plasma. Among these, a high energy, high power (≤510 keV, ≤10 MW) Neutral Beam Injection (NBI) is included [5]. High-density plasmas, such as DTT ones, require a high-energy beam to reach the plasma core. The NBI auxiliary system aims to heat the plasma to fusion relevant temperatures and provide current and torque to the plasma. The design of DTT NBI is still ongoing and modelling studies on DTT beam-plasma interaction are essential to support it and to investigate an efficient application of NBI in future DTT plasmas. The present work numerically explores all the steps of an ideal neutral beam path in DTT plasmas, from neutrals injection and ionization to beam Energetic Particle (EP) slowing down and losses. We present a first estimate of the NBI footprint on machine Plasma-Facing Components (PFCs) due to shine-through losses (i.e., beam neutral particles not ionized in the plasma that reach the opposite machine sector). Shine-through losses can exceed PCFs power load limits, leading to a restriction of the NBI operability in DTT. Therefore power density load quantification is of primary importance for the DTT design and scenario optimization. The impact of parameters such as beam particle energy and plasma kinetic profiles is discussed, since they strongly affect the beam-plasma coupling and the resulting NBI sources in DTT plasmas. We investigate for the first time NBI in low-density, low-current/magnetic field scenarios and update DTT reference scenario results. A first complete characterization of newly born beam-fast ions through the Constant of Motion (CoM) phase space is presented. We study how different plasma and neutral beam parameters affect the initial particle orbits, that are shown with a CoM analysis to relate with fast ion losses. The results presented are supported by state-of-the-art numerical simulations, performed in the so-called “stand-alone” mode, i.e., acting on a “frozen” plasma that is not modified by the simulated beam itself. The present paper is organized as follows. Section 2 describes the input of the analysis work performed, i.e., the selected plasma scenarios, the DTT NBI system and the First Wall (FW) of DTT, i.e., the boundary of our simulations. The structure of the paper is then organized to follow the path of beam energetic particles: ionization, first orbits in the plasma, Coulomb collisions and possible loss channels. Section 3 starts with the analysis of beam ionization and shine-through losses calculated with the BBNBI Monte Carlo code [6]. A heuristic formula is obtained to estimate NBI shine-through from plasma density and NBI energy rapidly. In this section, the quantification of the peak power density loads on DTT PFCs is given thanks to a particle tracing study. The orbits of newly-born beam-fast ions are characterized in Section 4. The description of the global confinement properties of Energetic Particles (EPs) is provided, predicting the so-called prompt (also known as first orbit losses), due to unconfined trajectories on time scales shorter than collisional times. Section 5 presents results of NBI sources in DTT plasmas and fast ion distributions. The slowing-down process due to EP Coulomb collisions with the background plasma, simulated using the orbit-following Monte Carlo ASCOT code [7], is described. Section 6 concludes the paper with a summary of the results.
2 Analyzed DTT plasma scenarios and device description
2.1 DTT scenarios
NBI EP confinement and beam-plasma interaction are analyzed for three selected baseline H-mode DTT scenarios at the stationary flat-top phase of Deuterium (D) plasmas. They are all characterized by a single null divertor configuration with positive triangularity. The three selected scenarios (called “A,” “C” and “E”) have different plasma currents, vacuum magnetic fields and auxiliary installed heating power, as shown in Table 1. A full description of A and C plasmas can be found in [8] where JINTRAC [9] and ASTRA [10] simulation settings, defined according to a mixed iterative approach discussed in [11], are also described. E plasma is instead described in [12]. All plasmas have a “seeding impurity” varied among the scenarios, and a smaller concentration of tungsten (W), added to simulate the source from the DTT FW. Table 1 reports the plasma composition and effective charge values Zeff of each flat-top plasma considered in this work. The axis-symmetric plasma magnetic equilibria used as input of the numerical simulations in this work are calculated by CREATE-NL code [13]. Figure 1 shows the Last Closed Flux Surface (LCFS) and the 2D wall for the 3 cases. In the present work, we consider only axis-symmetric magnetic equilibria. The effects of 3D magnetic perturbations due to toroidal field ripple have been investigated in, e.g., [14, 15], and show that ripple losses are negligible (0.12%) in the DTT reference scenario. In the current work ripple losses are not considered.
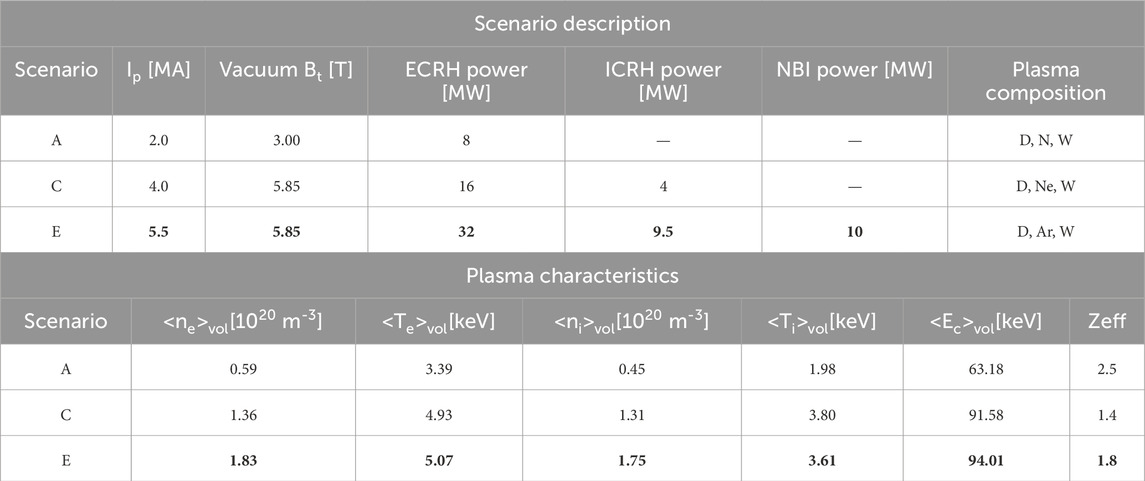
Table 1. Main parameters and plasma properties of analyzed DTT scenarios. In bold the DTT target reference scenario “E”.

Figure 1. Sketch of the Last Closed Flux Surface (LCFS), First Wall (FW) and magnetic axis of A, C, and E scenarios.
The E scenario is the DTT reference scenario exploiting full machine performance. Early phase A and C scenarios are called in the following sections as A* and C* given that we simulate NBI injection even if they do not include NBI, since they are foreseen before DTT NBI installation. Since half-field/reduced-current scenarios will still be used in the DTT NBI phase – though not yet simulated – we decided to use them as illustrative cases. Our stand-alone NBI simulations do not provide any feedback to the plasma. The volume-averaged density and temperature for plasma electrons and ions are reported in Table 1, where the volume averaged critical energy <Ec>vol is reported too. Ec corresponds to the value of the fast ion energy when the collisional energy transfer to the background plasma is equally shared by electron and ion species. For completeness, the radial profiles of electron temperature Te, ion temperature Ti, electron density ne and deuterium (main) ion density nD are also reported in Figure 2 for all the analysed plasmas.
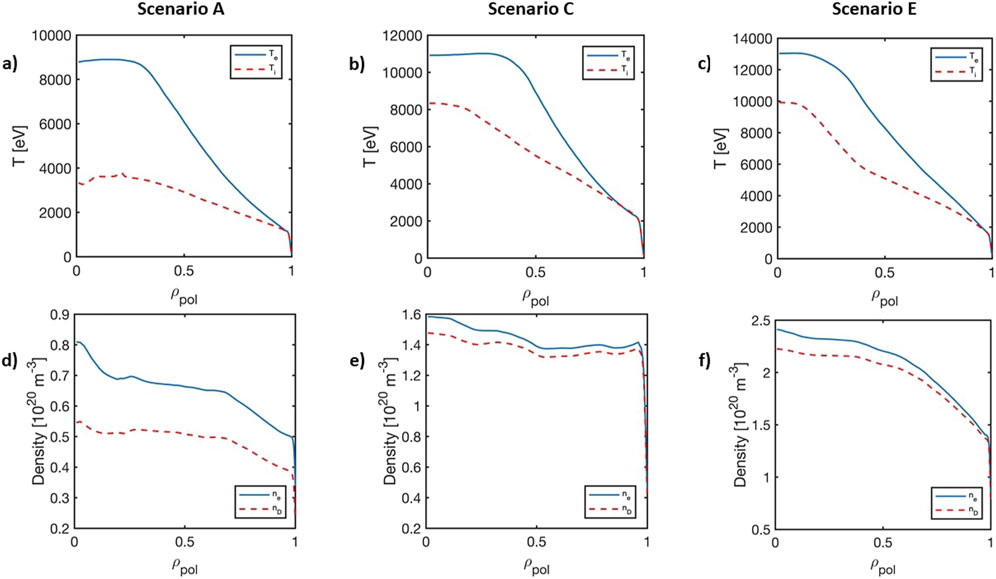
Figure 2. Kinetic profiles for all the analyzed scenarios [8]: (A–C) represent plasma temperature profiles while (D–F) the plasma density profiles of electron (blue) and Deuterium (red) species.
2.2 NBI geometry and first wall geometry
The NBI system [5, 16] designed for DTT is capable of injecting neutrals (H or D; in our work, we considered D injection) up to 510 keV of energy, i.e., the highest beam energy before ITER. The beam energy can be varied in the range of ∼255:510 keV, with beam optics designed to provide NBI power proportional to the injection energy. The high energy needed to heat the plasma core at the high density foreseen in the reference DTT plasma scenario requires using a negative ion source. The beam injection geometry is shown in Figure 3, where the trajectories of a few beamlets are depicted as representative of the total beam. The poloidal view in Figure 3A shows that the injection of DTT NBI is below the equatorial plane of the machine. With the toroidal view (Figure 3B) we can appreciate the tangential direction of the beam injection, with an averaged beam tangency radius
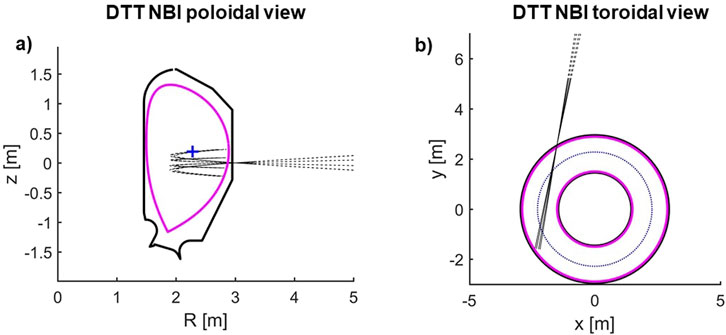
Figure 3. Injection geometry of the DTT neutral beam system in the R, z plane (A) and x, y plane (B). Dashed lines represent each different group of 85 beamlets in the DTT NBI source. DTT FW (solid black) and plasma LCFS (solid magenta) are plotted too.
3 Beam ionization, shine through losses, and consequent PFCs heat loads
Preliminary studies on beam shine-through losses for the DTT full power scenario have already been performed [17, 18], showing that shine-through losses are negligible at the reference E density and may be significant only at plasma densities lower than the reference one. This work presents shine-through analyses for the up-to-date E scenario, not considered in previous publications, and, for the first time, results on low-density, low-current/magnetic field scenarios (A* and C* described in Section 2.1), which also present different shapes of density profiles (see Figure 2). Beam ionization modelling described in Section 3.1 is used to retrieve a heuristic formula for DTT NBI shine-through, in a similar way to what was done for ITER [19] and DEMO [20]. Shine-through losses may represent a significant issue for highly energetic NBI systems, with the risk of causing hot spots on the machine’s first wall. To avoid that, NBI operation may be restricted to specific plasma densities. A necessary step to evaluate NBI operability is the evaluation of shine-through power loads on DTT PFCs, done in Section 3.2, to be then compared to plasma-facing component material limits, which are still to be defined entirely for DTT. Similar studies have also been conducted for current machines, such as EAST [21] and Wendelstein-7X [22].
3.1 Monte Carlo simulations of DTT beam ionization
BBNBI [6] of the ASCOT suite of codes [7] is the state-of-the-art Monte Carlo code used in this work for beam ionization modelling. BBNBI is a beamlet-based neutral beam ionization model capable of following injected neutrals until ionization, providing the input source of fast particles for slowing down simulations. In this work, BBNBI follows neutral particles originating from the 1360 beamlets of the DTT NBI source and calculates the 3D ionization position in the plasma of each injected test particle (50 k per simulation), considering the beamlet divergence and Suzuki cross-section for the collisional ionization [23]. If a test particle is not ionized in the torus and hits the opposite wall, it is counted in the shine-through losses. Shine-through losses strongly depend on beam injection energy and plasma density. Indeed, the beam penetration length
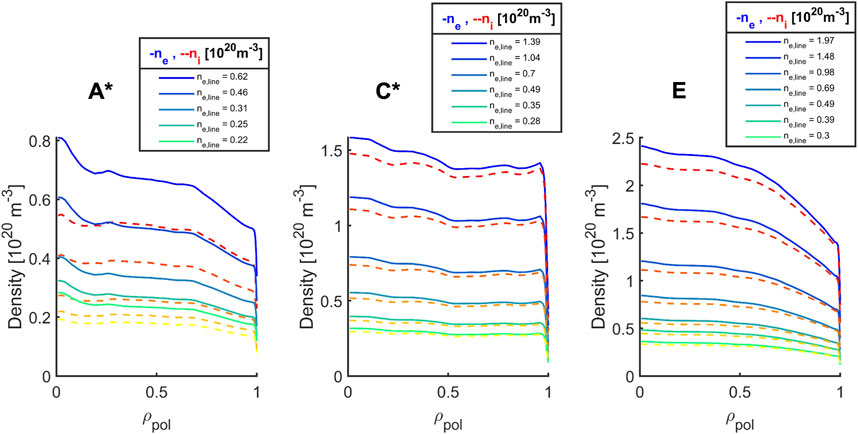
Figure 4. Scaled density profiles used for the shine-through study. Solid blue and dashed red lines represent each scenarios’s reference electron and main ion density. The other profiles are obtained with scaling factors, which resulted in line-averaged electron densities, as shown in the legends above the respective plots.
DTT ref. scenario E foresees a line-averaged plasma electron density of <ne >line = 1.97×10²⁰ m-3, enough to ionize all beam neutrals inside the plasma. The beam ionization cloud for E scenario at full beam energy/power is located from the outer part of the plasma up to the magnetic axis, as shown in Figure 5A. Decreasing the plasma density, the beam penetrates deeper and some energetic neutrals start to cross the whole plasma, reaching the opposite wall. This is the case shown in Figure 5B, for a lower plasma density of <ne >line = 0.49×10²⁰ m-3 and an injection energy of 510 keV. Figure 5C shows instead an opposite situation, where the ionization particle flux is even closer to the plasma edge, happening when decreasing the energy from 510 to 255 keV at fixed ref. E plasma density.
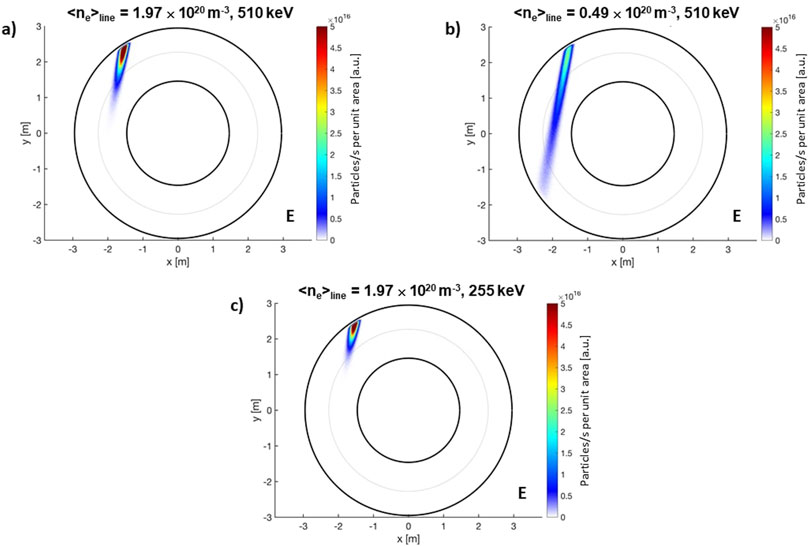
Figure 5. Top view of the beam particle ionization flux for the reference target scenario E (A), at lower plasma electron density (B) and reduced injection energy (C).
Supplementary Table S3 in collects the shine-through fraction values obtained by the BBNBI code as a function of density and energy for all scenarios. Figure 6A shows the shine-through fraction versus the line-averaged plasma electron density of all analyzed scenarios at 510 keV. Shine-through fractions at the same density/energy are not the same for the three analyzed scenarios (Figure 6A). Beam injection geometry, plasma volumes, and flux surface topology are almost identical, implying that, in all the three scenarios, the beam path inside the plasma is virtually equal. Shine-through loss differences can be then explained by the diverse plasma density profile shape in the three cases (see Figure 2). When the plasma density shape is different, even if the average density is the same, the neutral beam ionization rate, which is a local phenomenon, is affected. The fraction of shine-through is always lower in the A*-like plasmas, which present the highest density peaking factor, i.e., the ratio of the core density to the volume-averaged density (npf = ne,0/<ne>vol ∼1.37). A larger peaking factor implies a larger core density, and since DTT NBI aims at the plasma core region, the ionization results more efficient. On the contrary, the peaking factor of scenario C* is the smallest (∼1.16), resulting in the highest shine-through fraction at equal energy and density. npf and the pedestal density nped of the three scenarios are reported in Table 2.
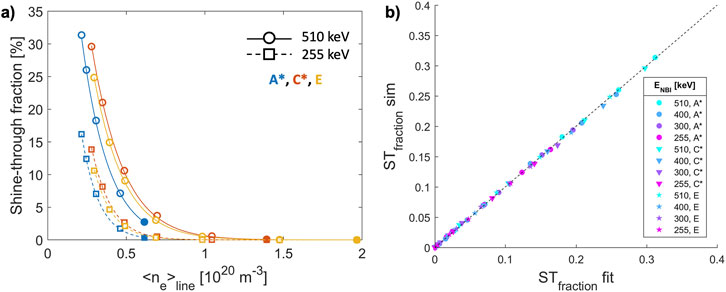
Figure 6. (A) DTT NBI shine-through fractions of A*, C*, and E plasmas, with density profiles scaled as in Figure 4. Simulation points (circles for 510 keV case and squares for 255 keV case) are obtained with BBNBI simulations (full circles and squares represent the reference density values); the curves (solid for 510 keV case and dashed for 255 keV case) are the fit obtained by Equation 1; (B) Comparison of DTT NBI shine-through values obtained by Monte Carlo BBNBI simulations (STfraction sim) and by Equation 1 (STfraction fit), for all the plasmas considered in this work (Figure 2).
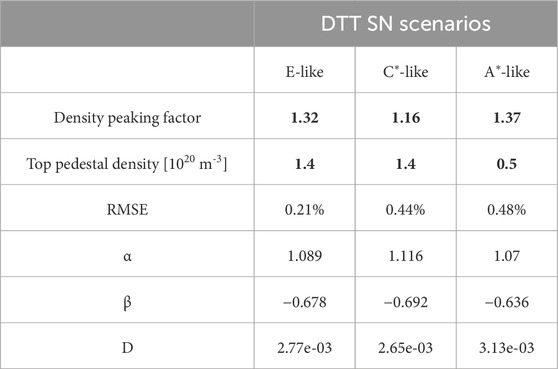
Table 2. Regression coefficients for Equation 1 for each plasma case analyzed. The root mean square error (RMSE) of the regression is also reported as a percentage.
To extend the applicability of this study to any DTT SN plasma with similar characteristics to the cases analyzed here but with different plasma density/beam energy, we retrieve a heuristic formula (Equation 1) similar to what was done for ITER [19] and DEMO [20]. This formula takes into account the exponential dependencies on plasma density (in 1020 m-3) and beam energy (in keV), and can be used to estimate NBI shine-through (ST) rapidly in future works or design calculation.
Coefficients
3.2 Computation of first wall power loads due to NBI shine-through
In Section 3.1 we analyzed shine-through fraction dependencies in three DTT plasma scenarios. In order to obtain the associated power density load on DTT plasma-facing components due to shine-through losses, a separate, dedicated analysis by particle tracing simulations has been carried out. The code used is the commercial Finite Element Method (FEM) code COMSOL® Multiphysics [25], which is capable of tracking the trajectories of the NBI particles both during the negative-ion acceleration phase and then, when neutralized, ballistically inside the torus. Before negative-ion neutralization, the effect of the external electromagnetic (EM) fields generated by Beam Line Components (BLCs) or by the tokamak itself is taken into account. The last one is significant, because while the toroidal component of the tokamak magnetic field is fairly enclosed within the tokamak volume itself, the poloidal component (aptly named “stray field”) is virtually free to expand in the Tokamak Hall, potentially affecting everything susceptible to a magnetic disturbance in a radius of tens of meters. Being mainly poloidal (hence “vertical” with respect to the tokamak reference system), it deflects the charged beam exiting the accelerator sideways with respect to the central NBI axis. This potentially reduces the NBI power due to particle collision with BLCs. This NBI power reduction mechanism follows the poloidal field changes during a tokamak plasma pulse, which are also responsible for shifting the shine-through footprint on the PFCs horizontally. Therefore, it is essential to consider this phenomenon both to determine the NBI power reaching the plasma and to localize the shine-through losses on the PFCs. A system dedicated to the suppression of this effect, denominated Stray Field Shielding System (SFSS) [26], is currently under study. A purely passive magnetic shield has been adopted, protecting the region between the grounded grid and the end of the neutralizer where the beam is still charged and susceptible to the magnetic fields. Including all this information in a single time-dependent simulation for each scenario would require a non-trivial setup and computational power, so the poloidal stray field worst-case scenario has been studied here. The following steps have been undertaken:
1. Identification of the highest poloidal stray field in the NBI region in the analyzed DTT plasma scenarios.
2. Setting of DTT magnetic coil currents corresponding to the worst-case scenario (point 1) in a simplified COMSOL magnetostatic model, including the SFSS shielding system [26].
3. Generating a starting set of test particles (with positions and directions) with boundary conditions determined by the poloidal stray field worst-case scenario chosen. In this step, test particles start from the grounded grid, stopping shortly before the end of the connection duct to the tokamak.
4. Simulating a completely neutral beam traveling through the beamline, taking as input the trajectories obtained in step 3 and projecting them to the opposite tokamak wall. This step includes:
4.1. The neutralization due to the background gas, with an efficiency determined by the beam particle energy;
4.2. The suppression of non-neutralized particles in the Residual Ion Dump (RID);
4.3. The deflection due to the stray fields;
4.4. The final impact zone on the opposite First Wall due to the ballistic motion of neutrals, without considering the plasma ionization effects.
The step 4.4 would formally require some integration between COMSOL and the, e.g., BBNBI code to also include the plasma ionization effect. We adopt a more straightforward method, i.e., simulating the full-power beam traveling in the tokamak without ionization reactions by COMSOL, obtaining the power density load and scaling it successively by the expected shine-through fraction calculated by BBNBI (see Section 3.1). The starting COMSOL beam is generated approximating the 1360 DTT NBI beamlets sampling random particles from two overlapped Gaussian beams for each beamlet, to account for a more focused “core” and a less focused “halo” beamlet component. The core-to-halo power ratio adopted is 85:15, with nominal (510 keV) divergence respectively of
The first result presented is the NBI power density load without the plasma (vacuum case) at a position corresponding to the opposite DTT FW sector. Figure 7A depicts the NBI port from which the beam enters the tokamak and the beam impact zone on the DTT PFCs. The NBI power density loads estimates on the impact zone are performed considering a detailed geometry of the FW, sketched in Figure 7B, where, ICRH and ECRH ports are shown in addition to the FW section. Figure 8 reports the NBI footprints and the power density loads on the FW section for all scenarios, for both reduced energy and nominal cases. Derived quantities such as the total injected power, the toroidal coordinate of the center of impact, the size of the impact (“NBI footprint”) zone, etc., are reported in Table 3.
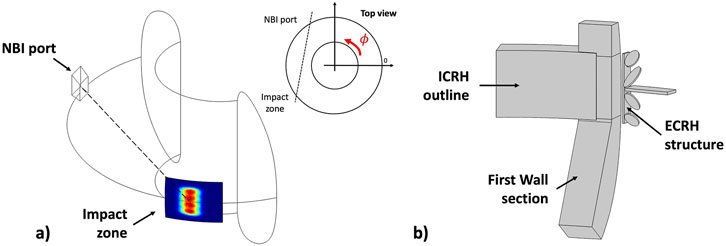
Figure 7. (A) Sketch of the NBI footprint in the toroidal geometry with respect to the NBI injection port. (B) Sketch of the structure of the first wall in the region of the NBI footprint. Location of the footprint in this structure is shown in Figure 8.
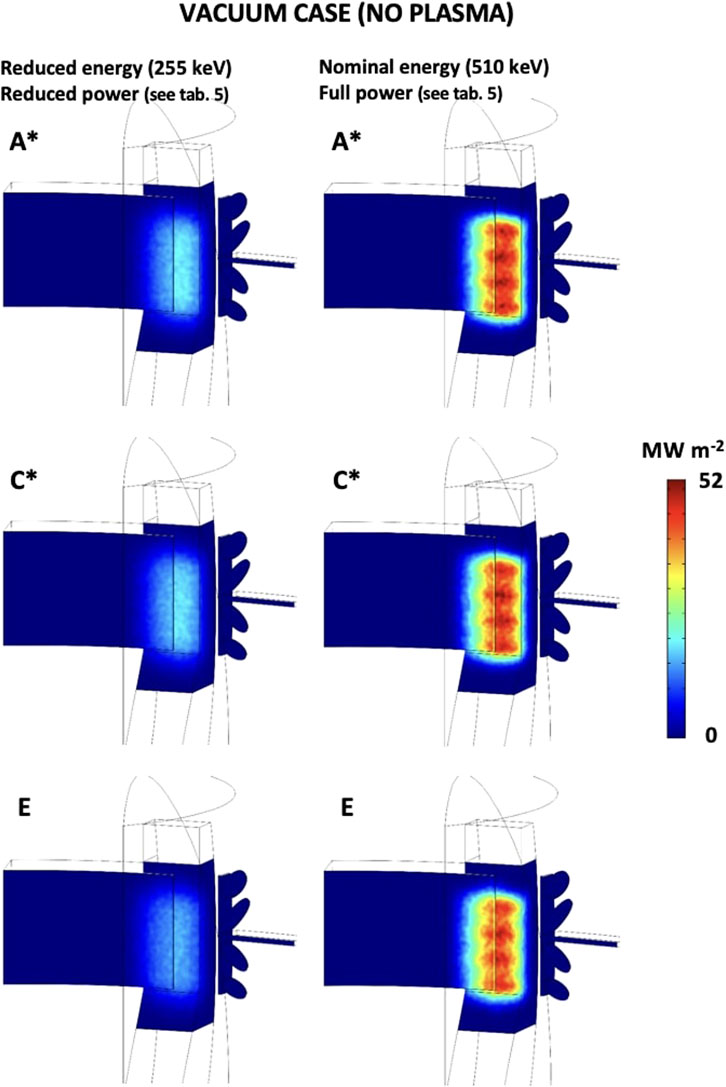
Figure 8. NBI power density loads in the vacuum case (no plasma) projected on the DTT FW section and ICRH, ECRH ports. Nominal and reduced beam energy/power injection cases are reported. The width and heigh of the NBI footprints are noted in the Table 3.
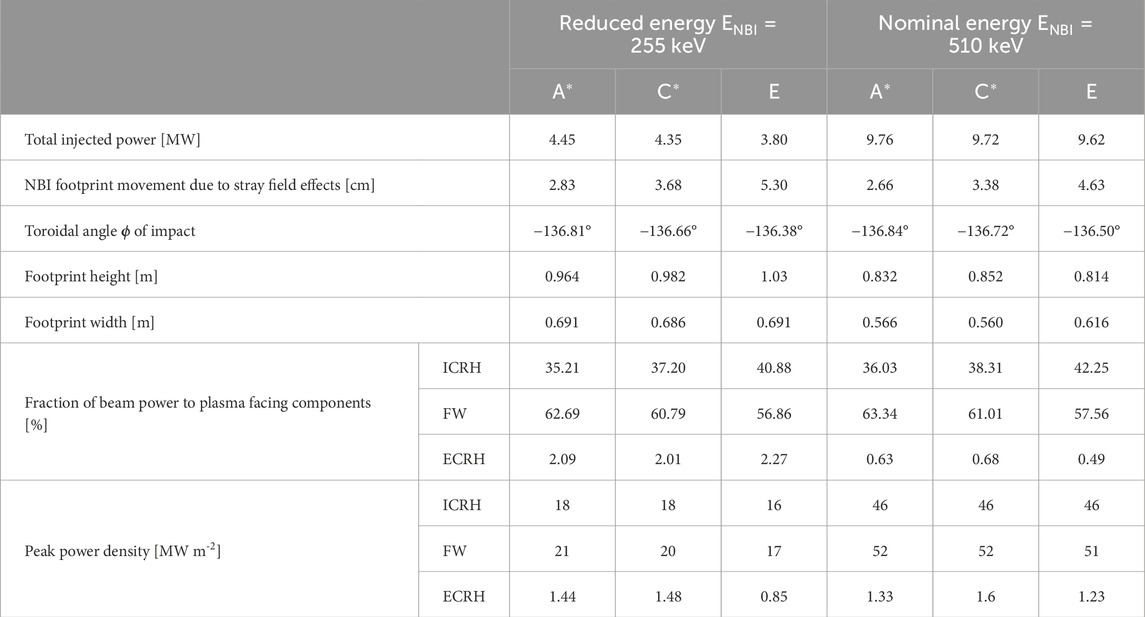
Table 3. Results of the power density load simulations for each considered case and beam power delivered in vacuum (no plasma) to plasma-facing components (FW, ICRH, and ECRH ports), located on the section opposite to the NBI port. When considering a plasma, these power values must be scaled with shine-through fraction (see “supplementary materials”). In bold the DTT target reference scenario “E”.
The results show how the change in the scenario and beam energy affect the strike footprint. A* and C* scenarios feature a reduced plasma current and coil currents, resulting in a lower poloidal field, i.e., in a reduced stray field effect, and thus in a less deviated and more powerful neutral beam with respect to the E scenario. The deviation from the ideal strike point position of the NBI footprint can be expressed in terms of the toroidal angle
As shown in Figure 8, ICRH and ECRH port regions are also affected by the NBI footprint. Considering the beam injection in vacuum (without any plasma) at nominal parameters, about 42% of the beam power is delivered to the ICRH port area (with a peak of 46 MW m−2). The ECRH ports receive a small portion of power with respect to the FW and ICRH structure (0.49% at the nominal case, and 2.27% at the reduced energy case). Table 3 reports the fraction of power delivered to the various components (ICRH, FW, ECRH) and the corresponding expected vacuum power density peak load for all scenarios, both at the half and nominal beam energies. The impact of the beam on ICRH and ECRH ports may set a lower operability limit for NBI application since these components are able to withstand a lower power load than the FW section, being not protected by a specific coating like the rest of the wall.
Up to now, we have evaluated the power density loads due to the NBI in the absence of a plasma. When considering the plasma, the power density peak loads reported in Table 3 can be rescaled through the estimated shine-through fractions obtained in Section 3.1. In Supplementary Table S4, all the rescaled values of the power density peak loads on the FW for the reduced energy (255 keV) and the nominal energy (510 keV) cases of the three scenarios are reported. Figure 9 shows the estimates of the FW power density peak load (in log scale) at different plasma densities for both the reduced energy (dashed line) and nominal cases (solid line). The FW power density peak values for the vacuum case (no plasma) are reported too. We can observe that the C* scenario presents the largest power density peak at all densities, while scenario A* presents the lowest, as discussed in the previous section. The design of DTT FW and the consequent PFCs limits is still to be fixed. In particular, additional protection on the NBI footprint would allow the operation of the beam at lower plasma densities.
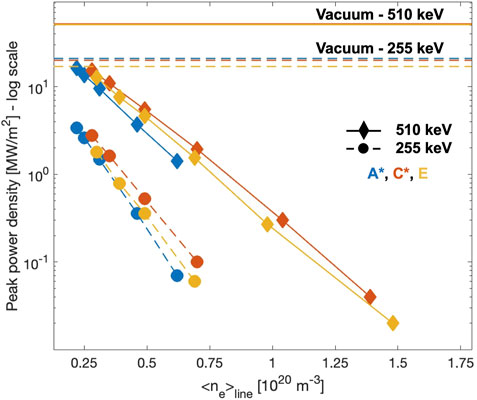
Figure 9. Peak power density plotted versus DTT line-averaged plasma electron densities considering both nominal (510 keV, solid line) and reduced energy (255 keV, dashed lines) NBI injection energies. These values are estimated on the FW section represented in Figure 7B). The data used for this plot are reported in Supplementary Table S4. The peak power density expected with no plasma (vacuum case) are also reported (solid and dashed horizontal lines) for each scenario. These values are reported in Table 3.
4 Orbit characterization of beam newly-born fast ions
After discussing beam trajectory, ionization and shine-through losses in Section 3, we now characterize the beam newly born fast ion orbits for the three DTT plasma scenarios A*, C*, and E. Once ionized, fast ions start to feel the magnetic field and follow orbits depending on their position and velocity. Fast ions typically perform several toroidal turns before experiencing a Coulomb collision with the background plasma particles, i.e., in this phase, their motion is only guided by the magnetic field. In this analysis, the magnetic field fluctuations are neglected but further analyses could be performed to evaluate their impact on the initial beam particle orbits. When evaluating the efficiency of NBI in a plasma, the topology of newly-born fast ion first orbits is an essential feature to be checked to assess the amount of EPs born on unconfined orbits (prompt losses) or the ratio of passing/trapped EPs which can affect beam source in the plasma as, e.g., the driven current. The orbit characterization is here performed in the Constant of Motion (CoM) phase space [27]. Background thermal particles typically follow passing and banana orbits. However, a larger drift affects energetic particles during their motion in the plasma, opening the possibility of the so-called non-standard orbits, as stagnation orbits (i.e., orbits of particles not moving significantly in the poloidal direction) and potato orbits (i.e., trapped orbits that encircle the magnetic axis) [28]. In the following subsections, we present the analyses of first orbits and prompt losses in 2D axial symmetric magnetic equilibria, discussing the effect of plasma density (affecting fast ion birth position) and beam injection energy (affecting both fast ion birth position and EP velocity).
4.1 DTT beam EP constant of motion phase space
In an axisymmetric geometry and in a collisionless plasma, the particle motion can be described by three variables: the particle energy E, the toroidal canonical angular momentum
where
In “supplementary materials” (Supplementary Figures S1A, B) the stagnation surface for DTT E flat-top plasma in the poloidal plane and the domains of the topological map, obtained by solving Equation 2 at different
4.2 Orbit classification
Combining CoM boundaries calculated as described in Section 4.1 and BBNBI ionization results reported in Section 3.1, we can classify the orbits of newly-born fast ions for DTT scenarios A*, C*, and E. Differences among plasma scenarios permit also to investigate how plasma parameters play a role in the fast ion orbit topology, at different NBI energies. For each scenario, we obtained 2D histograms of newly born fast ions in CoM phase space, at 510 keV and 255 keV beam injection energy, as shown in Figure 10.
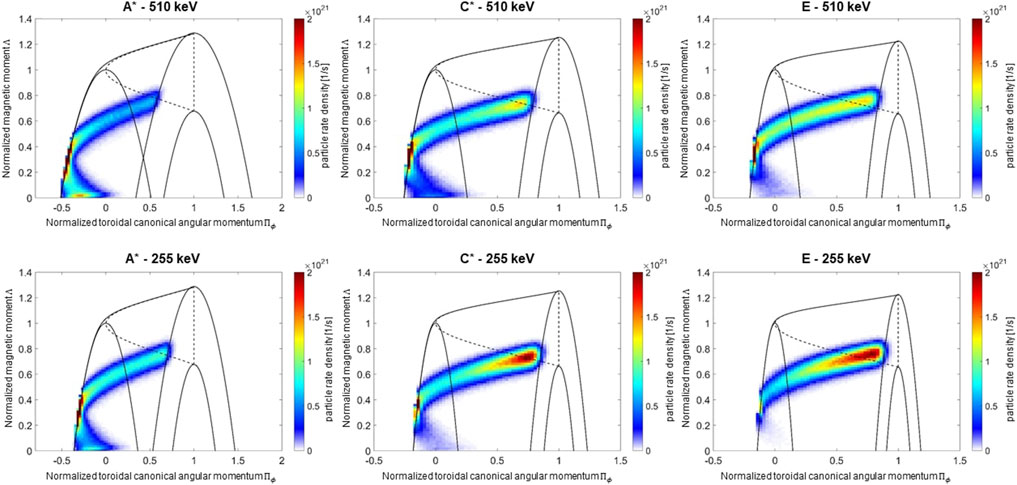
Figure 10. Histograms in the CoM phase space of newly-born fast ions (particle rate density [1/s]). Two beam injection energy cases are shown for each DTT scenario: 510 keV (top row) and 255 keV (bottom row).
As shown in Figure 10, particle energies and scenario properties affect fast ion orbit topology. Confined passing orbits characterize the large majority of the DTT beam EPs. The number of newly-born fast ions with confined passing orbits decreases when the injection energy is reduced (see Supplementary Table S1). This decrease is evident for high density scenario E and almost negligible for low density, low BT scenario A*. At the same magnetic field and the same injection energy (C* and E scenarios), the percentage of passing orbits increases when decreasing the plasma density. A decrease of EP energy determines an increase of trapped orbits. These effects depend on the penetration of the beam into the plasma. Passing particles are likely to form close to the plasma center, where the ions are born with a larger particle velocity component parallel to the magnetic field. Trapped particles instead are likely to form on the edge of the plasma due to a larger perpendicular velocity component. Therefore, the larger the beam penetration (e.g., due to a higher beam energy or lower plasma density), the higher the fraction of confined passing particles. EP non-standard orbits will not significantly characterize DTT scenarios. However, a small fraction (∼0.8–5%) of stagnation orbits is present (potato orbits are not predicted at all). For all the analyzed cases, lost (or unconfined) orbits contribute up to ∼1% (“prompt losses”). In the CoM phase space analysis, a particle is considered lost when it crosses the Last Closed Flux Surface (LCFS). However, a fast ion that crosses the LCFS can re-enter the plasma, especially if the LCFS is far enough from the FW as in DTT. The lost particle fractions from COM analysis are therefore overestimated. The orbit-following Monte Carlo ASCOT code shows that prompt losses in the reference scenario E, without collisions, reduce to <0.1% with simulation domain up to DTT FW. This result is in agreement with ORBIT simulations [15]. The effect of collisions is taken into account in Section 5.
The complete quantitative estimate of the observed orbit types as fractions of the total fast ion population is reported in Supplementary Table S1, as well as some examples of particle orbits expected in DTT, reported in Supplementary Figure S3.
5 NBI collisional slowing down, fast ion distribution functions and EP confinement
DTT NBI fast ions interact with the plasma particles through Coulomb collisions, providing heat, inducing current drive and injecting torque to the plasma. The orbit-following Monte Carlo ASCOT code [7] is used as modelling tool for the numerical exploration of the collisional slowing down of the beam’s fast ions and to obtain fast ion distributions and sources to the plasma. ASCOT solves the Fokker-Planck equation of charged particles, both in gyro-orbit or guiding center motion. Simulations performed for this work consider a hybrid method, that consists of following particles in their guiding center motion until the guiding center of the particles is closer to the wall than the particle Larmor radius. At this point, the code starts to follow the particle in the gyro-orbit reference. This hybrid method allows to reduce the computational demand required for gyro-orbit simulations, while keeping high accuracy on the evaluation of fast particle losses position close to the wall. The Coulomb collisions happening inside the 2D wall between beam particles and the plasma are implemented using Monte Carlo operator. In our ASCOT simulations, we used the inputs described in Section 2, plus BBNBI outputs which provide the ensemble of newly-born fast ions in the plasma. In this work we neglect the effects of different beam injection options, such as power and energy, on the background magnetic fields. EPs are followed until they are lost or thermalized, i.e., when beam particles reach an energy equal to 1.5 the energy of a thermal ion in the core of the plasma (∼10 keV in the DTT E scenario). This condition is usually done in ASCOT studies.
The fast ion collisional slowing-down until thermalization has been studied for the three scenarios A*, C*, and E. Collisions are responsible for energy and momentum transfer, which may also result in fast ion losses due to, e.g., scattering into an unconfined orbit. The generation of a fast-ion population moving toroidally in the tokamak also gives rise to the current-drive phenomenon. -Charge-exchange fast ion losses with background neutrals are not computed in this work and assumed to be negligible due to the high density of DTT plasmas that likely prevents cold and thermal neutrals from penetrating deep in the core. Future neutral transport studies for DTT will clarify this point. The amount of power absorbed is larger than 99% for all scenarios except the A* scenario at 510 keV, where shine-through losses (2.74%) and orbit losses (0.14%) cause a slightly reduced beam power absorption. As discussed in sec. 4, co-current injection prevents unfavorable (e.g., “outward banana”) fast ion orbits, resulting in negligible prompt losses in all scenarios. Orbit losses due to scattering processes do not change significantly in this picture, with a negligible amount of lost particles. Regarding the power transferred to plasma species, electron heating is dominant at ENBI = 510 keV, with ∼55–60% of the power absorbed by the electrons for all scenarios. Ion heating instead is larger at 255 keV (up to ∼55%). At 255 keV, particle energy is closer to the critical energy and a larger ion heating is observed during the slowing down, as well as an increasing ion-beam collision frequency (
Figure 11 shows the deposited power and toroidal current density profiles versus the normalized poloidal flux
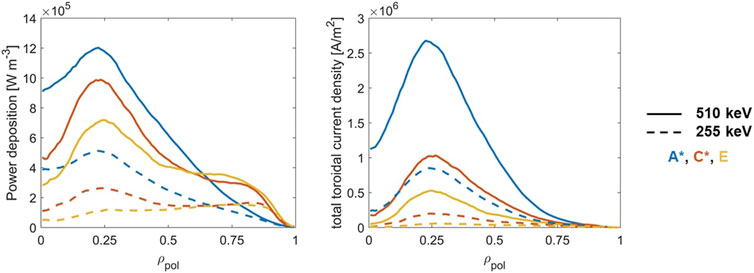
Figure 11. Power deposition and total toroidal current density radial profiles for different DTT scenarios. Solid lines represent the results of ASCOT simulations with a beam injection energy of 510 keV, while dashed lines with an injection energy of 255 keV.
Figure 12 shows the energy-pitch distribution functions for the steady-state scenarios at 510 keV (top) and 255 keV (bottom). These distributions are affected both by plasma parameters and EP initial energy. The source of EPs, originated by the NBI injection, has a negative pitch (peak at
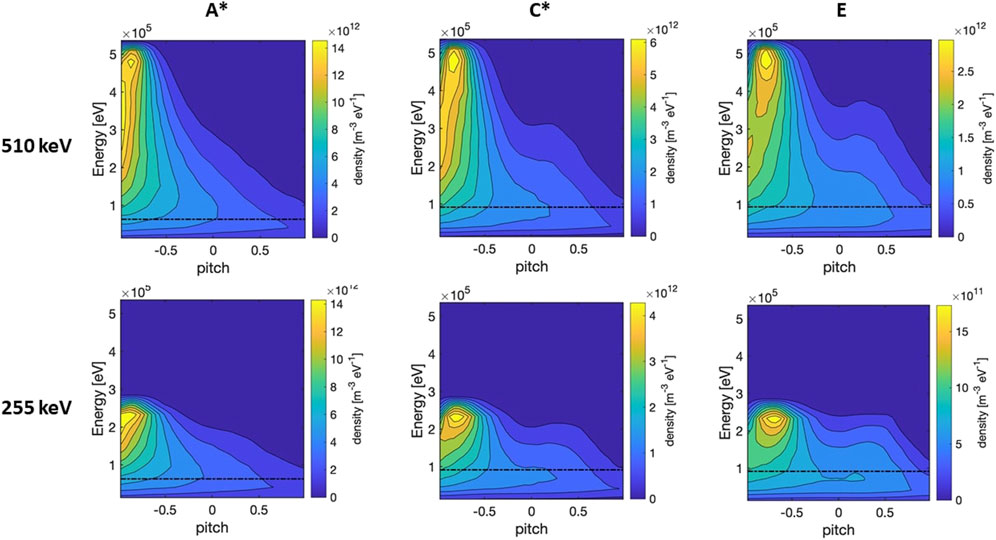
Figure 12. DTT beam EP energy-pitch distributions for A*, C*, and E scenarios, considering an injection energy of 510 keV (top row) and 255 keV (bottom row). The black dashed line represents the critical energy Ec.
6 Conclusion
DTT NBI will be one of the NBI systems with the highest injection energy in the future fusion scene, the only one in a full-metal FW machine besides ITER. This work, which explores numerically the impact of the NBI system in DTT plasmas, supports the design of the system, plasma scenario simulation activities and the DTT Research Plan development [3]. Conditions for efficient beam operability in terms of. e.g., injection energy and power are discussed for various plasma conditions. In this study, beam ionization and beam-plasma interaction are numerically explored for three different plasmas, with a single null divertor configuration, a 2D axis-symmetric magnetic equilibrium, at diverse Bt/Ip values, considering a wide-range scan in plasma density and beam energy. Low Bt, Ip, and plasma density DTT scenarios are explored for the first time in this work, together with an extended analysis of the DTT target reference scenario. Shine-through losses are one of the significant challenges that characterize high-energy beam injection. An effective NBI ionization is shown for high-density DTT plasmas, while low-density plasmas may require reduced beam energy and power due to significant shine-through losses. We also propose a heuristic formula to evaluate NBI shine-through dependence on ne and ENBI, that can be used for fast shine-through evaluations on future DTT plasmas and for future analyses to define NBI operational boundaries in terms of plasma density and beam injection energy. The effects of the poloidal magnetic “stray” fields on the beam optics are included in the study, showing a decrease in the injected beam power due to beam scraping by the beam-line components. The stray fields significantly affect the injected beam power at low beam energy and high plasma current. Power density loads due to NBI shine-through on the DTT PFCs are presented, with an estimate of the peak power density in the various plasma-facing components hit by the beam footprint. This analysis shows that ICRH and ECRH ports, located in the area of the NBI footprint on the wall, are partly hit by the beam projection and provides a first estimate of the peak power density loads expected in these regions. The minimum density for safe NBI operation in DTT will have to consider shine-through heat loads, especially on delicate plasma-facing components, such as in the ICRH and ECRH port areas. The analysis through the Constant of Motion phase space provides a picture of NBI EP orbits and prompt losses, showing how the plasma density and beam energy influence the orbit topology of newly-born fast particles. The ratio between confined passing/trapped orbits varies when the plasma density and injection energy changes. Passing orbits dominate the reference DTT plasma. A small fraction of non-standard orbits that includes only stagnation particles is observed, which may be interesting for EP stability studies foreseen in future DTT activities. The beam-plasma coupling results efficient for all the analyzed scenarios (
Data availability statement
The raw data supporting the conclusions of this article will be made available by the authors, without undue reservation.
Author contributions
CD: Writing–original draft, Writing–review and editing. PV: Writing–original draft, Writing–review and editing. FV: Writing–original draft, Writing–review and editing. PA: Writing–review and editing. IC: Writing–review and editing. AC: Writing–review and editing. PM: Writing–review and editing. AM: Writing–review and editing. TB: Writing–review and editing.
Funding
The author(s) declare that financial support was received for the research, authorship, and/or publication of this article. This work has been carried out within the framework of the EUROfusion Consortium, funded by the European Union via the Euratom Research and Training Programme (Grant Agreement No 101052200 — EUROfusion). Views and opinions expressed are however those of the authors only and do not necessarily reflect those of the European Union or the European Commission. Neither the European Union nor the European Commission can be held responsible for them.
Acknowledgments
The authors thank Mireille Schneider, Lars-Goran Eriksson, and Dirk Van Eester for the discussions on energetic particle physics, which greatly improved the manuscripts. A special thanks also to the support given by the ASCOT team of Aalto University and VTT Technical Research Centre, Finland.
Conflict of interest
The authors declare that the research was conducted in the absence of any commercial or financial relationships that could be construed as a potential conflict of interest.
Publisher’s note
All claims expressed in this article are solely those of the authors and do not necessarily represent those of their affiliated organizations, or those of the publisher, the editors and the reviewers. Any product that may be evaluated in this article, or claim that may be made by its manufacturer, is not guaranteed or endorsed by the publisher.
Supplementary material
The Supplementary Material for this article can be found online at: https://www.frontiersin.org/articles/10.3389/fphy.2024.1492095/full#supplementary-material
References
1. ENEA. DTT interim design report (2019). Available from: https://www.dtt-dms.enea.it/share/s/avvglhVQT2aSkSgV9vuEtw (Accessed 2019).
2. Romanelli F, et al. Divertor Tokamak Test facility project: status of design and implementation. Nucl Fusion (2024) 64:112015.
3. Crisanti F, Giruzzi G, Martin P, et al. Divertor tokamak test facility research plan version 1.0. Rome, Italy: ENEA (2024).
4. Granucci G, Ceccuzzi S, Giruzzi G, Sonato P, Agostinetti P, Bolzonella T, et al. The DTT device: system for heating. Fusion Eng Des (2017) 122:349–55. doi:10.1016/j.fusengdes.2017.04.124
5. Agostinetti P, et al. Improved conceptual design of the beamline for the DTT neutral beam injector. IEEE Transaction on Plasma Science (2022).
6. Asunta O, Govenius J, Budny R, Gorelenkova M, Tardini G, Kurki-Suonio T, et al. Modelling neutral beams in fusion devices: beamlet-based model for fast particle simulations. Computer Phys Commun (2015) 188:33–46. doi:10.1016/j.cpc.2014.10.024
7. Hirvijoki E, Asunta O, Koskela T, Kurki-Suonio T, Miettunen J, Sipilä S, et al. ASCOT: solving the kinetic equation of minority particle species in tokamak plasmas. Computer Phys Commun (2014) 185:1310–21. doi:10.1016/j.cpc.2014.01.014
8. Casiraghi I, Mantica P, Ambrosino R, Aucone L, Baiocchi B, Balbinot L, et al. Core integrated simulations for the Divertor Tokamak Test facility scenarios towards consistent core-pedestal-SOL modelling. Plasma Phys Controlled Fusion (2023) 65:035017. doi:10.1088/1361-6587/acb6b1
9. Romanelli M, Corrigan G, Parail V, Wiesen S, Ambrosino R, Da Silva Aresta Belo P, et al. JINTRAC: a system of codes for integrated simulation of tokamak scenarios. Plasma Fusion Res (2014) 9:3403023. doi:10.1585/pfr.9.3403023
10. Pereverzev GV, Yushmanov e PN. ASTRA automated system for transport analysis in a tokamak. IPP Rep (2002) 5:98.
11. Casiraghi I, Mantica P, Koechl F, Ambrosino R, Baiocchi B, Castaldo A, et al. First principle-based multi-channel integrated modelling in support of the design of the Divertor Tokamak Test facility. Nucl Fusion (2021) 61:116068. doi:10.1088/1741-4326/ac21b9
12. Crisanti F, et al. Physics basis for the divertor tokamak test facility. Nucl Fusion (2024) 64:106040. doi:10.1088/1741-4326/ad6e06
13. Albanese R, Ambrosino R, Mattei M. CREATE-NL+: a robust control-oriented free boundary dynamic plasma equilibrium solver. Fusion Eng Des (2015) 96-97:664–7. doi:10.1016/j.fusengdes.2015.06.162
14. Spizzo G, Gobbin M, Agostinetti P, Albanese R, Ambrosino R, Casiraghi I, et al. Collisionless losses of fast ions in the Divertor Tokamak Test due to toroidal field ripple. Nucl Fusion (2021) 61:116016. doi:10.1088/1741-4326/ac1e08
15. Spizzo G, Gobbin M. ORBIT simulations of fast ion power loads on the wall of the Divertor Tokamak Test. Plasma Phys Controlled Fusion (2023) 65:075013. doi:10.1088/1361-6587/acd71d
16. Veronese F, Agostinetti P, Dima R, Murari A, Pepato A, Romanato M. The spherical and lemon hyperlens grids concept applied to the DTT neutral beam injector. IEEE Trans Plasma Sci (2024) 1–6. doi:10.1109/tps.2024.3353349
17. Vincenzi P, et al. Interaction of high-energy neutral beams with Divertor Tokamak Test plasma. Fusion Eng Des (2023):113463. doi:10.1016/j.fusengdes.2023.113436
18. De Piccoli C. DTT NBI fast particle modelling with Monte Carlo ASCOT code. Padova, Italy: University of Padova (2022).
19. Vincenzi P, Snicker A, Schneider M. Modelling of NBI shine-through in ITER non-nuclear phase to limit heat fluxes on first wall. Fusion Eng Des (2024) 200:114178. doi:10.1016/j.fusengdes.2024.114178
20. Vincenzi P, Agostinetti P, Artaud JF, Bolzonella T, Kurki-Suonio T, Mattei M, et al. Optimization-oriented modelling of neutral beam injection for EU pulsed DEMO. Plasma Phys Controlled Fusion (2021) 63:065014. doi:10.1088/1361-6587/abf402
21. Xingquan W, Luo J, Wu B, Wang J, Hu C. Calculation of shinethrough and its power density distribution for EAST NBI. Plasma Sci Technology (2013) 15:480–4. doi:10.1088/1009-0630/15/5/17
22. Rust N, et al. Neutral-Beam-Injection on Wendelstein 7-X: beam transmission, shine through and effect of plasma current. In: 46th EPS conference on plasma physics. Milan (2019).
23. Suzuki S, Shirai T, Nemoto M, Tobita K, Kubo H, Sugie T, et al. Attenuation of high-energy neutral hydrogen beams in high-density plasmas. Plasma Phys Controlled Fusion (1998) 40:2097–111. doi:10.1088/0741-3335/40/12/009
24. Vincenzi P, et al. ITER NBI operational window and power availability constraints due to shine-through losses. Submitted Nucl Fusion.
26. Veronese F, Agostinetti P, Calabrò G, Crisanti F, Fanelli P, Lombroni R, et al. Comparison among possible design solutions for the stray field shielding system of the DTT neutral beam injector. J instrumentation (2023) 18:C06018. doi:10.1088/1748-0221/18/06/c06018
27. White RB. The theory of toroidally confined plasmas. London, United Kingdom: Imperial college press (2014).
28. Eriksson LG, Porcelli F. Dynamics of energetic ion orbits in magnetically confined plasmas. Plasma Phys Controlled Fusion (2001) 43:R145–82. doi:10.1088/0741-3335/43/4/201
29. Tenney F. Confinement of energetic alphas in TCT and tritons in PLT. Tech Rep Princeton Univerisity (1975).
30. Egedal J. Drift orbit topology of fast ions in tokamaks. Nucl Fusion (2000) 40(9):1597–610. doi:10.1088/0029-5515/40/9/304
31. Bierwage A, Fitzgerald M, Lauber P, Salewski M, Kazakov Y, Štancar Ž. Representation and modeling of charged particle distributions in tokamaks. Comput Phys Commun (2022) 275:108305. doi:10.1016/j.cpc.2022.108305
Keywords: DTT, neutral beam injection, energetic particles, numerical modelling, fast ion orbits
Citation: De Piccoli C, Vincenzi P, Veronese F, Agostinetti P, Casiraghi I, Castaldo A, Mantica P, Murari A and Bolzonella T (2024) Divertor Tokamak Test: Impact of NBI shine-through and beam-plasma interaction on Divertor Tokamak Test facility. Front. Phys. 12:1492095. doi: 10.3389/fphy.2024.1492095
Received: 06 September 2024; Accepted: 29 October 2024;
Published: 19 November 2024.
Edited by:
Elena Belova, Princeton Plasma Physics Laboratory (DOE), United StatesReviewed by:
Hiroaki Ohtani, National Institute for Fusion Science, JapanXingquan Wu, Chinese Academy of Sciences (CAS), China
Copyright © 2024 De Piccoli, Vincenzi, Veronese, Agostinetti, Casiraghi, Castaldo, Mantica, Murari and Bolzonella. This is an open-access article distributed under the terms of the Creative Commons Attribution License (CC BY). The use, distribution or reproduction in other forums is permitted, provided the original author(s) and the copyright owner(s) are credited and that the original publication in this journal is cited, in accordance with accepted academic practice. No use, distribution or reproduction is permitted which does not comply with these terms.
*Correspondence: C. De Piccoli, Y2hpYXJhLmRlcGljY29saUBpZ2kuY25yLml0
†ORCID: F. Veronese, orcid.org/0000-0003-3277-9955; P. Agostinetti, orcid.org/0000-0003-2103-7630; I. Casiraghi, orcid.org/0000-0002-1719-6682; A. Castaldo, orcid.org/0000-0003-0413-9387; P. Mantica, orcid.org/0000-0001-5939-5244; A. Murari, orcid.org/0000-0002-3932-3865; T. Bolzonella, orcid.org/https://orcid.org/0000-0003-1128-964X
 C. De Piccoli
 P. Vincenzi
 F. Veronese1†