- 1Northwest Electric Power Design Institute Co., Ltd. of China Power Engineering Consulting Group, Xi’an, China
- 2College of Harbour, Coastal and Offshore Engineering, Hohai University, Nanjing, China
Pile supported geogrid-reinforced embankment are widely used to treat soft soil. This paper proposes a novel method for reinforcing foundations using non-foamed polyurethane-bonded gravel (NPBG) porous piles. Through triaxial compression tests, the mechanical properties and strength parameters, such as strength and stiffness, of the polyurethane-bonded gravel material are determined. Finite element numerical simulations are then employed to investigate the bearing characteristics of NPBG porous pile under embankment loads. The experimental results indicate that, under the same confining pressure, the strength and stiffness of the NPBG material are significantly higher than those of plain gravel material, while still retaining large pore characteristics. Increasing the polyurethane content enhances the strength and stiffness of the porous material, but the improvement diminishes as the confining pressure increases. A systematic comparative analysis was conducted on the bearing characteristics of NPBG porous pile versus concrete pile, cement-mixed pile, and gravel pile under embankment in terms of load sharing ratio and settlement deformation. The permeability coefficient and modulus of the pile significantly influence the dissipation rate of excess pore water pressure in the foundation soil. The NPBGP pile exhibited the fastest consolidation speed, effectively controlling total settlement and reducing the proportion of post-construction settlement of the embankment. Compared to concrete pile and cement-mixed pile, the NPBG porous pile has a lower uniform settlement surface height in embankment, making it suitable for low-height embankment accelerated construction projects.
1 Introduction
When expressway embankments are built on soft soils, they exert substantial loads over a wide area. Soft clays and other compressible soils frequently experience excessive settlements or fail due to inadequate bearing capacity. A variety of techniques can be used to solve such problems [1]. Pile supported geogrid-reinforced embankment have increasingly been used in the recent years for accelerated construction [2–6]. In this system, piles provide major support for the embankment over soft soils and reduce its settlement. Single or multiple geogrid layer(s) are employed above the piles to enhance the load transfer from soft soils to piles [7–9]. As piles support the majority of the embankment load, soft soils carry reduced pressure, significantly lowering the risk of soil failure and minimizing both total and differential settlements. As a result, accelerated construction becomes possible.
Different pile types can be applied in this system, such as gravel piles [10–12], cement-mixed piles [13–15], and concrete piles [16–18], each exhibiting distinct interaction characteristics with the foundation soil. Gravel piles can replace a portion of the soft soil to enhance bearing capacity, and the porous nature of the pile can create drainage pathways that accelerate soil consolidation. However, since the bearing capacity of gravel piles primarily relies on the constraint provided by the surrounding soil, the total settlement of the foundation remains relatively large when using gravel piles [19]. Cement-mixed piles exhibit significantly higher strength and stiffness compared to gravel piles, while concrete piles offer even greater strength and stiffness, effectively supporting a large portion of the embankment load and helping to reduce total settlement. However, Even with the reduced load on the soft soils, excess pore water pressure would still be generated and then dissipate during and after the construction, and the settlement occurred during the construction of the embankments and increased after the construction. Cement-mixed piles and concrete piles generally lack drainage capability and cannot create drainage pathways in the foundation, resulting in slow drainage consolidation of the foundation soil and often leading to significant post-construction settlement [20]. To achieve both reduced total settlement and post-construction settlement, researchers have found it beneficial to use permeable concrete as the pile material [21–23]. Studies show that permeable concrete piles possess certain strength and stiffness, and compared to stone columns, they enhance both bearing capacity and settlement rate, significantly reducing the development of excess pore pressure in the foundation soil. However, the small and shallow pores characteristic of permeable concrete can lead to clogging, impairing its drainage performance and preventing it from achieving the intended drainage effect [24].
Non-foamed polyurethane-bonded gravel material (NPBG) is formed by mixing non-foamed polyurethane with gravel in a specific proportion. The polyurethane binds the gravel into a cohesive whole while retaining the original interconnected porosity of the gravel particles. This material maintains the excellent permeability of the aggregate gravel while also providing certain strength and stiffness. Researchers have investigated the permeability, thermal stability, strength, stiffness, and durability of NPBG [25, 26], and it has already been applied in pavement engineering [27–29]. However, there is still limited in-depth theoretical research on NPBG, such as the stress-strain relationship considering the effects of confining pressure, particularly the introduction of advanced methods like fractal theory [30] to study the flow characteristics of pore water within the high porosity NPBG porous medium with large pore sizes. Such research will provide important theoretical guidance for the engineering applications of this material.
This study applies the NPBG porous material in the reinforcement of soft soil foundations, proposing a novel NPBG porous pile technology that integrates high bearing capacity with good drainage capability. First, the mechanical properties of NPBG material are investigated through triaxial compression tests to explore the effects of polyurethane content and confining pressure. Subsequently, finite element numerical simulations are conducted to investigate the bearing characteristics of NPBG porous piles under embankment loads. A systematic comparative analysis is performed on the load distribution and settlement deformation characteristics of NPBG piles in relation to concrete piles, cement-mixed piles, and gravel piles. This analysis assesses the applicability of NPBG porous piles in pile supported geogrid-reinforced embankments, providing a reference for their application in practical engineering.
2 Experiment on polyurethane bonded gravel porous material
2.1 Materials
2.1.1 Gravel
The gravel used in this study is basalt, with a particle size of 5–10 mm and angular shape. The specific gravity of the gravel is 2.74, the maximum porosity ratio is 0.89, and the minimum porosity ratio is 0.60.
2.1.2 Non-foam polyurethane
The non-foamed polyurethane is composed of two non-water-reactive monomers: polyol (component A) and polyisocyanurate (component B). Among them, polyol includes polyether polyol, polyester polyol, and polyether-ester. The reaction is initiated with either amine catalyst or metal salt catalyst. The components A and B are mixed in a 3:2 ratio, thoroughly stirred until a white homogenous mixture is formed, and the mixture is homogeneous.
2.2 Sample preparation
To obtain the mechanical properties of NPBG, it is necessary to be cast into a 200 mm high and 100 mm diameter specimen. The gravel used in this study has a dry density of 1.56 g/cm3 and the corresponding relative compaction ratio is 0.45. Not all coarse-grained soils can be directly tested due to their susceptibility to size effects [31]. In this test, the maximum diameter of the gravel particles in the specimen was no more than 1/10 of the specimen diameter, to reduce the effects of size effects.
Non-foamed polyurethane fully adhered to and completely encapsulated the particles of dried gravel after it was sufficiently mixed with the gravel. Part of the polyurethane slurry filled the voids on the particles due to its fluidity. To ensure that the NPBG materials retain a large amount of voids, we will investigate the improvement of gravel properties under low content levels of polyurethane. Three samples were prepared, each with a polyurethane content (Wp) of 2%, 4%, and 6% (defined as the ratio of polyurethane mass to gravel mass). The samples were left in the mold for 3 days after filling and then continue to cure until 7 days before conducting subsequent tests. The step-by-step procedure for preparing the NPBG samples is as follows:
① Wash and dry the surface of the gravel, and then;
② Lubricate the inner wall of the mold with petroleum jelly, and place a transparent plastic sheet tightly against the inner wall of the mold;
③ Weigh the required amount of gravel and pour it into a mixing container;
④ According to the gravel mass, take the designed polyurethane content of component A and component B, mix them together and stir for about 1 min, until the mixture becomes white in color;
⑤ After the polyurethane is prepared, pour it into the gravel evenly in two batches, and start mixing from the time when the surface of the gravel is completely enveloped by the polyurethane liquid. Stop stirring when the surface of the gravel is completely encapsulated;
⑥ Fill the mold with the NPBG mixture in four layers, and level the top surface of the sample before it is left to stand for 3 days.
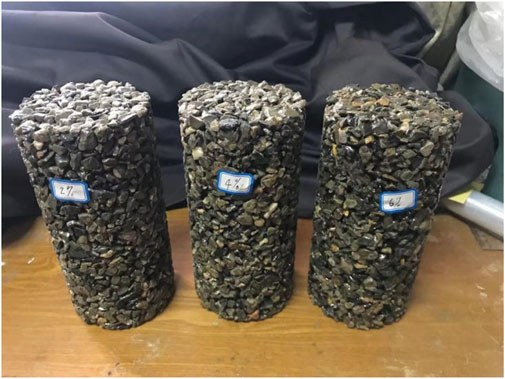
The specimens after removal from the mold are shown in Figure 1. It can be observed that the polyurethane binds the crushed stones into an integrated whole. Pure gravel specimens were also prepared as a comparison. Pure gravel specimens were filled into the pressure chamber of the testing instrument in four layers, ensuring the relative compaction ratio of 0.45.
2.3 Experiment procedure
The tests were conducted using consolidated drained tests. All samples were encased in a 0.5 mm thick rubber membrane to prevent damage during the test, which could lead to test failure. Before applying axial load, the samples were saturated and a predetermined confining pressure was applied while opening the drainage valve until the samples were consolidated. Four different confining pressures were selected for the tests: 50 kPa, 100 kPa, 200 kPa, and 300 kPa. The axial load was applied at an axial strain rate of 0.2%/min to prevent excessive pore pressure generation during shearing. The tests were terminated when the axial strain of the samples reached 15%. The volume change of the samples was determined by measuring the amount of water expelled from or absorbed into the pressure chamber.
2.4 Mechanical characteristics of NPBG
Figure 2 shows the deviatoric stress-axial strain (
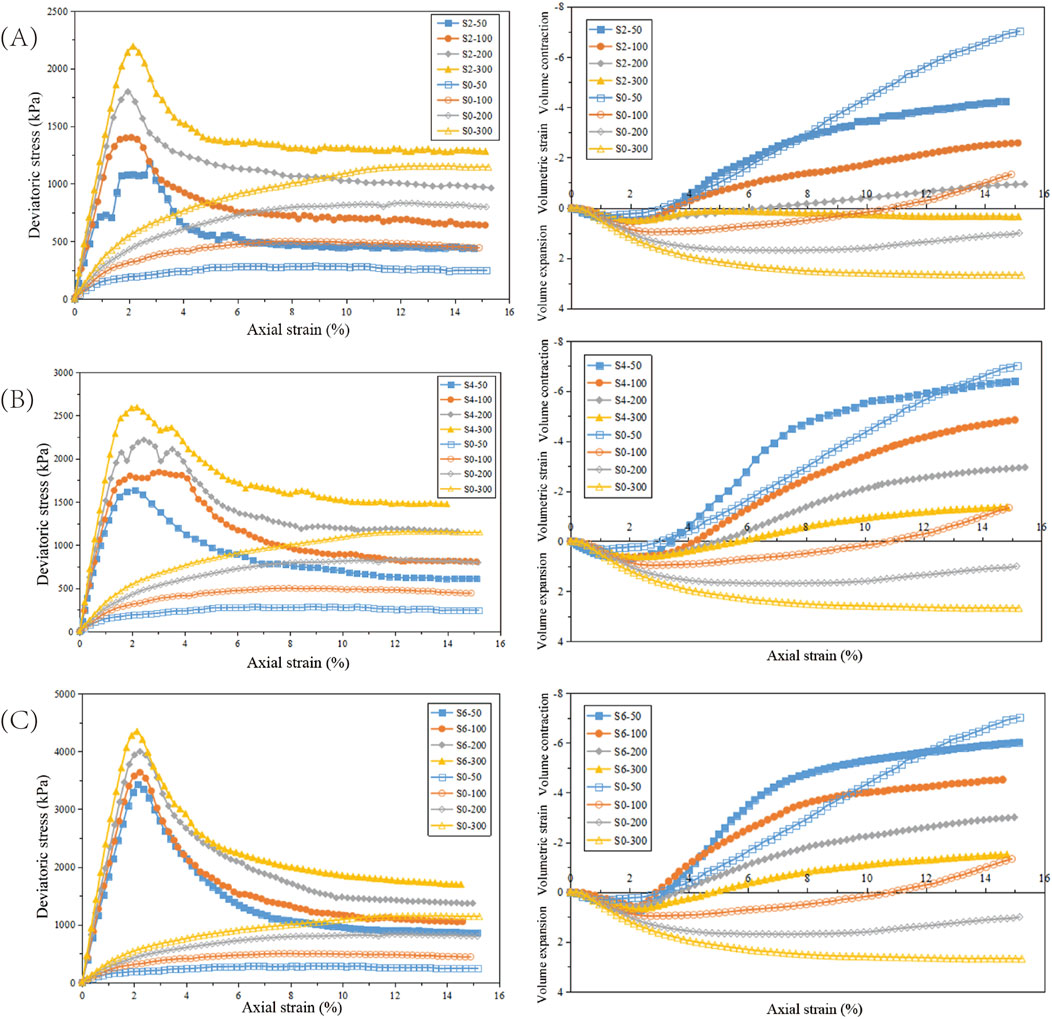
Figure 2. (A) The deviatoric stress-axial strain and volumetric strain-axial strain relationship curves for samples with polyurethane contents 2% under various confining pressures. (B) The deviatoric stress-axial strain and volumetric strain-axial strain relationship curves for samples with polyurethane contents 4% under various confining pressures. (C) The deviatoric stress-axial strain and volumetric strain-axial strain relationship curves for samples with polyurethane contents 6% under various confining pressures.
From the figure, it can be observed that with the increase in confining pressure, the deviatoric stress of the pure gravel samples increases under the same axial strain. At the two lower confining pressures, the samples exhibit less pronounced peak deviatoric stresses, whereas at the two higher confining pressures, no peak stress is observed, showing strain hardening behavior. From the volumetric strain curves, under the two lower confining pressures, the samples initially exhibit volume contraction with increasing axial strain, followed by volume expansion. When the confining pressure increases (≥200 kPa), the samples exhibit shear contraction. This indicates that the confining pressure significantly affects the shear characteristics of the gravel. At lower confining pressures, the resistance to shear forces primarily relies on the interlocking and frictional forces between gravel particles. As the external shear force gradually increases and overcomes the interlocking effect, leading to particle movement, the deviatoric stress reaches its peak. Following this, with an increase in strain, gravel particles begin to slide and rotate under shear forces, and the friction generated during particle movement becomes the main source of resistance to shear forces. At higher confining pressures, the gravel particles experience greater lateral confinement, and the voids between particles gradually decrease. During shear, the friction between particles continues to play a primary role in resisting shear forces, resulting in the deviatoric stress consistently showing a trend of gradual increase with increasing strain.
The NPBG samples exhibit a clear peak in deviatoric stress, showing pronounced strain softening regardless of the polyurethane content and confining pressure conditions. This phenomenon is primarily attributed to the bonding effect of polyurethane, which creates a cohesive strength similar to cohesion between gravel particles. A greater shear force is required to overcome the bonding and interlocking effects between the gravel particles. After reaching the peak deviatoric stress, particle movement gradually occurs, and thereafter, resistance to shear forces relies mainly on the friction between the gravel particles, eventually stabilizing as strain increases. Under different polyurethane contents and confining pressures, the axial strain corresponding to the peak deviatoric stress is approximately 2.1%. This indicates that the bonding force caused by polyurethane curing is a major factor influencing the increase in shear strength, primarily depending on the strength of the chemical reaction products of polyurethane. Changes in the thickness of the adhesive layer on the gravel surface and the uniformity of contact points between particles due to variations in polyurethane content significantly affect the magnitude of the peak deviatoric stress, but have little impact on the strain value at which the peak occurs. At the same polyurethane content, the peak value increases with the confining pressure. Additionally, there are significant differences in volumetric changes. Only when the polyurethane content is 2% and the confining pressure is 300 kPa do the samples exhibit a tendency for the volume to transition from contraction to expansion during shearing, followed by increased contraction, ultimately resulting in volume contraction. The remaining NPBG samples all undergo volume expansion, and at the same polyurethane content, the amount of expansion decreases with increasing confining pressure.
Observing samples with different polyurethane contents, it can be seen that the sample with a 4% content exhibits a relatively smooth curve near the peak deviatoric stress point, primarily due to the influence of the polyurethane bonding effect. At higher contents, the bonding effect is strong, and the sample maintains good integrity. After failure, the sample gradually fractures along the shear band, causing a rapid decrease in strength. At lower contents, the bonding effect is generally weaker. As the shear band forms, the bonds between gravel particles continuously fail, and the sample’s integrity is compromised, unable to maintain its original strength. However, at a 4% content, due to the inconsistency in the shape and size of the gravel particles, the bonding effect is also uneven. The weaker bonds near the shear band fail first, while the better bonds between particles remain intact, forming “gravel bonded blocks.” These blocks typically consist of several gravel particles, have a larger volume, and are less likely to move, which to some extent slows down the failure process of the sample, allowing it to maintain a high strength for some time after reaching the peak deviatoric stress.
To more clearly analyze the effect of polyurethane content on stress-strain behavior, the deviatoric stress-axial strain curves and volumetric strain-axial strain curves of samples under the same confining pressure were plotted, as shown in Figure 3. From the figure, it can be seen that under constant confining pressure, the strength of the samples increases with the increase of polyurethane content; especially when the polyurethane content increases from 4% to 6%, the peak deviatoric stress of the samples increases significantly. In the volumetric strain curves, as the polyurethane content increases from 2% to 6%, the volumetric expansion of the samples gradually increases. Additionally, it can be observed that when the polyurethane content is 2%, the volumetric change trend of the samples is most similar to that of the pure gravel samples. As mentioned earlier, at this content, the gravel particles in the samples disengage due to the failure of polyurethane bonding, and as axial compression increases, the number of detached particles gradually increases. Therefore, in the later stage of compression, the state of the samples is more similar to that of pure gravel samples. It is analyzed that the gravel particles can exhibit interlocking or rotational movement when subjected to shear. The former causes the particles to become more closely packed, resulting in a decrease in sample volume, while the latter has the opposite effect. The confining pressure can suppress the second type of movement. Under higher confining pressures, the gravel becomes more tightly packed, preventing an increase in sample volume. This also explains why the S2-300 sample ultimately exhibits volumetric contraction.
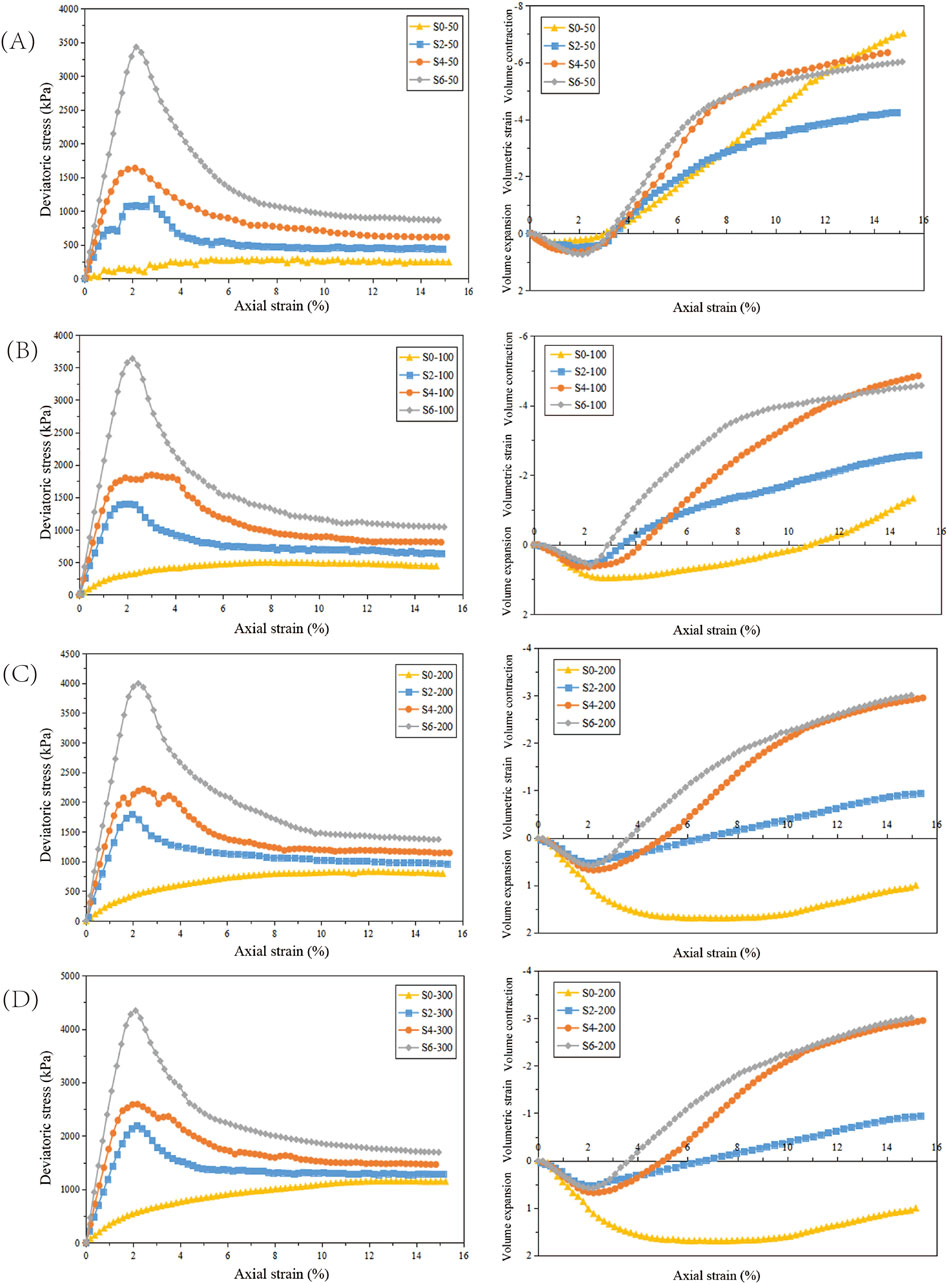
Figure 3. (A) The deviatoric stress-axial strain curves and volumetric strain-axial strain curves of samples under the Perimeter pressure 50 kPa. (B) The deviatoric stress-axial strain curves and volumetric strain-axial strain curves of samples under the Perimeter pressure 100 kPa. (C) The deviatoric stress-axial strain curves and volumetric strain-axial strain curves of samples under the Perimeter pressure 200 kPa. (D) The deviatoric stress-axial strain curves and volumetric strain-axial strain curves of samples under the Perimeter pressure 300 kPa.
Cohesion and internal friction angle are parameters that represent the shear strength of a material, which can be obtained by plotting the Mohr-Coulomb strength envelope. Figure 4 organizes the Mohr circles and strength envelopes for each group of samples at failure. It can be seen that the envelopes of the failure Mohr circles are essentially straight lines. Therefore, for NBPG materials, their strength can still be described using the Mohr-Coulomb strength criterion, and the strength parameters do not change with varying confining pressures.
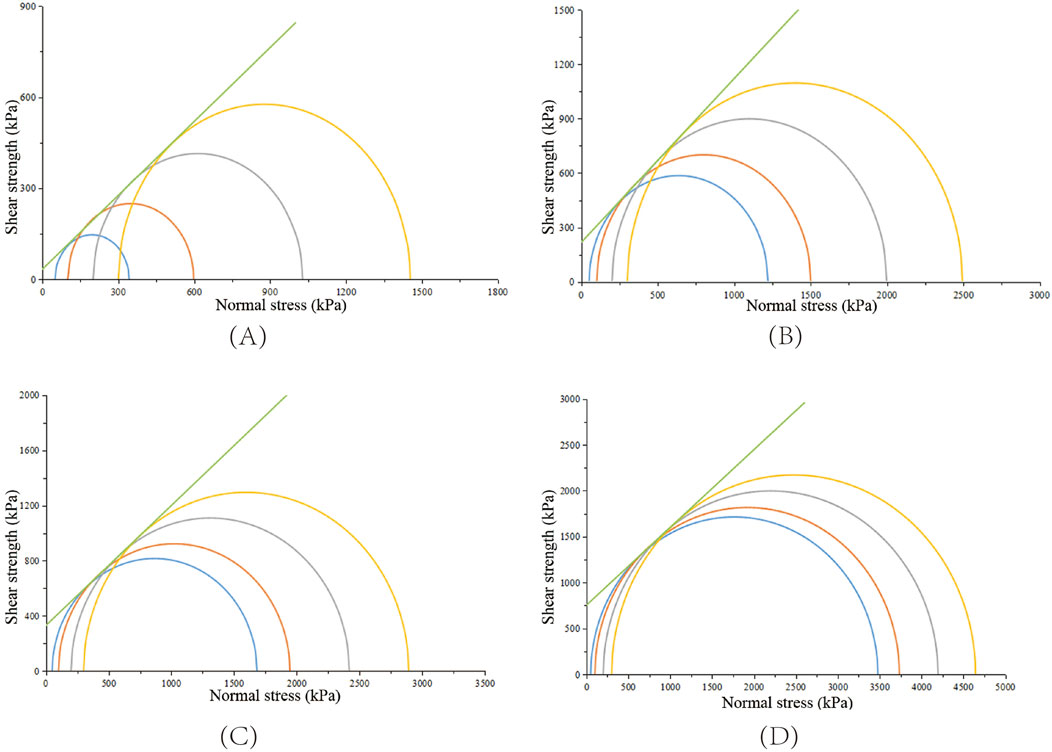
Figure 4. (A) The Mohr circles and strength envelopes for gravel of samples at failure. (B) The Mohr circles and strength envelopes for polyurethane contents 2% of samples at failure. (C) The Mohr circles and strength envelopes for polyurethane contents 4% of samples at failure. (D) The Mohr circles and strength envelopes for polyurethane contents 6% of samples at failure.
The effect of polyurethane content on strength parameters is shown in Figure 5. It can be observed that, compared to pure gravel samples, the cohesion of NPBG increases to varying degrees with the increase in polyurethane content. At a content of 2%, the bonding effect is already significant; when the content increases from 4% to 6%, the cohesion significantly improves, indicating that the 6% polyurethane mixture has the best bonding efficiency. Pure gravel samples also exhibit a small apparent cohesion. Generally, the cohesion of non-cohesive soil is considered to be zero, but the apparent cohesion in gravel is due to the interlocking force generated by the interlocking and embedding of gravel particles under axial load compression, which is fundamentally different from the cohesion of cohesive soil. Furthermore, the internal friction angle of NPBG is also higher than that of pure gravel, although the increase is smaller. As the polyurethane content increases from 2% to 6%, the internal friction angle gradually decreases. The internal friction angle decreases with the increase in polyurethane content, primarily because as the polyurethane content increases, the thickness of the polyurethane covering on the surface of the gravel gradually increases, making the surface smoother and more even. This, to some extent, reduces the interlocking and friction between the gravel particles.
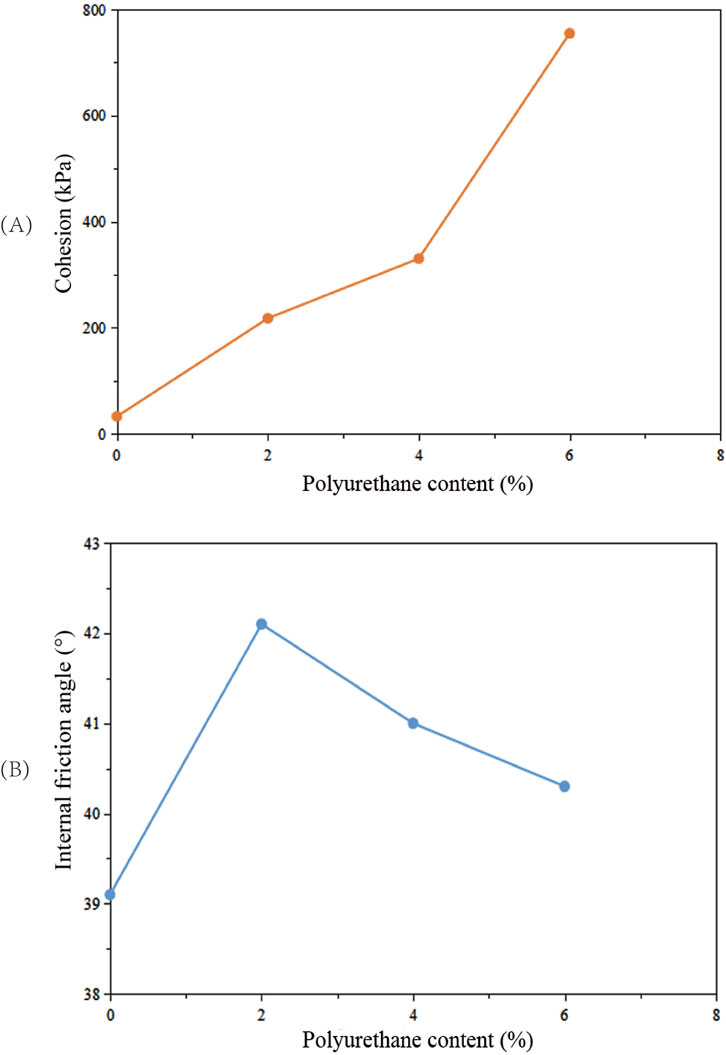
Figure 5. (A) The effect of polyurethane content on cohesion. (B) The effect of polyurethane content on internal friction.
3 Numerical modelling
3.1 Details of the selected case history
To validate the finite element numerical model, this study utilizes an engineering example of a reinforced embankment project as reported by Liu et al. [32]. The cross-sectional diagram of the embankment and soil layers is depicted in Figure 6A. The distribution of soil layers on the site, from top to bottom, includes: 1.5 m of coarse-grained fill soil, 2.3 m of silty clay, 10.2 m of silty clay with silt and sludge, 2 m of loam, and 9 m of sandy silt. The groundwater level is located 1.5 m below the ground surface. The top width of the embankment is 35 m, with a slope ratio (ratio of vertical height to horizontal width) of 1:1.5. The embankment is to be filled to a height of 5.6 m within 55 days, with the graded loading curve shown in Figure 6B. Fly ash is the primary material for embankment filling, and a layer of crushed stone bedding, 0.5 m thick, is placed between the embankment fill and the subgrade soil. In the center of the bedding layer, a geogrid is installed with a strength of 90 kN/m and a maximum allowable strain of 8%. The piles used are cast-in-situ concrete thin-walled pipe piles arranged in a square pattern with a spacing of 3 m. The area replacement ratio is approximately 8.7%. The piles have an outer diameter of 1 m, a wall thickness of 120 mm, and a length of 16 m, with the pile ends placed on the sandy loam layer.
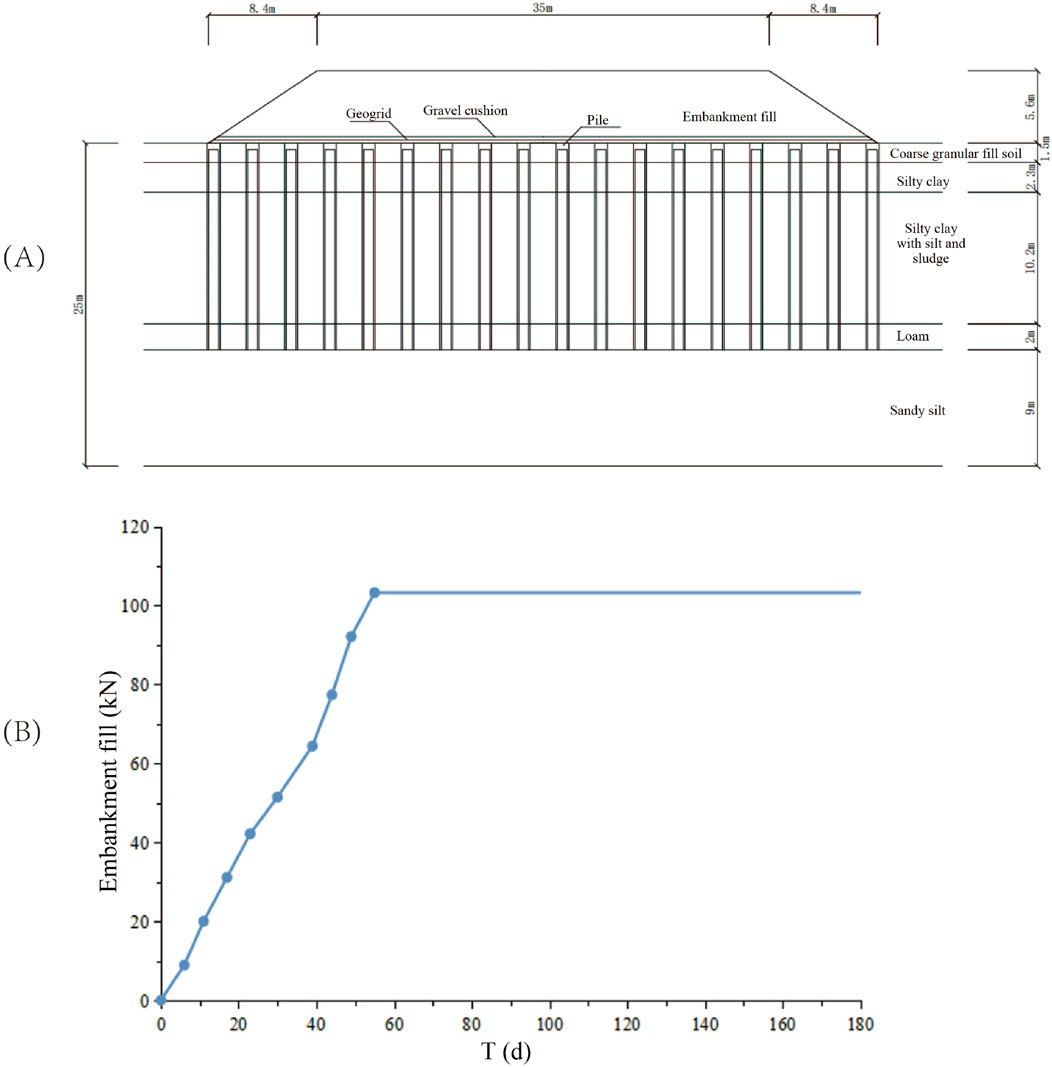
Figure 6. (A) The cross-sectional diagram of the embankment. (B) The graded loading curve of the embankment.
The observation of the pile-supported reinforced embankment utilized a series of instruments including settlement plates, soil pressure cells, and pore pressure gauges. These instruments monitored the settlement of the embankment surface at pile tops and between piles, as well as vertical pressures. Changes in pore water pressures at various depths in the foundation were also recorded. The monitoring began from the start of embankment construction and continued for 180 days.
3.2 Three-dimensional numerical modeling
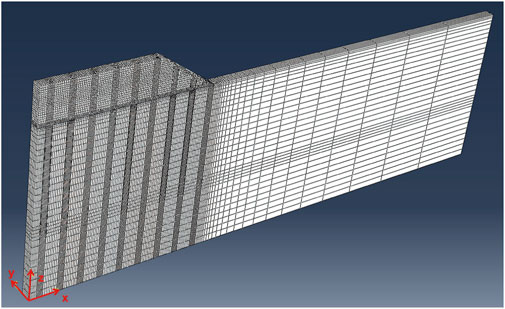
The study is based on three-dimensional finite element modeling of a pile-supported reinforced embankment test using ABAQUS software, analyzing the load-bearing characteristics of pile-soil interaction during the embankment filling process. Considering the symmetry of the cross-section in this case, half of the embankment along the transverse section and one row of piles along the longitudinal direction with half of their surrounding soil were modeled to establish a three-dimensional half-embankment model. The finite element mesh division of the model is shown in Figure 7. The model assumes a foundation depth of 25 m with a rigid impermeable layer assumed below. To mitigate boundary effects, the total width of the analysis area is set to 77.7 m, which is three times the half-width of the embankment base width.
In the FEM model, materials with good drainage capability (e.g., coarse granular fill soil), non-draining materials (e.g., concrete), and materials above the groundwater level that do not require consideration of permeability (embankment fill soil, stone bedding layer) are simulated using 8-node solid elements (C3D8) without considering pore pressure degrees of freedom. The remaining foundation soils are modeled using 8-node coupled solid-fluid elements (C3D8P) to account for stress-pore pressure coupling effects. The geogrid material is simulated using 4-node 3D membrane elements (M3D4). Three types of mesh sizes were used for comparative calculations: a coarse mesh (approximately 25,000 elements), a medium mesh (approximately 50,000 elements), and a fine mesh (approximately 75,000 elements). The relative error of the calculation results was less than 1.4%. Therefore, the medium mesh model was ultimately chosen for the subsequent calculations and analyses in this paper.
3.3 Material models and parameters
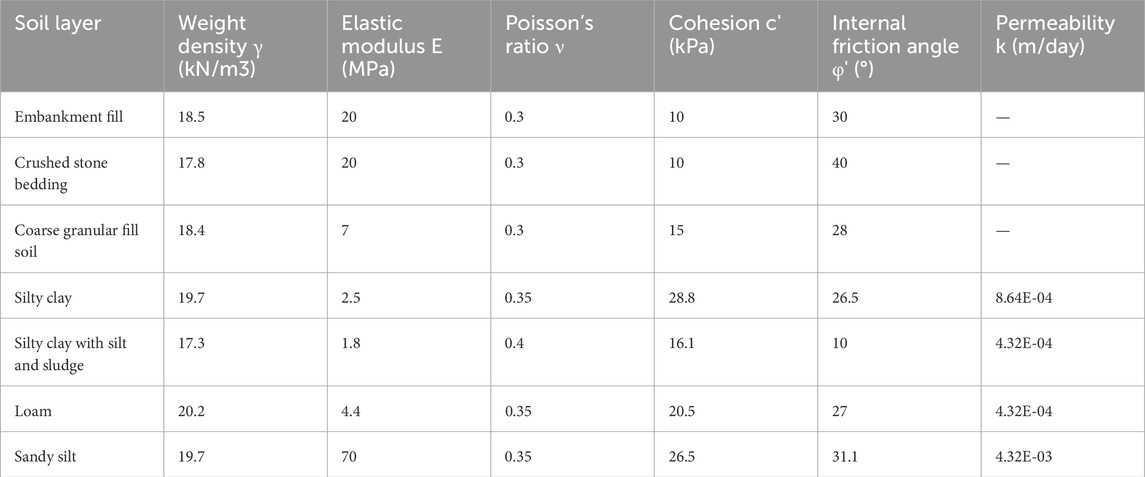
In the computational model, the concrete piles are simulated using a linear elastic constitutive model with an elastic modulus of 20 GPa and a Poisson’s ratio of 0.2. The interface between piles and soil is modeled using zero-thickness contact elements. The geogrid is also assumed to be a linear elastic material capable of resisting only tension, with a tensile stiffness of 1,180 kN/m and a Poisson’s ratio of 0.3. Despite the simplified soil model having limitations, the ideal elastoplastic Mohr-Coulomb model has been successfully applied in many geotechnical studies [33]. The Mohr-Coulomb model can approximate soil behavior similarly to advanced soil models [34]. Therefore, the embankment fill, stone bedding layer, and various layers of subsoil are all simulated using this model. Parameters for each material are summarized in Table 1, with a shear dilation angle set at 0.1°.
3.4 Verification of numerical modeling
The comparison between field-measured settlement values and numerical simulation results for the surface settlement variation of composite foundations is shown in Figure 8. Here,
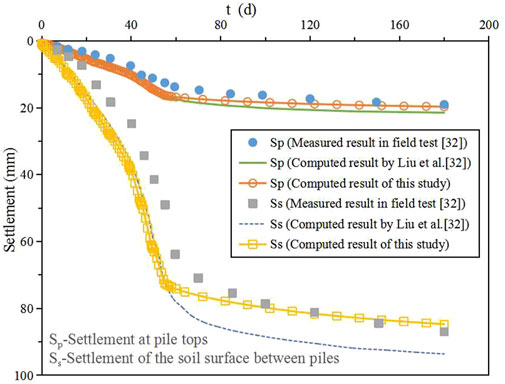
Figure 8. The comparison between field-measured settlement values and numerical simulation results for the surface settlement variation of composite foundations.
The comparison between field-measured soil pressure values and numerical simulation results for the surface of the foundation is shown in Table 2. According to the table, at the end of embankment construction, the computed soil pressure at pile tops in this study is slightly higher than the measured values by 1.2%, and slightly lower than Liu’s computed results by 0.3%. Meanwhile, at the surface between piles, there is a larger discrepancy between the computed soil pressure values of this study and the measured values, possibly due to some tilting of the soil pressure box between piles during the filling process, resulting in deviations from the actual conditions. Comparing with Liu’s computed values shows an error of only 4.0%, indicating relatively close agreement. Therefore, the model calculations in this study are in good agreement with the field measurements, indicating that the numerical model can simulate the actual engineering conditions fairly accurately. The model design is rational, and it exhibits good reliability.

Table 2. The comparison between field-measured soil pressure values and numerical simulation results for the surface of the composite foundation.
3.5 Comparative modelling procedure
To analyze the working characteristics of NPBG porous piles under the embankment, the aforementioned modeling method was used to establish finite element models for concrete piles, polyurethane gravel piles, cement-mixed piles, and gravel piles. The performance of these four types of piles was compared in terms of ground surface settlement, stress state of piles and soil, and changes in excess pore water pressure in the foundation soil. The study analyzed the role of non-foamed polyurethane gravel piles in foundation reinforcement, highlighting their high bearing capacity and good drainage properties. For better comparative analysis, the external dimensions and arrangement of the four types of piles were kept the same: the solid pile diameter was 0.65 m, the pile spacing was 1.95 m, and other parameters such as foundation soil and embankment characteristics were consistent with the original numerical model.
The material parameters of the four types of pile bodies are shown in Table 3. The material parameters for the concrete piles are consistent with those mentioned earlier. NPBG with 6% polyurethane content and gravel without polyurethane are selected as the pile body materials for NPBG porous piles and gravel piles, respectively, and these material parameters are determined based on the triaxial test results mentioned above/. The modulus parameters of the NPBG porous pile were determined based on the stress-strain test results of NPBG with 6% polyurethane content under a confining pressure of 100 kPa, specifically using the tangent modulus, and the permeability coefficient of the NPBG porous pile is based on parameters measured in permeability tests [35]. The material parameters for the cement-mixed piles are determined with reference to the literature by Zhu [36]. From the table, it can be observed that compared to concrete piles, the strength and stiffness of the polyurethane gravel piles, cement-mixed piles, and gravel piles are significantly lower. Therefore, it cannot be assumed that these piles remain in an elastic state throughout the loading process, and the Mohr-Coulomb model is adopted for simulation. Additionally, these three types of piles have certain drainage capabilities, so 8-node stress-pore pressure coupled solid elements (C3D8P) are used for simulation. The embankment construction process is the same as described earlier. After the embankment is completed, the foundation soils enter the consolidation phase. Consolidation is considered complete, and the foundation settlement is stabilized when the excess pore water pressure is less than 1 kPa.
4 Results
4.1 Excess pore water pressure
Considering the low permeability coefficient and the weak, easily deformable nature of the silty clay layer, significant excess pore water pressure is expected to accumulate within this soil layer. The excess pore water pressure values are compared at the surface of this layer (at a depth of 4.7 m in the foundation) and at a deeper level (at a depth of 12.1 m in the foundation). Additionally, the changes in excess pore water pressure within the soil layer at the pile tip (at a depth of 20 m in the foundation) are analyzed, a depth beyond the length of the piles.
Figure 9 shows the variation curves of excess pore water pressure at different depths in the subsoil under the middle of the embankment. It can be seen that the excess pore water pressure variations along the depth are different for various piles. From the depth of 4.7 m–12.1 m to 20 m, the peak excess pore water pressure in the concrete pile reinforced foundation gradually increases, while in the cement-mixed pile reinforced foundation, the excess pore water pressure first increases and then decreases.
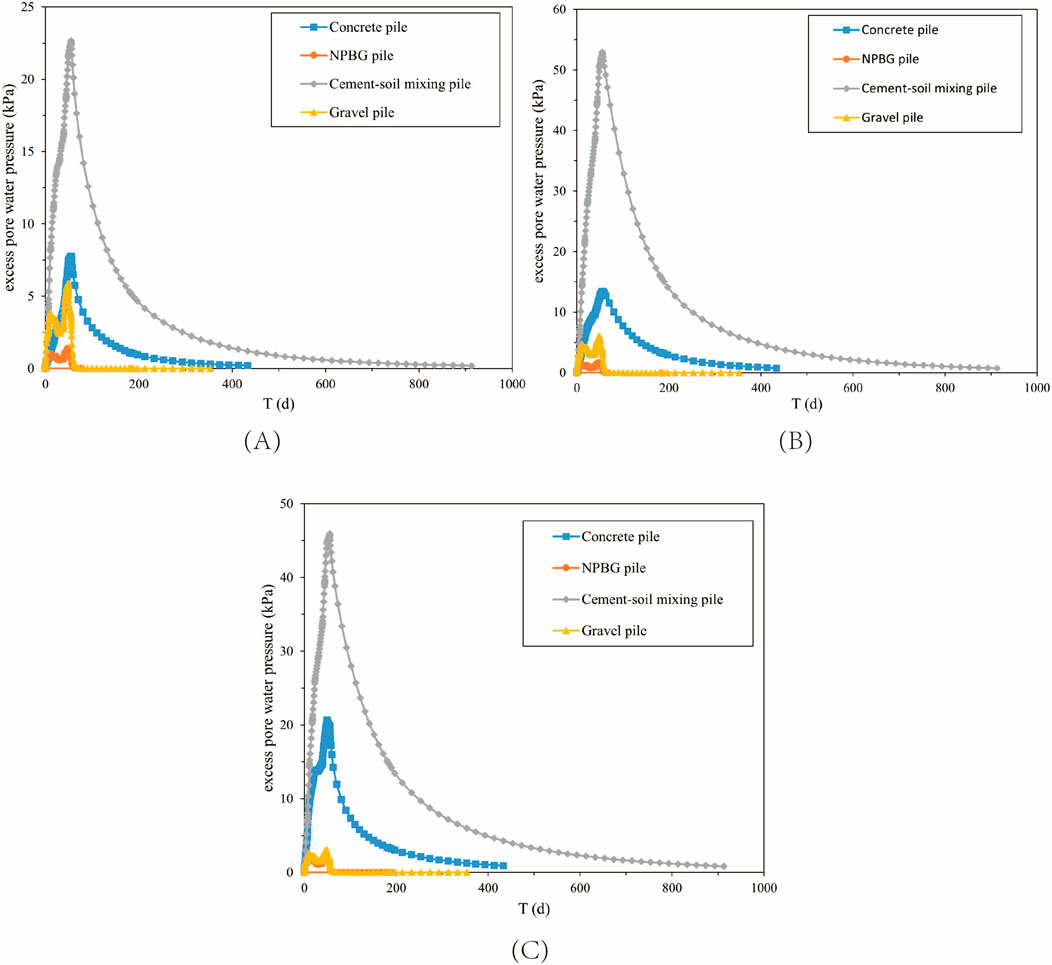
Figure 9. (A) The variation curves of excess pore water pressure at 4.7 m in the subsoil under the middle of the embankment. (B) The variation curves of excess pore water pressure at 12.1 m in the subsoil under the middle of the embankment. (C) The variation curves of excess pore water pressure at 20 m in the subsoil under the middle of the embankment.
Concrete piles are impermeable, so the pore water in the soil needs to be discharged from the surface of the foundation soil. At a depth of 4.7 m, the drainage path is short, and the excess pore water pressure dissipates quickly. Correspondingly, at a depth of 12.1 m, the drainage path is longer, and the peak excess pore water pressure increases compared to that at 4.7 m. Additionally, due to the high stiffness of concrete piles, more embankment load is transmitted through the piles to the soil layer at the pile tip, resulting in a higher excess pore water pressure at a depth of 20 m.
In contrast, in the cement-mixed pile reinforced foundation, the soil between the piles bears more of the upper load, generating higher excess pore water pressure at a depth of 12.1 m, while lower excess pore water pressure occurs in the soil layer at the pile tip. Moreover, due to the higher permeability coefficient of the soil at the pile tip, the pore water pressure dissipates relatively quickly, resulting in the maximum excess pore water pressure appearing in the deeper soil between the piles.
The load-bearing behavior of the soil in the NPBG porous pile reinforced foundation is similar to that in the cement-mixed pile reinforced foundation. However, the NPBG porous piles have good drainage capability, allowing pore water to be discharged horizontally through the pile body within the pile length range. As a result, the peak excess pore water pressures at depths of 4.7 m and 12.1 m are both very low. However, at a depth of 20 m, beyond the pile length, the drainage distance increases, and the peak excess pore water pressure slightly increases.
The situation is different for the gravel pile reinforced foundation. In the bearing layer area, the distribution of excess pore water pressure along the depth is similar to that of the NPBG porous pile reinforced foundation. However, unlike the latter, gravel piles are discrete material piles with lower stiffness, leading to a higher load-bearing capacity of the soil between the piles. Therefore, the peak excess pore water pressure in the soil between the piles is significantly higher. Due to the difficulty of transmitting the upper load to the deeper foundation, the excess pore water pressure in the soil layer at a depth of 20 m is significantly reduced compared to that in the soil between the piles.
It can also be observed from the figure that after the construction is completed, the dissipation of excess pore water pressure is a relatively slow process in the cement-mixed pile reinforced foundation and the concrete pile reinforced foundation, whereas in the NPBG porous pile reinforced foundation and the gravel pile reinforced foundation, the dissipation occurs more rapidly. This difference is mainly influenced by the drainage capacity of the piles.
Figure 10 shows the variation curves of excess pore water pressure with depth at the toe of the slope. Compared with the excess pore water pressure in the foundation soil at the center of the road, it is not difficult to find that the peak values of excess pore water pressure at various depths at the toe of the slope in both the concrete pile reinforced foundation and the cement-mixed pile reinforced foundation are significantly reduced. This is because the foundation soil at the toe of the slope is subjected to much smaller embankment loads compared to the center of the road. However, in the NPBG porous pile reinforced foundation and the gravel pile reinforced foundation, the excess pore water pressure slightly increases, but the dissipation rate of pore pressure slows down.
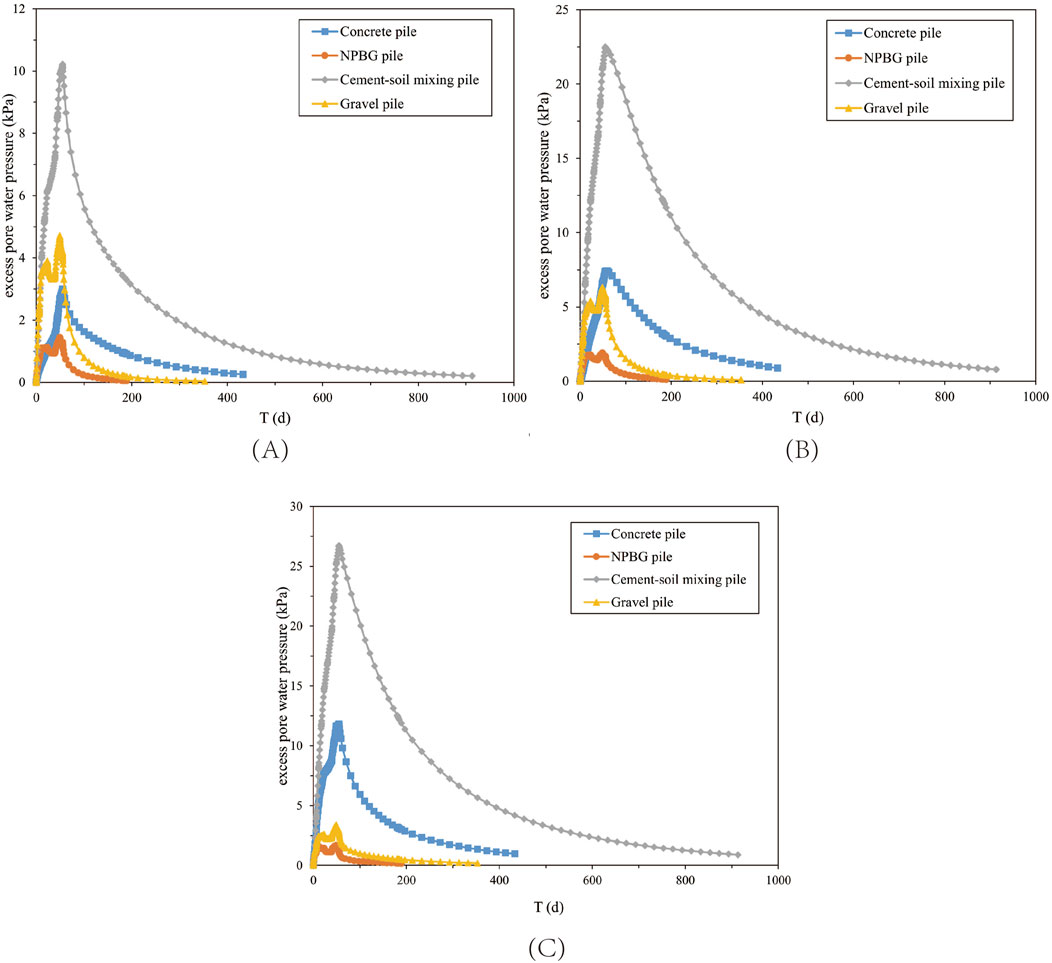
Figure 10. (A) Variation curve of excess pore water pressure at 4.7 m depth of foundation soil at the foot of slope. (B) Variation curve of excess pore water pressure at 12.1 m depth of foundation soil at the foot of slope. (C) Variation curve of excess pore water pressure at 20 m depth of foundation soil at the foot of slope.
The analysis suggests that the foundation soil at the toe of the slope is simultaneously subjected to both vertical and lateral forces, causing the soil to move outward from the embankment and increase the distance between the soil and the piles. This effectively lengthens the drainage path, weakening the effect of the pile’s drainage capacity on the soil, making it more difficult for the excess pore water pressure to dissipate. For the NPBG porous pile composite foundation, the excess pore water pressure in the foundation remains at a relatively low level, having little impact on the consolidation time. In contrast, for the gravel pile reinforced foundation, the consolidation time of the foundation soil at the toe of the slope is significantly extended.
The above analysis indicates that the presence of piles with good drainage capacity in the reinforced foundation can effectively promote the dissipation of excess pore water pressure throughout the foundation soil, thereby accelerating the consolidation of the foundation. However, if the piles have low stiffness (such as gravel piles), it can result in the accumulation of larger excess pore water pressures in the foundation, which also slows down the overall consolidation process of the foundation. Only when the piles in the reinforced foundation possess both sufficient stiffness and good drainage capacity can the time required for the reinforced foundation to complete consolidation be most effectively shortened.
According to Rowe’s research [37], if an embankment is constructed too quickly on a soft clay foundation, the soil may lose strength due to the accumulation of large excess pore water pressure. Therefore, the embankment construction rate should be controlled within a certain range to avoid insufficient bearing capacity of the foundation soil. For this purpose, a reference indicator, the pore water pressure coefficient Bm, is proposed. It is defined as the ratio of the maximum increment of excess pore water pressure to the increment of vertical total stress. The closer this coefficient is to zero, the better the stability of the foundation during embankment construction. Conversely, the larger the coefficient, the poorer the stability of the foundation. In this study, the maximum excess pore water pressure occurs around the time the embankment construction is completed. The increment of vertical total stress is taken as the vertical stress at the surface of the soil between the piles when the construction is finished. The pore water pressure coefficients corresponding to the four types of reinforced foundations are shown in Table 4.
As shown in the table, the pore water pressure coefficients in the concrete pile reinforced foundation and the cement-mixed pile reinforced foundation are at a very high level, especially for the cement-mixed pile reinforced foundation, where the coefficient approaches 1. This indicates that most of the upper load is converted into excess pore water pressure, with a smaller proportion of the load borne by the soil skeleton, which is likely to cause instability in the reinforced foundation. In contrast, the pore water pressure coefficients in the NPBG porous pile reinforced foundation and the gravel pile reinforced foundation are 0.02 and 0.04, respectively, values close to 0. This indicates that the pore pressure can dissipate promptly and that the additional upper load has largely been converted into effective stress within the soil. Thus, if the embankment construction speed is fast, the likelihood of bearing capacity failure is much higher for the concrete pile reinforced foundation and the cement-mixed pile reinforced foundation compared to the NPBG porous pile reinforced foundation and the gravel pile reinforced foundation. From the perspective of the pore water pressure coefficient, a longer construction period should be designed for the former two to ensure the stability of the reinforced foundation. Conversely, even with a continuous embankment construction plan, the pore water pressure coefficient for the latter two can remain very low, making the likelihood of bearing capacity failure quite small. Therefore, for projects requiring continuous embankment construction or with short construction periods, using NPBG porous piles for foundation treatment offers significant advantages over using concrete piles, cement-mixed piles, and gravel piles.
4.2 Settlement
Figures 11A,B show the settlement curves over time for the pile and the soil between piles at the surface of the reinforced foundation. From the figures, it can be seen that during construction, the settlement of both the pile top and the soil surface between piles increases rapidly due to the gradually increasing embankment load. After construction is completed and the embankment load no longer increases, the settlements of the pile top and the soil surface between piles in the NPBG porous pile reinforced foundation and the gravel pile reinforced foundation also almost stop increasing. In the concrete pile reinforced foundation and the cement-mixed pile reinforced foundation, the settlements of the pile top and the soil surface between piles slow down with the consolidation of the foundation soil and eventually stabilize. This indicates that the foundation soils in the NPBG porous pile reinforced foundation and the gravel pile reinforced foundation consolidate quickly, while the concrete pile reinforced foundation and the cement-mixed pile reinforced foundation require a longer consolidation period to achieve settlement stability. Furthermore, regardless of whether it is the settlement at the pile top or the soil surface between piles, the final settlement amounts in ascending order are: concrete pile, NPBG porous pile, cement-mixed pile, and gravel pile. This shows that under the same embankment load, the stiffness of the pile is the main factor determining the final settlement amount of the foundation.
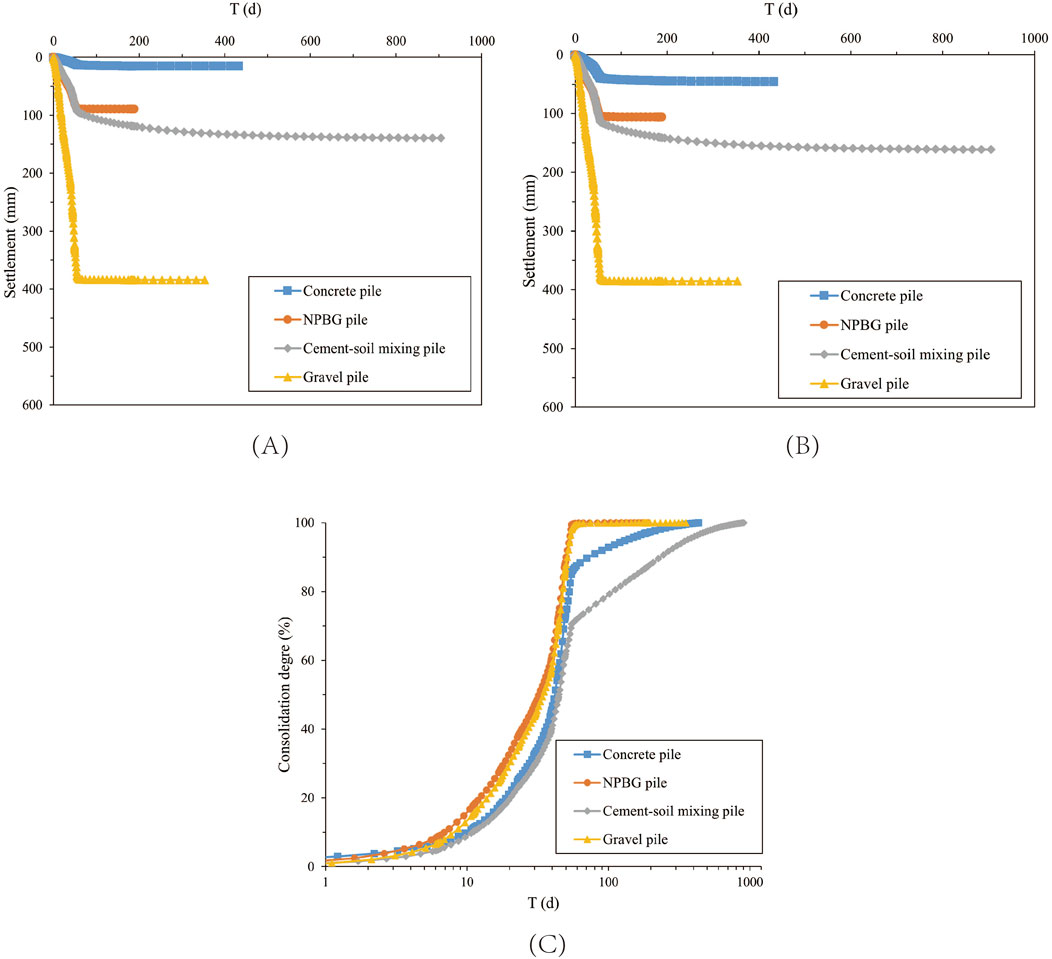
Figure 11. (A) The settlement curves over time for the pile. (B) The settlement curves over time for the soil between piles at the surface. (C) The variation of consolidation degree of the foundation surface with time.
The Figure 11C shows the variation of consolidation degree of the foundation surface with time, providing a more intuitive comparison of the settlement process of reinforced foundations. The consolidation degree is defined as the ratio of settlement at a certain moment to the final settlement of the foundation surface. The results indicate that due to the lack of drainage capability or weak drainage capability of the concrete pile and cement-mixed pile, these two types of reinforced foundations exhibit lower consolidation degrees at any given moment. In contrast, the NPBG porous pile and gravel pile, which have good drainage capability, show higher consolidation degrees at any given moment. This also demonstrates that the drainage capability of pile bodies in reinforced foundations significantly influences the consolidation speed of the reinforced foundations.
Post-construction settlement refers to the settlement of the embankment from the end of construction until stabilization, which is an important criterion in road embankment design. Excessive post-construction settlement can adversely affect the normal operation of the road. The calculated results of post-construction settlement in this study are shown in Table 5, where the post-construction settlement ratio is defined as the ratio of settlement at the central top of the embankment to the total settlement. Based on the table, it is evident that the embankment supported by NPBG porous piles not only has relatively smaller total settlement at the top of the embankment but also exhibits significantly lower post-construction settlement and post-construction settlement ratio compared to the other three types. While the embankment supported by concrete piles shows the smallest total settlement, its post-construction settlement ratio is relatively high. The embankment supported by gravel piles has the largest total settlement, although its post-construction settlement ratio is smaller, the numerical value is larger. The embankment supported by cement-mixed piles has a much larger post-construction settlement and post-construction settlement ratio than the other three types. These results indicate that when the pile has good permeability, more than 95% of the embankment’s settlement occurs during construction, which is beneficial for controlling post-construction settlement. Conversely, when the pile has weaker or no permeability, a significant portion of settlement occurs after construction, requiring a longer period for consolidation settlement to stabilize.
Therefore, when piles in reinforced foundations have certain stiffness but poor or weak drainage capabilities (such as concrete piles and cement-mixed piles), it is advantageous for reducing total settlement of the foundation. However, the consolidation rate of the foundation is slower, leading to relatively higher post-construction settlement of the embankment and delaying the time for the embankment to be put into use. On the other hand, when piles in reinforced foundations have good drainage capabilities but lower stiffness (such as gravel piles), the consolidation rate of the foundation is faster, resulting in relatively smaller post-construction settlement of the embankment. However, the total settlement of the foundation increases significantly, often requiring additional fill material to achieve the desired height, thereby increasing construction costs.
However, NPBG porous piles combine certain stiffness with excellent drainage capabilities. Using this type of pile to handle the foundation can effectively control total settlement of the foundation while significantly reducing post-construction settlement of the embankment. This approach has a notable impact on shortening embankment construction time, reducing costs, and ensuring the normal use of the embankment.
4.3 Pile-soil stress and soil arching effect
Figures 12A,B depict the variation of stress at pile tops and at the surface of the pile-intermediate soil with time, respectively. During the embankment filling process, as the embankment load increases, both the stress at pile tops and at the surface of the pile-intermediate soil gradually increase, with the stress at pile tops increasing much faster than that at the surface of the pile-intermediate soil. After construction is completed, in the concrete pile reinforced foundation and cement-mixed pile reinforced foundation, the stress at pile tops continues to increase but with a smaller rate of increase, while the stress at the surface of the pile-intermediate soil shows a decreasing trend, eventually stabilizing. In contrast, in the NPBG porous pile reinforced foundation and gravel pile reinforced foundation, both the stress at pile tops and at the surface of the pile-intermediate soil remain almost unchanged. From the stable state, it can be concluded that for piles with higher stiffness, the stress at pile tops is higher and the stress at the surface of the pile-intermediate soil is lower. Conversely, for piles with lower stiffness, the stress at pile tops is lower and the stress at the surface of the pile-intermediate soil is higher.
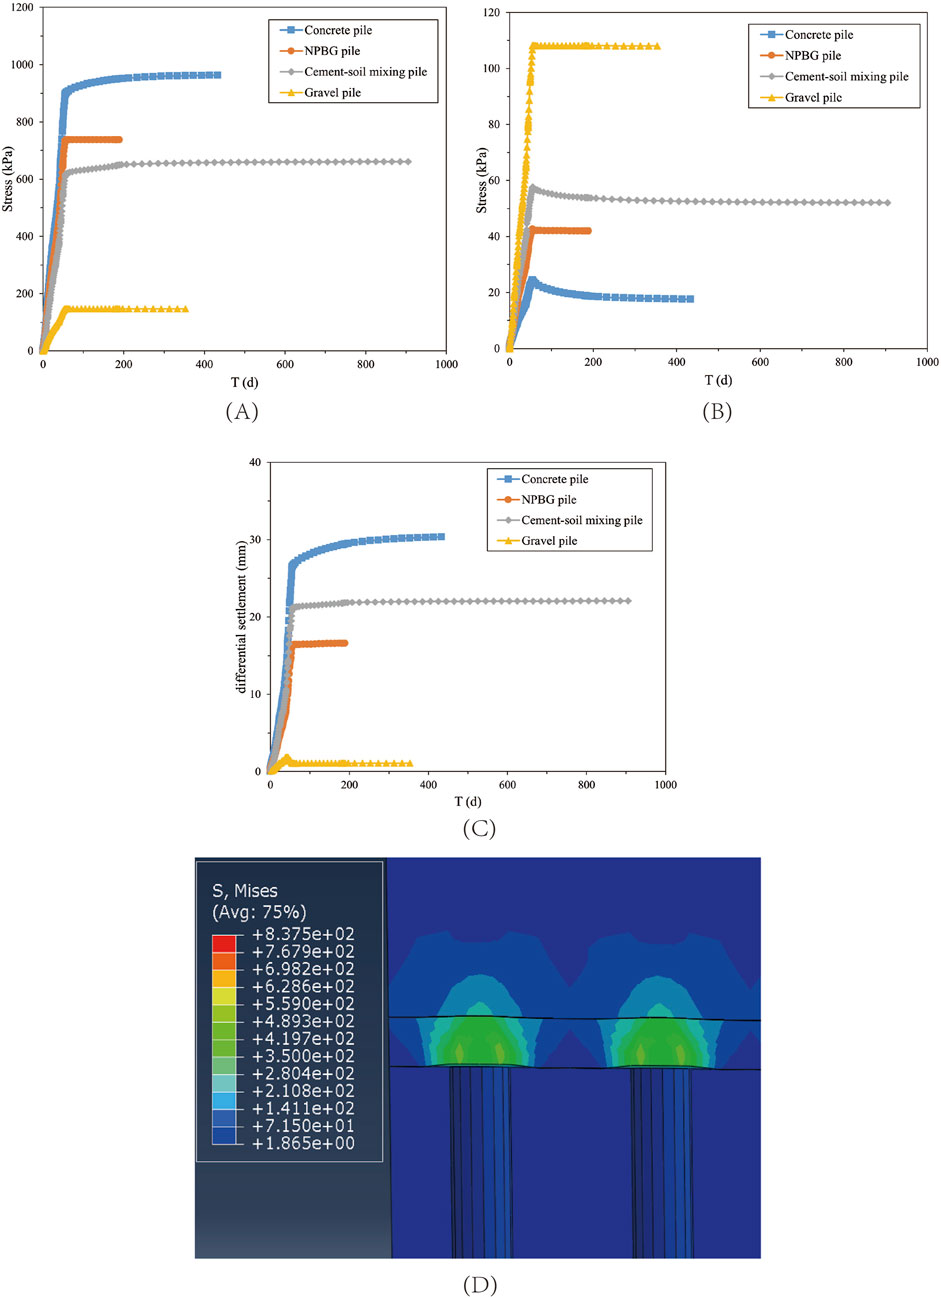
Figure 12. (A) The variation of stress at pile tops with time. (B) The variation of stress at the surface of the pile-intermediate soil with time. (C) The differential settlement caused by the varying stiffness between piles and soil modulus. (D) Stress concentration at the top of the pile.
After construction is completed, the decrease in stress at the soil-pile interface can be attributed to the arching effect in soil. Generally, when soil experiences uneven deformation, there exists a shear friction between regions with different deformation extents. This shear friction tends to resist further movement in areas with larger deformations while promoting greater deformation in regions with lesser deformations. Therefore, the differential settlement caused by the varying stiffness between piles and soil modulus is attributed to the arching effect, as illustrated in Figure 12C.
The occurrence of differential settlement causes a downward displacement tendency of the embankment fill above the soil between piles compared to the fill above the pile tops. The embankment fill has a certain shear strength, which results in downward shear stresses acting on the fill above the piles. Through these shear stresses, a portion of the embankment load above the soil between piles transfers to the piles themselves, thereby redistributing the embankment load between piles and the soil between them. This redistribution reduces the load carried by the soil between piles and increases the load carried by the piles, as depicted in Figure 12D. After construction, as the soil continues to consolidate, the settlement of the soil between piles increases, amplifying the differential settlement between piles and soil. This promotes the development of soil arching effects within the embankment, explaining why the stress at the soil-pile interface above the soil between piles gradually decreases after construction in concrete pile reinforced foundations and cement mixed pile reinforced foundations. As discussed earlier, in polyurethane gravel pile reinforced foundations and gravel pile reinforced foundations, the settlement of the foundation soil mainly occurs during the embankment construction period. This indicates that the soil between piles consolidates rapidly during this period, promptly transferring a portion of the load it bears to the pile tops, thus reducing the potential for foundation soil damage.
Figure 13A shows the variation of the pile-to-soil stress ratio in foundations over time. From the information in the figure, it can be seen that due to the soil arching effect, as the height of the embankment increases, the differential settlement between the piles and soil also increases, leading to a gradual increase in the pile-to-soil stress ratio for concrete pile reinforced foundations, NPBG porous pile reinforced foundations, and cement mixed pile reinforced foundations.
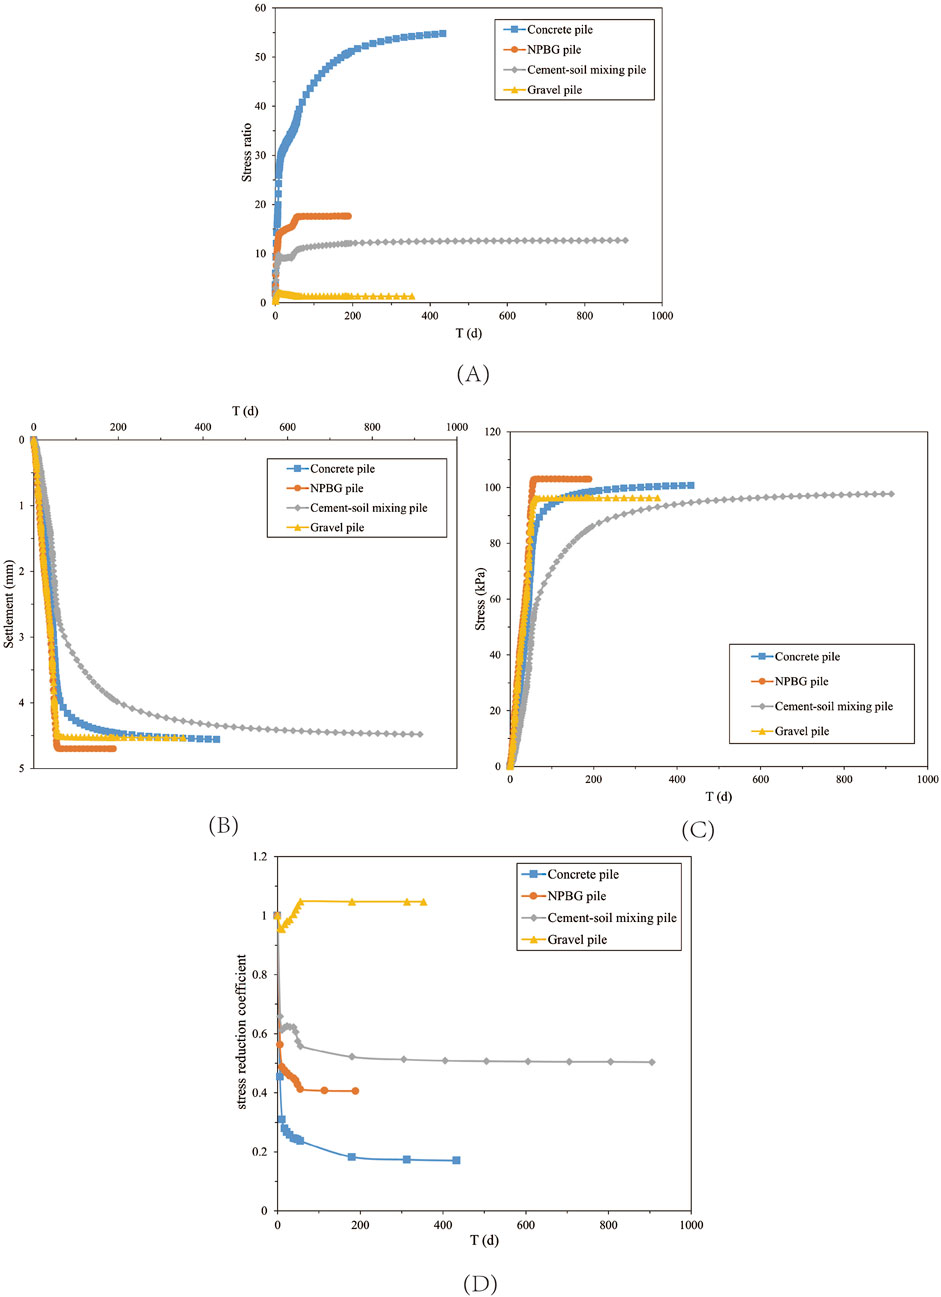
Figure 13. (A) The variation of the pile-to-soil stress ratio over time. (B) The variation of additional stress over time for the soil at the pile end (at a depth of 20 meters). (C) The variation of settlement over time for the soil at the pile end (at a depth of 20 meters). (D) The variation curve of the stress reduction coefficient over time.
However, for gravel pile reinforced foundations, the pile-to-soil stress ratio gradually increases before the embankment height reaches 1.1 m. After the embankment height exceeds 1.1 m, the pile-to-soil stress ratio first decreases rapidly and then gradually stabilizes. This is because the strength of the gravel piles is relatively low, and when the upper load reaches a certain value, the piles are unable to bear additional loads, causing some of the load to transfer to the soil.
After the construction is completed, the pile-to-soil stress ratio continues to increase and eventually stabilizes for concrete pile reinforced foundations and cement mixed pile reinforced foundations. In contrast, the pile-to-soil stress ratio for NPBG porous pile reinforced foundations and gravel pile reinforced foundations remains relatively unchanged.
Figures 13B,C illustrate the variation of additional stress and settlement over time for the soil at the pile end (at a depth of 20 m). It can be observed that at this depth, the NPBG porous pile reinforced foundation experiences the highest additional stress and the most significant settlement. The concrete pile reinforced foundation shows slightly lower values for both, while the gravel pile reinforced foundation has the lowest values. In the cement-mixed pile reinforced foundation, both values are slightly higher than those in the gravel pile reinforced foundation. This indicates that in the NPBG porous pile reinforced foundation, more embankment load can be transmitted through the piles to the relatively firm soil layer at the pile end, resulting in greater settlement of the pile end soil. Consequently, this reduces the load borne by the soil in the reinforced area, leading to less compression of the soil layers in the reinforced zone and manifesting as smaller differential settlement between the piles and soil on the surface of the foundation.
The degree of development of the soil arching effect is a crucial issue in the design of pile-supported reinforced embankments. This study uses the stress reduction coefficient as an indicator to evaluate the strength of the soil arching effect [32]. The expression for the stress reduction coefficient is shown in Equation 1:
where
The value of the stress reduction coefficient generally ranges from 0 to 1. When
From the figure, it can be seen that the stress reduction coefficient shows varying degrees of decrease at the beginning of the construction, indicating that the soil arching effect starts to act when the differential settlement between the piles and the soil is still small. As mentioned earlier, the NPBG porous pile reinforced foundation exhibits low excess pore pressure values that dissipate quickly post-construction, leading to rapid soil consolidation and stabilization of pile-soil differential settlement. Therefore, compared to the cement-mixed pile reinforced foundation, the stress reduction coefficient for the NPBG porous pile reinforced foundation decreases more rapidly during construction and remains almost unchanged after embankment filling is completed, reaching 0.41.
In contrast, the cement-mixed pile reinforced foundation has a slower soil consolidation rate. As the embankment load increases, the pore water in the soil cannot be discharged promptly, causing a slower transfer of the load from the soil to the piles. The stress reduction coefficient fluctuates around 0.62. After construction is completed, with the gradual dissipation of excess pore pressure, the differential settlement between the piles and the soil continues to increase, leading to a continuous decrease in the coefficient value.
The concrete pile has high stiffness and good load transfer capability, resulting in the reinforced soil bearing less load and developing differential settlement quickly. However, the post-construction consolidation rate of the soil is also slow, resulting in a significant reduction in the stress reduction coefficient both during and after construction. The stress reduction coefficient of the gravel pile reinforced foundation shows a different trend compared to the previous three. It first decreases to 0.95, then increases to 1.05 as the embankment height reaches 1.1 m, and remains stable after construction is completed.
This analysis suggests that the stress reduction coefficient remaining around 1 indicates that the soil arching effect is hardly working, which corresponds to the minimal pile-soil differential settlement (less than 1 mm). When the coefficient exceeds 1, it suggests that due to the uneven settlement of the foundation surface, the settlement is usually greatest in the center and decreases towards the sides. This uneven settlement causes the embankment load not to act vertically on the foundation surface. The load on the adjacent fill material tends to transfer towards the center of the foundation, thereby underestimating the embankment load at that location and resulting in a coefficient value greater than 1.
4.4 Equal settlement plain in embankment
Due to the soil arching effect within the embankment fill, the settlement at the same elevation within the embankment is not uniform. The settlement of the fill within the pile top area is less than that within the pile-interpile soil area, and this phenomenon becomes more pronounced closer to the base of the embankment. As the height of the embankment fill increases, the differential settlement within different positions of the embankment gradually decreases until, at a certain height, there is no differential settlement within the plane. This plane is referred to as the equal settlement plane within the embankment. In engineering design, it is required that the height of the equal settlement plane be lower than the fill height of the embankment; otherwise, the surface will be uneven and unusable.
As shown in Figure 14, from the base of the embankment (z = 25 m) upward, the differential settlement on the same horizontal plane gradually decreases. For the embankment supported by concrete piles, the equal settlement plane is approximately 3.5 m above the base of the embankment. For the embankment supported by NPBG porous piles, the equal settlement plane is about 2 m above the base, while for the embankment supported by cement-mixed piles, it is approximately 5.3 m above the base. The ratios of the equal settlement plane height to the clear spacing between piles are 2.7, 1.5, and 4.1, respectively. In comparison, the use of NPBG porous piles to treat the foundation has a significant effect on reducing the height of the equal settlement plane, which indicates a promising application in projects requiring the construction of low embankments.
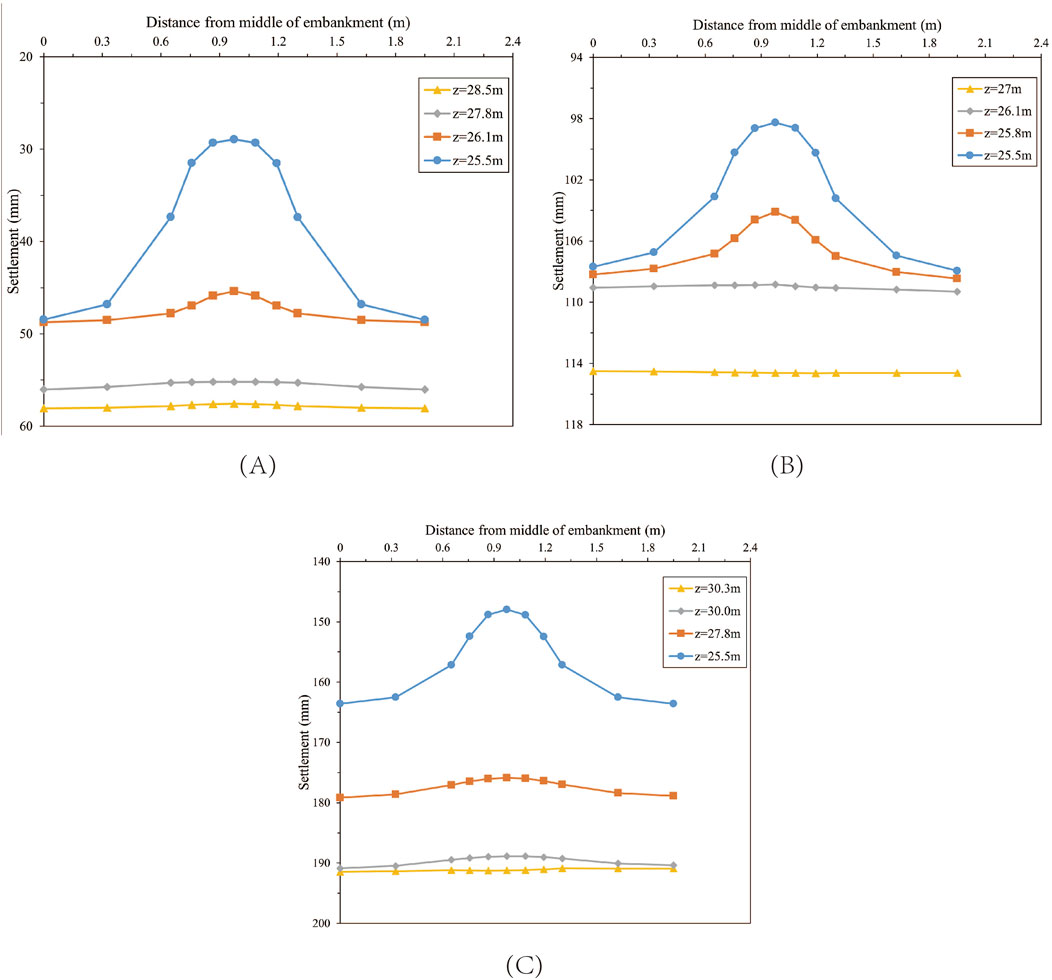
Figure 14. (A) Plane settlement at different heights within the embankment supported by concrete piles. (B) Plane settlement at different heights within the embankment supported by NPBG porous piles. (C) Plane settlement at different heights within the embankment supported by cement-soil mixing piles.
4.5 Tension force of geogrid
Figure 15A illustrates the tensile force of the geogrid in the four types of pile reinforced foundations. As shown in the figure, the concrete piles, NPBG porous piles, and cement-mixed piles are bonded material piles with high pile stiffness. Therefore, the maximum geogrid tensile force appears at the edge of the pile, influenced by both the differential settlement between the pile and soil and the deformation of the embankment. For embankments supported by concrete piles and NPBG porous piles, the lateral displacement at the toe of the embankment is relatively small, being 49.0 mm and 47.2 mm, respectively. As a result, the tensile force in the geogrid above the center of the soil between the piles is close to zero. However, the differential settlement between the pile and soil is slightly larger in the concrete pile reinforced foundation, resulting in higher tensile force in the geogrid above the pile. In the cement-mixed pile reinforced foundation, the differential settlement between the pile and soil is significant, and the lateral displacement at the toe of the embankment is also large, measuring 79.3 mm. Consequently, the tensile force in the geogrid above the pile is the highest, and there is also a small tensile force in the geogrid above the center of the soil between the piles. The gravel piles are granular material piles and are prone to deformation. Hence, the maximum geogrid tensile force appears above the center of the pile. Although the differential settlement between the pile and soil is small, the lateral displacement at the toe of the embankment is the largest, approximately 98.9 mm. Therefore, the distribution of the geogrid tensile force is relatively uniform, and the tensile force values are at a lower level.
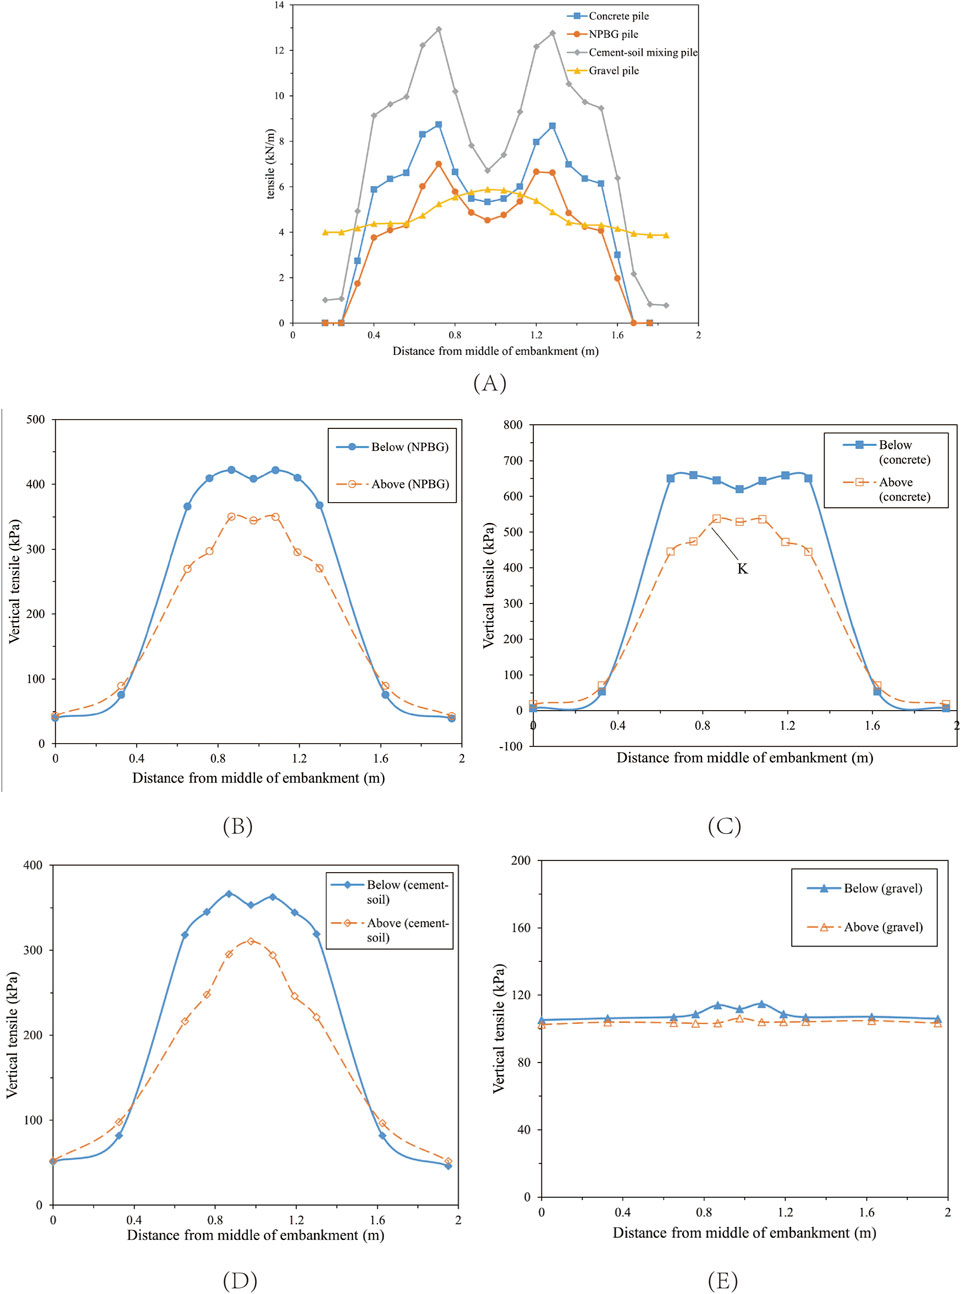
Figure 15. (A) Tensile force of the geogrid. (B) Vertical stresses above and below geogrids in the embankment supported by concrete piles. (C) Vertical stresses above and below geogrids in the embankment supported by NPBG porous piles. (D) Vertical stresses above and below geogrids in the embankment supported by cement-soil mixing piles. (E) Vertical stresses above and below geogrids in the embankment supported by gravel piles.
Figures 15B–E shows the vertical stress conditions above and below the geogrid in the four types of pile reinforced foundations. From the figure, it can be seen that the inclusion of the geogrid results in different vertical stress states above and below it. The stress state above the geogrid is mainly caused by the soil arching effect, while the stress below is influenced not only by the soil arching effect but also by the vertical component of the tensile force in the geogrid. This reflects the membrane effect on the vertical stress, which requires some vertical deformation of the reinforcement material to develop. In Figures 15B–E, which represent the three bonded material pile reinforced foundations, the maximum stress above the geogrid occurs near the center of the pile, while below the geogrid, it shifts towards the edge of the pile. This is consistent with the previous description that the maximum tensile force in the geogrid appears at the edge of the pile. Therefore, with the action of the geogrid, the embankment load is more transferred from the soil between the piles to the piles, and it acts relatively uniformly on the top surface of the piles. For the gravel pile reinforced foundation, a similar pattern is observed, but because the modulus difference between the gravel pile and the foundation soil is not significant, the differential settlement between the pile and soil is small, making the membrane effect less pronounced. Hence, the vertical stress states above and below the geogrid are relatively similar. Comparing the vertical stress at point K on the geogrid (above the pile), the difference in vertical stress between the top and bottom of the geogrid at this point for concrete piles, NPBG porous piles, cement-mixed piles, and gravel piles are 107.2 kPa, 72.0 kPa, 70.9 kPa, and 10.6 kPa, respectively. It can be observed that although the differential settlement between the pile and soil in the NPBG porous pile reinforced foundation is small, resulting in a smaller tensile force in the geogrid, the membrane effect is still significant. Therefore, geogrids with lower tensile strength can be used, reducing construction costs.
5 Conclusion
This paper investigates the application characteristics of NPBG porous new materials in soft soil reinforced pile foundations. Through triaxial compression tests, the stress-strain characteristics and strength parameters of NPBG porous materials were obtained. The effects of polyurethane content, confining pressure, and other factors on the stress-strain characteristics, shear strength, internal friction angle, and cohesion of NPBG were explored. Subsequently, three-dimensional finite element numerical models of four types of pile reinforced foundations—concrete piles, NPBG porous piles, cement-mixed piles, and gravel piles—were established under embankments. The differences among the four pile types were compared in terms of excess pore water pressure, settlement, pile-soil stress, and geogrid stress. The bearing characteristics of the NPBG porous pile were elaborated, with main conclusions as follows:
(1) The triaxial test results show that the stress-strain curve of NPBG porous material exhibits softening characteristics, with the deviator stress reaching its peak at an axial strain of approximately 2.1%. Under shear stress, the material generally shows volumetric expansion. With constant confining pressure, the strength of the sample increases as the polyurethane content increases. The cohesion of NPBG porous material significantly improves with the increase in polyurethane content, although the internal friction angle does not show a noticeable enhancement.
(2) The numerical calculation results indicate that the stiffness and permeability of the piles in foundations significantly affect the dissipation rate of excess pore water pressure in the foundation soil. Compared with concrete piles, cement-mixed piles, and gravel piles, using non-foamed polyurethane gravel piles, which have a combination of certain stiffness and good drainage capability, results in faster consolidation and more efficient dissipation of excess pore water pressure. This improves the stability of the foundation during embankment construction.
(3) The stiffness of the piles determines the total settlement of the foundation, with a higher pile modulus resulting in less foundation settlement. However, the post-construction settlement of the embankment is influenced by both the stiffness and permeability of the piles. Using NPBG porous piles with good permeability allows 95% of the total settlement to occur during the construction period, significantly reducing post-construction settlement. Additionally, when the piles have a higher modulus, the proportion of post-construction settlement is further reduced.
(4) The higher the stiffness of the piles, the greater the pile-soil stress ratio in the foundation, making the soil arching effect more pronounced. However, if the pile strength is insufficient during the loading process, the stress ratio will decrease. The good permeability of NPBG porous piles allows the soil between the piles to share more of the overlying embankment load in a short time, reducing the differential settlement between the piles and the soil. This results in a lower height of the equal settlement plane within the embankment and smaller tensile forces in the geogrid within the cushion layer.
(5) The NPBG porous pile has good stiffness and excellent permeability. Therefore, in the foundation, the NPBG porous pile not only serves as reinforcement but also functions as a drainage channel. This gives the NPBG porous pile reinforced foundation faster consolidation and smaller post-construction settlement, making it highly advantageous for embankment projects involving continuous or rapid filling, as well as low embankment projects.
Data availability statement
The raw data supporting the conclusions of this article will be made available by the authors, without undue reservation.
Author contributions
XH: Data curation, Funding acquisition, Project administration, Resources, Writing–review and editing. ML: Validation, Visualization, Writing–review and editing. HT: Conceptualization, Methodology, Supervision, Writing–original draft.
Funding
The author(s) declare that financial support was received for the research, authorship, and/or publication of this article. The authors acknowledge financial support from the National Science Foundation of China (Nos 52078187 and 51878247) and the Science and Technology Project of Northwest Electric Power Design Institute Co., Ltd. (KC-2022-001).
Conflict of interest
Author XH was employed by Northwest Electric Power Design Institute Co., Ltd. of China Power Engineering Consulting Group.
The remaining authors declare that the research was conducted in the absence of any commercial or financial relationships that could be construed as a potential conflict of interest.
The authors declare that this study received funding from Science and Technology Project of Northwest Electric Power Design Institute Co., Ltd. The funder had the following involvement in the study: data collection and analysis.
Publisher’s note
All claims expressed in this article are solely those of the authors and do not necessarily represent those of their affiliated organizations, or those of the publisher, the editors and the reviewers. Any product that may be evaluated in this article, or claim that may be made by its manufacturer, is not guaranteed or endorsed by the publisher.
References
1. Magnan J. Methods to reduce the settlement of embankments on soft clay: a review. In: Proc., vertical-horizontal deformations of foundations and embankments. ASCE, New York. p. 77–91.
2. Liu KF, Feng WQ, Cai YH, Xu H, Wu PC. Physical model study of pile type effect on long-term settlement of geosynthetic-reinforced pile-supported embankment under traffic loading. Transportation Geotechnics (2023) 38:100923. doi:10.1016/j.trgeo.2022.100923
3. Li G, Xu C, Yoo C, Shen P, Wang T, Zhao C. Effect of geogrid reinforcement on the load transfer in pile-supported embankment under cyclic loading. Geotextiles and Geomembranes (2023) 51:151–64. doi:10.1016/j.geotexmem.2022.10.004
4. Mangraviti V, Flessati L, di Prisco C. Geosynthetic-reinforced and pile-supported embankments: theoretical discussion of finite difference numerical analyses results. Eur J Environ Civil Eng (2023) 27:4337–63. doi:10.1080/19648189.2023.2190400
5. Diao Y, Guo Y, Jia Z, Zheng G, Pan W, Shang D, et al. A simplified method for investigating the bending behavior of piles supporting embankments on soft ground. Front Struct Civil Eng (2023) 17:1021–32. doi:10.1007/s11709-023-0952-3
6. Chen T, Zhang G. Centrifuge modeling of pile-supported embankment on soft soil base for highway widening. Soils and Foundations (2024) 64:101422. doi:10.1016/j.sandf.2023.101422
7. Han J, Gabr MA. Numerical analysis of geosynthetic-reinforced and pile-supported earth platforms over soft soil. J Geotechnical Geoenvironmental Eng (2002) 128:44–53. doi:10.1061/(asce)1090-0241(2002)128:1(44)
8. Van Eekelen SJ, Han J. Geosynthetic-reinforced pile-supported embankments: state of the art. Geosynthetics Int (2020) 27:112–41. doi:10.1680/jgein.20.00005
9. Shen P, Xu C, Han J. Geosynthetic-reinforced pile-supported embankment: settlement in different pile conditions. Geosynthetics Int (2020) 27:315–31. doi:10.1680/jgein.19.00015
10. Basack S, Indraratna B, Rujikiatkamjorn C, Siahaan F. Modeling the stone column behavior in soft ground with special emphasis on lateral deformation. J Geotechnical Geoenvironmental Eng (2017) 143:143. doi:10.1061/(asce)gt.1943-5606.0001652
11. Miranda M, Da Costa A, Castro J, Sagaseta C. Influence of gravel density in the behaviour of soft soils improved with stone columns. Can Geotechnical J (2015) 52:1968–80. doi:10.1139/cgj-2014-0487
12. Deb K. A mathematical model to study the soil arching effect in stone column-supported embankment resting on soft foundation soil. Appl Math Model (2010) 34:3871–83. doi:10.1016/j.apm.2010.03.026
13. Wu PC, Feng WQ, Yin JH. Numerical study of creep effects on settlements and load transfer mechanisms of soft soil improved by deep cement mixed soil columns under embankment load. Geotextiles and Geomembranes (2020) 48:331–48. doi:10.1016/j.geotexmem.2019.12.005
14. Jamsawang P, Phongphinittana E, Voottipruex P, Bergado DT, Jongpradist P. Comparative performances of two- and three-dimensional analyses of soil-cement mixing columns under an embankment load. Mar Georesources Geotechnology (2019) 37:852–69. doi:10.1080/1064119X.2018.1504261
15. Wonglert A, Jongpradist P. Impact of reinforced core on performance and failure behavior of stiffened deep cement mixing piles. Comput Geotechnics (2015) 69:93–104. doi:10.1016/j.compgeo.2015.05.003
16. Wang A, Zhang D. Lateral response and failure mechanisms of rigid piles in soft soils under geosynthetic-reinforced embankment. Int J Civil Eng (2020) 18:169–84. doi:10.1007/s40999-019-00434-1
17. Yu JL, Zhou JJ, Gong XN, Xu RQ, Li JY, Xu SD. Centrifuge study on behavior of rigid pile composite foundation under embankment in soft soil. Acta Geotechnica (2021) 16:1909–21. doi:10.1007/s11440-020-01109-1
18. Nunez MA, Briançon L, Dias DC. Analyses of a pile-supported embankment over soft clay: full-scale experiment, analytical and numerical approaches. Eng Geology (2013) 153:53–67. doi:10.1016/j.enggeo.2012.11.006
19. Miranda M, Da Costa A. Laboratory analysis of encased stone columns. Geotextiles and Geomembranes (2016) 44:269–77. doi:10.1016/j.geotexmem.2015.12.001
20. Wang C, Wang B, Guo P, Zhou S. Experimental analysis on settlement controlling of geogrid-reinforced pile-raft-supported embankments in high-speed railway. Acta Geotechnica (2015) 10:231–42. doi:10.1007/s11440-013-0288-6
21. Golait YS, Satyanarayana V, Raju SS. Concept of under reamed cemented stone columns for soft clay ground improvement. India Geotechnical Conf (2009) 1:356–60.
22. Ni L, Suleiman MT, Raich A. Pervious concrete pile: an innovation ground improvement alternative. InGeo-Congress 2013: Stab Perform Slopes Embankments (2013) III:2051–8.
23. Zhang J, Cui X, Huang D, Jin Q, Lou J, Tang W. Numerical simulation of consolidation settlement of pervious concrete pile composite foundation under road embankment. Int J Geomechanics (2016) 16. doi:10.1061/(asce)gm.1943-5622.0000542
24. Huang DW. Material and performance of pervious concrete pile [dissertation/master's thesis]. Jinan: SHANDONG UNIVERSITY (2015).
25. Tan H, Yu C, Sun Y. Improved mechanical performance of gravel reinforced by polyurethane polymer adhesive. J Mater Civil Eng (2023) 35:35. doi:10.1061/(asce)mt.1943-5533.0004711
26. Liu P, Meng M, Xiao Y, Liu H, Yang G. Dynamic properties of polyurethane foam adhesive-reinforced gravels. Sci China Technol Sci (2021) 64:535–47. doi:10.1007/s11431-020-1707-5
27. Foyer G, Oumeraci H. External and internal wave set-up at porous PBA revetments on a sand foundation. Coastal Eng Proc (2012) 27. doi:10.9753/icce.v33.structures.27
28. Oumeraci H, Staal T, Pfoertner S, Kudella M, Schimmels S, Verhagen HJ. Hydraulic performance of elastomeric bonded permeable revetments and subsoil response to wave loads. Coastal Eng Proc (2011) 22. doi:10.9753/icce.v32.structures.22
29. Wu H, Shu Y, Liu Y. Engineering performance of polyurethane bonded aggregates. Medziagotyra (2017) 23:166–72. doi:10.5755/j01.ms.23.2.15798
30. Xiao B, Zhu H, Chen F, Long G, Li Y. A fractal analytical model for Kozeny-Carman constant and permeability of roughened porous media composed of particles and converging-diverging capillaries. Powder Technology (2023) 420:118256. doi:10.1016/j.powtec.2023.118256
31. Chen X, Zhang J, Li Z. Shear behaviour of a geogrid-reinforced coarse-grained soil based on large-scale triaxial tests. Geotextiles and Geomembranes (2014) 42:312–28. doi:10.1016/j.geotexmem.2014.05.004
32. Liu HL, Ng CW, Fei K. Performance of a geogrid-reinforced and pile-supported highway embankment over soft clay: case study. J Geotechnical Geoenvironmental Eng (2007) 133:1483–93. doi:10.1061/(asce)1090-0241(2007)133:12(1483)
33. Huang J, Han J, Oztoprak S. Coupled mechanical and hydraulic modeling of geosynthetic-reinforced column-supported embankments. J Geotechnical Geoenvironmental Eng (2009) 135:1011–21. doi:10.1061/(asce)gt.1943-5606.0000026
34. Jiang Y, Han J, Zornberg J, Parsons RL, Leshchinsky D, Tanyu B. Numerical analysis of field geosynthetic-reinforced retaining walls with secondary reinforcement. Geotechnique (2019) 69:122–32. doi:10.1680/jgeot.17.P.118
35. Tan HM, Ding BZ, Chen J. Experimental test on water permeability and clogging characteristic of polymer cemented gravel porous material. J Waterway Harbor (2021) 42(6):775–82.
36. Zhu WJ. Study on bearing behavior of composite foundation with nail shaped cement mixing pile in deep soft soil foundation [dissertation/master's thesis]. Chongqing: Chongqing Jiaotong University (2018).
Keywords: non-foamed polyurethane, gravel pile, porous media, settlement, embankment
Citation: Hu X, Li M and Tan H (2024) Exploring mechanical performance of non-foamed polyurethane-bonded gravel and its pile bearing characteristics under embankments: an experimental and numerical approach. Front. Phys. 12:1488622. doi: 10.3389/fphy.2024.1488622
Received: 30 August 2024; Accepted: 18 November 2024;
Published: 12 December 2024.
Edited by:
Gandhimohan M. Viswanathan, Federal University of Rio Grande do Norte, BrazilReviewed by:
Junhong Xu, Nanjing Forestry University, ChinaBoqi Xiao, Wuhan Institute of Technology, China
Copyright © 2024 Hu, Li and Tan. This is an open-access article distributed under the terms of the Creative Commons Attribution License (CC BY). The use, distribution or reproduction in other forums is permitted, provided the original author(s) and the copyright owner(s) are credited and that the original publication in this journal is cited, in accordance with accepted academic practice. No use, distribution or reproduction is permitted which does not comply with these terms.
*Correspondence: Huiming Tan, dGhtaW5nQGhodS5lZHUuY24=
 Xin Hu
 Mengliang Li2
 Huiming Tan