- 1Department of Environmental Science and Optoelectronic Technology, University of Science and Technology of China, Hefei, China
- 2Anhui Institute of Optics and Fine Mechanics, Hefei Institutes of Physical Science, Chinese Academy of Sciences, Hefei, China
We have developed a compact sensor utilizing a tunable diode laser near 1850.5 nm to measure H₂O absorption for wide-range temperature diagnostics. The sensor’s performance was experimentally evaluated in a tube furnace at temperatures ranging from 600 to 1800 K and pressures from 3.5 to 103 kPa, showing a relative error between the measured and set temperatures of −2%–3.5%. The numerical simulations confirmed the sensor’s suitability for temperature measurements between 500 and 2500 K, with the accuracy of absorbance extraction being a critical factor. The above results suggest that the sensor is highly effective for temperature measurement across a broad range and holds potential for applications in aerospace and industrial combustion diagnostics.
1 Introduction
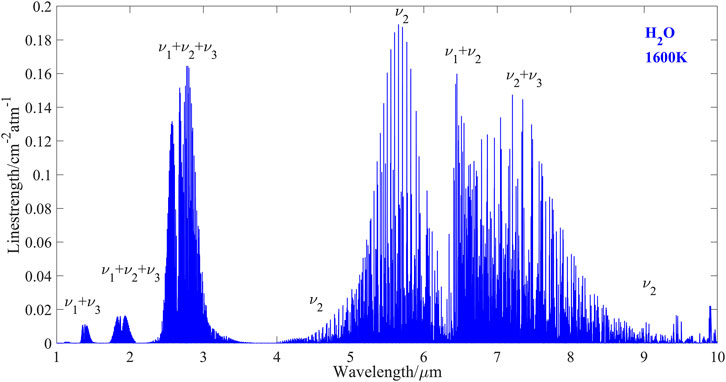
Highly accurate and fast-response measurements of temperature and species concentration are critical in assessing combustion efficiency, which directly influences thermal performance in various combustion systems, such as gas turbines, scramjets, wind tunnels, shock tubes, laboratory flames, and industrial-scale combustors [1–3]. Among the available diagnostic techniques, tunable diode laser absorption spectroscopy (TDLAS) is widely adopted for retrieving combustion temperature and species concentration due to its robustness, high sensitivity, fast response, and non-intrusive measurement capabilities [4–8]. This technique detects specific absorption features of target gases, such as water vapor (H₂O), which is a major product in combustion and has been frequently used as a target gas in TDLAS-based diagnostics [9, 10]. H₂O exhibits several strong absorption bands in the infrared region [11], as illustrated in Figure 1.
At a typical combustion temperature of 1,600 K, the line strengths are plotted across a wavelength range from 1 to 10 μm. These absorption bands occur at 1.4 μm (v1+v3), 1.8 μm (v1+v2+v3), 2.7 μm (v1+v2+v3), 5.5 μm (v2), and 6.5 μm (v1+v2), with the line strengths at 2.7 μm, 5.5 μm, and 6.5 μm being approximately 10 times stronger than those at 1.4 μm and 1.8 μm. Although these stronger absorption bands in the mid-infrared region provide higher precision for temperature sensing and trace H₂O detection, they require more expensive laser sources, such as quantum cascade lasers (QCLs) [12, 13] and interband cascade lasers (ICLs) [14, 15]. In contrast, the near-infrared absorption bands around 1.4 μm and 1.8 μm can be accessed using fiber-optic diode lasers, offering advantages such as compact size, lower cost, high spectral quality, and room-temperature operation [16–18], and the signals from these lasers can be directly acquired using either a photodetector or a quartz tuning fork detector, which has the merits of wide response range, low cost and tiny size [19–21], making these lasers more attractive for temperature and H₂O concentration measurements in various combustion systems.
Most previous studies have focused on the 1.4 μm region for high-temperature sensing due to the availability of telecommunication-type lasers. For instance, Qu et al. [22] and Liu et al. [23] designed a temperature sensor capable of measuring temperatures using a distributed feedback (DFB) laser with a center wavelength of 1397.8 nm to detect two H₂O absorption lines at 7153.7484 cm⁻1 and 7154.3534 cm⁻1. Similarly, Shao et al. [24] developed a gas sensor based on a 1.56 μm laser using wavelength modulation and two-line temperature retrieval to measure temperatures ranging from 200°C to 1000°C. However, these methods are prone to calculation errors due to uncertainties in the HITRAN or HITEMP databases. Increasing the number of H₂O absorption lines can enhance temperature measurement precision. Recent studies by Liu et al. [25] and Li et al. [26] employed three H₂O absorption lines at 7185.597 cm⁻1, 7444.350 cm⁻1, and 7444.37 cm⁻1, respectively, to achieve high-precision temperature measurements in a flat-flame furnace and scramjet engine. Zhang et al. [27] used three DFB lasers operating near 1,343 nm, 1,392 nm, and 1,469 nm to accurately measure engine nozzle temperatures. In our previous work [28], five DFB lasers were employed near 1,392 nm, 1,393 nm, 1,339 nm, 1,343 nm, and 1,469 nm to improve temperature measurement precision in the expansion section of a scramjet engine.
Despite the stronger absorption at high temperatures in the 1.8 μm band compared to the 1.4 μm band [11], TDLAS measurements near 1.8 μm have been rarely reported. The 1.8 μm band holds promise for more sensitive H₂O detection and higher-precision temperature measurements. Therefore, in this study, we employed a single DFB laser operating near 1.85 μm as a TDLAS sensor to scan multiple H₂O absorption lines, with the lower-state energy levels ranging from 70 to 6,581 cm⁻1. This sensor, featuring a high signal-to-noise ratio and strong line strength over a wide temperature range, enables high-precision temperature measurements across a broad temperature range.
2 Measurement basis of the sensor
2.1 Selection of H2O absorption lines
The precision of laser-based sensors largely depends on the absorption strength of the selected target lines, which directly influences measurement accuracy. Therefore, selecting optimized absorption lines is critical. In this study, I will elaborate on the specific line selection criteria: 1) Target Molecule Selection: H₂O was chosen as the target molecule for TDLAS-based temperature measurement, with a designated temperature range of 500–2500 K. This range not only covers the operational temperatures of our laboratory tube furnace for experimental validation but also extends to meet the requirements of future combustion flow field studies in aerospace engines. 2) Band Selection: The chosen spectral band lacks interference from major combustion products such as CO and CO₂, and features uniformly distributed lower-state energy levels, enabling measurements across a wide temperature span. 3) Laser Selection and Initial Line Database: Based on the above analysis of Figure 1 and selection criteria (1) and (2), a DFB laser operating near 1,850 nm (1.8–2 μm) was selected, covering the 5,400–5,409 cm⁻1 range. Absorption lines were initially chosen from HITEMP2010 with line strengths at 296 K meeting a threshold of S (T0)≥1.0 × 10⁻³⁵ cm-2
Based on the line selection criteria, the simulated H₂O absorption spectra at 1,600 K (in blue) are shown in Figure 2A. Additionally, in combustion flow environments, such as aerospace engines and gas turbines, hydrocarbon-based fuels are commonly used, resulting in maximum potential interference concentrations of approximately 20% CO₂, 10% CO, and 10% CH₄. Hence, potential interference from carbon dioxide (CO₂), carbon monoxide (CO), and methane (CH₄) was considered, with their simulated absorption spectra displayed in black, red, and green, respectively. The H₂O absorption is significantly stronger than that of other gases, indicating that spectral interference from these gases can be ignored. Figure 2B further illustrates the normalized line strength distribution of the selected absorption lines for temperatures ranging from 500 to 2500 K. The variation in line strengths for each absorption line at different temperatures is distinguished by the color gradient in the heatmap, clearly indicating the applicable temperature calculation range for each line and demonstrating how the line strengths and detectable absorption lines vary with temperature, enabling temperature measurement over a wide range.
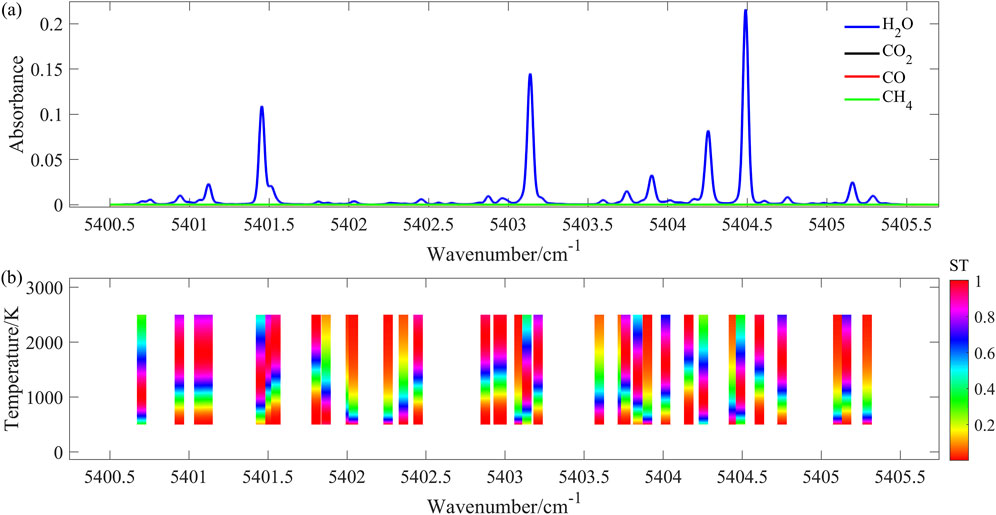
Figure 2. (A) Simulated absorption of H2O(in blue curve) at the temperature of 1600 K, the concentration of 50%, the pressure of 0.1 atm, and the pathlength of 23 cm. The absorption interferences of 20% CO2(in black curve), 10% CO (in red curve) and 10% CH4(in green curve) are also displayed in this figure; (B) Distribution of the normalized line strength of the selected absorption lines in the temperature range of 500–2500 K.
2.2 Temperature retrieval method
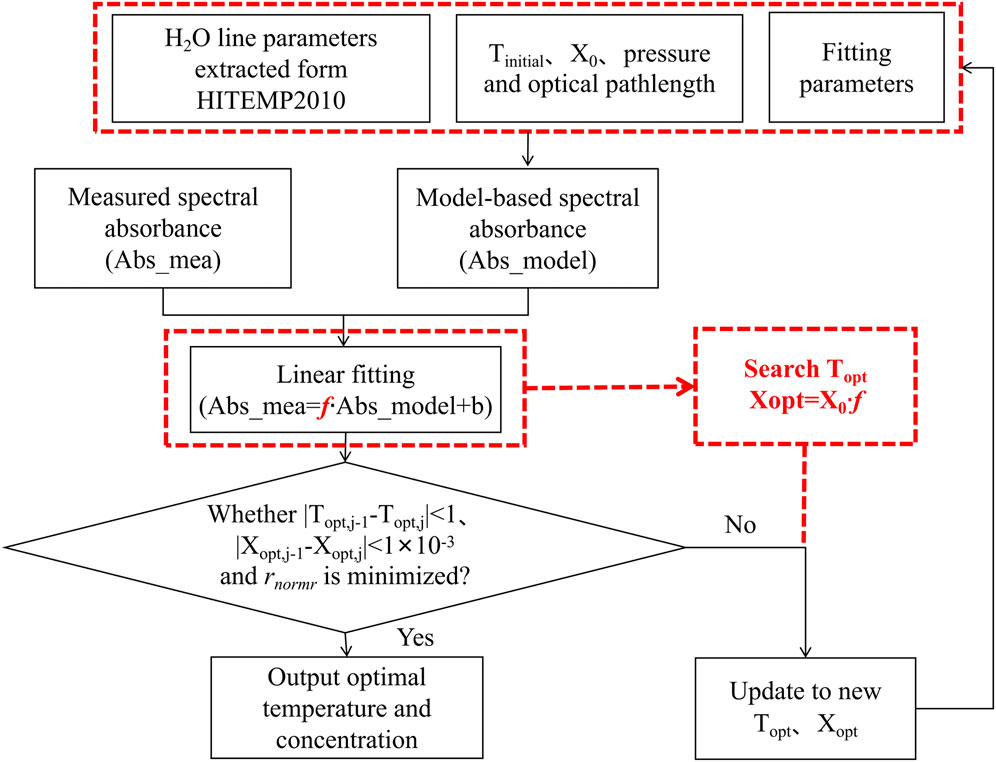
The most common methods for retrieving temperature in TDLAS combustion diagnostics are two-line thermometry [29, 30] and the Boltzmann Plot method [31–33]. However, these approaches involve computing the integrated absorbance over a wide spectral range, which can be computationally intensive. In this study, we developed a broadband spectral fitting model based on the univariate search method [34, 35] to determine temperature and H₂O concentration. This model fits multiple H₂O absorption lines across the absorption spectrum and continuous spectral bands, which has been reported in our previous work [36].
The flowchart for the broadband spectral fitting model is shown in Figure 3. First, a measured broadband spectral absorbance (denoted as Abs_mea) is recorded, and a model-based spectral absorbance (denoted as Abs_model), using Voigt profile, is simulated based on input fitting parameters such as H₂O line parameters from HITEMP2010 and experimental conditions (e.g., pressure, optical path length). A nonlinear univariate method (using the fminbnd function in MATLAB) is then employed to search for the optimal temperature (denoted as Topt) under an initial concentration (denoted as X₀) and initial temperature (denoted as Tinitial). A linear fitting between Abs_mea and Abs_model is performed to obtain the slope (
Where
Where
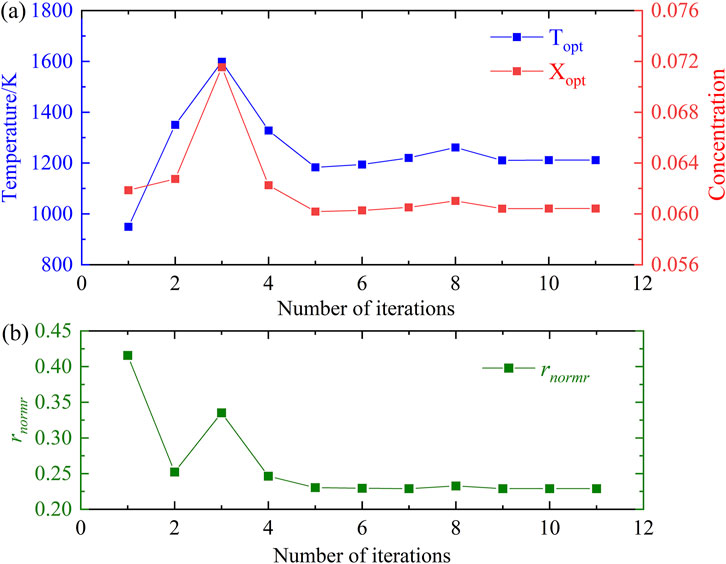
The typical example illustrating this method is shown in Figures 4, 5. To fit the actual experimental conditions, an H₂O absorbance spectrum was simulated under the conditions of Pressure = 1 atm, XH2O = 0.06, L = 23 cm and T = 1200 K. Gaussian noise with an amplitude of ±0.005 and a 20% error in H₂O absorption line parameters were added in the H₂O absorbance spectrum regarded as measured spectrum. Then it was input into the broadband spectral fitting model to obtain the trends for temperature, concentration, and rnormr during each iteration, as shown in Figure 4.
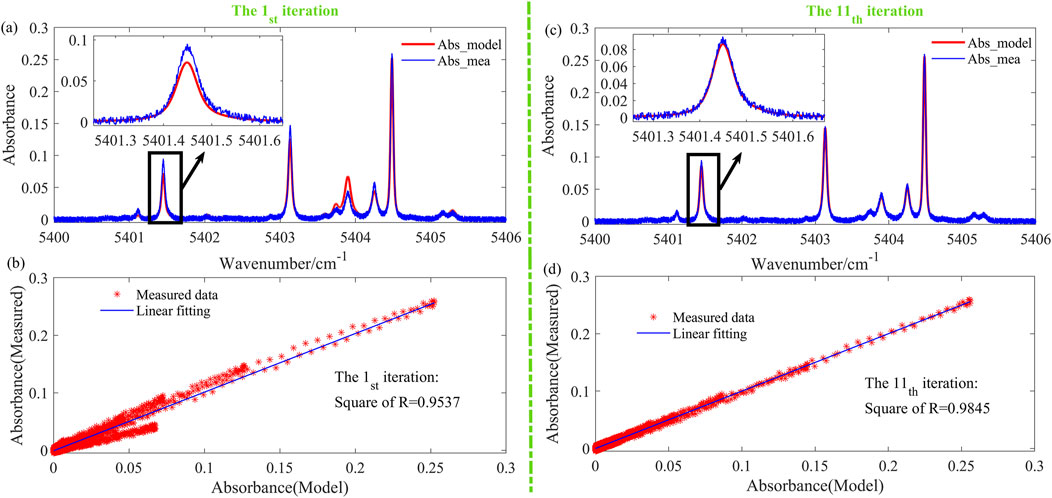
Figure 5. (A) Absorption spectra (Abs_mea in blue curve&Abs_model in red curve) for the first iteration; (B) Spectral linear fitting result for the first iteration; (C) Absorption spectra (Abs_mea in blue curve&Abs_model in red curve) for the 11th iteration; (D) Spectral linear fitting result for the 11th iteration.
In the first iteration (blue curve in Figure 4A), the optimal temperature differs significantly from the true value of 1200 K, and the corresponding rnormr (green curve in Figure 4B) is also at its maximum. Figure 5A shows the Abs_mea (blue curve) and Abs_model (red curve) for the first iteration, where a poor fit between the measured and model-based spectrum is evident. Similarly, Figure 5B presents the linear fit of the spectral data for the first iteration, demonstrating a clear deviation between the measured data and the linear fit. These results indicate that the temperature and the concentration are not optimal in the first iteration. After several iterations, the temperature and concentration in the 11th iteration converge closely to the true values of 1200 K and 0.06, respectively. Furthermore, the rnormr is minimized. The spectra (Figure 5C) and the linear fit of the spectral data (Figure 5D) confirm a much-improved fit, indicating that the optimal temperature and concentration have been successfully determined.
3 Experimental setup and discussions
3.1 Experimental setup
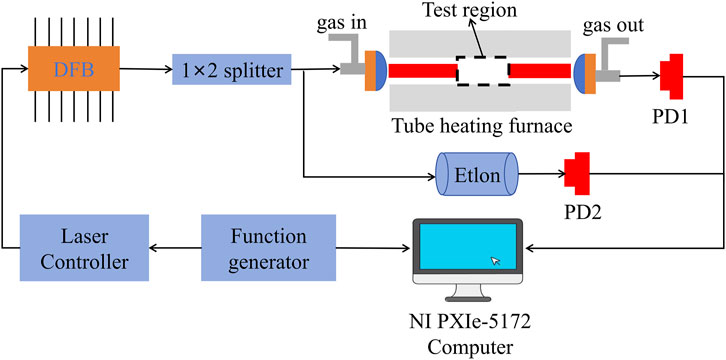
A DFB laser (Nanoplus, S/N: 2899/03-02) operating near 1850.5 nm was selected as the laser source. A commercial laser controller (LDC501, Stanford Research Systems) was used to regulate the laser operating temperature, and a sawtooth wave signal generated by a commercial function generator (SDG2082X, SIGLENT) was applied to continuously scan the absorption lines of H₂O. The temperature measurement performance of the sensor was evaluated using a commercial tube furnace platform (GSL-1800X-III-₵50). The laser beam was split into two parts using a fiber splitter, as shown in Figure 6. Fifty percent of the beam was collimated by a fiber collimator, transmitted through the temperature test region in the furnace, and then detected by a photodetector (Thorlabs PDA10D-E-C). The other half of the beam passed through a quartz Fabry-Pérot etalon for frequency calibration and was detected by another photodetector. The generated photocurrents were converted into voltage signals using a custom-made transimpedance amplifier. The signals were then digitized using a 16-bit data acquisition card (NI PXIe-5172). To ensure a stable temperature region within the furnace, the sapphire tube was inserted into both ends of the furnace tube. Additionally, a pair of structures incorporating internal gas pipes was designed to mount the collimator. The structures allowed for purging the internal air gap with high-purity nitrogen (99.99%) to eliminate absorption interference from residual H₂O.
Seven equally spaced temperatures ranging from 600 K to 1800 K were set within the furnace’s maximum tolerance temperature of 2000 K. After reaching the preset temperatures, pure water vapor (100% purity) at three different pressures (P1–P3: 3.5–6.5 KPa) was introduced into the furnace, with the pressures monitored using a manometer (MKS628). For each temperature and pressure, 500 raw spectral signals were recorded once the pressure stabilized. Additional tests were conducted at higher pressures (P4–P6: 10–103 KPa) using a mixture of pure water vapor and high-purity nitrogen, with 500 spectral signals captured for each set condition. Non-absorbing regions of the raw spectral signals were fitted using a third-order polynomial to extract the H₂O absorbance. Figure 7A displays the measured raw data and the corresponding extracted H₂O absorbance. A spectral fitting result using the broadband spectral fitting model is shown in Figure 7B, demonstrating close agreement between the fitted and measured H₂O absorbance. But there is still a deviation between −0.02 and 0.02 as shown in Figure 7C. The reason of this deviation can be concluded as follows. DFB laser’s wide scanning range combined with spectral broadening and weak absorption lines, introduces errors in selecting non-absorbing regions, resulting in irregular baseline fluctuations that subsequently cause baseline shifts during spectral fitting, and this effect will be discussed in Section 3.2. Moreover, the spectral line parameters in HITEMP2010 have errors ranging from 5% to 20%, or even higher, and unavoidable spectral noise also contributes to the deviation. Calibration of spectral parameters and an increase in the SNR can reduce these errors, but due to the large number of lines involved, this process is still ongoing. However, as illustrated in Figure 7D, even with a deviation between −0.02 and 0.02, rnormr converges to a minimum after 13 iterations, allowing optimal temperature and concentration values to be obtained.
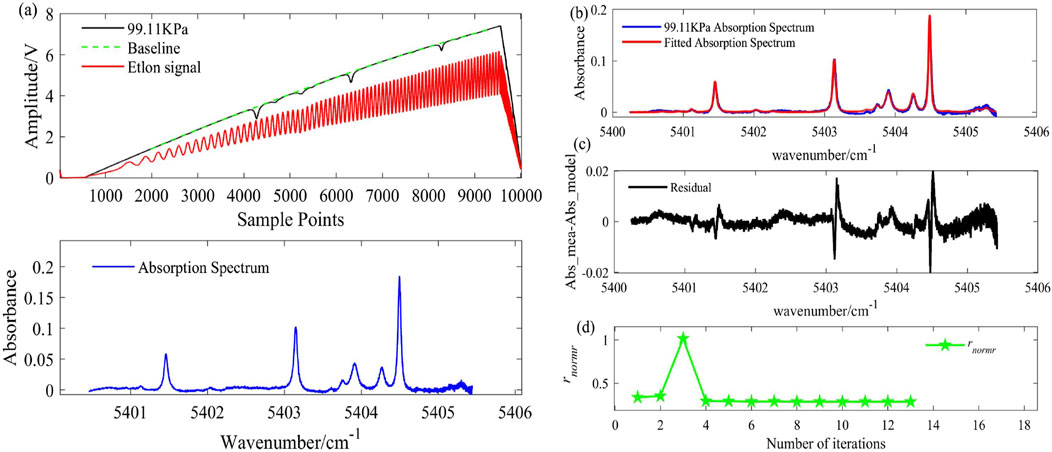
Figure 7. Processing of experimental measured data: (A) Experimental measured H2O absorption signal and extracted spectrum at T = 1000 K、XH2O = 0.0578、PH2O-N2 = 99.11KPa; (B) Spectral fitting result; (C) Spectral fitting residual between Abs_mea and Abs_model; (D) rnormr of each iteration.
3.2 Results and discussions
3.2.1 Analysis of experimental results
To further validate the sensor’s performance, temperature measurements were carried out in the furnace across a range of 600–1800 K and pressures from 3.5 to 103 KPa. An example of the extracted H₂O absorption spectrum at temperatures between 600 K and 1800 K (at P3) is shown in Figure 8A. The absorption intensity varies across this temperature range, corresponding to the trend in line strength with temperature, as depicted in Figure 2B.
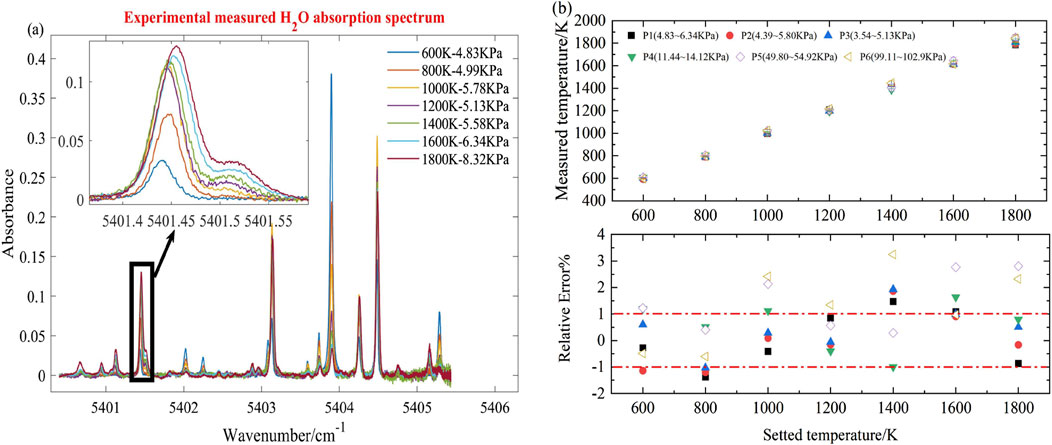
Figure 8. (A) Experimental measured H2O absorption spectrum at 600–1800K (@P3); (B) Error bar chart (top panel) and relative error (bottom panel) of experimental data at 600–1800K and 3.5–103 KPa.
The extracted H₂O absorption spectra were processed using the broadband spectral fitting model to determine the measured temperatures, with error bars and relative errors at different temperatures and pressures shown in Figure 8B. At a constant temperature, the standard deviations at different pressures remain relatively consistent and close to the average values. The relative error fluctuates within 2% for pressures ranging from 3.5 to 6.5 KPa, indicating stable temperature measurement performance. At higher pressures (10–103 KPa), the maximum standard deviation is 34.6 K (at 1800 K, 102.9 KPa), and the relative error ranges from −1% to 3.5%. The relative error increases significantly at temperatures above 1000 K and pressures exceeding 50 KPa. The wide wavelength scanning range of the laser, combined with weak spectral lines and spectral broadening, complicates the accurate fitting of non-absorbing regions using polynomial methods, leading to errors in absorbance extraction and temperature measurement.
3.2.2 Simulation analysis
To evaluate the impact of absorbance extraction errors on temperature accuracy, the absorption-free laser intensity (I₀) was determined by extracted baselines at different temperatures and pressures in Section 3.2.1. H₂O absorption spectra (denoted as
where B(υ) represents the added Gaussian noise.
Figure 9A shows an example of the simulated transmitted intensity at 1000 K and 150 kPa, along with the extracted spectrum. The error bars and relative errors are plotted in Figure 9B, showing a maximum standard deviation of 60.1 K (at 1800 K, 150 KPa). The relative error fluctuates within ±1% at pressures between 3.5 KPa and 10 kPa, but rises to 3% at pressures between 50 and 150 kPa, which is largely consistent with the experimental results. This indicates that incorrect selection of non-absorbing regions can reduce accuracy of absorbance extraction and temperature measurements.
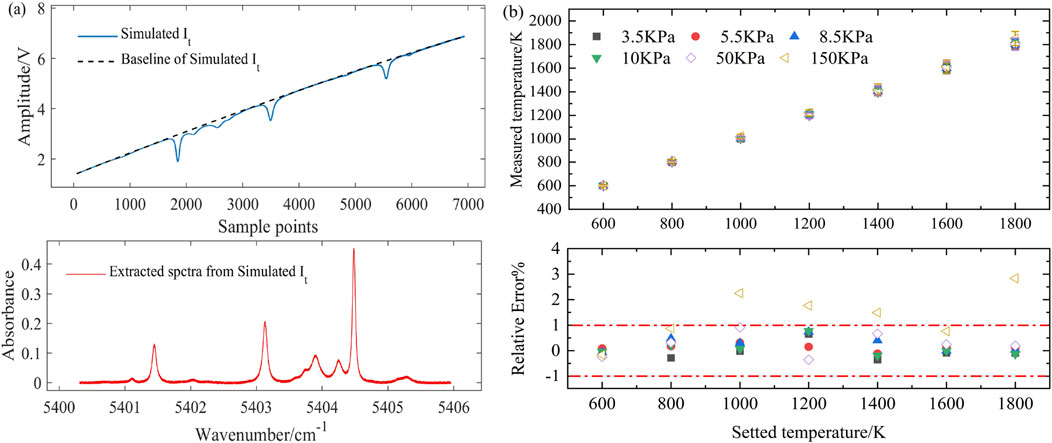
Figure 9. (A) Simulated
To further verify the impact of these factors and evaluate the sensor’s performance at temperatures above 1800 K, H₂O absorption spectra were simulated for ten equal-interval temperatures between 500 and 2500 K at six different pressures (3.5–150 KPa). Gaussian noise (amplitude ±0.005) and a 20% error in spectral parameters were added to the H₂O absorbance, where the process assumes accurate absorbance extraction. Figure 10A shows an example of the simulated spectra, while Figure 10B presents the corresponding error bars and relative errors. The maximum standard deviation of temperature is 105.14 K (at 2500 K, 150 KPa), and the relative error fluctuates between 1.5% and 2%, which is lower than the error shown in Figure 9B for the same conditions. These results demonstrate that the sensor performs effectively over the 500–2500 K range, and that improper selection of non-absorbing regions directly reduces the accuracy of absorbance extraction and temperature measurements, which will be addressed in future work by developing a broadband baseline fitting model to enhance temperature measurement accuracy.
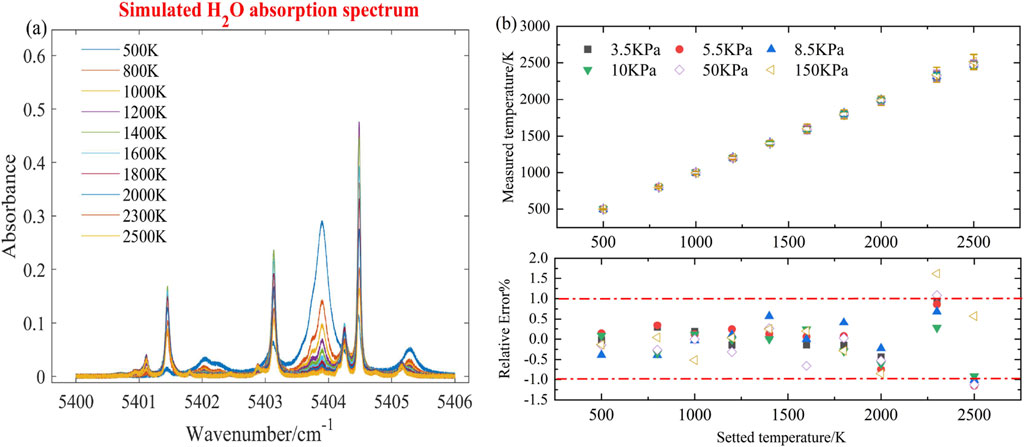
Figure 10. (A) Simulated absorption spectrum (@500–2500K, 150 KPa); (B) Error bar chart (top panel) and relative error (bottom panel) of simulation data at 500–2500K and 3.5–150 KPa.
4 Conclusion
In this study, we developed a TDLAS sensor operating near 1850.5 nm to scan multiple H₂O absorption lines within the 5,400–5,406 cm⁻1 range for wide-range temperature measurement. The sensor’s performance was experimentally validated in a tube furnace at temperatures ranging from 600 to 1800 K and pressures from 3.5 to 103 kPa, where the relative error of temperature is within 3.5%. Additionally, numerical simulations demonstrated that the sensor is capable of accurate temperature measurements from 500 to 2500 K. The accuracy of the extracted absorbance plays a crucial role in the overall measurement precision, and factors such as the wide scanning range, weak spectral lines, and spectral line broadening can influence the selection of non-absorbing regions and the quality of absorbance extraction. Future work will focus on the development of a broadband baseline fitting model to mitigate the effects of spectral interference and further improve temperature measurement accuracy. Overall, the sensor exhibits high measurement accuracy over a wide temperature range and is well-suited for applications in combustion environments with large temperature gradients, such as the isolation and expansion sections of scramjet engines. Additionally, this sensor provides a promising solution for multiline temperature distribution measurements in future diagnostics.
Data availability statement
The original contributions presented in the study are included in the article/supplementary material, further inquiries can be directed to the corresponding author.
Author contributions
SA: Conceptualization, Data curation, Formal Analysis, Investigation, Methodology, Software, Validation, Visualization, Writing–original draft, Writing–review and editing. ZX: Formal Analysis, Funding acquisition, Methodology, Project administration, Supervision, Writing–review and editing. AH: Conceptualization, Investigation, Writing–review and editing. HD: Validation, Visualization, Writing–review and editing. RN: Resources, Writing–review and editing. RK: Funding acquisition, Project administration, Writing–review and editing.
Funding
The author(s) declare that financial support was received for the research, authorship, and/or publication of this article. This research was funded by National Key R&D Program of China (Grant No. 2023YFF0716400), National Science and Technology Major Project (Grant No. J2019-V-0005-0096) and Foundational Military Research Institute Stability Support Project.
Conflict of interest
The authors declare that the research was conducted in the absence of any commercial or financial relationships that could be construed as a potential conflict of interest.
Publisher’s note
All claims expressed in this article are solely those of the authors and do not necessarily represent those of their affiliated organizations, or those of the publisher, the editors and the reviewers. Any product that may be evaluated in this article, or claim that may be made by its manufacturer, is not guaranteed or endorsed by the publisher.
References
1. Kim G, Shim H, Jung S, Park G, Lee D. Robustness and performance evaluation of TDLAS sensor for scramjet intake. Aerospace Sci Technol (2023) 141:108561. doi:10.1016/j.ast.2023.108561
2. Nie W, Xu Z, Rao G, Lin X, Lu J, Dong M, et al. Methods of tunable diode laser absorption saturation spectroscopy to gas sensing under optically thick conditions. Microw Opt Technol Lett (2021) 63(8):2063–7. doi:10.1002/mop.32840
3. Fisher EMD, Benoy T, Humphries G, Wilson D, Lengden M, Johnstone W, et al. A custom, high-channel count data acquisition system for chemical species tomography of aero-jet engine exhaust plumes. IEEE Trans Instrum Meas (2020) 69(2):549–58. doi:10.1109/tim.2019.2895932
4. Werle P. A review of recent advances in semiconductor laser based gas monitors. Spectrochim Acta A (1998) 54(2):197–236. doi:10.1016/s1386-1425(97)00227-8
5. Lackner M. Tunable diode laser absorption spectroscopy(TDLAS) in the process industries-A Review. Rev Chem Eng (2007) 23(2). doi:10.1515/revce.2007.23.2.65
6. Schulz C, Dreizler A, Ebert V, Wolfrum J. Combustion diagnostics. In: C Tropea, editor. Handbook of experimental fluid mechanics. Berlin, Heidelberg: Springer (2007). p. 1241–315. doi:10.1007/978-3-540-30299-5_20
7. Bolshov MA, YuA K, YuV R. Tunable diode laser spectroscopy as a technique for combustion diagnostics. Spectrochim Acta B (2015) 106:45–66. doi:10.1016/j.sab.2015.01.010
8. Witzel O, Klein A, Wagner S, Meffert C, Schulz C, Ebert V. High-speed tunable diode laser absorption spectroscopy for sampling-free in-cylinder water vapor concentration measurements in an optical IC engine. Appl Phys B (2012) 109(3):521–32. doi:10.1007/s00340-012-5225-0
9. Goldenstein CS, Spearrin RM, Jeffries JB, Hanson RK. Infrared laser-absorption sensing for combustion gases. Prog Energ Combust Sci (2017) 60:132–76. doi:10.1016/j.pecs.2016.12.002
10. Wolfrum J. Lasers in combustion: from basic theory to practical devices. Proc Combust Inst (1998) 27(1):1–41. doi:10.1016/s0082-0784(98)80387-1
11. Tao MM, Wang YM, Wu HL, Li GH, Wang S, Tao B, et al. Hyperspectral absorption of water around 2 μm based on a boradband tunable, narrow linewidth Tm-doped fiber laser. Acta Phys Sin (2022) 71(11):114203. doi:10.7498/aps.71.20212127
12. Li J, Deng H, Sun J, Yu B, Fischer H. Simultaneous atmospheric CO, N2O and H2O detection using a single quantum cascade laser sensor based on dual-spectroscopy techniques. Sens Actuators B Chem (2016) 231:723–32. doi:10.1016/j.snb.2016.03.089
13. Zhou X, Tang Y, Zhao S, Chen H, Li H. Water vapor detection based on three-line TDLAS with a continuous wave quantum cascade laser. Optik (2023) 287:171126. doi:10.1016/j.ijleo.2023.171126
14. Li J, Du Z, An Y. Frequency modulation characteristics for interband cascade lasers emitting at 3 μm. Appl Phys B (2015) 121(1):7–17. doi:10.1007/s00340-015-6195-9
15. Northern JH, O’Hagan S, Fletcher B, Gras B, Ewart P, Kim CS, et al. Mid-infrared multi-mode absorption spectroscopy using interband cascade lasers for multi-species sensing. Opt Lett (2015) 40(17):4186. doi:10.1364/ol.40.004186
16. Xing F, Huang Y, Zhao M, Zhao J. The brief introduction of different laser diagnostics methods used in aeroengine combustion research. J Sens (2016) 2016:1–13. doi:10.1155/2016/2183569
17. Li B, Xue L, Ji N, Wei DH. Research on spectroscopy modulation of a distributed feedback laser diode based on the TDLAS technique. Int J Opt (2021)2021) 2021:1–9. doi:10.1155/2021/8829790
18. Liu X, Zhou X, Jeffries JB, Hanson RK. Experimental study of H2O spectroscopic parameters in the near-IR (6940–7440cm−1) for gas sensing applications at elevated temperature. J Quant Spectrosc Radiat Transf (2007) 103(3):565–77. doi:10.1016/j.jqsrt.2006.07.008
19. Ma Y, Qiao S, Wang R, He Y, Fang C, Liang T. A novel tapered quartz tuning fork-based laser spectroscopy sensing. Appl Phys Re (2024) 11(4). doi:10.1063/5.0214874
20. Liu Y, Qiao S, Fang C, He Y, Sun H, Liu J, et al. A highly sensitive LITES sensor based on a multi-pass cell with dense spot pattern and a novel quartz tuning fork with low frequency. Opto-electron Adv (2024) 7(3):230230. doi:10.29026/oea.2024.230230
21. Wang J, Wu H, Sampaolo A, Patimisco P, Spagnolo V, Jia S, et al. Quartz-enhanced multiheterodyne resonant photoacoustic spectroscopy. Light Sci Appl (2024) 13(1):77. doi:10.1038/s41377-024-01425-1
22. Qu Z, Schmidt FM. In situ H2O and temperature detection close to burning biomass pellets using calibration-free wavelength modulation spectroscopy. Appl Phys B (2015) 119(1):45–53. doi:10.1007/s00340-015-6026-z
23. Liu X, Ma Y. Tunable diode laser absorption spectroscopy based temperature measurement with a single diode laser near 1.4 μm. Sensors (2022) 22(16):6095. doi:10.3390/s22166095
24. Shao J, Lathdavong L, Kluczynski P, Lundqvist S, Axner O. Methodology for temperature measurements in water vapor using wavelength-modulation tunable diode laser absorption spectrometry in the telecom C-band. Appl Phys B (2009) 97(3):727–48. doi:10.1007/s00340-009-3721-7
25. Liu C, Cao Z, Li F, Lin Y, Xu L. Flame monitoring of a model swirl injector using 1D tunable diode laser absorption spectroscopy tomography. Meas Sci Technol (2017) 28(5):054002. doi:10.1088/1361-6501/aa5aee
26. Li F, Yu X, Gu H, Li Z, Zhao Y, Ma L, et al. Simultaneous measurements of multiple flow parameters for scramjet characterization using tunable diode-laser sensors. Appl Opt (2011) 50(36):6697. doi:10.1364/ao.50.006697
27. Zhang BQ, Xu ZY, Liu JG, Yao L, Ruan J, Hu JY, et al. Temperature measurement method of high temperature and high pressure flow field based on wavelength modulation spectroscopy technology. Acta Phys Sin (2019) 68(23):233301. doi:10.7498/aps.68.20190515
28. Huang A, Xu ZY, Deng H, Yang WB, Qi XH, Li J, et al. High-pressure gas temperature sensing for exit plane of aero-engine combustor using tunable diode laser absorption spectroscopy. Microw Opt Technol Lett (2023) 66(1). doi:10.1002/mop.33897
29. Bürkle S, Biondo L, Ding CP, Honza R, Ebert V, Böhm B, et al. In-Cylinder temperature measurements in a motored IC engine using TDLAS. Flow Turbul Combust (2018) 101(1):139–59. doi:10.1007/s10494-017-9886-y
30. Ma L, Ning H, Wu J, Ren W. In situ flame temperature measurements using a mid-infrared two-line H2O laser-absorption thermometry. Combust Sci Technol (2017) 190(3):393–408. doi:10.1080/00102202.2017.1392515
31. Lindstrom CD, Jackson KR, Williams S, Givens R, Bailey WF, Tam CJ, et al. Shock-train structure resolved with absorption spectroscopy Part I: system design and validation. AIAA J (2009) 47(10):2368–78. doi:10.2514/1.41074
32. Lindstrom CD, Davis D, Williams S, Tam CJ. Shock-train structure resolved with absorption spectroscopy Part II: analysis and CFD comparison. AIAA J (2009) 47(10):2379–90. doi:10.2514/1.41077
33. Sappey AD, Masterson P, Howell J, Estes M, Owenby D, Sutherland L. Tomographic reconstruction of multipath tunable diode laser spectroscopy measurements in turbine engines. J Propuls Power (2014) 30(1):24–8. doi:10.2514/1.b34212
34. D’Souza EJ. Accelerated convergence of the error back-propagation training algorithm using univariate search[dissertation]. Philadelphia(PA: Drexel University (1991) doi:10.17918/00008716
35. Rhinehart RR. Engineering optimization: applications, methods, and analysis. New York: ASME Press (2018). p. 34. doi:10.1115/1.861opt
Keywords: temperature sensor, 1850.5 nm diode laser, tunable diode laser absorption spectroscopy, wide-range temperature measurement, good sensing performance
Citation: Ai S, Xu Z, Huang A, Deng H, Niu R and Kan R (2024) A wide-range temperature sensor with a single diode laser based on H2O absorption spectra near 1850.5 nm. Front. Phys. 12:1488578. doi: 10.3389/fphy.2024.1488578
Received: 30 August 2024; Accepted: 15 November 2024;
Published: 05 December 2024.
Edited by:
Yufei Ma, Harbin Institute of Technology, ChinaReviewed by:
Wei Ren, Xi’an University of Posts and Telecommunications, ChinaZongliang Wang, Liaocheng University, China
Fupeng Wang, Ocean University of China, China
Copyright © 2024 Ai, Xu, Huang, Deng, Niu and Kan. This is an open-access article distributed under the terms of the Creative Commons Attribution License (CC BY). The use, distribution or reproduction in other forums is permitted, provided the original author(s) and the copyright owner(s) are credited and that the original publication in this journal is cited, in accordance with accepted academic practice. No use, distribution or reproduction is permitted which does not comply with these terms.
*Correspondence: Zhenyu Xu, enl4dUBhaW9mbS5hYy5jbg==
 Suman Ai
 Zhenyu Xu
 An Huang
 Hao Deng
 Rantong Niu2
 Ruifeng Kan