- 1Centre for Medical Radiation Physics, University of Wollongong, Wollongong, NSW, Australia
- 2Australian Synchrotron, ANSTO, Melbourne, VIC, Australia
The Pulsed Energetic Electrons for Research (PEER) beamline at the ANSTO Australian Synchrotron comprises a 100 MeV linac injector that is currently being developed for ultra-high dose-rate, very high-energy electron radiotherapy research. Previously, dosimetry studies discovered a lack of reliable charge measurement to the in-air end station, though no change in response was recorded in fast current transformer measurements, the only available diagnostic device for measuring charge. This work describes the process of simulating and then commissioning a purpose-built Faraday cup to ascertain absolute in-air charge measurements at PEER. By combining simulation data with experimental results, the PEER Faraday cup is shown to possess a primary electron capture efficiency of (99.22
1 Introduction
The ANSTO Australian Synchrotron is a third-generation light source with a 100 MeV electron linac injector. During machine development periods, the Pulsed Energetic Electrons for Research (PEER) end-station can use the linac for very high-energy electron (VHEE, electrons with energy greater than 50 MeV) research. The linac is believed to be capable of delivering average dose-rates many orders of magnitude greater than 40 Gy/s, making it suitable for research into FLASH radiotherapy, an emerging cancer treatment modality that utilizes ultra-high dose-rate (UHDR) radiation due to its tissue-sparing qualities [1–3].
Of increasing interest is the combination of UHDR with VHEE to treat deep-seated tumors [4–6]. To investigate the combination of UHDR and VHEE for novel radiotherapy treatments, preliminary dosimetric investigations have been performed at PEER to begin characterizing the beam delivered to the end-station. Previously, while using a fixed pulse charge across a range of beam currents from 0.78 mA to 9.42 mA, Cayley et al. [7] showed that at beam currents below 2 mA, the responses of a Centre for Medical Radiation Physics-designed MOSkin detector [8–12] array and scintillating screen simultaneously revealed a loss of charge at the in-air experimental stage, as evident in Figure 1. This loss of charge was not reflected in measurements from an in-vacuum fast current transformer (CT), demonstrating a lack of reliable charge measurement over a range of different beam delivery parameters. Hence, quantifying the absolute charge delivered to the PEER end-station is a critical requirement for further dosimetry studies and overall beamline development. With known charge values, simulations can be created to predict dose, and accurate measurements will also enable the quantification of relative differences in charge delivery between consecutive irradiations during experiments. Although the preliminary investigations uncovered issues with the currently available diagnostics, PEER is considered suitable for further VHEE radiotherapy research and presents capabilities previously unavailable in Australia. To continue developing the PEER beamline, further diagnostics, in particular, in-air charge measurements, are critical to the advancement of the beamline and future user research.
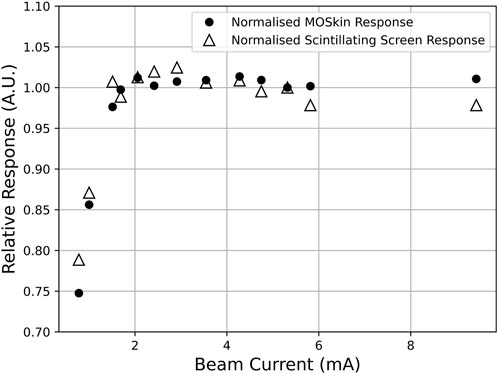
Figure 1. The loss of charge to the experimental stage at PEER for beam currents below 2 mA is observed in both MOSkin and scintillating screen data. The CT measurements were consistent across all beam currents. Figure from Cayley et al. [7], reproduced with permission.
A Faraday cup (FC) is a device that measures charge in the form of electrons, protons, or heavy ions. Many facilities globally have designed and built devices suited to their needs, with FC use during radiotherapy research documented over 40 years ago during proton therapy [13]. Recently, the advancement of UHDR research has led to the requirement for dose-rate independent diagnostics. FC devices are considered dose-rate independent and, hence, are often used to characterize other diagnostic devices [14–18].
In its most basic form, an FC is a block of conductive material insulated from an external housing of a sufficient size and density to absorb all of the energetically charged primary particles incident upon it, ideally retaining the secondary particles generated within [19, 20]. Although most often used in-vacuum, vacuumless designs have been found to provide sufficiently accurate measurements comparable to more complex, in-vacuum designs [20]. When designing an FC, an important consideration is the energy and type of the incident particles, as this will directly influence the physical size of the device [21]. Electric and magnetic fields are often used to filter and confine particles, especially in the case of proton beams [22], but the device may also be used passively for electrons if sized appropriately for the beam energy.
When charged particles are incident upon the conductive absorber of an FC, an electric current is generated within the FC. This current creates a signal that can be measured, for instance, with an oscilloscope or electrometer, allowing the charge incident upon the FC to be quantified. When measuring charge, the creation of secondary electrons with energies sufficient to leave the conductive absorber cannot be ignored. Those that are generated and stopped within the absorber will have no contribution to the measurable signal. However, those that leave will contribute to a loss in signal proportional to their quantity relative to the number of incident primary particles. Many FC designs use a high voltage ring at the beam entrance in order to repel secondary electrons created prior to the FC while suppressing those that are backscattered after being produced within the conductive absorber [16]. Another method is to add a second conductive material of lower density at the FC entrance, allowing primary particles to pass through to the absorber while collecting backscattered secondary electrons [19, 23]. In the case of the latter, the FC may be used without an external voltage applied, which would require less complicated readout systems, less electrical infrastructure, and would be considerably safer when used in close proximity to personnel conducting experiments. Regardless, the proportion of escaping secondaries must be known; if the proportion is large relative to the number of particles within the incident beam, the measurements will be inaccurate and not wholly reflect the charge being delivered.
To quantify the charge delivered by VHEE to the in-air end station at PEER, an FC was designed using locally available, off-the-shelf materials. As the PEER beamline is in the early stages of development, the FC should be a simple, portable, and cost-effective device. It is intended to be used passively to allow for simplified measurements and increased personnel safety while still allowing the application of an external voltage for commissioning purposes. The FC will be located in a small experimental area 900 mm downstream of the exit foil of the PEER linac, shown in Figure 2. In order to estimate absolute charge, a larger FC will minimize any scaling factors required, as all the incident charge will be absorbed, and any secondary particles will be retained. However, the limited space at PEER concedes the opportunity to simply oversize the components in excess of what is required, so a Monte Carlo simulation was used to assess the primary electron-stopping efficiency and secondary electron escape. Once built, the electrical readout was optimized for use with an external voltage source for commissioning and comparison against simulations. Within this paper, we show that the PEER FC performs as expected when unbiased and, therefore, is suitable for in-air measurements of 100 MeV electrons delivered to the end-station at PEER.

Figure 2. PEER beamline design. The Faraday cup will be situated in the small experimental area after the exit foil of the linac, immediately adjacent to the quadrupole and OTR screen that make up the first section of the booster ring transition. The physical size limitations of the FC are critical as extra space cannot currently be created in this area.
2 Methods
2.1 Initial design
To be suitable for the in-air end station at PEER, the most critical design metric of the FC was physical size limitation due to the limited available space at PEER while remaining capable of stopping 100 MeV electrons and retaining secondary electrons generated by the incident beam. Detailed in Figure 3, a cylinder of oxygen-free copper with a length of 270 mm and diameter of 111 mm was used for the conductive absorber, with a block of graphite measuring 100 mm × 100 mm × 50 mm placed in front at the beam entrance to act as a secondary conductive absorber for backscattered electrons. These dimensions were maximized within the size constraints. The absorbers are supported by 3D-printed spacers made from polylactic acid (PLA), a common plastic used in additive manufacturing that also provides electrical insulation from the stainless-steel housing. A 100 µm thick Kapton entrance foil was used to seal the front of the housing, with the addition of 40 µm thick aluminum foil to isolate the FC from electrical noise present in the linac tunnel. An electrical connection is provided by a 50
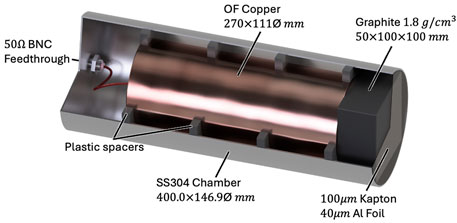
Figure 3. PEER FC dimensions and material choices. The graphite and copper may be left unbiased, or a DC voltage can be applied, if necessary, via the 50
2.2 Monte Carlo simulation
A Monte Carlo simulation was used to assess the design. The Geant4 toolkit (Version 11.00p03, with the G4EmStandardPhysics_option4 physics list) was chosen as it is a robust and reliable software package validated in many fields of physics [24, 25]. The simulation consists of a 100 MeV electron beam generated within a vacuum tube, with a 125 µm exit foil to replicate the conditions at PEER. Beam parameters advised by Australian Synchrotron staff include an energy distribution of
Geant4, however, cannot be used to predict the electrical output signal of a device. Hence, the information provided by the simulation will be analyzed in the context of the expected contribution to the electrical signal. For instance, if an electron is generated and stopped within the same volume, there will be no contribution to the signal. However, if the generation and stopping volumes are different, a loss or accumulation of secondary electrons within the copper and graphite absorbers will contribute to the signal and render it unrepresentative of the incident electron beam. Increasing levels of charge may affect the FC response due to space-charge effects, which cannot be studied with Geant4. However, due to the large physical dimensions of the conductive absorbers, it is expected that the FC should respond linearly and that the Geant4 simulations will remain representative of the physical device.
Within the simulation, the kinetic energy of any secondaries escaping the absorbers was also scored to assess whether, experimentally, they can be retained with the application of an external DC voltage to bias the FC. With
2.3 Experimental commissioning
2.3.1 Unbiased operation
For unbiased readout, the FC is connected to an oscilloscope using a triaxial cable connected to the 50
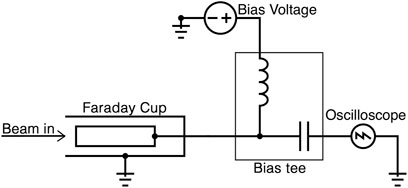
Figure 4. The FC is connected to the oscilloscope via a bias tee to allow the application of an external DC voltage during measurements. For passive, unbiased use, the power supply and bias tee are removed, and the FC is connected directly to the oscilloscope.
During any testing or commissioning at PEER, the standard practice is to deliver charge in a single pulse (also known as a bunch-train) consisting of 75 bunches, corresponding to a pulse length of approximately 150 ns, although satellite bunches at the head and tail will increase this value. The PEER bunch length is 100 ps with a 2 ns bunch spacing. To increase the level of charge within a pulse, the radio frequency (RF) power is increased in finite steps while holding all other parameters constant. The CT was used to measure in-vacuum charge prior to the final set of magnets, before the electrons pass through the exit foil, for comparison with FC measurements. The CT at PEER has not been calibrated for absolute charge and is, therefore, only a measure of relative charge. It should not be forgotten, however, that CT measurements have previously been shown to become uncorrelated with dose measurements at the in-air end station [7], so any deviation from linearity may not be a failure of the FC. Rather, any such deviations are further justification as to why an FC is required as part of a greater diagnostics suite for future experiments.
2.3.2 Externally biased operation
If enough low-energy secondary electrons escape the FC, it may be possible to use an external DC voltage to bias the FC and retain those secondary electrons. In order to determine this and compare it to the Geant4 simulation, increasing positive bias can be applied to the conductive absorber until the relative response between different voltages is flat. At this point, it can be assumed that either all the secondaries have been retained or that no further improvements are possible. A measurement of this level of accuracy would be suitable for the intended use of the FC during future VHEE radiotherapy experiments at PEER.
A Pulse Labs 5550B-104 bias tee was used to facilitate the application of an external DC voltage to the FC while isolating the oscilloscope. A bias tee is a device consisting of an inductor and a capacitor, connected as shown in Figure 4. Commonly used to prevent AC signals from passing the inductor on one leg of the tee to the power supply while allowing the passage of DC, the reverse is true via the other leg containing a capacitor for the connection to the oscilloscope. However, in the case of the FC measurement, power supply and oscilloscope protection are required while measuring the incident pulse of electrons, which is essentially a transient DC signal. As a preliminary experiment, the FC was tested unbiased, as well as with a bias of −50 V, 0 V (bias circuit connected with power supply set to 0 V), 50 V, and 102 V. The negative bias is used to confirm the circuit is wired correctly and behaves as expected by producing a signal less than that of the unbiased circuit. This preliminary experiment produced results that did not improve with the addition of positive external bias, which was at odds with expectations. Inspection of oscilloscope traces revealed what appeared to be a mismatch of the resistor-capacitor (RC) time constant of the circuit with the pulse length of the linac due to a constantly diminishing signal during the pulse and a significantly positive tail. Although convention states that capacitors allow AC currents while blocking DC, any transient currents will pass the capacitor for a short period of time, proportional to the RC time constant. Hence, when measuring a DC signal with a bias tee circuit, the value of the capacitor in the bias tee will cause signal decay according to
With the biased FC signal corrected, the experiment was repeated with a wider range of charge values. For voltages of −50 V, 0 V, +25 V, +50 V, +75 V, and +100 V, as well as unbiased, RF power was again increased in finite steps to increase the charge contained within a pulse. Measurements were also made with 0 RF power at the beginning of each iteration of the experiment to quantify signal due to background noise, which was subsequently subtracted from both the CT and FC measurements. At each level of RF power, 10 measurements were recorded to allow a mean and standard deviation to be calculated. During the period in which the experiments were conducted, the linac suffered from a minor vacuum leak, producing fluctuations that could not be immediately rectified due to operational requirements at the Australian Synchrotron. This led to different levels of charge being produced for a given RF power over the course of a shift. However, charge production was constant for each data point during the short time frame in which a series of measurements were made for a given bias. Results were plotted, with a linear trend line fitted to each dataset, to assess any change in signal during biased measurements by comparing the slope of the line. Increased electron stopping efficiency due to a positive bias on the FC absorber should lead to a proportional increase in signal and can be compared to the expected losses predicted by Geant4 when unbiased to assess the FC performance.
3 Results
Figure 5 shows the simulated positions of stopped primary and secondary electrons for
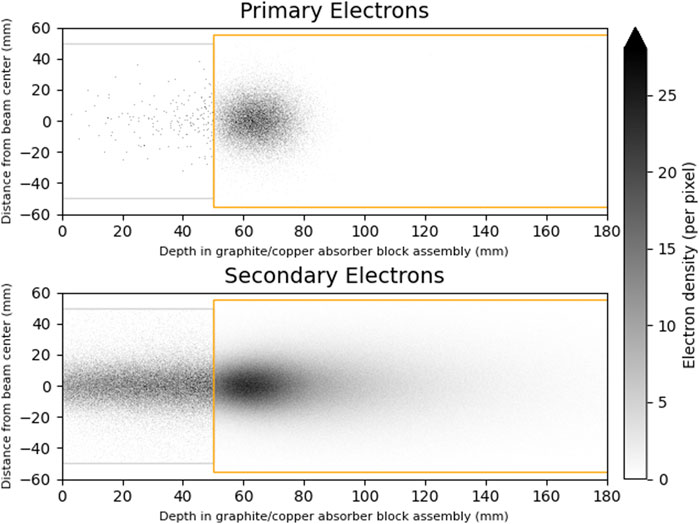
Figure 5. Geant4 simulation result of
Table 1 collates the results of these scenarios and expresses their quantities, the primary electron capture efficiency, and net capture efficiency due to escaping secondaries, and the expected electrical signal loss relative to the
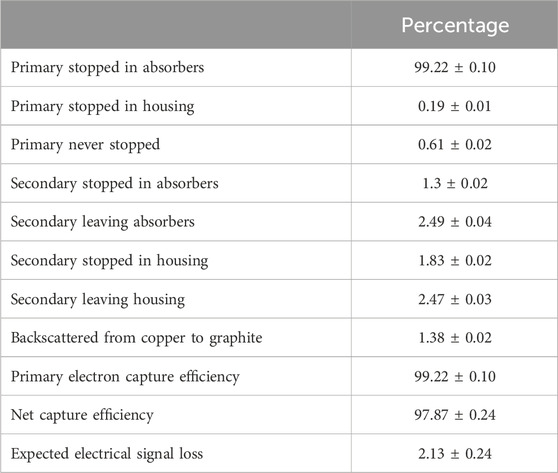
Table 1. Numerical results of five repeats of the Geant4 simulation, scoring the quantity of particles stopped in a volume that did not originate within or leaving a volume after originating within. The net capture efficiency is relative to the generated primary electrons. It is calculated by summing the expected contributions to the signal with a negative term for those contributions that will lead to a decreased current in the FC measuring circuit. Stated uncertainties are sample standard deviations.
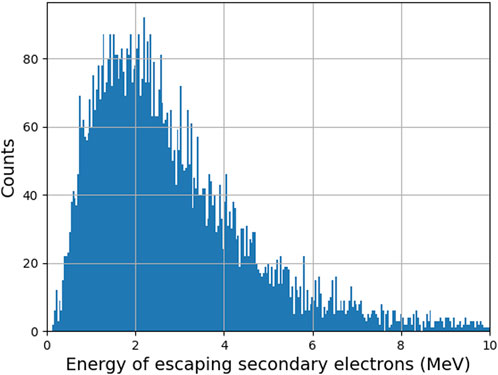
Figure 6. Simulated energy spectrum of secondary electrons as they leave the copper and graphite absorbers. The minimum energy is 0.12 MeV.
Figure 7 shows the first results of the PEER FC. Initially, an unbiased measurement was made, followed by the addition of a Pulse Labs bias tee to the measuring circuit to allow a DC voltage to be applied to the copper conducting block. Voltages of −50 V, 0 V, 50 V, and 102 V were tested. Applying −50 V yielded a lower stopping efficiency, as expected. However, applying a bias of 0 V, 50 V, and 102 V also resulted in a lower stopping efficiency relative to unbiased measurements. The introduction of the Pulse Labs bias tee caused a large signal loss, irrespective of the applied voltage. Figure 8B displays a sample oscilloscope trace when using the Pulse Labs bias tee to facilitate the external bias, compared to the unbiased trace shown in Figure 8A. Clearly, the shape of the pulse has been affected by introducing the bias tee into the measurement circuit. The diminishing signal during the pulse, coupled with the non-negligible positive tail, indicated a CBT with a larger RC time constant was required.
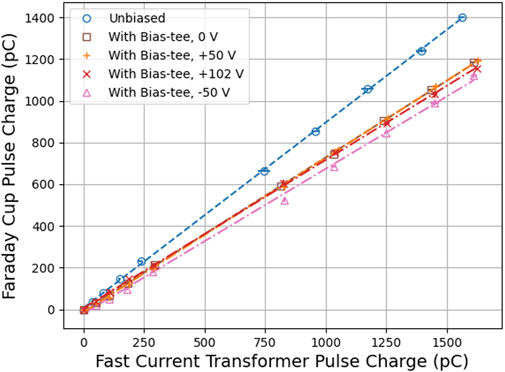
Figure 7. Charge measurements for the PEER FC, plotted against the CT with a Pulse Labs 5550B-104 bias tee in the measurement circuit. Measurements have been offset by the baseline measurement with no RF power to the linac. Measurements with a positive DC voltage applied to the FC yield a lower stopping efficiency than the unbiased measurements, indicating an issue with the readout system as a lower efficiency is not in agreement with theory. Uncertainties, if not visible, are within markers.
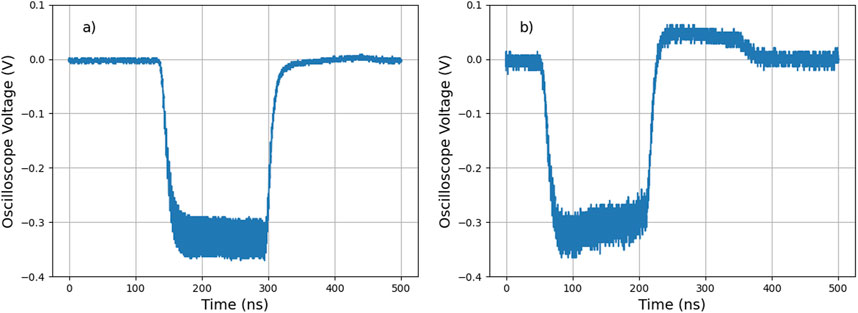
Figure 8. The oscilloscope trace recorded from unbiased FC measurements and when using a Pulse Labs 5550B-104 bias tee to facilitate the application of an external DC voltage to bias the FC are shown above in (A, B), respectively. The shape of the biased trace is indicative of an RC constant that is too low to allow measurement of the transient signal produced during the pulse of the linac.
By constructing a CBT with the capacitance raised by more than an order of magnitude, the FC signal returned to a shape that was visually comparable to an unbiased signal, and a sample trace is shown in Figure 9A. It should be noted that this sample trace is included only to demonstrate the shape of the pulse, and the magnitude should not be compared to previous results in Figure 8, as the measurements were performed over a month later under different operating parameters due to operational conditions at the Australian Synchrotron. As VHEE accelerators are at the frontier of what is possible for maximizing charge within a pulse while minimizing the temporal profile, possible changes in operating conditions are to be expected and further highlight the requirement for custom diagnostic solutions to perform radiotherapy research.
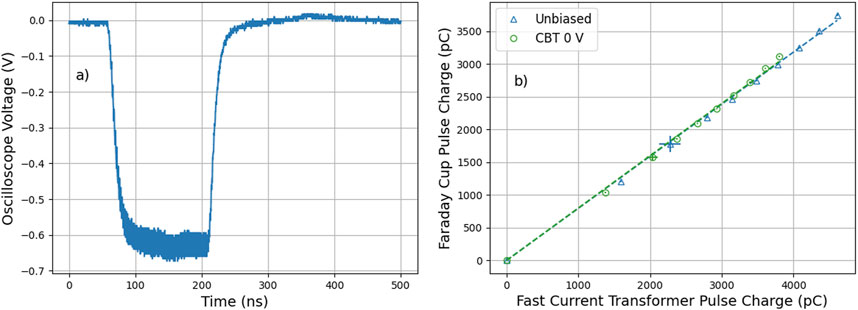
Figure 9. (A) Oscilloscope trace recorded when using the CBT to facilitate the application of an external DC voltage to bias the FC. The shape of the trace is what is expected from a linac pulse. (B) Results of the FC at 0 V via the CBT and unbiased with direct connection to the oscilloscope to investigate any impact on the signal due to the inclusion of the CBT. The slopes of the fitted lines are the same, with a slope of 0.795
After testing the CBT and ensuring the shape of the oscilloscope trace was as expected, the FC was used to measure the charge delivered by the linac, with and without the CBT, again including a measurement at 0 RF power to assess any electrical noise present in the linac tunnel and subtract it from the results. The data presented in Figure 9B compare unbiased measurements to those including the CBT with the power supply set to 0 V and demonstrate that within uncertainty, the CBT has no significant impact upon the resulting measurements.
With the CBT allowing unhindered measurement of the FC signal, the remaining external bias voltages were applied. Figure 10A presents a comparison of −25 V, unbiased, and +100 V, the largest positive voltage used. Linear fits for all positive external voltages used, as well as unbiased, are found in Figure 10B, with markers removed to aid readability. The results for external voltages of 25 V through to 100 V do not display a trend proportional to the magnitude of the voltage with an average improvement in the signal of (3.90
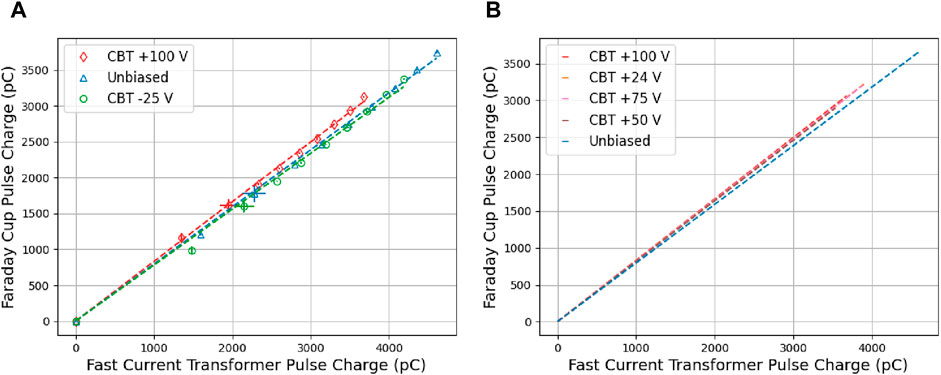
Figure 10. (A) FC results for both unbiased and with the CBT in the measurement circuit. Data for −25 V, unbiased, and +100 V only are included in this figure for clarity. The negatively biased measurements result in a lower stopping efficiency, as expected. Uncertainties, if not visible, are within markers. (B) Results for all measurements with a positive bias applied versus the unbiased measurement. Markers have been removed to facilitate a clearer presentation of data. The linear fits show the improvement in FC stopping efficiency is not correlated with increasing positive bias. The average slope of the measurements with external voltage applied is 0.826
4 Discussion
The Geant4 simulation predicted that the FC would retain (99.22
The experimental results, while linear, may suggest the FC is not collecting all the charge as the magnitude of measurements is always lower than the CT. The CT that is currently installed, however, is an in-vacuum device located prior to the final magnets on the PEER linac that are normally used for shaping the electron beam and steering it into the booster ring of the Australian Synchrotron. This position can be seen in Figure 2. Uncalibrated and used only for relative measurements, the CT is not a measure of absolute charge, although it can still be used to compare the performance of the FC across different levels of RF power and, hence, the charge contained within a pulse.
Initially, including a commercial bias tee in the measurement circuit to facilitate the application of an external DC voltage resulted in measurements of lower magnitude than those without external bias. Further work led to the build of a CBT for this application, the inclusion of which resulted in no change to the electrical signal, as shown in Figure 9B. With this improvement to the measurement circuit, the experiment produced results in which the application of a negative voltage produced a decreased signal compared to the unbiased circuit, while positive voltages showed no correlation to an improved signal, leading to an average increase in signal of (3.9
During the design phase of the FC, the ability to apply an external bias to the FC was incorporated with the intent of retaining all secondaries created within the copper and graphite absorbers. However, as discussed above and shown in Figure 6, the Geant4 simulation reveals that the energies of escaping secondaries are orders of magnitude too great to be retained with the application of 100 V. Hence, retaining these secondary electrons with an external bias is not possible as a voltage of the required magnitude, on the order of
The improvement in signal did not trend proportionally to the magnitude of the applied voltage. A plausible explanation is that the increase in signal is due to the collection of a small ionization current in the air surrounding the absorbers. To briefly investigate this, consider that applying an external bias of 25 V–100 V produces an electric field between the copper absorber (the dominant absorber by surface area) and outer housing in the radial direction of 13.93 V cm−1 to 55.71 V cm−1. These values can be used to calculate the electron drift velocity in-air using the Magboltz code (version 11.19) [26], a Monte Carlo simulation for solving the Boltzmann transport equations for electrons in gas mixtures. For a simple mixture of 78% oxygen and 22% nitrogen at 20°C and 101.3 kPa, the Magboltz code calculates an electron drift velocity of 1.84 μm ns−1 to 3.45 μm ns−1. Within this range of drift velocities, the maximum distance an electron escaping recombination in-air can travel during the FC measurement is estimated to be 0.52 mm. This suggests any ionization current collected must have originated within very close proximity to the conductive absorbers. If all the electrons created in the void between the conductive absorbers and outer shell due to ionization of the air were collected, the expected increase in the signal would be orders of magnitude larger. This explanation could be investigated further by designing the FC to be operated under a vacuum, as there would no longer be any ionization of air. In this scenario, any operation of the FC with an external bias would require a vacuum. However, the operation of the FC under vacuum, without the application of an external bias, would not produce any benefits. Given the strong performance of the FC without an external bias, the increased complexity of evacuating the FC will create a situation whereby diminishing returns will quickly render further pursuits of marginal gains unpractical.
As the increase in electrical signal cannot be due to the retention of the secondary electrons created within the copper and graphite, the improved results should be discarded as they do not reflect the charge within the linac pulse that is incident upon the FC. Without the application of an external voltage, oscilloscope isolation is not required, reducing measurement complexities. Additionally, this renders the PEER environment safer for future users working in close proximity to the FC by removing any risk of contact with an external voltage.
5 Conclusion
The results of this work demonstrate that the PEER FC is believed to accurately represent the charge incident upon it for the intended use of informing future dosimetry simulations at PEER and relative measurements of charge between pulses during experiments. To calculate the charge traversing the exit foil for different experimental settings, we recommend that the PEER FC be used unbiased with the application of a scaling factor determined by Geant4 simulation on a case-by-case basis dictated by user requirements.
The designed and built Faraday cup is suitable for determining in-air, the total charge delivered by 100 MeV electrons to the PEER end-station, and will, therefore, form a valuable part of the expanding suite of diagnostic tools for future UHDR VHEE radiotherapy research.
Data availability statement
The raw data supporting the conclusions of this article will be made available by the authors, without undue reservation.
Author contributions
JC: conceptualization, data curation, formal analysis, investigation, methodology, visualization, writing–original draft, and writing–review and editing. JP: formal analysis and writing–review and editing. SG: software, supervision, and writing–review and editing. AR: funding acquisition, resources, supervision, and writing–review and editing. ML: funding acquisition, resources, supervision, and writing–review and editing. Y-RT: conceptualization, data curation, funding acquisition, investigation, resources, software, supervision, and writing–review and editing.
Funding
The author(s) declare that financial support was received for the research, authorship, and/or publication of this article. JC receives the Australian Government RTP scholarship APP505948.
Acknowledgments
This research was undertaken on the PEER beamline, Australian Synchrotron, which is part of ANSTO.
Conflict of interest
The authors declare that the research was conducted in the absence of any commercial or financial relationships that could be construed as a potential conflict of interest.
The author(s) declared that they were an editorial board member of Frontiers, at the time of submission. This had no impact on the peer review process and the final decision.
Publisher’s note
All claims expressed in this article are solely those of the authors and do not necessarily represent those of their affiliated organizations, or those of the publisher, the editors, and the reviewers. Any product that may be evaluated in this article, or claim that may be made by its manufacturer, is not guaranteed or endorsed by the publisher.
References
1. Schüler E, Acharya M, Montay-Gruel P, Loo JBW, Vozenin MC, Maxim PG. Ultra-high dose rate electron beams and the FLASH effect: from preclinical evidence to a new radiotherapy paradigm. Med phys, 49 (2022) 2082–95. doi:10.1002/mp.15442John Wiley and Sons, Ltd
2. Favaudon V, Caplier L, Monceau V, Pouzoulet F, Sayarath M, Fouillade C, et al. Ultrahigh dose-rate FLASH irradiation increases the differential response between normal and tumor tissue in mice. Sci Translational Med (2014) 6:245ra93. doi:10.1126/scitranslmed.3008973
3. Montay-Gruel P, Acharya MM, Gonçalves Jorge P, Petit B, Petridis IG, Fuchs P, et al. Hypofractionated FLASH-RT as an effective treatment against glioblastoma that reduces neurocognitive side effects in mice. Clin Cancer Res official J Am Assoc Cancer Res (2021) 27:775–84. doi:10.1158/1078-0432.CCR-20-0894
4. Sarti A, De Maria P, Battistoni G, De Simoni M, Di Felice C, Dong Y, et al. Deep seated tumour treatments with electrons of high energy delivered at FLASH rates: the example of prostate cancer. Front Oncol (2021) 11:777852. doi:10.3389/fonc.2021.777852
5. Ronga MG, Cavallone M, Patriarca A, Leite AM, Loap P, Favaudon V, et al. Back to the future: very high-energy electrons (VHEEs) and their potential application in radiation therapy. Cancers (2021) 13:4942. doi:10.3390/cancers13194942
6. DesRosiers C, Moskvin V, Bielajew AF, Papiez L. 150-250 MeV electron beams in radiation therapy. Phys Med and Biol (2000) 45:1781–805. doi:10.1088/0031-9155/45/7/306
7. Cayley J, Tan YRE, Petasecca M, Cutajar D, Breslin T, Rosenfeld A, et al. MOSkin dosimetry for an ultra-high dose-rate, very high-energy electron irradiation environment at PEER. Front Phys (2024) 12. doi:10.3389/fphy.2024.1401834
8. Kwan I, Rosenfeld A, Qi Z, Wilkinson D, Lerch M, Cutajar D, et al. Skin dosimetry with new MOSFET detectors. Proc 15th Solid State Dosimetry (Ssd15) (2008) 43:929–32. doi:10.1016/j.radmeas.2007.12.052
9. Tai M, Patterson E, Metcalfe PE, Rosenfeld A, Oborn BM. Skin dose modeling and measurement in a high field in-line MRI-linac system. Front Phys (2022) 10. doi:10.3389/fphy.2022.902744
10. Patterson E, Stokes P, Cutajar D, Rosenfeld A, Baines J, Metcalfe P, et al. High-resolution entry and exit surface dosimetry in a 1.5 T MR-linac. Phys Eng Sci Med (2023) 46:787–800. doi:10.1007/s13246-023-01251-6
11. Biasi G, Su FY, Al Sudani T, Corde S, Petasecca M, Lerch MLF, et al. On the combined effect of silicon oxide thickness and boron implantation under the gate in MOSFET dosimeters. IEEE Trans Nucl Sci (2020) 67:534–40. Conference Name: IEEE Transactions on Nuclear Science. doi:10.1109/TNS.2020.2971977
12. Su FY, Biasi G, Tran LT, Pan V, Hill D, Lielkajis M, et al. Characterization of MOSFET dosimeters for alpha particle therapy. IEEE Trans Nucl Sci (2022) 69:925–31. Conference Name: IEEE Transactions on Nuclear Science. doi:10.1109/TNS.2022.3153697
13. Verhey LJ, Koehler AM, McDonald JC, Goitein M, Ma I-C, Schneider RJ, et al. The determination of absorbed dose in a proton beam for purposes of charged-particle radiation therapy. Radiat Res (1979) 79:34–54. Publisher: Radiation Research Society. doi:10.2307/3575020
14. Diffenderfer ES, Verginadis II, Kim MM, Shoniyozov K, Velalopoulou A, Goia D, et al. Design, implementation, and in vivo validation of a novel proton FLASH radiation therapy system. Int J Radiat Oncol Biol Phys (2020) 106:440–8. doi:10.1016/j.ijrobp.2019.10.049
15. Darafsheh A, Hao Y, Zwart T, Wagner M, Catanzano D, Williamson JF, et al. Feasibility of proton FLASH irradiation using a synchrocyclotron for preclinical studies. Med Phys (2020) 47:4348–55. United States. doi:10.1002/mp.14253
16. Schoenauen L, Coos R, Colaux JL, Heuskin AC. Design and optimization of a dedicated Faraday cup for UHDR proton dosimetry: implementation in a UHDR irradiation station. Nucl Instr Methods Phys Res Section A: Acc Spectrometers, Detectors Associated Equipment (2024) 1064:169411. doi:10.1016/j.nima.2024.169411
17. Giuliano L, Franciosini G, Palumbo L, Aggar L, Dutreix M, Faillace L, et al. Characterization of ultra-high-dose rate electron beams with ElectronFlash linac. Appl Sci (2023) 13:631. doi:10.3390/app13010631
18. Richter C, Karsch L, Dammene Y, Kraft SD, Metzkes J, Schramm U, et al. A dosimetric system for quantitative cell irradiation experiments with laser-accelerated protons. Phys Med Biol (2011) 56:1529–43. doi:10.1088/0031-9155/56/6/002
19. Johnston R, Bernauer J, Cooke C, Corliss R, Epstein C, Fisher P, et al. Realization of a large-acceptance Faraday cup for 3MeV electrons. Nucl Instr Methods Phys Res Section A: Acc Spectrometers, Detectors Associated Equipment (2019) 922:157–60. doi:10.1016/j.nima.2018.12.080
20. Cascio EW, Gottschalk B. A simplified vacuumless Faraday cup for the experimental beamline at the francis H. Burr proton therapy center. In: Journal Abbreviation: 2009 IEEE Radiation Effects Data Workshop (2009). p. 161–5. doi:10.1109/REDW.2009.5336294IEEE Radiat Effects Data Workshop
21. Brown KL, Tautfest GW. Faraday-cup monitors for high-energy electron beams. Rev Scientific Instr (1956) 27:696–702. doi:10.1063/1.1715674
22. Winterhalter C, Togno M, Nesteruk KP, Emert F, Psoroulas S, Vidal M, et al. Faraday cup for commissioning and quality assurance for proton pencil beam scanning beams at conventional and ultra-high dose rates. Phys med biol, 66 (2021) 124001. doi:10.1088/1361-6560/abfbf2IOP Publishing
24. Agostinelli S, Allison J, Amako K, Apostolakis J, Araujo H, Arce P, et al. Geant4—a simulation toolkit. Nucl Instr Methods Phys Res Section A: Acc Spectrometers, Detectors Associated Equipment (2003) 506:250–303. doi:10.1016/S0168-9002(03)01368-8
25. Arce P, Bolst D, Bordage MC, Brown JMC, Cirrone P, Cortés-Giraldo MA, et al. Report on G4-med, a Geant4 benchmarking system for medical physics applications developed by the Geant4 medical simulation benchmarking group. Med. Phys. 48 (2021) 19–56. doi:10.1002/mp.14226John Wiley and Sons, Ltd
Keywords: Faraday cup, very high-energy electrons, radiotherapy, FLASH, absolute charge, beam diagnostics, GEANT4
Citation: Cayley J, Paino J, Guatelli S, Rosenfeld A, Lerch M and Tan Y-RE (2024) Simulation and commissioning of a Faraday cup for absolute charge measurements of very high-energy electrons in-air at PEER. Front. Phys. 12:1448025. doi: 10.3389/fphy.2024.1448025
Received: 12 June 2024; Accepted: 11 September 2024;
Published: 01 October 2024.
Edited by:
Luigi Palumbo, Sapienza University of Rome, ItalyReviewed by:
Andrea Mostacci, Sapienza University of Rome, ItalyWania Wolff, Federal University of Rio de Janeiro, Brazil
Copyright © 2024 Cayley, Paino, Guatelli, Rosenfeld, Lerch and Tan. This is an open-access article distributed under the terms of the Creative Commons Attribution License (CC BY). The use, distribution or reproduction in other forums is permitted, provided the original author(s) and the copyright owner(s) are credited and that the original publication in this journal is cited, in accordance with accepted academic practice. No use, distribution or reproduction is permitted which does not comply with these terms.
*Correspondence: James Cayley, amNheWxleUB1b3cuZWR1LmF1
 James Cayley
 Jason Paino
 Susanna Guatelli
 Anatoly Rosenfeld
 Michael Lerch
 Yaw-Ren E. Tan