- 1College of Management and Economics, Tianjin University, Tianjin, China
- 2Management School, University of Sheffield, Sheffield, United Kingdom
- 3Business College, Hebei Normal University, Shijiazhuang, China
- 4School of Economics and Management, University of Science and Technology Beijing, Beijing, China
Beijing is one of the earliest pilot low-carbon cities in China. It was one of the first cities in China to establish a pilot carbon market to achieve this goal. As an emerging market, China’s carbon pricing mechanism is not yet complete. In this context, it is crucial for market managers and companies to predict carbon prices. This study uses a Prophet-EEMD-LSTM model to predict the carbon price in the Beijing carbon market, which significantly improves prediction performance. The advantage of this hybrid model is that it considers the particularities of carbon prices including trends, cyclical changes, and volatility. Considering that the carbon market has multiple complex characteristics, the carbon price is decomposed into multiple simple sequences using the Prophet and EEMD models. These simple sequences were predicted using an LSTM model. The hybrid model outperformed both econometric and single-machine learning models in terms of carbon price prediction. Based on the findings of this study, market managers and companies can take appropriate measures to prevent carbon price risks. These findings are conducive to the smooth operation of the carbon market, thereby providing sustainable support and guidance for the development of low-carbon cities.
1 Introduction
China is becoming the world’s largest energy consumer owing to its rapid urbanisation. Cities require a substantial amount of energy to keep the economy running smoothly because they are hubs of economic activity. According to [1], cities consume most of China’s energy. Accordingly, the Chinese government implemented programmes to reduce emissions and conserve energy. Among them, the most typical one is the “Low Carbon City Pilot” strategy. The first batch of pilot projects covered eight cities and was subsequently expanded in 2012 and 2017. To date, this strategy has covered 80 cities and one region. Beijing was one of the earliest pilot low-carbon cities in China. Beijing was one of the first cities in China to establish a pilot carbon market to achieve the goal of becoming a low-carbon city.
As a policy tool for direct control of corporate carbon emissions, although the carbon market has increased the policy constraints on carbon emissions and carbon reduction costs for the included companies, it provides more flexible strategies through the trading mechanism to help companies reduce emissions. In addition, a mature and efficient carbon market provides opportunities for companies to cope with global competition. However, if the carbon asset management business is not done well, it may not only cause the loss of carbon assets and increase operating costs but also harm businesses’ ability to compete in their industry and interfere with their ability to grow sustainably. Therefore, companies are increasingly concerned about the proper management of carbon assets [2].
Formation of accurate expectations of carbon price trends is a prerequisite for carbon asset management. By imposing a certain price on carbon emissions, the carbon market introduced flexible performance methods for enterprises in the short term. When the price of carbon is low, businesses with substantial emission-reduction costs can achieve compliance through market transactions. When carbon prices are high, businesses with low emission-reduction costs can increase their income through the carbon market and hasten the implementation of emission-reduction initiatives. In the long term, expectations of carbon prices directly affect a company’s decision-making regarding emission reduction investment. If a company can accurately judge the future tendency of carbon prices, it will adjust its carbon asset management strategy accordingly. According to a case study of China Shenhua, [3] found that when China Shenhua obtained excess emission allowances through multiple market transactions, its net income was higher than that from investments in emission reduction technology. Achieving this goal requires a prerequisite: enterprises must be able to predict the tendency of the carbon price and conduct transactions at the corresponding price points to obtain excess returns.
Theoretically, the marginal cost to the market to reduce emissions is reflected in carbon prices. However, carbon prices are erratic because the carbon market is still developing. The cost of emission reduction is not yet fully reflected in the price, and the price trend is too hazy. The regional carbon market in China is still in its early stages of growth, and the national carbon market in China has only been established since 2021. Thus, China’s carbon market lacks a well-developed price structure. The cost of reducing carbon emissions, issuing carbon allowances, and the supply and demand dynamics of carbon allowances will result in significant oscillations in carbon prices in China [4,5]. Accurate carbon price forecasting can help policymakers prevent systemic market risks [6]. Additionally, it can reduce the exposure of market participants to carbon market risks and boost their asset value [7]. However, carbon pricing exhibits unstable and non-linear characteristics under the influence of internal market mechanisms, external environmental heterogeneity, and related regulations, making it challenging for businesses involved in the carbon market to estimate carbon prices [8,9].
The two primary methods for estimating carbon prices are machine-learning and econometric models. Based on the assumption that carbon prices are linear and normally distributed, several researchers have employed the Autoregressive Moving Average (ARMA) and Generalised Autoregressive Conditional Heteroskedasticity (GARCH) models to forecast carbon prices [10,11]. However, as [12] noted, classic econometric models are typically unable to manage this situation because carbon price time series have non-stationary and non-linear properties. To solve this problem and achieve better prediction results, some scholars have begun to use intelligent algorithms to predict time series, such as Markov models, support vector machines (SVM), and backpropagation neural networks. They can accurately detect hidden non-linear features in a time series and are not required to meet econometric assumptions. This robust self-learning capability compensates for the limitations of conventional econometric models and significantly increases forecasting accuracy.
Although machine learning models have good prediction performance, the process is uncontrollable and ignores the actual operating mechanism of the time series. Considering that there is a compliance cycle in the carbon market and that the price has obvious periodicity, this study employs both machine learning and econometric methods to accurately forecast carbon pricing, namely, the EEMD-PROPHET-LSTM hybrid model. This study contributes to both theoretical research and practice. In terms of theoretical research, the constructed hybrid model combines the strengths of econometric and machine-learning models, which can split and simplify the intricate characteristics of carbon prices, and reduces the difficulty of machine learning. Compared to econometric or machine learning models, the prediction performance of the hybrid model is better, pointing to a new direction for improving carbon price prediction performance. In terms of practical contributions, this study provides market managers with risk warnings. Market managers can implement preventive and control measures in advance when carbon prices change significantly. Simultaneously, it can provide a reference for enterprises to invest in emission reduction or carbon trading. Overall, this research provides inspiration for risk prevention for the smooth operation of the carbon market, thereby promoting the low-carbon development of cities.
The remainder of this paper is organised as follows. In Section 2, the related literature is succinctly evaluated. The hybrid model used in this study is described in Section 3 and the findings are discussed in Section 4. Finally, Section 5 presents the empirical results and policy implications.
2 Literature review
Investors have begun to pay attention to the climate industry as environmental issues have become more serious in recent years. Consequently, carbon prices have gradually received increasing attention. The carbon price can reflect the extra cost that enterprises pay for carbon emissions in the process of production and operation, which will directly affect the future cash flow of enterprises; therefore, investors will use this indicator as an investment reference.
The emphasis on carbon price projections in the literature has expanded significantly over the past 10 years because of the growing significance of carbon prices. Most early studies used linear models based on historical price data to predict carbon prices, including the Vector Auto Regression (VAR) and Autoregressive Moving Average models. Additionally, several studies have simulated and forecasted variations in carbon pricing using the Autoregressive Conditional Heteroskedasticity (ARCH) or Generalised Autoregressive Conditional Heteroskedasticity (GARCH) model. The carbon market is a developing policy market that is not entirely efficient and is easily affected by factors such as carbon market policies, economic policy uncertainties, weather, and energy prices [13,14]. Consequently, several researchers have included these indications in the carbon price prediction model, which has improved the model’s ability to make predictions. In summary, all of these models were constructed based on the assumption that carbon prices are linear and normally distributed.
[15] introduced an empirical mode decomposition (EMD) model to transform the initial carbon price series into more regular subsequences and then carried out an in-depth analysis of the subsequences individually. [16] also revealed that data preprocessing decomposition models can improve the prediction accuracy of carbon pricing considering the high inherent complexity and non-linearity of the time series. Initially, the EMD model was proposed by [17] of NASA for the first time on the basis of instantaneous frequency to propose a new signal processing method and was improved the following year. The fundamental idea behind this model is to stabilise the signal and sequentially separate the time series of various scales in the signal. This strategy is frequently used when dealing with non-stationary and non-linear time series data. After decades of development, the EMD method has gradually formed a complete and independent theoretical system. The EMD model has been widely used in various fields and mainly focuses on time-series analysis and forecasting.
In natural science research, EMD has been applied to physical geographic detection, biological signal processing, meteorological analysis, and prediction [18–20]. In mechanical engineering, many scholars have applied this method to mechanical fault diagnosis. To adjust the numerical control codes to account for the systematic errors of surface parts, [21] employed the EMD approach to separate machining defects into systematic and random errors. In economics, the EMD approach has recently been employed for output and price forecasting. [22] analysed food and agricultural prices using the EMD model. Based on this model, some scholars have predicted crude oil prices [23] and electricity prices [15]. Furthermore, using the EMD model, [24] forecasted the energy usage in a paint workshop. This approach has also been used to predict carbon prices [25,26].
Since then, EMD has been used more frequently in data preprocessing and has performed well. However, improvements should be sought because the EMD algorithm is susceptible to mode mixing. Wu and Huang [27] proposed an Ensemble Empirical Mode Decomposition (EEMD) model to solve this issue. They introduced white noise to the data, allowing them to be automatically assigned to the appropriate reference scale and preventing pattern mixing. In addition to developing the model itself, some scholars have found that combining the EMD model with other methods can improve its fit and predictive capabilities. According to Liu et al. [28], the predictive effects of mixed models using several approaches are typically superior to those of a single model. Subsequently, a few hybrid models based on EMD have been proposed, including EMD-ARIMA, EMD-VAR [29], and EMD-PSO [30] respectively. All of their studies showed that when compared to a single model, the prediction accuracy of the proposed combination model greatly improved.
Although there is certainly opportunity for development, the aforementioned innovative algorithms are all static networks, making it challenging to accurately portray a dynamic financial market. Because deep learning imitates the functioning of the human brain, it is thought to be closer to artificial intelligence and produces more accurate predictions. According to [31], long short-term memory (LSTM) is a powerful recursive iterative neural network for deep learning. It is built using a recurrent neural network (RNN) that has memory and is capable of feeding back the input from a previous step to the present phase to fulfil the needs of a dynamic system. Consequently, LSTM has recently been used in financial markets in place of language systems, image recognition, and machine translation, such as stock price prediction, exchange rate prediction for the euro versus the US dollar [32], and commodity price prediction [28]. These academic studies have demonstrated that LSTM is both practical and efficient in the field of financial market forecasting and that it has superior predictive power compared to currently used models. To assess the complicated price data, the LSTM approach and the EEMD model were used together. The historical electricity consumption data were divided using the EEMD approach of [33], who then used LSTM to predict high--and low-frequency data.
It is demonstrated that EEMD-LSTM performs better in prediction than either of the two models alone. The hybrid model was applied to forecast stock prices [34], gold prices [35], precious metal prices [36], and more. However, as both EMD and EEMD model are prone to frequent mode mixing during decomposition, which negatively affects their decomposition results, some scholars combined the complete ensemble empirical mode decomposition (CEEMDAN) model which is improved from the EEMD model and LSTM model to predict the carbon price, and found this hybrid model has a more accurate prediction [37,38]. Subsequently, to further decompose the carbon price data, [39] proposed a five-step hybrid approach based on CEEMDAN model for carbon price, including feature selection technique, Grey Wolf Optimizer, variational mode decomposition, and LightGBM. [40] adopted another method to improve the accuracy of carbon price decomposition, namely the improved complete ensemble empirical mode decomposition (iCEEMDAN) model, and then applied the LSTM model in the prediction process. What these studies have in common is that they are committed to breaking down carbon price data more thoroughly.
Unfortunately, no matter how thoroughly the data is broken down, these model’s inability to identify the periodicity of the data itself prevents it from being a reliable predictor of carbon pricing. Carbon prices are highly cyclical since the carbon market is a policy-based carbon market where allowances are allocated and cancelled once a year. During regular time, the carbon price fluctuates less. During the period of carbon allowance allocation and cancellation, the market becomes more active, and the carbon price fluctuates stronger [41]. Since carbon prices have obvious periodicity, it is necessary to extract the different periodic characteristics of the data before decomposing the carbon price data, so as to increase the effectiveness and interpretability of the data decomposition. In this background, the Prophet model is suitable for identifying this feature of the data [42,43]. Energy economics employs the Prophet model because energy consumption exhibits a clear seasonal rhythm. In a study by [44], a Prophet model was proposed for heat load forecasting, and it was proven that this model is superior for this purpose. In addition, the Prophet model was employed by [24] to forecast a company’s energy usage, and the findings demonstrated its strong predictive power.
3 Methods and data
3.1 Methods
3.1.1 Prophet model
Prophet was originally proposed for business forecasting and is an open-source time-series forecasting model published by Facebook [45]. It focuses on a thorough examination of the traits and temporal dynamics of time series data to forecast future development trends. The Prophet model can model and fit the original time-series data and is highly sophisticated. It can automatically fill in the gaps in the original data throughout the modelling process. Both the sensitivity and adjustment capacity to adjust are outstanding. The fundamental idea is based on trend term modelling, which combines periodicity and particular mutation sites. The Prophet model first evaluates the overall trend of the initial data, node-divides the array into segments, and performs segment fitting. Owing to the apparent periodicity that typically characterises business actions, the Prophet model builds a Fourier series to identify a periodic function that suits the present array.
In summary, the Prophet model employs an accumulation mode that superimposes numerous model components, the most crucial of which is the
The trend function serves as the central component of the model because, as previously mentioned, the Prophet model is based on the general trend of the array. The saturated growth and piecewise linear models are the two primary models. Within the definition domain, the trend of the saturated growth model does not expand indefinitely. Instead, it increases to a certain point and then levels out, becoming gentle rather than steep, although its value still changes slightly. The price of carbon can fluctuate without a cap, which is not consistent with the saturated growth model; therefore, a piecewise linear model is applied to fit the trend of carbon prices. There will likely be an abrupt change in carbon price data at some points. Fortunately, Prophet allows customisation of the position of the mutation point. Prophet offers two options: one is to choose the mutation point manually, and the other is to choose the mutation point automatically using an algorithm. In this study, the second method was used to identify the locations of the mutation points. The piecewise linear function model is expressed as Eq. 2:
where
Prophet will choose at least 25 change points when automatically capturing change points and will only set the change point area to the first 80% of the time-series data. Additionally, it relies on the realism of the boundary constraints for function changes. The model equally splits the time-series data by dividing each interval and change point, given that the periodic boundary criteria are satisfied.
All time-series forecasting models also consider cyclical fluctuations, as does the Prophet model. Unlike conventional prediction models, Prophet converts the trigonometric function to a Fourier series and modifies the Fourier series to account for the periodicity of the data in actual settings. A single periodicity is expressed in the form of a Fourier series as shown in Eq. 4:
where
The carbon market represents a new policy market. Every year, market activity tends to increase with compliance. We presumed that the carbon price has an annual cycle because it is typically higher at this time of the year. Similar to the stock market, the carbon market only conducts trading on days that are considered to be lawful working days. Research on the stock market has discovered notable variations in investor sentiment and stock returns on each day of the week (Mardy and Angel, 2021), with stronger risk aversion on Mondays and higher risk appetite on Fridays [46]. Therefore, we assumed that carbon trading exhibits weekly cyclicality, as do carbon prices.
Building a Prophet model is a cyclic analytical process that can be divided into four simple steps. Making a time series model is the first step. Evaluating the model by making numerous parameter efforts and assessing the ideal model through simulation effects is the second step. The third step is to directly present the problem and manually adjust potential factors with large errors based on the problem description. The last step is to visually present the prediction results, reflect the problem to the operator, and then let the operator think about how to make adjustments.
3.1.2 EEMD model
Frequency- and time-domain analyses as well as the bulk of conventional signal processing methods rely on the Fourier transform, which is based on the notion that the process that generates signals is stationary and linear. In many cases, the signal generation process is either non-stationary or non-linear. [17] introduced the empirical mode decomposition (EMD) strategy, a new time-frequency analysis technique, to address this issue. The fundamental idea behind EMD is to smoothen the signal and incrementally decompose the fluctuations of various scales in the signal. Consequently, a series of subsequences with various frequencies and amplitudes can be obtained along with a trend term, in which each subsequence represents the wave mode of the original sequence at different scales, corresponding to an intrinsic mode function (IMF). However, there is also a problem with this algorithm: it is prone to mode mixing. In this context, [27] proposed an EEMD model to solve modal mixing and other problems that exist in EMD through noise-assisted signal processing. The specific method is to add white noise to the original signal to make the frequency distribution more uniform and then use the EMD method to decompose it.
The following are the precise steps of EEMD decomposition:
Step 1: After adding the noise signal w(t) to the original signal X(t), signal
Step 2: The upper envelopes
Step 3: By eliminating the mean of the upper and lower envelope series of the carbon price, the first IMF component is obtained through Eq. 7:
Step 4: Use the
where
Step 5: The separation process should be repeated
Step 6: If
Step 7: The entire decomposition process ends if the remaining term r(t) is changed to a monotonic function or constant or if the amplitude is below the predetermined threshold value, making it impossible to further extract the IMF; otherwise, r(t) is regarded as a new sequence,
3.1.3 LSTM model
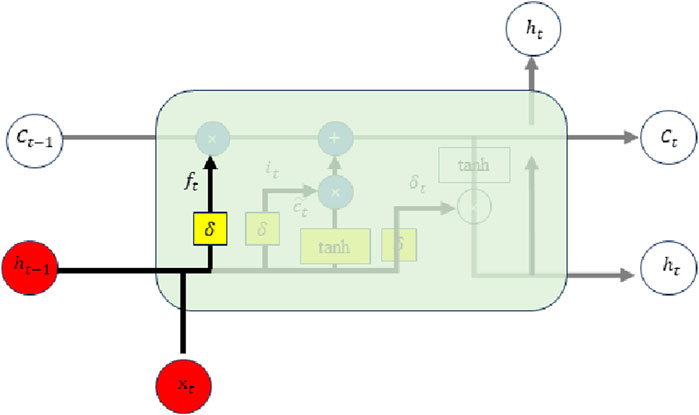
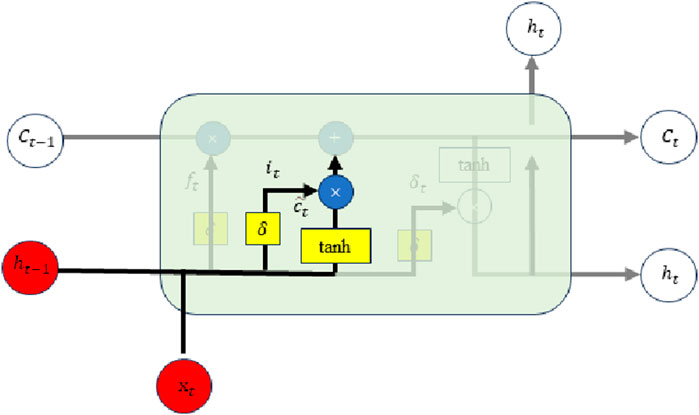
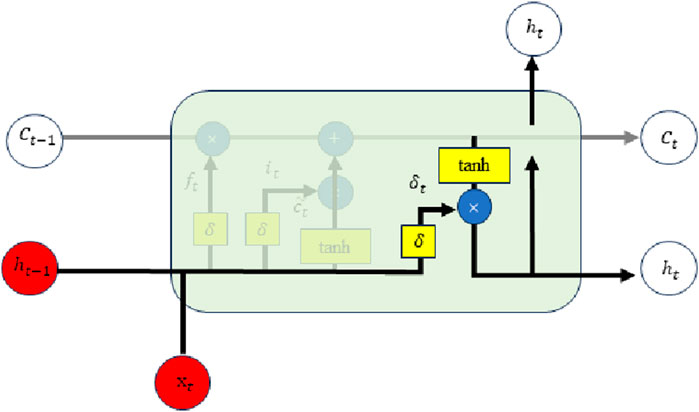
An improvement to the RNN is the LSTM model. In an RNN, the structure of the hidden layer is relatively simple, with only one tanh function. The key distinction between the two is that the LSTM contains four processing neural units, which makes it better at handling complex information. The hidden layer neural unit module structure of the LSTM was modified and significantly altered compared with the standard neural network layout. Figure 1 shows the precise structure of an LSTM memory module. For easier observation, we separated the internal structure into three distinct yet linked parts: the input gate, output gate, and forget gate. They regulate the reading, writing, and resetting of the data in the hidden layer. The LSTM neural unit has a three-layer structure, as shown in the figure, all of which are linked and transmit information to each other. The yellow part in the figure represents the various activation functions in the memory module, whereas the blue part represents the basic operations as well as the operations of the data stream, such as the addition or subtraction of different data streams. The red storage component is responsible for the computation and data transmission. This capability enables the cell unit to accept both the current data status and the data stream passed the previous instant. This is an essential component of the system.
Different “gates” are used by LSTM to regulate the quantity of data that is added to or removed from the storage media. There are three gate units in the memory module: the output gate, input gate, and forget gate. These three “gates” work together to process data in order to fulfil the neural network’s control function. When information enters the memory module, it undergoes two operations: a product operation when it enters the forgetting gate, which symbolises the deletion of old information, and an addition operation when it enters the input gate, which symbolises the updating of old states. There are switches for these three doors. These doors are similar to switches, and the opening and closing of the switch affects the transmission of the current. Therefore, the amount of information involved in the computation of the current neural network and that involved in the computation of the next neural unit can be determined.
The forget gate determines whether to discard the information transferred from the previous cell state or to retain part of it to enter a new loop structure. The processed information is recorded as
The value adjusted by the
Figure 3 depicts the internal structure of the input gate, which consists primarily of two elements. The first part has the same principle as that of the forgetting gate. It also activates the newly input
Figure 4 depicts the internal layout of the output gate. The first section of the principle for this layer, which is primarily composed of two parts, is essentially the same as the principles of the preceding levels. The output value
where
3.1.4 Prophet-EEMD-LSTM model
This study fit and forecasted the price of carbon using a hybrid Prophet-EEMD-LSTM model. The advantages of the three models are combined in this model, which can also further dissect the volatilities of carbon prices and determine their trend, periodicity, and volatility. Based on the features of these sequences, more accurate carbon price predictions can be made. The detailed steps of the model are as follows:
Step 1: Obtain the carbon price of the Beijing carbon market.
Step 2: The Prophet is applied to identify trends, weekly periodicity, annual periodicity, and residual series.
Step 3: The residual series is further decomposed into multiple volatility sequences using the EEMD model.
Step 4: The trend, weekly periodicity, annual periodicity, and multiple volatility sequences were fitted using the LSTM model.
Step 5: After the Prophet-EEMD-LSTM model was trained to achieve the best performance, the future carbon price was predicted.
Several indicators were chosen to measure the difference between the model’s projected and actual values to assess the prediction accuracy of the model (Eqs 16–19). The indicators included R-squared (
where N is the number of predictions,
3.2 Data source
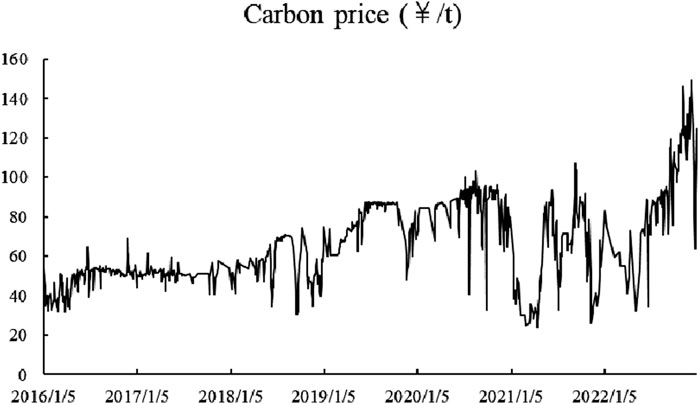
Beijing’s carbon market was established at the end of 2013 (Figure 5). In the early phase, the market trading volume was very small, and transactions occurred only on a small number of trading days. As the market operates steadily, the trading volume gradually increases. To improve prediction performance, we selected data from 2016 to 2022 for analysis. Data from January 2016 to November 2022 were selected for model training. The carbon price in December 2022 was predicted based on the results of this training. Daily carbon price data were sourced from WIND and the China Emissions Trading Network (www.tanpaifang.com). Most of the time, the carbon pricing data on this page match the data in the WIND database. Occasionally, the two data points disagree with one another. By comparing the carbon price on that day with that on the prior and subsequent trading days, we can determine which of the two sets of data is more closely related in this case.
4 Results and discussion
4.1 Data decomposition
The Prophet model divides Beijing’s carbon price into four components. The carbon price trend is the first component (Figure 6A). From 2016 to 2022, the price of carbon generally increased, with a temporary decline in 2020. This is because 2020 was the epidemic’s deadliest year, and businesses were unable to produce and run normally as a result of economic development that had stagnated or even reversed. Consequently, carbon emissions were lower, fewer carbon allowances were required, and the price of carbon decreased. As the economy recovered beginning in 2021, carbon prices returned to an upward trajectory.
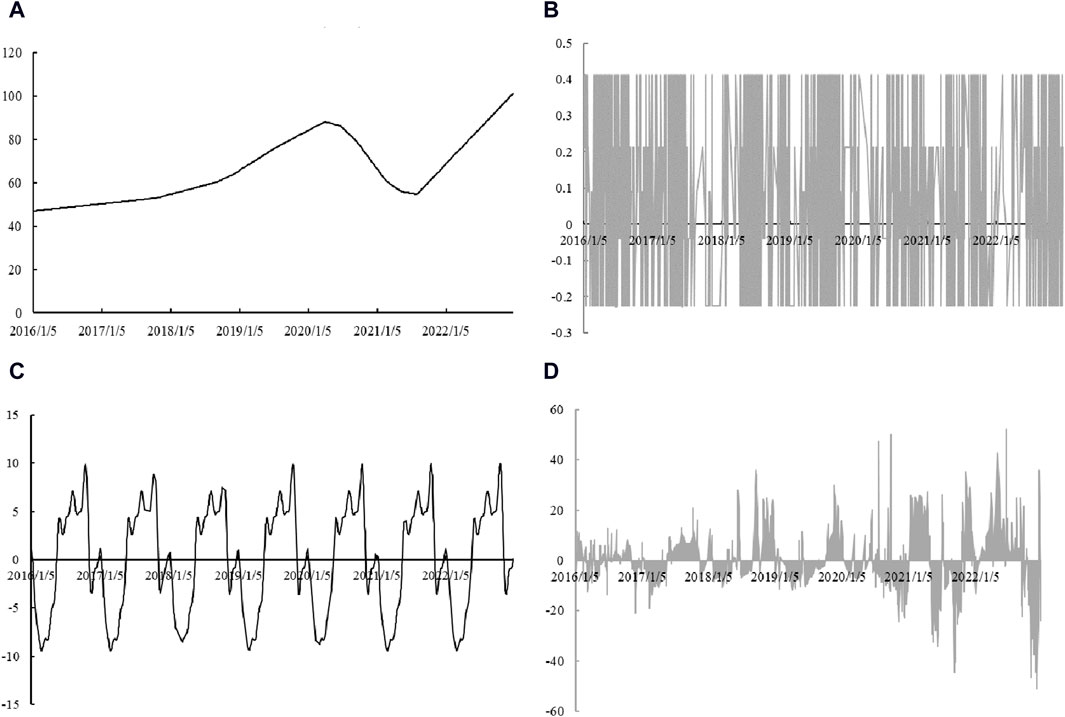
Figure 6. Decomposition results of the Prophet model: trend (A); weekly cycle features (B); annual cycle features (C); residuals (D).
The second part of the Prophet model is the weekly periodicity feature, and the carbon price’s weekly cycle features are depicted in Figure 6B, with a cycle length of 5 days Figure 7A presents a partial depiction of the weekly cycle characteristics to provide a clearer view of the weekly cycle variations. According to the results, on Mondays, Tuesdays, and Thursdays, carbon prices increase with gradually larger increases. This situation is similar to that of the stock market as stock market returns gradually improve over time [47]. Stock market returns are closely related to investor sentiment. Typically, investors are in a poor mood on the first day after a holiday. As time goes by and the weekend grows closer, investor sentiment gets higher and higher, and investments are becoming increasingly active [46,48]. The findings reveal some distinctions between the carbon and stock markets. Stock market investors invest more aggressively on Fridays, and stock market returns are generally higher than at other times [46]. However, Friday is the worst day in terms of carbon prices. The carbon market is a policy market; on Friday, traders are more inclined to await the policies over this weekend and make trading decisions the following week.

Figure 7. Zoom in periodicity feature: weekly cycle characteristics (A); annual cycle characteristics (B).
The third part of the Prophet model is the annual periodicity feature, and the carbon price’s annual cycle features are depicted in Figure 6C, with a cycle length of 365 days Figure 7B presents a partial depiction of the annual cycle characteristics to provide a clearer view of annual cycle variations. The carbon market compliance cycle is 1 year, and the Environment Bureau issues a carbon allowance to compliant companies before March every year and completes the previous year’s allowance surrender before October every year. Therefore, carbon price has a cycle that matches the compliance cycle. Normally, during the allocation period, companies do not have allowance gaps; therefore, they have no trading incentives, which results in a downward trend in the price of carbon. The busiest trading period in a year occurs during the allowance surrender stage, which drives carbon prices up as companies begin to transact to meet their compliance requirements. Consequently, the carbon price reaches its highest in October each year and its lowest in March of the following year.
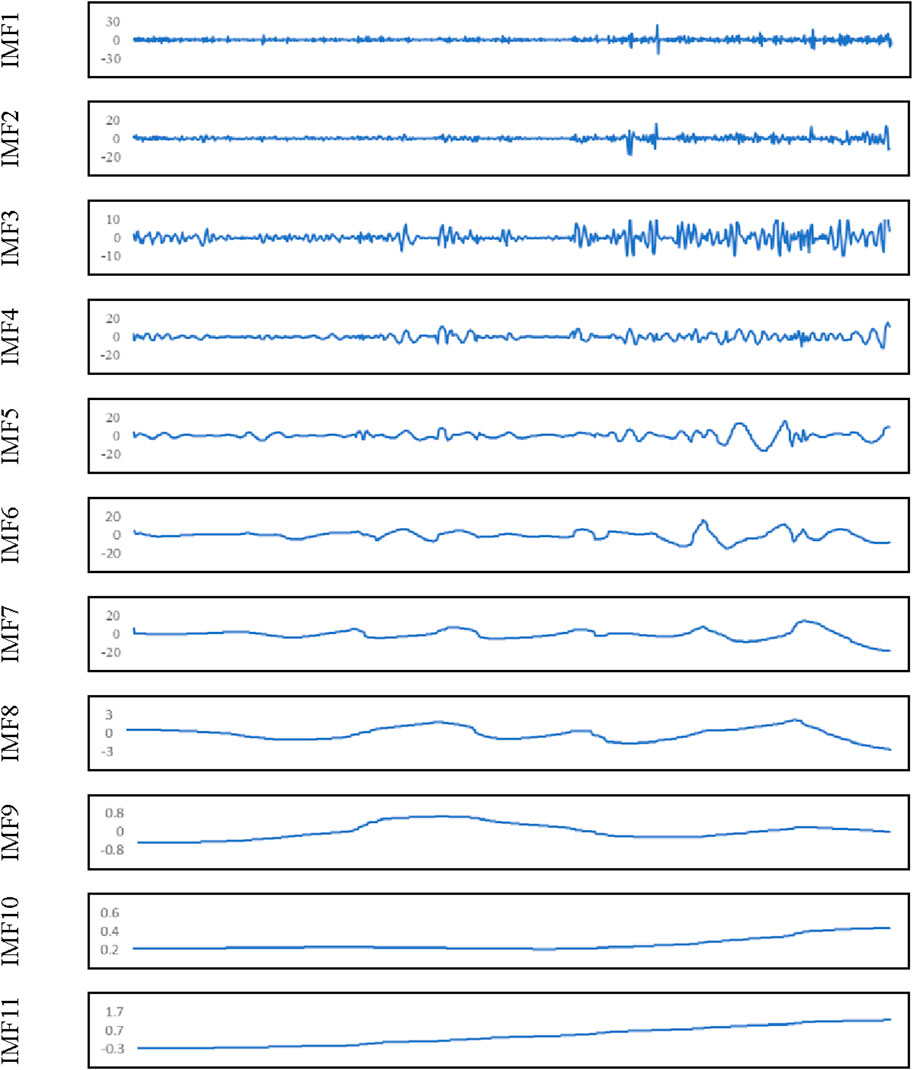
The fourth part of the Prophet model comprised the residuals (Figure 6D), which were further decomposed using the EEMD model. Figure 8 displays the results of the decomposition. The residuals of the carbon price were separated into 11 IMFs.
4.2 Data fitting and prediction
Following Prophet and EEMD model decomposition of the carbon price, 14 sequences were formed, including trend, annual periodicity, weekly periodicity, and 11 IMFs. The sequences were then fitted and predicted using the LSTM model. In this study, a sliding window was used to create a data matrix as the input for the LSTM model. The steps in the calculation of the input are Eqs 20, 21.
where Y is the actual carbon price,
This study used a sliding window with a 30-day prediction horizon to forecast carbon prices. The output of the prediction are Eqs 22, 23.
where
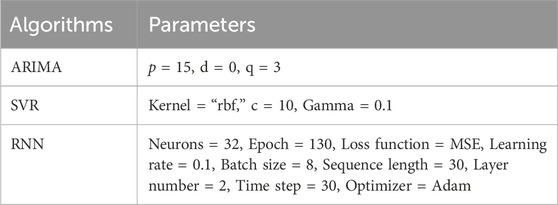
We trained the LSTM model and continuously changed the pertinent parameters to obtain the best prediction outcomes. The final parameter settings are listed in Table 1.
4.3 Model performance comparison
Five different models–ARIMA, SVR, RNN, LSTM, and Prophet-LSTM–were chosen for comparison and investigation in this study to support the effectiveness and superior performance of the proposed Prophet-EEMD-LSTM hybrid model. The parameters of these five models are listed in Table 2. LSTM and Prophet-LSTM have the same parameters as the hybrid Prophet-EEMD-LSTM model.
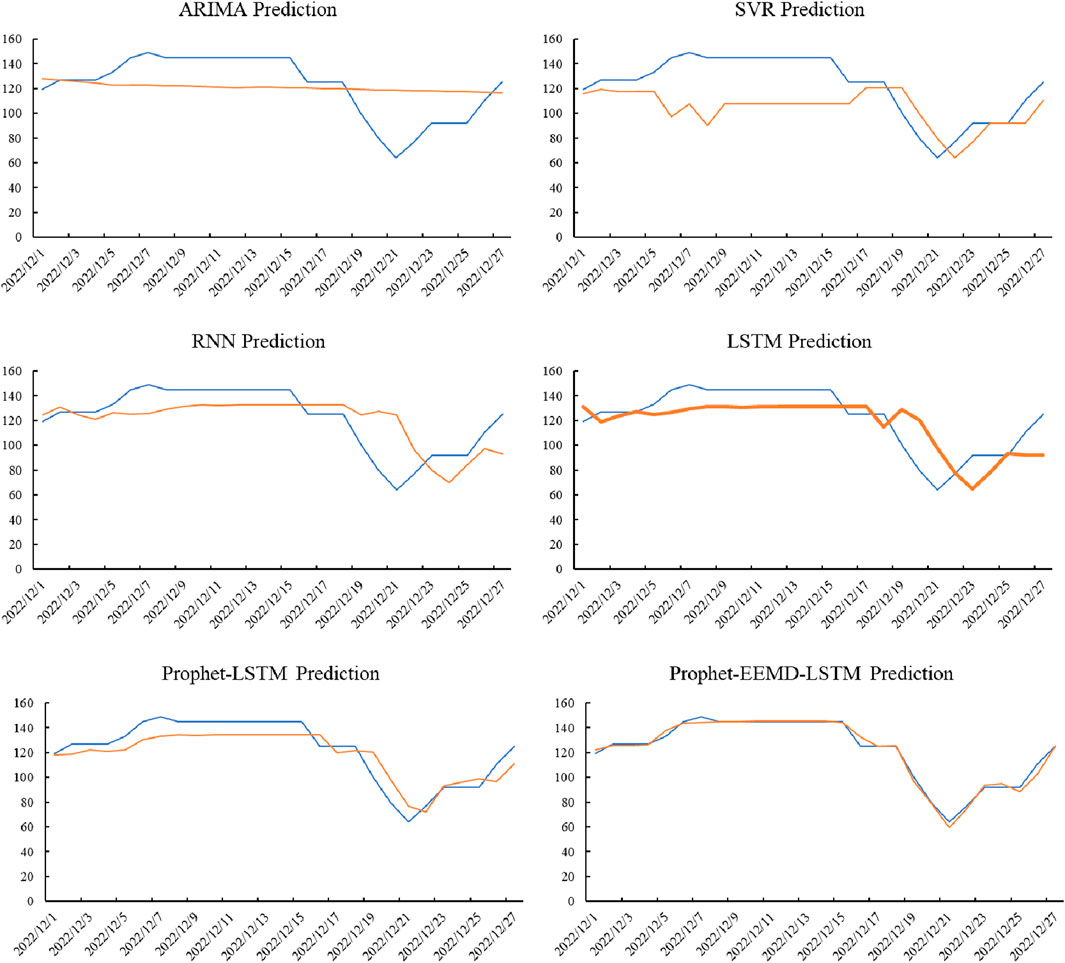
The carbon price in December 2022 is predicted based on these models, and the results are shown in Figure 9 in the prediction results, where the red and blue lines represent the predicted and actual values, respectively. The effect of the model prediction was improved owing to the excellent repeatability of the two lines. Although the size of the sliding window for the prediction was 30 days, the number of predictions was 27, as there was no trading in the Beijing carbon market during the last 4 days of December 2022.
From Figure 9, it is clear that the prediction effect of the ARIMA model is the poorest and that the anticipated values are spread in a straight line. The inability of the model to recognise trends in the carbon price series is the cause of its poor predictive performance. Although the SVR model can identify the data trend, its forecasting performance is poor. The forecasting performance improves in the second half of the period, whereas the predicted trend of carbon prices is opposite to the actual trend at the beginning of the month. This is because the SVR model is not good at identifying volatilities in the data; therefore, the direction of the carbon price volatilities at the beginning of the month is predicated mistakenly. The prediction efects of the RNN and LSTM models were significantly better than those of the first two models, and the predicted trends were consistent with the actual trend; however, there were some gaps in the values. As shown in Figure 9, the two models performed better. From a principal perspective, both models have shortcomings. The RNN model focuses more on recent data during the training process and ignores the operating rules of historical data. In contrast, LSTM pays too much attention to historical data, which can lead to overfitting of the model. Consequently, when carbon prices exhibit a new trend at the end of the month, the LSTM model cannot predict them accurately.
The LSTM overfits and cannot identify new features of the data because the characteristics of the data changes are too complex. Therefore, the input time series can be simplified to improve the performance of the LSTM model. In this context, the Prophet model was used to decompose the carbon price into several series with simple characteristics, including the trend, annual periodicity, weekly periodicity, and residuals. These series of simple characteristics were then predicted using the LSTM model. Finally, the predicted series are recombined to obtain the final predicted value. The Prophet-LSTM model has been shown to perform more effectively than the previous models. To verify whether the logic of optimising the LSTM was correct, the residuals from the Prophet model were further decomposed into several simpler series using the EEMD model. Similarly, all sequences decomposed by the Prophet and EEMD models were input into the LLST model for prediction. According to Figure 9, the Prophet-EEMD-LSTM model performed better.
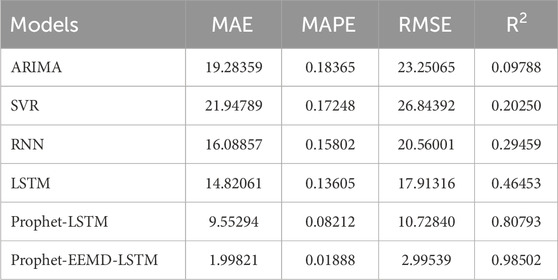
To accurately measure and compare the performance of each model, the indicators of MAE, MAPE, RMSE, and
The distribution of the prediction outcomes of each model is shown in Figure 10, where the abscissa represents the actual value and the ordinate represents the anticipated value. The dot is on the diagonal if the predicted and actual values of the carbon price are equal. According to the figure, the value distribution area predicted by the ARIMA model was very narrow, showing a horizontal line. Some of the predicted values in the SVR and RNN models are far from the diagonal, which indicates that the prediction performance is poor. The values predicted by the LSTM model gradually moved closer to the diagonal, and the predicted values of the Prophet-EEMD-LSTM model were distributed on the diagonal, showing the best prediction effect.
5 Conclusion and policy implications
The carbon market is similar to the stock market in terms of trading mechanism, but it is essentially a policy market. Carbon prices are not entirely driven by the market but are also significantly affected by energy prices, the economic environment, market policies, and other related factors. Therefore, scholars have been working on improving the carbon prediction capabilities in recent years. This study applies a Prophet-EEMD-LSTM hybrid model to predict carbon prices in the Beijing carbon market, which significantly improves prediction performance. Compared to the traditional econometric model and single machine learning model, this hybrid model considers the particularities of the carbon market, including trends, cyclical changes, and volatilities of carbon prices. Considering that the carbon market has multiple complex characteristics, the carbon price was decomposed into multiple simple sequences. Subsequently, based on historical data, the prediction model was fully trained, and these simple sequences were predicted in turn. By comparing the prediction effect of the Prophet-EEMD-LSTM hybrid model with those of other models, such as the ARIMA, SVR, RNN, LSTM, and Prophet-LSTM models, the results confirmed that the prediction performance of this model was better.
Smooth operation of the carbon market is effective support for cities to achieve low-carbon development. This study can help market managers and participants prevent carbon market risks by providing a carbon price prediction model. As an emerging market, the carbon market’s mechanism is not yet complete, and carbon prices fluctuate significantly. When the carbon price is too high or low, it is not conducive to the effective operation of the market and affects the emission reduction efficiency of the entire market. In this context, market prices require appropriate intervention by market managers who must have an accurate expectation of carbon prices to take corresponding measures in advance to prevent carbon price risks. In addition, enterprises lack experience in carbon trading and cannot accurately judge trends in carbon prices. This results in enterprises being unable to trade at better prices, reducing their income from emissions reduction or increasing the cost of enterprise compliance. Therefore, it is crucial for both market managers and participants to obtain relatively accurate predictions of carbon prices. When all have relatively rational expectations of carbon prices, the stability of the carbon market can be guaranteed, which can support low-carbon development in the city.
Data availability statement
The original contributions presented in the study are included in the article/Supplementary Material, further inquiries can be directed to the corresponding authors.
Author contributions
LY: Writing–original draft, Data curation. CL: Formal Analysis, Writing–review and editing. JW: Conceptualization, Formal Analysis, Writing–original draft. HS: Supervision, Writing–review and editing.
Funding
The author(s) declare that financial support was received for the research, authorship, and/or publication of this article. This study was funded by Social Science Fund of Hebei province (Grant Number: HB23GL025).
Conflict of interest
The authors declare that the research was conducted in the absence of any commercial or financial relationships that could be construed as a potential conflict of interest.
Publisher’s note
All claims expressed in this article are solely those of the authors and do not necessarily represent those of their affiliated organizations, or those of the publisher, the editors and the reviewers. Any product that may be evaluated in this article, or claim that may be made by its manufacturer, is not guaranteed or endorsed by the publisher.
Abbreviations
SVM, support vector machine; VAR, vector auto regression; ARMA, autoregressive moving average; ARCH, autoregressive conditional heteroskedasticity; GARCH, generalized autoregressive conditional heteroskedasticity; EEMD, ensemble empirical mode decomposition; EMD, empirical mode decomposition; LSTM, long short-term memory; RNN, recurrent neural network; IMF, intrinsic mode function;
References
1. Wang L, Shao J, Ma Y. Does China's low-carbon city pilot policy improve energy efficiency? Energy (2023) 283:129048. doi:10.1016/j.energy.2023.129048
2. Wu S, Niu R. Development of carbon finance in China based on the hybrid MCDM method. Humanities Soc Sci Commun (2024) 11(1):156–11. doi:10.1057/s41599-023-02558-1
3. Li Y, Liu T, Song Y, Li Z, Guo X. Could carbon emission control firms achieve an effective financing in the carbon market? A case study of China's emission trading scheme. J Clean Prod (2021) 314:128004. doi:10.1016/j.jclepro.2021.128004
4. Ghosh B, Gubareva M, Zulfiqar N, Bossman A. Is there a nexus between NFT, DeFi and carbon allowances during extreme events? China Finance Rev Int (2023). doi:10.1108/CFRI-03-2023-0057
5. Zhu B, Ye S, Wang P, He K, Zhang T, Wei YM. A novel multiscale nonlinear ensemble leaning paradigm for carbon price forecasting. Energ Econ (2018) 70:143–57. doi:10.1016/j.eneco.2017.12.030
6. Zhu B, Ye S, He K, Chevallier J, Xie R. Measuring the risk of European carbon market: an empirical mode decomposition-based value at risk approach. Ann Operations Res (2019) 281:373–95. doi:10.1007/s10479-018-2982-0
7. Zhu B, Han D, Wang P, Wu Z, Zhang T, Wei YM. Forecasting carbon price using empirical mode decomposition and evolutionary least squares support vector regression. Appl Energ (2017) 191:521–30. doi:10.1016/j.apenergy.2017.01.076
8. Hao Y, Tian C. A hybrid framework for carbon trading price forecasting: the role of multiple influence factor. J Clean Prod (2020) 262:120378. doi:10.1016/j.jclepro.2020.120378
9. Yang S, Chen D, Li S, Wang W. Carbon price forecasting based on modified ensemble empirical mode decomposition and long short-term memory optimized by improved whale optimization algorithm. Sci Total Environ (2020) 716:137117. doi:10.1016/j.scitotenv.2020.137117
10. Dai PF, Xiong X, Huynh TLD, Wang J. The impact of economic policy uncertainties on the volatility of European carbon market. J Commodity Markets (2022) 26:100208. doi:10.1016/j.jcomm.2021.100208
11. Byun SJ, Cho H. Forecasting carbon futures volatility using GARCH models with energy volatilities. Energ Econ (2013) 40:207–21. doi:10.1016/j.eneco.2013.06.017
12. Feng ZH, Zou LL, Wei YM. Carbon price volatility: evidence from EU ETS. Appl Energ (2011) 88(3):590–8. doi:10.1016/j.apenergy.2010.06.017
13. Ye S, Dai PF, Nguyen HT, Huynh NQA. Is the cross-correlation of EU carbon market price with policy uncertainty really being? A multiscale multifractal perspective. J Environ Manag (2021) 298:113490. doi:10.1016/j.jenvman.2021.113490
14. Tran QH. The impact of green finance, economic growth and energy usage on CO2 emission in Vietnam–a multivariate time series analysis. China Finance Rev Int (2022) 12(2):280–96. doi:10.1108/CFRI-03-2021-0049
15. He K, Yu L, Tang L. Electricity price forecasting with a BED (Bivariate EMD Denoising) methodology. Energy (2015) 91:601–9. doi:10.1016/j.energy.2015.08.021
16. Yang HL, Lin HC. Applying the hybrid model of EMD, PSR, and ELM to exchange rates forecasting. Comput Econ (2017) 49(1):99–116. doi:10.1007/s10614-015-9549-9
17. Huang NE, Shen Z, Long SR, Wu MC, Shih HH, Zheng Q, et al. The empirical mode decomposition and the Hilbert spectrum for nonlinear and non-stationary time series analysis. Proc R Soc Lond Ser A: Math Phys Eng Sci (1998) 454(1971):903–95. doi:10.1098/rspa.1998.0193
18. Niang O, Thioune A, El Gueirea MC, Deléchelle E, Lemoine J. Partial differential equation-based approach for empirical mode decomposition: application on image analysis. IEEE Trans Image Process (2012) 21(9):3991–4001. doi:10.1109/TIP.2012.2199503
19. Rutkowski TM, Mandic DP, Cichocki A, Przybyszewski AW. EMD approach to multichannel EEG data—the amplitude and phase components clustering analysis. J Circuits, Syst Comput (2010) 19(01):215–29. doi:10.1142/S0218126610006037
20. Yeh MH. The complex bidimensional empirical mode decomposition. Signal Process. (2012) 92(2):523–41. doi:10.1016/j.sigpro.2011.08.019
21. Chen Y, Tang H, Tang Q, Zhang A, Chen D, Li K. Machining error decomposition and compensation of complicated surfaces by EMD method. Measurement (2018) 116:341–9. doi:10.1016/j.measurement.2017.11.027
22. Dhifaoui Z, Khalfaoui R, Jabeur SB, Abedin MZ. Exploring the effect of climate risk on agricultural and food stock prices: fresh evidence from EMD-Based variable-lag transfer entropy analysis. J Environ Manage (2023). 326:116789. doi:10.1016/j.jenvman.2022.116789
23. Wang B, Wang J. Energy futures and spots prices forecasting by hybrid SW-GRU with EMD and error evaluation. Energ Econ (2020) 90:104827. doi:10.1016/j.eneco.2020.104827
24. Lu Y, Sheng B, Fu G, Luo R, Chen G, Huang Y. Prophet-EEMD-LSTM based method for predicting energy consumption in the paint workshop. Appl Soft Comput (2023) 143:110447. doi:10.1016/j.asoc.2023.110447
25. Zhu B, Wang P, Chevallier J, Wei Y. Carbon price analysis using empirical mode decomposition. Comput Econ (2015) 45:195–206. doi:10.1007/s10614-013-9417-4
26. Wang J, Gu F, Liu Y, Fan Y, Guo J. An Endowment effect study in the European Union emission trading market based on trading price and price fluctuation. Int J Environ Res Public Health (2020) 17(9):3343. doi:10.3390/ijerph17093343
27. Wu Z, Huang NE. Ensemble empirical mode decomposition: a noise-assisted data analysis method. Adv adaptive Data Anal (2009) 1(01):1–41. doi:10.1142/S1793536909000047
28. Liu Z, Wang X, Zhang Q, Huang C. Empirical mode decomposition based hybrid ensemble model for electrical energy consumption forecasting of the cement grinding process. Measurement (2019) 138:314–24. doi:10.1016/j.measurement.2019.02.062
29. Jiang Z, Che J, Wang L. Ultra-short-term wind speed forecasting based on EMD-VAR model and spatial correlation. Energ Convers Manage (2021) 250:114919. doi:10.1016/j.enconman.2021.114919
30. Anggraeni W, Yuniarno EM, Rachmadi RF, Sumpeno S, Pujiadi P, Sugiyanto S, et al. A hybrid EMD-GRNN-PSO in intermittent time-series data for dengue fever forecasting. Expert Syst Appl (2023) 121438:121438. doi:10.1016/j.eswa.2023.121438
31. Hochreiter S, Schmidhuber J. Long short-term memory. Neural Comput (1997) 9(8):1735–80. doi:10.1162/neco.1997.9.8.1735
32. Gao Z, Zhang J. The fluctuation correlation between investor sentiment and stock index using VMD-LSTM: evidence from China stock market. North Am J Econ Finance (2023) 66:101915. doi:10.1016/j.najef.2023.101915
33. Hu P, Bai L, Qi J, Qu R, Gu H, Hu N. Prediction of electricity consumption based on the combination of LSTM and LassoLars. In: 2021 2nd International Conference on Big Data & Artificial Intelligence & Software Engineering (ICBASE); 24-26 September 2021; Zhuhai, China. IEEE (2021). p. 408–13.
34. Lin Y, Yan Y, Xu J, Liao Y, Ma F. Forecasting stock index price using the CEEMDAN-LSTM model. North Am J Econ Finance (2021) 57:101421. doi:10.1016/j.najef.2021.101421
35. Liang Y, Lin Y, Lu Q. Forecasting gold price using a novel hybrid model with ICEEMDAN and LSTM-CNN-CBAM. Expert Syst Appl (2022) 206:117847. doi:10.1016/j.eswa.2022.117847
36. Lin Y, Liao Q, Lin Z, Tan B, Yu Y. A novel hybrid model integrating modified ensemble empirical mode decomposition and LSTM neural network for multi-step precious metal prices prediction. Resour Pol (2022) 78:102884. doi:10.1016/j.resourpol.2022.102884
37. Wang J, Sun X, Cheng Q, Cui Q. An innovative random forest-based nonlinear ensemble paradigm of improved feature extraction and deep learning for carbon price forecasting. Sci Total Environ (2021) 762:143099. doi:10.1016/j.scitotenv.2020.143099
38. Zhou F, Huang Z, Zhang C. Carbon price forecasting based on CEEMDAN and LSTM. Appl Energ (2022) 311:118601. doi:10.1016/j.apenergy.2022.118601
39. Mao Y, Yu X. A hybrid forecasting approach for China's national carbon emission allowance prices with balanced accuracy and interpretability. J Environ Manage (2024) 351:119873. doi:10.1016/j.jenvman.2023.119873
40. Ding L, Zhang R, Zhao X. Forecasting carbon price in China unified carbon market using a novel hybrid method with three-stage algorithm and long short-term memory neural networks. Energy (2024) 288:129761. doi:10.1016/j.energy.2023.129761
41. Wang J, Gu F, Liu Y, Fan Y, Guo J. Bidirectional interactions between trading behaviors and carbon prices in European Union emission trading scheme. J Clean Prod (2019) 224:435–43. doi:10.1016/j.jclepro.2019.03.264
42. Qiao Q, Yunusa-Kaltungo A, Edwards R. Predicting building energy consumption during holiday periods. In: 2021 IEEE PES/IAS PowerAfrica; 23-27 August 2021; Nairobi, Kenya. IEEE (2021). p. 1–5.
43. Kao YS, Nawata K, Huang CY. Predicting primary energy consumption using hybrid ARIMA and GA-SVR based on EEMD decomposition. Mathematics (2020) 8(10):1722. doi:10.3390/math8101722
44. Shakeel A, Chong D, Wang J. Load forecasting of district heating system based on improved FB-Prophet model. Energy (2023) 278:127637. doi:10.1016/j.energy.2023.127637
45. Taylor SJ, Letham B. Forecasting at scale. The Am Statistician (2018) 72(1):37–45. doi:10.1080/00031305.2017.1380080
46. Birru J. Day of the week and the cross-section of returns. J financial Econ (2018) 130(1):182–214. doi:10.1016/j.jfineco.2018.06.008
47. Hirshleifer D, Jiang D, DiGiovanni YM. Mood beta and seasonalities in stock returns. J Financial Econ (2020) 137(1):272–95. doi:10.1016/j.jfineco.2020.02.003
Keywords: low-carbon city, carbon price, Prophet-EEMD-LSTM model, prediction performance, Beijing
Citation: Yu L, Li C, Wang J and Sun H (2024) A hybrid model for predicting the carbon price in Beijing: a pilot low-carbon city in China. Front. Phys. 12:1427794. doi: 10.3389/fphy.2024.1427794
Received: 04 May 2024; Accepted: 20 June 2024;
Published: 15 July 2024.
Edited by:
Haroldo V. Ribeiro, State University of Maringá, BrazilReviewed by:
Angel Akio Tateishi, Federal Technological University of Paraná, BrazilAndre Seiji Sunahara, State University of Maringá, Brazil
Copyright © 2024 Yu, Li, Wang and Sun. This is an open-access article distributed under the terms of the Creative Commons Attribution License (CC BY). The use, distribution or reproduction in other forums is permitted, provided the original author(s) and the copyright owner(s) are credited and that the original publication in this journal is cited, in accordance with accepted academic practice. No use, distribution or reproduction is permitted which does not comply with these terms.
*Correspondence: Jiqiang Wang, d2FuZ2ppcWlhbmdAaG51dC5lZHUuY24=; Huaping Sun, c2hwQHVqcy5lZHUuY24=
 Lei Yu
 Changyi Li2
 Jiqiang Wang
