- 1Taizhou Institute of Zhejiang University, Taizhou, China
- 2Optics and Publishing Department, Chernivtsi National University, Chernivtsi, Ukraine
- 3Department of Surgery No 1, Bucovinian State Medical University, Chernivtsi, Ukraine
- 4Computer Science Department, Chernivtsi National University, Chernivtsi, Ukraine
- 5Department of Physics, Shaoxing University, Shaoxing, Zhejiang, China
The principles and effectiveness of the method of laser polarization interferometry of dehydrated blood films (facies) for the differential diagnosis of thyroid pathology have been studied. For this purpose, a theoretical description of the processes of formation and layer-by-layer phase scanning of the polarization structure of speckle fields in the blood facies of donors and patients with nodular goiter, autoimmune thyroiditis, and papillary cancer has been developed for the first time. A statistical analysis of holographically reconstructed maps of polarization ellipticity of the singly scattered component of the speckle field was conducted. Based on this analysis, the most sensitive markers for the diagnosis and differentiation of thyroid pathology were identified. Excellent diagnostic accuracy (91%–93%) and very good differentiation accuracy (86%–89%) were achieved for nodular goiter, autoimmune thyroiditis, and papillary cancer.
1 Introduction
Non-destructive remote photometric, spectral, correlation and polarization optical methods have been widely used to study the optically inhomogeneous structure of biological objects [1–5].
Polarization studies turned out to be one of the most diagnostically promising methods for detecting the optical manifestations of the polycrystalline architecture of biological tissues and fluids [6]. Studies have demonstrated the potential of polarimetry for diagnosing cataracts in the lens, monitoring glucose concentration in the tissues of diabetic patients, and detecting malignant changes [7–12].
The successful diagnostic development of polarimetry of biological layers contributed to the formation of new Mueller matrix techniques, leading to the establishment of Mueller matrix microscopy (MMM) as a separate branch [13–19]. The methodological basis of MMM is various theoretical models and methods of analysis. The most effective were regression models of optical anisotropy [14] and logarithmic Mueller matrix decomposition [15–18]. The MMM results are objectively assessed within the statistical analysis framework of Mueller matrix images and optical anisotropy maps [14, 18]. This provided the possibility of obtaining quantitative optical metrics to characterize the evolution of gastric tissue from a healthy state through inflammation to cancer using Mueller microscopy of gastric biopsies [14].
Further development of the functionality of MMM methods ensured the use of a broader class of analytical algorithms - correlation, fractal, wavelet, Fourier, and singular analysis - for quantitative data processing [20–29].
One of these methods’ promising applications may be diagnosing thyroid gland pathological conditions.
Timely thyroid pathology detection is one of the global health problems. According to statistics from the World Health Organization, 10%–30% of the adult population worldwide suffers from various diseases associated with the thyroid gland, which are associated with both gland dysfunction and changes in its structure. Moreover, this figure increases by 5% every year [30].
Traditionally, the gold standard for diagnosing thyroid pathology is biopsy or surgical resection of tissue sections stained with hematoxylin and eosin visual microscopic evaluation. However, early diagnosis is difficult due to the variability of the tissue morphological interpretation. In addition, cancerous change areas may be small and hardly noticeable.
These methods have become the digital pathology direction, using new quantitative image analysis possibilities. In [31], thin sections of the thyroid nodules capsule, microscopic images, histograms, and texture analysis were used. On this basis, the possibility of a differential diagnosis for the thyroid nodules as benign (follicular adenoma) or malignant (papillary carcinoma) was demonstrated.
Thus, pathologists can improve thyroid pathology diagnosis by applying new objective quantitative technologies with high spatial resolution [32].
Among such technologies, polarization-sensitive second harmonic generation (PSHG) microscopy methods can be distinguished [33, 34].
PSHG microscopy techniques are used to differentiate cancerous or diseased tissues by analyzing circular dichroism and modulating laser polarization states.
As a result, it is possible to measure ultrastructural changes in the collagen frameworks of organ tissues in submicron areas.
This microscopic technique has been used to study the collagen organization in both benign and malignant fibrillar capsules of the thyroid.
The possibility of differentiating follicular adenoma and papillary carcinoma node capsules has been demonstrated [35]. The obtained quantitative information about the collagen capsule can significantly complement traditional histopathological examination.
The development and addition of PSHG microscopy are methods of non-invasive polarization-sensitive optical coherence tomography (PSOCT) [36–44].
The use of the principles of direct interference recording of the structure of object speckle fields provided the possibility of layer-by-layer measurement of the coordinate distributions of elements of the Mueller matrix or Mueller matrix images (MMI) at various depths of biological objects. In this case, the possibility of quantitative layer-by-layer assessment of the optical anisotropy of biological tissue is realized [36, 45]. As a result, it was possible to diagnose fibrosis and differentiate tumor sites with low fibrosis accurately. However, the sensitivity of such systems was limited by t a high level of depolarized laser speckle background.
Biological tissue object fields phase scanning polarization-interference methods with complex amplitude distributions layer-by-layer digital reconstruction can eliminate the influence of such background and increase PSHG and PSOCT techniques’ diagnostic sensitivity [45–52].
These methods allow the phase separation of a singly scattered (non-depolarized) component in a laser speckle field. The biological layer complex amplitude field non-depolarized component uniquely relates to the optically anisotropic component parameters. As a result, it becomes possible to obtain, within the statistical analysis framework, the most accurate information about pathological changes in the human tissue biopsy samples polycrystalline architectonics diagnosed. On this basis, the possibility of diagnosing endometriosis [48], differentiating benign and malignant prostate tumors [45, 49] and necrotic and traumatic changes in the myocardium [52] have been demonstrated.
An expansion of the functionality of the polarization-interference phase scanning methods can be the study of different kinds of objects, such as biological fluids. Such objects are easily accessible and do not require traumatic biopsy surgery. These objects are one of the most essential systems for ensuring the body’s vital activity, which is a set of biological fluids involved in metabolic processes. In biological fluids (BF), there are high-speed changes in the molecular composition and the interaction of various components of physiological nature, as well as extreme and pathological conditions.
Any physiological or pathological process occurring in a living organism represents specific changes in the structure of protein and other organic molecules. Such changes are the most informative in the study of homeostasis at the molecular level and can serve as a basis for various diseases at the earliest stages of diagnosis [53, 54].
Modern laboratory and clinical diagnostics focus mainly on the numerous quantitative indicators contained in BF determination, which are products of body vital activity.
Morphological research in biology and medicine focuses mainly on cellular elements, while BF morphological analysis - the life support basic system–has remained inaccessible for clinical practice until recently [55]. A BF drop lying on a horizontal plane is a self-organizing system that is a convenient model for studying physical-chemical processes. Its properties are determined by the dissolved substances in a liquid composition, external dehydration conditions, and the substrate material. As a BF drop dehydration result, a dry film is formed–a “facia”, the structure of which carries information about the composition and relationships of substances dissolved in BF. By studying such objects at the self-organization macroscopic level, the researcher receives information about the system at the molecular level behaviour [56–59].
One of the most informative biological fluids about the state of the human body is blood, which contains about 100 different proteins. Conventionally (according to differences in solubility), they are divided into five main fractions: albumins (55%–65%), α1 - (2%–4%), α2 - (6%–12%), β - (8%–12%) and γ – (2%–4%) globulins.
The albumin concentration in the blood is high, and its molecule size is small. Therefore, the albumin molecules collection total surface area is extensive. As a result, they are well suited to perform the transport function - bilirubin, urobilin, fatty acids, bile salts, and lipid hormones. The albumin fraction also includes transthyretin (prealbumin), which, together with thyroxine-binding globulin [
Globulins are a blood proteins family, in the molecules of which polypeptide chains are tightly coiled into compact spherical structures - globules (tertiary protein structures). One globulin type is thyroglobulin (
Such objects’ optically anisotropic structure polarization characteristics have not been studied sufficiently. Only a few publications focus on using polarization interferometry of biological fluids to diagnose pathological changes in human organs [69].
Our work is focused on finding new objective markers for minimally invasive differential diagnosis of thyroid pathology using comprehensive polarization-interference mapping and digital holographic reconstruction of layer-by-layer maps of the ellipticity of speckle fields in blood facies. To achieve maximum effectiveness of the method, statistical analysis of the polarization ellipticity maps of the singly scattered component of the speckle field of the blood facies of donors and patients with nodular goiter, autoimmune thyroiditis, and papillary cancer has been applied for the first time.
2 A brief theoretical remarks
2.1 Optical anisotropy of blood facies
The Mueller matrix formalism is the theoretical basis for blood facies object fields laser polarimetry [11–19]. This approach provides the most complete description of the blood facies’ optically anisotropic structure polarization manifestations [21, 69].
Based on the biological layer model developed in numerous studies [20–29], the following expressions for the circular and linear birefringence Mueller matrices can be derived for blood facies.
The matrix operator
where
Here
Linear birefringence optical manifestations of supramolecular networks at each point
where
Here
The resulting matrix operator is determined, which characterizes the integral manifestations of the blood facies’ circular and linear birefringence.
2.2 Blood facies polarization maps
When the blood facies are irradiated with a polarized beam, local azimuth
The polarization parameters values are calculated from the following matrix equation
Here
In the expanded form, Equation 6 is written as follows
In the general case, the following relationship is realized between the azimuth
The following expressions for the azimuth and ellipticity polarization maps are obtained from Equation 8
The most common case for serial polarization studies is the azimuthal-invariant mapping [21–30] implementation by using a circularly polarized irradiating beam
Under such conditions, taking into account Equations 1–10 can be rewritten as follows
Therefore, the conducted theoretical consideration of the optically anisotropic blood facies object field polarization structure formation revealed analytical relationships between:
• optically active
• supramolecular networks phase-shifting properties
Laser object fields complex amplitudes
Here “
Taking into account Equations 16–19 for the polarization-interference determination of the blood facies speckle field azimuth
Taking into account Equations 20, 21, the analytical equation of polarization states at the points of the blood facies single scattered (“object”) laser field component can be written in the following form
Relations Equation 22 and Equations 12–19 determine the polarization structure of the single scattered component
This component
For the orthogonal components
where
For the process of forming the resulting orthogonal components of amplitudes
In this way, a coordinate-distributed
In this case, the analytical equation of polarization (Equation 22) at the points
According to Equations 27–29, the polarization structure of the speckle field component
For such a component
Thus, the polarization structure of real laser field
From Equations 31, 32 it follows that the thyroid pathology diagnostics efficiency is determined by the ratio between
3 Optical scheme and brief theory of the method
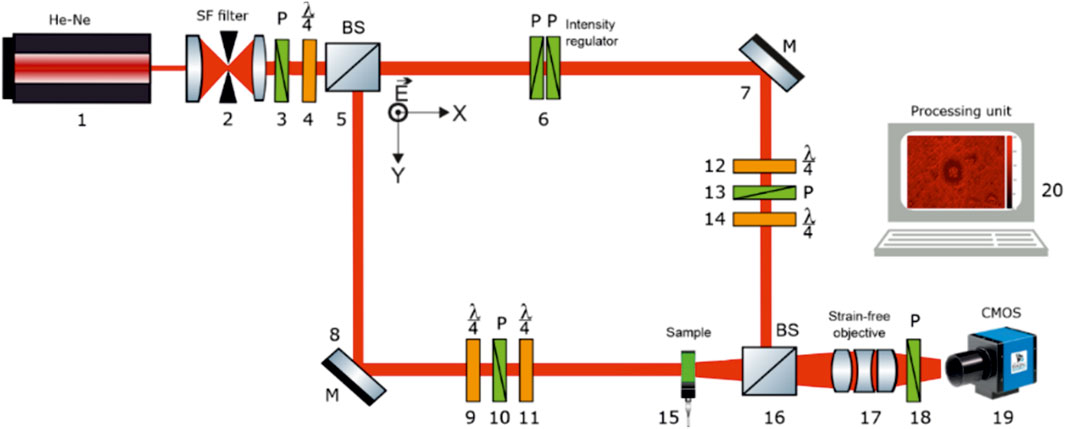
In Figure 1 shows the polarization Mach-Zehnder interferometer scheme.
Publications present the characteristics of the polarization interferometry scheme [45–52]. Our work will analyse the laser field polarimetry method by reconstructing the complex amplitude distributions
The polarization interferometer includes the following main blocks:
A. Polarizing illuminator, which generates a circularly polarized laser wave:
•He-Ne (
•collimator 2;
•polarizing filter (polarizer three and quarter-wave plate 4, the angle between the polarizer three transmission axes and the plate 4 highest speed axis is 450).
B. Reference channel:
•beam splitter 5;
•polarization intensity attenuator 6;
•rotating mirror 7;
•universal polarization filter (quarter-wave plates 12, 14 and polarizer 13) can form arbitrary polarization states.
C. Object channel:
•beam splitter 5;
•rotating mirror 8;
•universal polarization filter (quarter-wave plates 9, 11 and polarizer 10), which generates arbitrary polarization states;
•biological tissue sample 15.
D. Polarization filtering channel of the object field interference distribution:
•optical mixer 16;
•polarizing microlens 17;
•polarizer-analyzer 18 with an orientation of the transmission plane at angles
E. Digital recording and computer analysis unit
•digital camera 19;
•PC 20.
Parallel (
The “object” beam with the rotating mirror 5 help is directed through the polarizing filter 6–7 (manufacturer - Achromatic True Zero-Order Waveplate and manufacturer - B+ W Kaesemann XS-Pro Polarizer MRC Nano) in the blood facie 8 sample direction. The blood facie polarization-inhomogeneous image is projected by the strain-free objective 12 (manufacturer - Nikon CFI Achromat P, focal length - 30 mm, numerical aperture - 0.1, magnification - 4x) into the digital camera 14 (The Imaging Source DMK 41AU02. AS, monochrome 1/2“CCD, Sony ICX205AL (progressive scan) resolution - 1280 × 960, size of the photosensitive area - 7600 × 6200 μm; sensitivity - 0.05 lx; dynamic range - 8 bit, SNR - 9 bit), the photosensitive area, which contains
The “reference” beam is directed by mirror 4 through the polarization filter 9–10 (manufacturer: Achromatic True Zero-Order Waveplate and manufacturer: B+ W Kaesemann XS-Pro Polarizer MRC Nano) into the blood facie polarization image plane.
As a result, an interference pattern is formed, the coordinate intensity distribution of which is recorded by a digital camera 14 through a polarizer 13.
Before carrying out blood facies measurements, the experimental device passed metrological certification with the model objects introduction (“clean air”, “linear polarizer”, “phase plates
The specified interferometer is modified for the experimental implementation of the blood facies fields of ellipticity
For each position of the polarizer-analyzer 18 transmission plane (
where
4. The digital Fourier transform results (Equation 34) for a circularly polarized (⊗) illuminating laser beam are used to obtain complex amplitude distributions according to the following algorithms
Here
5. By reconstructing complex amplitudes field (35–37), phase scanning means
6. The quantitative criterion for determining the polarization map
where
7. By means of step-by-step phase comparison of the values
4 Biological samples
4.1 Clinical and laboratory criteria for the formation of patient groups
Four representative dehydration blood facies groups were formed:
4.1.1 Control group
Healthy donors aged 30–60 years 51, patients (48 women, three men).
Inclusion criteria. Puncture biopsy of the thyroid gland without confirmed pathological processes. The normal level of thyroid hormones and autoantibodies.
Exclusion criteria. A puncture biopsy of the thyroid gland with pathological processes is confirmed in this organ.
4.1.2 Experimental group
51 patients aged 30–60 (46 women, 5 men) for nodular goiter.
Inclusion criteria. Puncture biopsy of the thyroid gland with pathological process confirmation. One or several thyroid gland colloid nodes are present. The normal level of thyroid hormones and autoantibodies.
Exclusion criteria. Increased or decreased level of thyroid hormones, increased level of autoantibodies. Associated pathology: diabetes, hypertension, atherosclerosis, chronic adrenal insufficiency, rheumatoid arthritis, chronic active hepatitis, systemic lupus erythematosus.
A violation of the principle of negative feedback endocrine function regulation characterizes this group.
4.1.3 Experimental group
51 patients aged 30–60 (49 women, 2 men) with autoimmune thyroiditis.
Inclusion criteria. Puncture biopsy of the thyroid gland with confirmation of the pathological process of stage 1–3 (1 - hypertrophic thyroiditis (Hashimoto’s goiter), 2 - atrophic thyroiditis, 3 - fibrous invasive Riedel’s goiter). Increased level of autoantibodies over 1000 IU/mL. Hypothyroidism.
Exclusion criteria. Increased level of thyroid hormones and autoantibodies to thyroperoxidase normal level. Associated pathology: diabetes, hypertension, atherosclerosis, chronic adrenal insufficiency, rheumatoid arthritis, chronic active hepatitis, systemic lupus erythematosus. Damage to the hematothyroid barrier is characteristic of this group.
4.1.4 Experimental group
51 patients aged 30–60 (44 women, 7 men) with papillary cancer thyroid gland.
Inclusion criteria. Puncture biopsy of the thyroid gland with pathological process confirmation - the papillary epithelium cancerous cells presence. Absence of germination outside the capsule and invasion of lymph nodes. The level of autoantibodies is normal. Euthyroidism.
Exclusion criteria. Increased or decreased thyroid hormone levels, increased autoantibodies to thyroperoxidase. Associated pathology: diabetes, hypertension, atherosclerosis, chronic adrenal insufficiency, rheumatoid arthritis, chronic active hepatitis, systemic lupus erythematosus. This group is characterized by uncontrolled, atypical growth of thyroid cells with the formation of papillary structures, the presence of nuclear inclusions, tumor progression, and a history of frequent exposure to the consequences of the Chernobyl accident.
Table 1 presents the polycrystalline blood films optical parameters.
The polycrystalline blood films extinction coefficient (
Depolarization degree measurement was performed in the standard Mueller matrix polarimeter scheme [20–29].
5 Experimental results and their discussion
At present, the tendencies of pathological transformation of polarization maps of optically anisotropic components of thyroid biopsy have been experimentally studied [72–75]:
• nodular goiter–growth of optical activity (1, 2) of thyroglobulin protein complexes due to enlargement of follicles and formation of structural birefringence (3, 4) as a result of the nodular proliferation of connective tissue;
• autoimmune thyroiditis–due to squamous cell metaplasia of follicular cells, an increase in their size forms proportionate manifestations of optical activity of thyroglobulin complexes and birefringence of the fibrous cord network;
• papillary cancer–predominant influence of structural birefringence due to hyperplasia in the form of elongated papillary formations.
Analysis and diagnostic use of the obtained results are based on a two-component amorphous anisotropic model of the optical properties of the thyroid gland. According to this model, the amorphous component (parenchyma formed by epithelial tissue) is polarization-inactive and does not change the polarization state of laser radiation. The anisotropic component consists of optically active (globulin protein complexes - follicles filled with a colloid of thyroglobulin proteins) and structural (supramolecular fibrillar protein networks of connective tissue in the parenchyma) components (5). The optically active component predominantly forms maps of polarization azimuth
During the blood drop dehydration process, the natural self-assembly of protein molecules forms a supramolecular protein network. The structural characteristics of these proteins determine the formation of blood facies. The arrangement of atoms within the protein molecules defines their structure, which, in three-dimensional space, forms polymers or polypeptides. A sequence forms each polypeptide monomer or different α-amino acid. All
The protein structure hierarchy following levels are distinguished [64–68].
The primary structure of monomers (nucleotides or amino acids) represents the sequence. An amino acid’s primary structure’s significant feature is the almost random arrangement of its residues. From the biophysics perspective, circular birefringence is formed at this level.
The main polypeptide protein chain conformational arrangement forms the secondary structure, regardless of the side chains’ conformation. At this level, the linear birefringence optical axis direction is formed.
The tertiary structure represents the protein molecule spatial structure, which consists of a single chain. According to the polypeptide chain in space spatial arrangement method, globular and fibrillar proteins are divided. Globular proteins most often have an ellipsoidal shape and predominantly exhibit circular birefringence. Fibrillar (thread-like) proteins have an elongated shape and exhibit linear birefringence.
The quaternary structure is formed by the spatial arrangement of the individual polypeptide chains, which have predominantly the same primary, secondary, and tertiary structure.
As a result, a structurally and functionally unified blood facies supramolecular network is formed, which has phase anisotropy - circular and linear birefringence. The specificity of blood facies proteins’ polycrystalline supramolecular network structure or the relationship between the optical anisotropy parameter values is polypeptide fragments manifested in a certain conformational autonomy that are included in its composition.
Based on this, we should expect changes in the blood facies supramolecular networks’ circular and linear birefringence parameters, depending on the presence of thyroid pathology. In our case, the following prognostic scenario is expected. A pathological increase in the thyroglobulin and the albumins concentration that transport it [62, 63] may be accompanied by an increase in the blood facies supramolecular protein networks phase anisotropy, which is taken from sick patients.
Our main attention will be focused on the object field single scattered component polarization maps
5.1 Statistical analysis of polarization ellipticity maps
The series of Figures 2–5 presents the integral maps [fragments (1)] and ellipticity values distributions histograms [fragments (2)] of donors (control group 1) and patients with thyroid gland various pathologies (experimental groups 2–4).
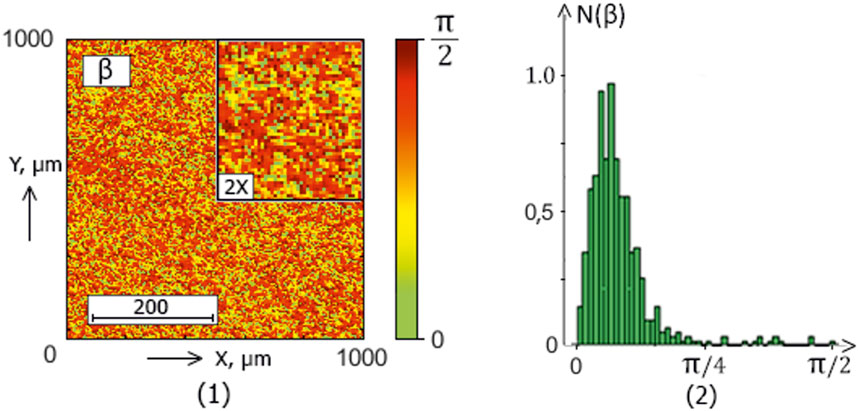
Figure 2. The blood facie polarization map [fragment (1)] and histogram [fragment (2)] for a patient from control group 1 (healthy donors).
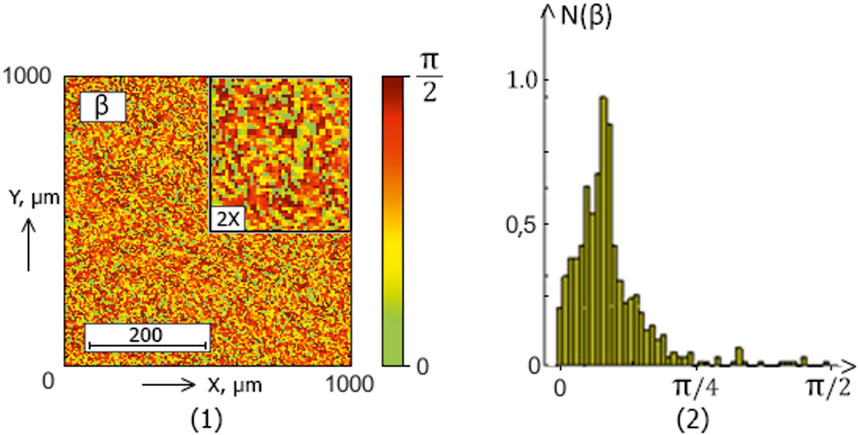
Figure 3. The blood facie polarization map [fragment (1)] and histogram [fragment (2)] for a patient from experimental group 2 (patients with nodular goiter).
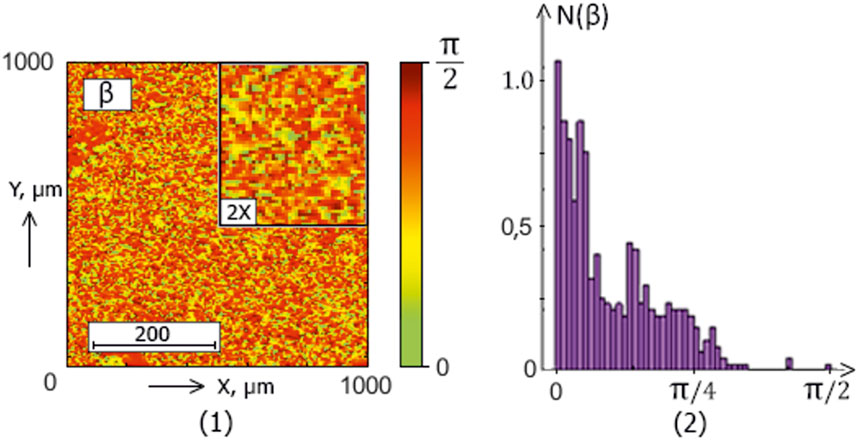
Figure 4. The blood facie polarization map [fragment (1)] and histogram [fragment (2)] for a patient from experimental group 3 (patients with autoimmune thyroiditis).
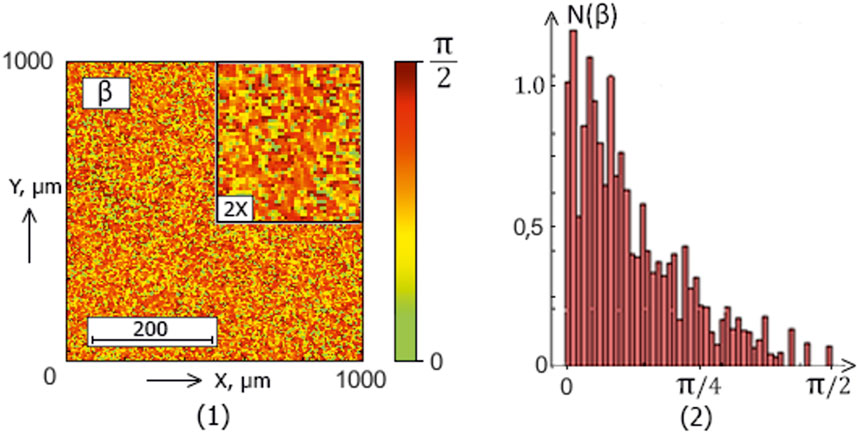
Figure 5. The blood facie polarization map [fragment (1)] and histogram [fragment (2)] for a patient from experimental group 4 (patients with papillary cancer).
The analysis of the obtained results revealed a correlation between the experimental data (Figures 2–5) and the proposed model of blood facies (patients in the control and study groups) speckle fields
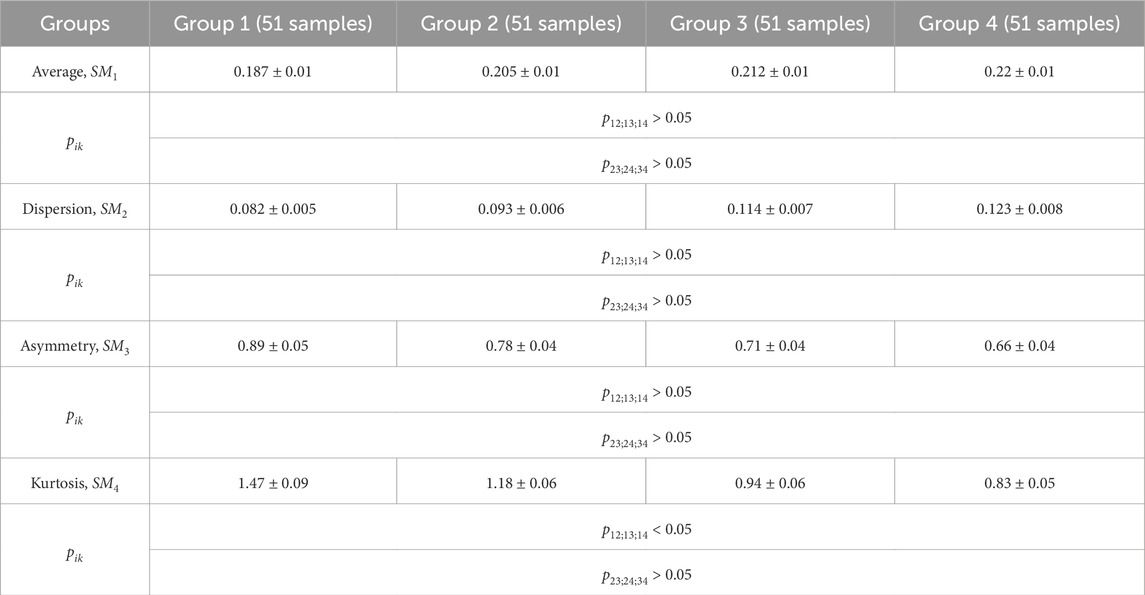
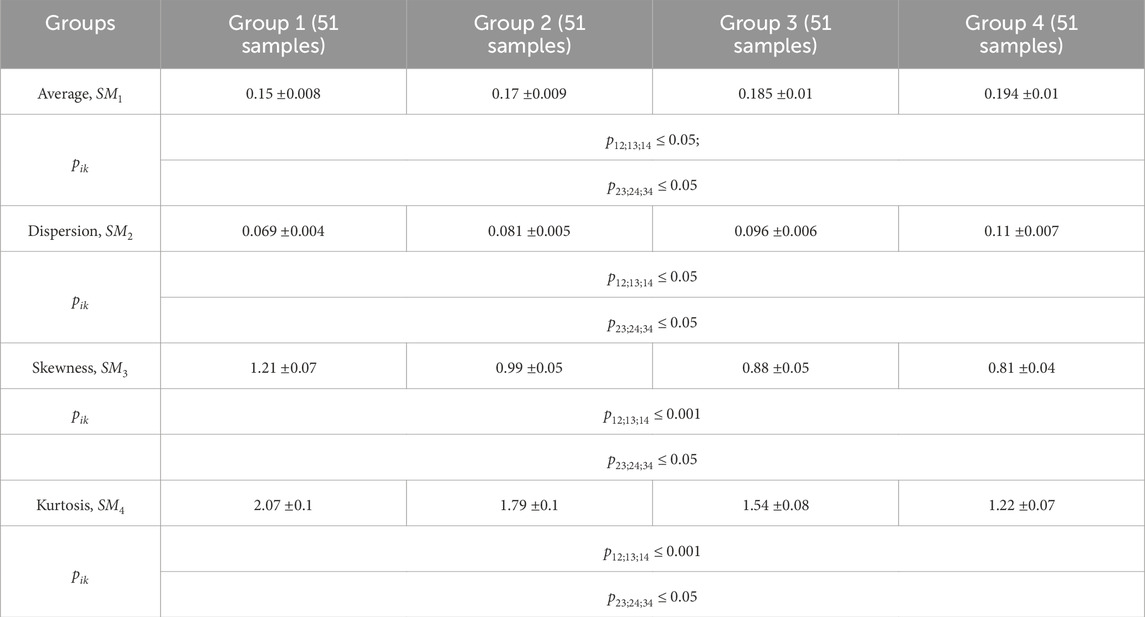
Table 2. Donors and patients with various thyroid gland pathologies blood facies polarization ellipticity maps statistical parameters.
A statistical test based on the Mann-Whitney test was used for pairwise comparisons of polarization ellipticity random values from statistically independent samples. The comparisons were made between the following groups: group 1 vs. group 2, group 1 vs. group 3, group 1 vs. group 4, group 2 vs. group 3, group 2 vs. group 4, and group 3 vs. group 4.
The statistical analysis results revealed:
• Statistically insignificant (
• The
• The 3rd-order
• The blood facies polarization maps sensitivity to intergroup changes has kurtosis
• Kurtosis
Therefore, for different pathologies (“normal - nodular goiter - autoimmune thyroiditis - papillary cancer”), the polarization ellipticity
To assess the diagnostic power of the method of polarization-interference mapping of laser speckle fields of blood facies, we used a number of evidence-based medicine operational characteristics36 - sensitivity (
In our work, the following scale for evaluating the diagnostic accuracy
• Unsatisfactory -
• Satisfactory – 71%–80%;
• Good – 81%–85%;
• Very good – 86%–90%;
• Excellent -
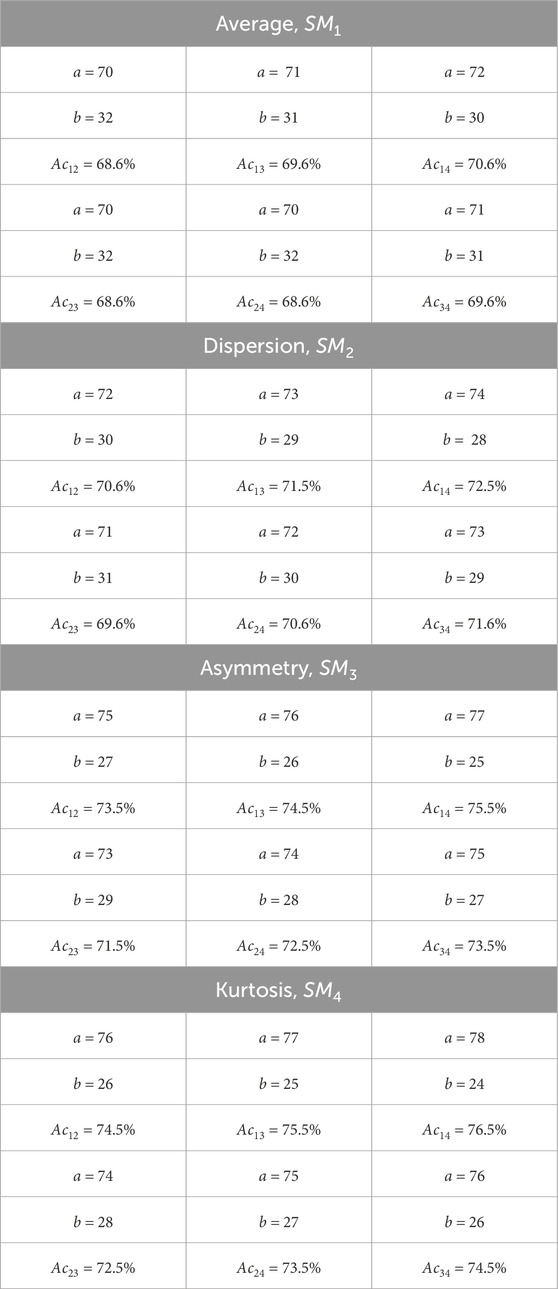
The thyroid gland pathology differential diagnosis balanced accuracy [76] results are systematized in Table 3. Here
The information analysis results demonstrated a slight diagnostic capacity for diagnosing and differentiating thyroid pathology (control group 1 and the set of all experimental groups “2–4″) - all statistical markers do not provide a balanced accuracy value higher than 80%.
A different situation is realized when using blood facies speckle fields
The series Figures 6–9 illustrates the algorithmically obtained in the phase plane (
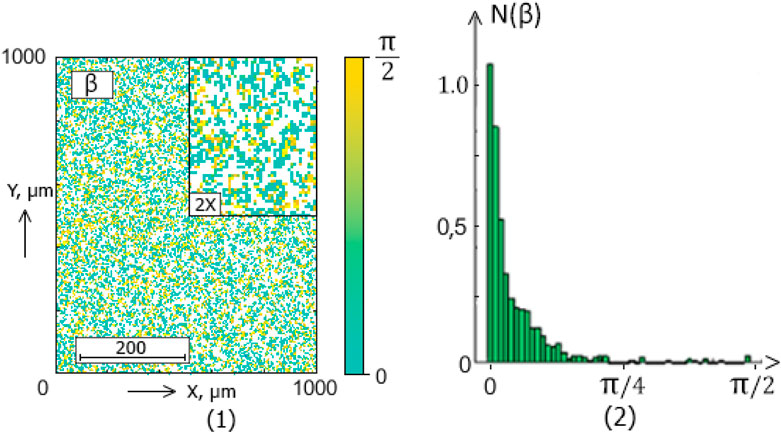
Figure 6. The blood facie phase (
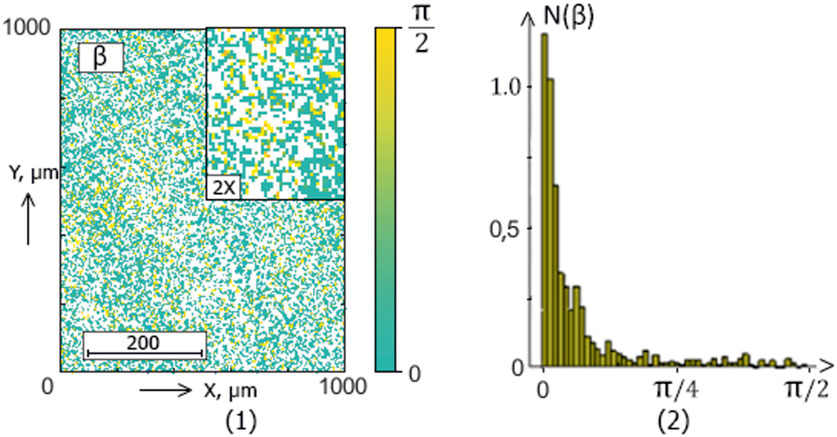
Figure 7. The blood facie phase (
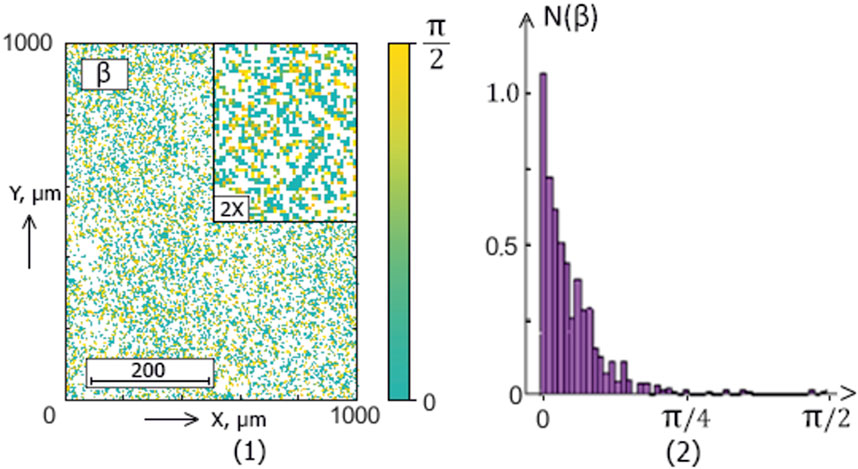
Figure 8. The blood facie phase (
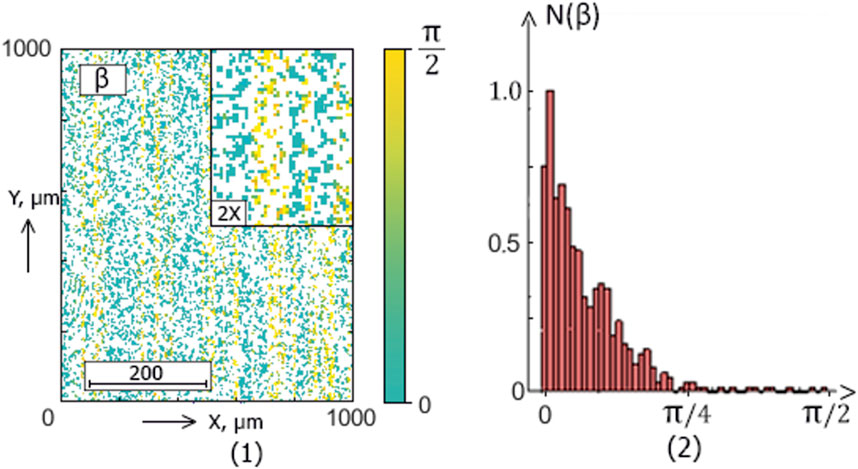
Figure 9. The blood facie phase (
The ellipticity distributions
Within the framework of the statistical approach (38), such pathological transformations should be accompanied by an increase in the mean (
This scenario of the difference’s formation between the blood facies polarization “object” maps
Polarization ellipticity maps
Statistical significance for diagnostics (
The mean
Skewness
The polarization ellipticity
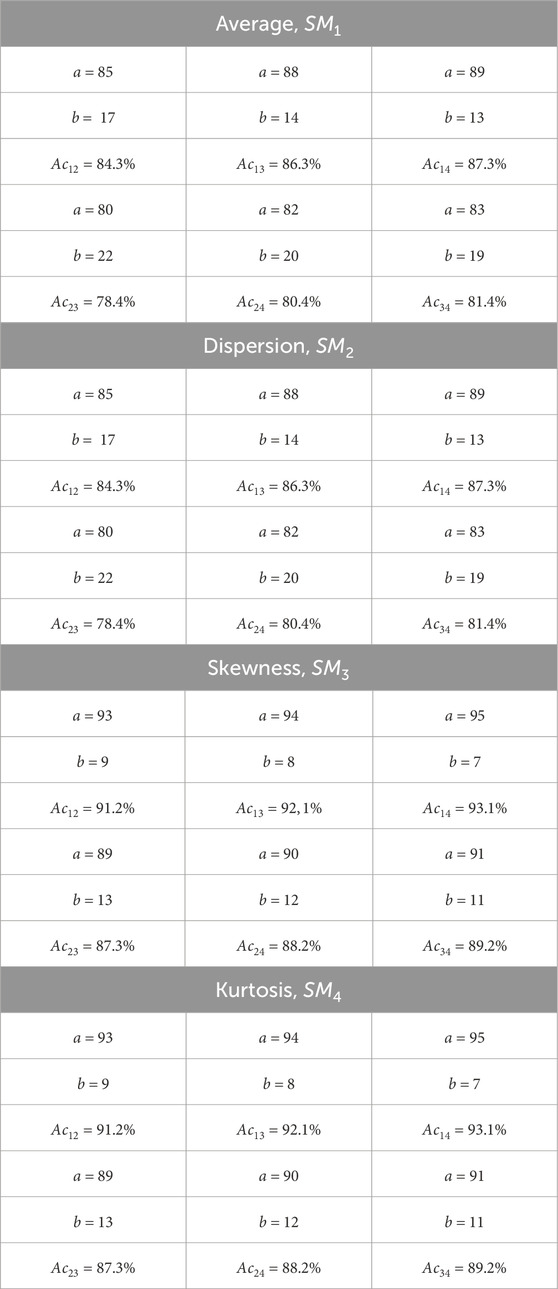
The information analysis results (Table 5) revealed a significant increase (from “unsatisfactory” to “very good” and “excellent” levels) in sensitivity compared with integral ellipticity polarization mapping.
The following balanced accuracy levels were demonstrated for the differential diagnosis of thyroid gland pathologies:
1. Thyroid gland pathology diagnosis (control group 1 and all experimental groups “2–4″):
•“normal - nodular goiter”
•“normal - autoimmune thyroiditis”
•“normal - papillary cancer”
2. Differential diagnosis:
•“nodular goiter - autoimmune thyroiditis”
•“nodular goiter - papillary cancer”
•“autoimmune thyroiditis - papillary cancer”
6 Research prospects
The proposed polarization-interference technique for phase scanning of blood facies speckle fields, using algorithmic selection of polarization ellipticity maps, will be improved by developing new digital holography algorithms. These algorithms will reconstruct maps of linear and circular birefringence as well as dichroism. This enhancement will expand the functional capabilities of the technique, increase the sensitivity of laser polarization-interference differential diagnostics, and open up new possibilities for objective screening and monitoring of thyroid disease treatment.
7 Conclusion
1. For the first time, a minimally invasive laser technique for polarization-interference layer-by-layer mapping of dehydrated blood films was developed and experimentally tested for the differential diagnosis of thyroid pathology.
2. To provide a physical basis and prognostic analysis of the polarization structure of speckle fields, a model description of the polycrystalline structure of supramolecular networks in blood facies was developed for the first time, using the approximation of linear and circular birefringence.
3. No statistically significant markers were identified through direct polarization-interference mapping and statistical analysis of measured “integral” maps of the ellipticity of the diffuse component of speckle fields in blood facies. As a result, the differential diagnosis of thyroid pathology did not exceed a satisfactory level of 80%.
4. Digital phase scanning of algorithmically reconstructed fields of complex amplitudes enabled the measurement of polarization ellipticity maps of the singly scattered component in the object speckle fields of blood facies. Based on this, new statistically significant markers for minimally invasive differential diagnosis of thyroid pathology were identified and physically substantiated.
5. The following results of differential diagnosis of thyroid pathology have been achieved:
5.1. Thyroid gland pathology diagnosis (control group 1 and all experimental groups “2–4”):
•“normal - nodular goiter”
•“normal - autoimmune thyroiditis”
•“normal - papillary cancer”
5.2. Differential diagnosis:
•“nodular goiter - autoimmune thyroiditis”
•“nodular goiter - papillary cancer”
•“autoimmune thyroiditis - papillary cancer”
Data availability statement
The original contributions presented in the study are included in the article/supplementary material, further inquiries can be directed to the corresponding authors.
Ethics statement
The studies involving humans were approved by Ethics Committee of the Bukovinian State Medical University (Chernivtsi, Ukraine). The studies were conducted in accordance with the local legislation and institutional requirements. The participants provided their written informed consent to participate in this study. Written informed consent was obtained from the individual(s) for the publication of any potentially identifiable images or data included in this article.
Author contributions
OU: Conceptualization, Formal Analysis, Project administration, Validation, Writing–original draft, Writing–review and editing. OB: Conceptualization, Investigation, Writing–review and editing. JZ: Formal Analysis, Methodology, Writing–original draft. AD: Data curation, Investigation, Software, Visualization, Writing–review and editing. OO: Software, Writing–review and editing. YU: Conceptualization, Investigation, Project administration, Supervision, Writing–original draft. IS: Formal Analysis, Investigation, Methodology, Writing–review and editing. IM: Data curation, Writing–review and editing. VS: Conceptualization, Writing–review and editing. ZC: Formal Analysis, Methodology, Writing–review and editing.
Funding
The author(s) declare that financial support was received for the research, authorship, and/or publication of this article. Authors acknowledge the support from the National Research Foundation of Ukraine, Project 2022.01/0034; Project 2023.01/0174.
Conflict of interest
The authors declare that the research was conducted in the absence of any commercial or financial relationships that could be construed as a potential conflict of interest.
Publisher’s note
All claims expressed in this article are solely those of the authors and do not necessarily represent those of their affiliated organizations, or those of the publisher, the editors and the reviewers. Any product that may be evaluated in this article, or claim that may be made by its manufacturer, is not guaranteed or endorsed by the publisher.
References
1. Tuchin VV. Tissue optics and photonics: light-tissue interaction. J Biomed Photon Eng (2015) 1:98–134. doi:10.18287/jbpe-2015-1-2-98
3. Boas DA, Pitris C, Ramanujam N. Handbook of biomedical optics. Boca Raton: CRC Press (2011). p. 831.
4. Valery V. Tuchin. Tissue optics: light scattering methods and instruments for medical diagnosis. In: Tissue optics: light scattering methods and instruments for medical diagnosis. 3rd ed. WA, USA: Society of Photo-Optical Instrumentation Engineers SPIE Ebooks (2015). doi:10.1117/3.1003040
5. Wang LV, Wu H-I. Biomedical optics. Biomedical optics: principles and imaging. John Wiley and Sons, Inc. (2009). p. 362.
6. Ushenko AG, Pishak VP. Laser polarimetry of biological tissues: principles and applications. In: VV Tuchin, editor. Handbook of coherent domain optical methods. Springer US (2004). p. 93–138.
7. Ghosh N. Tissue polarimetry: concepts, challenges, applications, and outlook. J Biomed Opt (2011) 16:110801. doi:10.1117/1.3652896
8. Jacques SL. Polarized light imaging of biological tissues. In: D Boas, C Pitris, and N Ramanujam, editors. Handbook of biomedical optics 2. Boca Raton: CRC Press (2011). p. 649–69.
9. Ghosh N, Wood M, Vitkin A. Polarized light assessment of complex turbid media such as biological tissues using mueller matrix decomposition. In: VV Tuchin, editor. Handbook of photonics for biomedical science. Boca Raton: CRC Press (2010). p. 253–82.
10. Layden D, Ghosh N, Vitkin IA. Quantitative polarimetry for tissue characterization and diagnosis. In: RK Wang, and VV Tuchin, editors. Advanced biophotonics: tissue optical sectioning. Boca Raton: CRC Press (2013). p. 73–108.
11. Vitkin A, Ghosh N, de Martino A Tissue polarimetry. in Photonics: scientific foundations, Technology and applications. In: ed. DL Andrews editor. John Wiley and Sons, Ltd. (2015). p. 239–321.
12. Tuchin VV. Tissue optics and photonics: biological tissue structures. J Biomed Photon Eng (2015) 1:3–21. doi:10.18287/jbpe-2015-1-1-3
13. Bai X, Liang Z, Zhu Z, Schwing A, Forsyth D, Gruev V. Polarization-based underwater geolocalization with deep learning. eLight (2023) 3:15. doi:10.1186/s43593-023-00050-6
14. Lee HR, Lotz C, Kai Groeber Becker F, Dembski S, Novikova T. Digital histology of tissue with Mueller microscopy and FastDBSCAN. Appl Opt (2022) 61(32):9616–24. doi:10.1364/ao.473095
15. Kim M, Lee HR, Ossikovski R, Malfait-Jobart A, Lamarque D, Novikova T. Optical diagnosis of gastric tissue biopsies with Mueller microscopy and statistical analysis. J Europ Opt Soc Rapid Publ (2022) 18(2):10. doi:10.1051/jeos/2022011
16. Lee HR, Li P, Yoo TSH, Lotz C, Groeber-Becker FK, Dembski S, et al. Digital histology with Mueller microscopy: how to mitigate an impact of tissue cut thickness fluctuations. J Biomed Opt (2019) 24(7):1. doi:10.1117/1.jbo.24.7.076004
17. Li P, Lee HR, Chandel S, Lotz C, Groeber-Becker FK, Dembski S, et al. Analysis of tissue microstructure with Mueller microscopy: logarithmic decomposition and Monte Carlo modeling. J Biomed Opt (2020) 25(1):1. doi:10.1117/1.jbo.25.1.015002
18. Lee HR, Yoo TSH, Li P, Lotz C, Groeber-Becker FK, Dembski S, et al. Mueller microscopy of anisotropic scattering media: theory and experiments. Proc SPIE 10677 Unconventional Opt Imaging (2018) 10677.
19. Ma H, He H, Ramella-Roman JC. Mueller matrix microscopy. In: JC Ramella-Roman, and T Novikova, editors. Polarized light in biomedical imaging and sensing. Cham: Springer (2023). p. 281–321.
20. Ushenko YA, Koval GD, Ushenko AG, Dubolazov OV, Ushenko VA, Novakovskaia OY. Mueller-matrix of laser-induced autofluorescence of polycrystalline films of dried peritoneal fluid in diagnostics of endometriosis. J Biomed Opt (2016) 21(7):071116. doi:10.1117/1.jbo.21.7.071116
21. Angelsky PO, Ushenko AG, Dubolazov AV, Sidor MI, Bodnar GB, Koval G, et al. The singular approach for processing polarization-inhomogeneous laser images of blood plasma layers. J Opt (2013) 15(4):044030. doi:10.1088/2040-8978/15/4/044030
22. Angelsky OV, Ushenko AG, Pishak VP, Burkovets DN, Yermolenko SB, Pishak O, et al. Coherent introscopy of phase-inhomogeneous surfaces and layers. Photon Devices, Syst (1999) 4016:413–8. doi:10.1117/12.373664
23. Ushenko AG, Dubolazov AV, Ushenko VA, Novakovskaya OY. Statistical analysis of polarization-inhomogeneous Fourier spectra of laser radiation scattered by human skin in the tasks of differentiation of benign and malignant formations. J Biomed Opt (2016) 21(7):071110. doi:10.1117/1.jbo.21.7.071110
24. Yermolenko S, Ushenko A, Ivashko P, Gruia I, Zimnyakov D, Gavrila C, et al. Spectropolarimetry of cancer change of biotissues. Ninth Int Conf Correlation Opt (2009) 7388:404–10.
25. Ushenko VA, Hogan BT, Dubolazov A, Grechina AV, Boronikhina TV, Gorsky M, et al. Embossed topographic depolarisation maps of biological tissues with different morphological structures. Scientific Rep (2021) 11(1):3871. doi:10.1038/s41598-021-83017-2
26. Olar EI, Ushenko AG, Ushenko YA. Correlation microstructure of the Jones matrices for multifractal networks of biotissues. Laser Phys (2004) 14(7):1012–8.
27. Ushenko A, Sdobnov A, Dubolazov A, Grytsiuk M, Ushenko Y, Bykov A, et al. Stokes-correlometry analysis of biological tissues with polycrystalline structure. IEEE J Selected Top Quan Electronics (2018) 25(1):1–12. doi:10.1109/jstqe.2018.2865443
28. Angelsky OV, Ushenko AG, Zenkova CY, Felde CV, et al. Optical measurements: polarization and coherence of light fields. Rijeka, Croatia: INTECH Open Access Publisher (2012).
29. Pishak VP, Ushenko AG, Gryhoryshyn P, et al. Polarization structure of biospeckle fields in crosslinked tissues of a human organism: 1. Vector structure of skin biospeckles. Int Conf Correlation Opt (1997) 3317:418–24. Available from: https://iris.who.int/handle/10665/91976.
30. Eftimie LG, Glogojeanu RR, Tejaswee A, Gheorghita P, Stanciu SG, Chirila A, et al. Differential diagnosis of thyroid nodule capsules using random forest guided selection of image features. Scientific Rep (2022) 12:21636. Article number: 21636. doi:10.1038/s41598-022-25788-w
31. Yang W-T, Ma B-Y, Chen Y. A narrative review of deep learning in thyroid imaging: current progress and future prospects. Quant Imaging Med Surg (2024) 14(2):2069–88. doi:10.21037/qims-23-908
32. Tokarz D, Cisek R, Joseph A, Asa SL, Wilson BC, Barzda V. Characterization of pathological thyroid tissue using polarization-sensitive second harmonic generation microscopy. Lab Invest (2020) 100(10):1280–7. doi:10.1038/s41374-020-0475-7
33. Richard C, Ariana JMA, Harvey DT. Polarization-sensitive second harmonic generation microscopy for investigations of diseased collagenous tissues. Front Phys. Sec. Optics and Photonics Volume 9 - 2021. doi:10.3389/fphy.2021.726996
34. Hristu R, Eftimie LG, Stanciu SG, Tranca DE, Paun B, Sajin M, et al. Quantitative second harmonic generation microscopy for the structural characterization of capsular collagen in thyroid neoplasms. Biomed Opt Express (2018) 9(8):3923–36. doi:10.1364/BOE.9.003923
35. de Boer JF, Milner TE. Review of polarization sensitive optical coherence tomography and Stokes vector determination. J Biomed Opt (2002) 7(3):359–71. doi:10.1117/1.1483879
36. K US, Mahato KK, Mazumder N. Polarization-resolved Stokes-Mueller imaging: a review of technology and applications. Lasers Med Sci (2019) 34(7):1283–93. doi:10.1007/s10103-019-02752-1
37. He Y, Li K, Li W, Qiu Y, Li D, Wang C, et al. Polarization coherency matrix tomography. J Biophotonics (2023) 16(9):e202300093. doi:10.1002/jbio.202300093
38. Yang D, Yuan Z, Hu M, Liang Y. Zebrafish brain and skull imaging based on polarization-sensitive optical coherence tomography. J Biophotonics (2022) 15(12):e202200112. doi:10.1002/jbio.202200112
39. Park JE, Xin Z, Kwon DY, Kim SW, Lee H, Jung MJ, et al. Application of polarization sensitive-optical coherence tomography to the assessment of phase retardation in subpleural cancer in rabbits. Tissue Eng Regen Med (2021) 18(1):61–9. doi:10.1007/s13770-020-00318-9
40. Willemse J, Gräfe MGO, Verbraak FD, de Boer JF. In vivo 3D determination of peripapillary scleral and retinal layer architecture using polarization-sensitive optical coherence tomography. Transl Vis Sci Technol (2020) 9(11):21. doi:10.1167/tvst.9.11.21
41. Baumann B, Augustin M, Lichtenegger A, Harper D, Muck M, Eugui P, et al. Polarization-sensitive optical coherence tomography imaging of the anterior mouse eye. J Biomed Opt (2018) 23(8):1–12. doi:10.1117/1.JBO.23.8.086005
42. Hariri LP, Adams DC, Applegate MB, Miller AJ, Roop BW, Villiger M, et al. Distinguishing tumor from associated fibrosis to increase diagnostic biopsy yield with polarization-sensitive optical coherence. Tomography Clin Cancer Res (2019) 25(17):5242–9. doi:10.1158/1078-0432.CCR-19-0566
43. Tao K, Sun K, Ding Z, Ma Y, Kuang H, Zhao H, et al. Catheter-based polarization sensitive optical coherence tomography using similar mueller matrix method. IEEE Trans Biomed Eng (2020) 67(1):60–8. doi:10.1109/TBME.2019.2908031
44. de Boer JF, Hitzenberger CK, Yasuno Y. Polarization sensitive optical coherence tomography – a review [Invited]. tomography Biomed Opt Express (2017) 8(Issue 3):1838–73. doi:10.1364/boe.8.001838
45. Peyvasteh M, Tryfonyuk L, Ushenko V, Syvokorovskaya AV, Dubolazov A, Vanchulyak O, et al. 3D Mueller-matrix-based azimuthal invariant tomography of polycrystalline structure within benign and malignant soft-tissue tumours. Laser Phys Lett (2020) (2020) 17(11):115606. doi:10.1088/1612-202x/abbee0
46. Ushenko AG, Dubolazov AV, Litvinenko OY, Bachinskiy VT, Bin L, Bin G, et al. 3D polarization correlometry of object fields of networks of biological crystals. Proc SPIE (2020) 11369:113691M.
47. Bodnar A, Dubolazov A, Pavlyukovich A, Pavlyukovichv N, Ushenko A, Motrich A, et al. 3D Stokes correlometry of the polycrystalline structure of biological tissues. Proc SPIE (2020) 11509:115090V.
48. Ushenko A, Dubolazov A, Zheng J, Bakun O, Gorsky M, Ushenko Y, et al. Mueller matrix polarization interferometry of optically anisotropic architectonics of biological tissue object fields: the fundamental and applied aspects. Front Phys (2024) 11:1302254. doi:10.3389/fphy.2023.1302254
49. Sdobnov A, Ushenko VA, Trifonyuk L, Bakun O, Garazdyuk M, Soltys IV, et al. Mueller-matrix imaging polarimetry elevated by wavelet decomposition and polarization-singular processing for analysis of specific cancerous tissue pathology. J Biomed Opt (2023) 28(10):102903. doi:10.1117/1.jbo.28.10.102903
50. Ushenko A, Zheng J, Gorsky M, Dubolazov A, Ushenko Y, Soltys I, et al. 3D digital holographic polarimetry of diffuse optically anisotropic biological tissue object fields. Front Phys 111288935.
51. Ushenko A, Zheng J, Litvinenko A, Gorsky M, Wanchuliak O, Dubolazov O, et al. 3D digital polarization-holographic wavelet histology in determining the duration of mechanical damage to the myocardium. J Biophotonics (2024) 17(3):e202300372. doi:10.1002/jbio.202300372
52. Ushenko A, Dubolazov A, Zheng J, Litvinenko A, Gorsky M, Ushenko Y, et al. 3D polarization-interference holographic histology for wavelet-based differentiation of the polycrystalline component of biological tissues with different necrotic states. Forensic applications. J Biomed Opt (2024) 29(5):052920. doi:10.1117/1.jbo.29.5.052920
53. Hunter R. Foundations of colloid science/R. Hunter. New York: Oxford University Press (2004). p. 806.
54. Chen X, Chen PG, Ouazzani J Numerical simulations of sessile droplet evaporating on heated substrate/X. J Ouazzani//Eur Phys J Spec Top (2017) 226(6):1325–35.
55. Dash S. Droplet evaporation on heated hydrophobic and superhydrophobic surfaces/S. S.V Garimella//Phys Rev E (2014) 89:1–8.
56. Gleason K. Microdroplet evaporation with a forced pinned contact line/K. Gleason, S.A. Putnam//Langmuir: ACS J Surf Colloids (2014) 30(34):10548–55.
57. Hu H, Larson RG, Hu RG. Evaporation of a sessile droplet on a substrate/H. Larson//The J Phys Chem B (2020) 106:1334–44.
58. Vladmir Z, Wang JB, Yan XH. Human blood plasma crystal and molecular biocolloid textures – dismetabolism and genetic breaches. Nat Sci J – Xiangtan Univ (2001) 23:118–27.
59. Abe S, Tanaka J, Kojima M, Kanamaru S, Hirata K, Yamashita K, et al. Cell-free protein crystallization for nanocrystal structure determination. Scientific Rep (2022) 12:16031. Article number: 16031. doi:10.1038/s41598-022-19681-9
60. Van den Beld AW, Kaufman JM, Zillikens MC, Lamberts SWJ, Egan JM, van der Lely AJ. The physiology of endocrine systems with ageing. Lancet Diabetes Endocrinol (2018) 6(8):647–58. doi:10.1016/S2213-8587(18)30026-3
61. Asa SL, Erickson LA, Rindi G. The spectrum of endocrine pathology. Endocr Pathol (2023) 34(4):368–81. doi:10.1007/s12022-023-09758-0
62. Brix K, Szumska J, Weber J, Qatato M, Venugopalan V, Al-Hashimi A, et al. Auto-regulation of the thyroid gland beyond classical pathways. Exp Clin Endocrinol Diabetes (2020) 128(6-07):437–45. doi:10.1055/a-1080-2969
63. Grieco G, Wang T, Delcorte O, Spourquet C, Janssens V, Strickaert A, et al. Class III PI3K Vps34 controls thyroid hormone production by regulating thyroglobulin iodination. Lysosomal Proteolysis, Tissue Homeostasis Thyroid (2020) 30(1):133–46. doi:10.1089/thy.2019.0182
64. Walter F. PhD. Boron. Medical physiology: a cellular and molecular approaoch. Elsevier/Saunders (2003). p. 1300. ISBN 1-4160-2328-3.
65. Delom F, Mallet B, Carayon P, Lejeune PJ. Role of extracellular molecular chaperones in the folding of oxidized proteins. Refolding of colloidal thyroglobulin by protein disulfide isomerase and immunoglobulin heavy chain-binding protein. J Biol Chem Journal — United States (2001) 276(24):21337–42. —ISSN 0021-9258. doi:10.1074/jbc.M101086200
66. Wagner I, Musso H 1983, New naturally occurring amino acids Angew Chem Int Edition English : magazin.— 1983.— November (Bd. 22,Nr. 11).—S. 22, 816–28.doi:10.1002/anie.198308161
67. Stephen Stoker H Organic and biological chemistry, 371. Boston, USA: Cengage Learning. ISBN 978-1-305-68645-8.
68. Delom F, Mallet B, Carayon P, Lejeune PJ. Role of extracellular molecular chaperones in the folding of oxidized proteins. Refolding of colloidal thyroglobulin by protein disulfide isomerase and immunoglobulin heavy chain-binding protein. J Biol Chem Journal — United States (2001) 276(24):21337–42. ISSN 0021-9258. doi:10.1074/jbc.M101086200
69. Ushenko V, Sdobnov A, Syvokorovskaya A, Alexander D, Vanchulyak O, Meglinski I, et al. 3D mueller-matrix diffusive tomography of polycrystalline blood films for cancer diagnosis. Cancer Diagn Photon (2018) 5(4):54. doi:10.3390/photonics5040054
70. Marchesini R, Bertoni A, Andreola S, Melloni E, Sichirollo AE. Extinction and absorption coefficients and scattering phase functions of human tissues in vitro. Appl Opt (1989) 28(12):2318–24. doi:10.1364/ao.28.002318
71. Edwards DK, Gier JT, Nelson KE, Roddick RD. Integrating sphere for imperfectly diffuse samples. J Opt Soc Am (1961) 51:1279–88. doi:10.1364/josa.51.001279
72. Yildirim Simsir I, Cetinkalp S, Kabalak T. Review of factors contributing to nodular goiter and thyroid carcinoma. Med Princ Pract (2020) 29(1):1–5. doi:10.1159/000503575
73. Knobel M. Etiopathology, clinical features, and treatment of diffuse and multinodular nontoxic goiters. J Endocrinol Invest (2016) 39(4):357–73. doi:10.1007/s40618-015-0391-7
74. Mallya M, Ogilvy-Stuart AL. Thyrotropic hormones. Best Pract Res Clin Endocrinol Metab (2018) 32(1):17–25. doi:10.1016/j.beem.2017.10.006
75. Delitala AP, Capobianco G, Cherchi PL, Dessole S, Delitala G. Thyroid function and thyroid disorders during pregnancy: a review and care pathway. Arch Gynecol Obstet (2019) 299(2):327–38. doi:10.1007/s00404-018-5018-8
Keywords: polarization, interference, holography, microscopic image, optical anisotropy, statistical moments, blood facies, thyroid gland
Citation: Ushenko O, Bilookyi O, Zheng J, Dubolazov A, Olar O, Ushenko Y, Soltys I, Mikirin I, Skliarchuk V and Chen Z (2024) 3D digital holographic polarimetry of laser speckle fields formed by polycrystalline blood films: a tool for differential diagnosis of thyroid pathology. Front. Phys. 12:1426469. doi: 10.3389/fphy.2024.1426469
Received: 01 May 2024; Accepted: 30 October 2024;
Published: 27 November 2024.
Edited by:
Jianglei Di, Guangdong University of Technology, ChinaReviewed by:
Irina Nakashidze, Shota Rustaveli State University, GeorgiaJinlong Zhu, Huazhong University of Science and Technology, China
Copyright © 2024 Ushenko, Bilookyi, Zheng, Dubolazov, Olar, Ushenko, Soltys, Mikirin, Skliarchuk and Chen. This is an open-access article distributed under the terms of the Creative Commons Attribution License (CC BY). The use, distribution or reproduction in other forums is permitted, provided the original author(s) and the copyright owner(s) are credited and that the original publication in this journal is cited, in accordance with accepted academic practice. No use, distribution or reproduction is permitted which does not comply with these terms.
*Correspondence: Yurii Ushenko, eXVyaXl1QGdtYWlsLmNvbQ==
 Olexander Ushenko
 Olexander Bilookyi3
 Jun Zheng
 Alexander Dubolazov