- 1Department of Mathematics, Xinzhou Normal University, Xinzhou, China
- 2School of Mathematics and Statistics, Shanxi University, Taiyuan, China
- 3Institute of Computing Technology, China Academy of Railway Sciences Company Ltd., Beijing, China
In the railway system environment, the interconnection of a vast array of intelligent sensing devices has brought about revolutionary changes in the management and monitoring of railway transportation. However, this also poses challenges to the communication service quality within the railway Internet of Things (IoT). Through collective intelligence and collaboration, the nodes within the railway IoT can not only share data and information but also work synergistically to enhance the overall intelligence level and improve decision-making quality of the network. Therefore, this paper proposes a reconnection mechanism based on the computation of node game-theoretic benefits and optimizes this process with the concept of swarm intelligence collaboration. Initially, the game-theoretic benefit values of the nodes in the railway IoT network are calculated. Subsequently, based on the weight priority of the edges, the two edges with the larger weights are selected, and connections are established between nodes with similar game-theoretic benefit values to enhance the network’s robustness. This approach enables rapid networking and efficient communication transmission within the railway IoT, providing robust assurance for the safe and stable operation of the railway.
1 Introduction
With the rapid development of new generation information [1] and communication technologies (5G), the scale of Internet of Things (IoT) applications in the railway environment has increased dramatically [2]. The rapid expansion of IoT applications, while enhancing network service quality, also brings greater risks of network paralysis [3]. Device nodes in network applications are susceptible to failure due to various factors, such as natural disaster activities, node malfunctions, and malicious attacks. Moreover, since IoT applications are interconnected, the paralysis of a single network can easily lead to a chain reaction causing the collapse of the entire railway IoT system [4]. Therefore, in the face of partial device node failures, how to improve the quality of service (QoS) of complex IoT applications and their robustness against network attacks [5], and to maximize the maintenance of network topology communication capabilities, has become a bottleneck in the development of large-scale railway IoT applications [6].
When the topological structure of IoT applications is attacked, measuring and optimizing the robustness and reliability of the network topology is an important means to minimize the risk of network failures [7]. In practical dynamic issues such as the propagation and immunity of complex networks [8], and link control [9], different topological structures exhibit different levels of robustness in the face of deliberate attacks or random failures. Therefore, altering the network’s topological structure is of significant importance for enhancing the robustness of complex networks.
The robustness of complex networks measures the network’s ability to respond to external disturbances, such as deliberate attacks or random failures [10]. Networks that maintain their functionality under such changes (by removing some nodes or edges) are considered more robust than those that do not. Current research on improving the robustness of complex networks is mainly divided into two categories: increasing the connections within the network and reconnecting the network’s edges. Many infrastructures have capacity limitations, such as transmission lines of power plants and the number of flights in aviation systems, making it impractical to increase the number of connections in a network. A substantial amount of research has confirmed that the reconnection mechanism [11] is a simple and effective method often used to adjust the network’s topological structure to enhance its robustness. For the topological structure of complex dynamic networks, it is generally described by a coupling matrix, and most of the existing literature discusses the case of constant coefficient coupling matrices. In actual complex dynamic networks, due to the influence of external environments, the topological structure cannot remain constant. Therefore, it is necessary to introduce the concept of time-varying topological structures in complex dynamic networks. Some scholars have begun to consider this issue. For example, Refs. [12,13] discuss the time-varying coupling strength in complex dynamic networks, using adaptive laws to identify unknown parameters, achieving adaptive synchronization of complex dynamic networks; Ref. [9] discusses the control of complex networked supply chains with multiple time-delay couplings and time-varying topological structures, thereby enhancing the network’s ability to resist collaborative attacks; and how the network’s performance in the dynamics process feeds back and affects the evolution of the topological structure.
Currently, IoT topology optimization methods [12] primarily use the largest connected subgraph as a robustness metric to quantify and optimize network topologies. Since the IoT topology optimization problem is an NP-hard problem [14], to seek approximate optimal solutions, most IoT topology optimization methods are based on heuristic algorithms [15,16]. Meanwhile, in complex networks, the scale-free network model more closely resembles the structure of real-world networks and performs well in resisting random network attacks (where each device node fails or leaves the network with equal probability). However, it is prone to network paralysis when facing malicious attacks (where important nodes fail first). A multitude of researchers have proposed efficient strategies to enhance the stability and resilience of IoT topological structures. Rong et al [14] first classified the edges in the network as effective, ineffective, and flexible edges, and then proposed a heuristic optimization algorithm based on edge classification (EC), designed to enhance the robustness of scale-free (SF) networks against malicious attacks (MA). Qiu et al. [13] introduced the ROSE strategy, an enhancement method for wireless sensors in scale-free networks, which identifies and protects key nodes in the network and optimizes the connection structure to fend off malicious attacks. Zhao et al studied [17] a specific type of network attack under the knapsack constraint—the maximum vertex cover attack, which aims to maximize the number of links associated with removed nodes under a limited budget. Game theory, which describes the micro-interactions of network nodes, is naturally a powerful tool to guide the adjustment of topological structures, and applying cooperative game theory to the optimization of IoT topologies will also face greater opportunities and challenges.
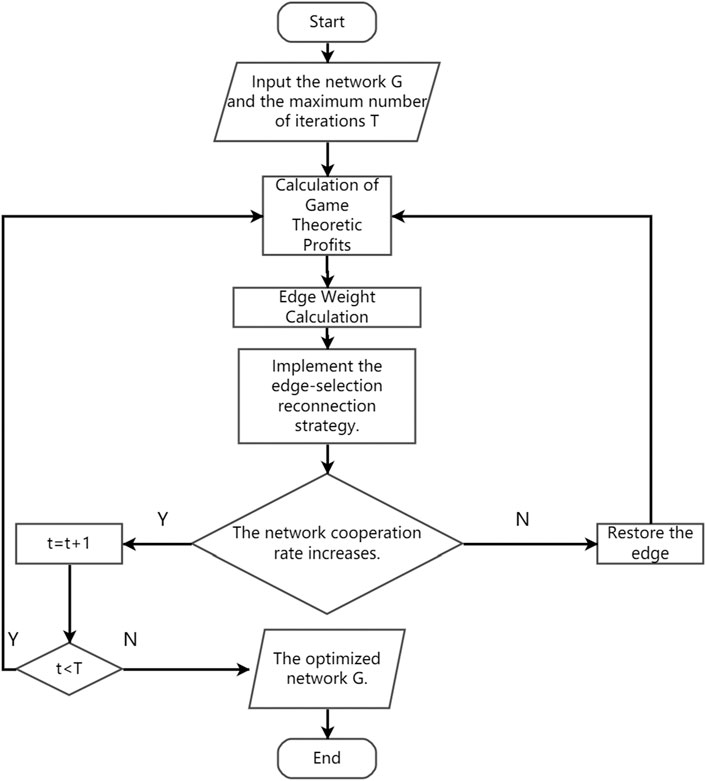
Based on this, to address the failure of some critical equipment nodes and the chain reaction collapse effect of network attacks, which affect the service quality of railway system communication applications, this paper proposes a reconnection mechanism calculated based on the measurement of game-theoretic benefits between nodes. The first chapter introduces the essential knowledge of complex networks and model construction, and on this basis, constructs a cooperative game strategy, including interaction strategies, transformation rules, and equilibrium balance analysis. The second chapter proposes the initialization of the model and the reconnection edge mechanism. The third chapter verifies the optimized network robustness based on the game value reconnection edge mechanism using Monte Carlo experiments in complex networks.
2 Construction of multi-layer topological network model in the railway internet of things environment
2.1 Network representation
The network is modeled as a weighted graph
This paper only considers simple connected undirected graphs without duplicate edges or self-loops, meaning that there is at most one edge between any pair of nodes in the network, each edge has two distinct endpoints, and there is at least one path between any two nodes. The neighborhood of a node
2.2 Game strategy
Swarm intelligence collaboration is a large-scale sensing and computing model based on collective intelligence, emphasizing the completion of complex sensing and computing tasks through the participatory and collaborative nature of the group. This model typically involves a large number of individuals who are interconnected through communication technologies such as the Internet, collectively engaging in a particular task or goal. The core of swarm intelligence collaboration lies in how to effectively organize and motivate these participants, as well as how to process and analyze the vast amounts of data they generate.
By integrating swarm intelligence collaboration with cooperative game theory, a more efficient and fair system can be created. In this system, participants (who can be humans or intelligent devices) are motivated to cooperate and jointly complete tasks or solve problems. Cooperative game theory provides the tools and methods to design such incentive mechanisms.
In the cooperative evolution within network structures, it is assumed that each individual engages in a round of public goods games with its neighbors at each clock cycle, where the neighbors are the subjects of the individual’s game, related to the social network structure that hosts the gaming group. The model includes three types of topological structures for the gaming group: regular lattice networks, BA scale-free networks, and WS small-world networks. In each round of the game, there is no central leader to control; individuals have two choices: to cooperate or to defect. The specific strategy an individual chooses is related to a series of factors, which is also what the experiment will investigate. The strategies adopted will have an impact on neighboring subjects; adopting a cooperative strategy generates positive externalities, from which other subjects can benefit. These externalities reflect the social ability of subjects to interact with their adjacent subjects. After multiple rounds of the game, whether a stable evolutionary outcome can be achieved is also influenced by the introduction of incentive mechanisms in the experiment, which aim to shift the original evolutionary outcome from defection to cooperation. Each subject in the model is described by four elements:
1) The strategy for this round is either cooperation or defection;
2) The strategy from the previous round was either cooperation or defection;
3) The score for this round;
4) To facilitate the observation of results during the simulation process, subjects are also assigned different colors for distinction. The specific rules are as shown in Table 1.
2.3 Interaction and strategy transition rules
The most important part of evolutionary game theory is the interaction between individuals (interact) and the selection stage of the next round of strategy. Assuming all individuals are homogeneous and have the same set of strategies. When an individual adopts a cooperative strategy, the net benefit it receives is the cooperative benefit R minus the cooperation cost c. For the convenience of studying the problem, let the benefit R be the total number of all neighboring nodes plus one (which is itself), and the cooperation cost is 1, so the net benefit for each node is its total number of neighboring nodes. When a node chooses a defection strategy, the defector will gain a certain benefit, and due to the cooperation of neighboring nodes, the defector will free-ride and enjoy the positive external benefits from the cooperating neighbors, so its benefit is the defection incentive multiplied by the total number of cooperators among its neighboring nodes.
Therefore, for each individual, the number of cooperators among its neighboring nodes is counted, and if the individual is a cooperator, its score is the total number of cooperators among its neighbors; if the individual is a defector, its score is the product of the defection benefit and the total number of cooperating neighbors. In this paper, we mainly adopt the strategy of choosing the one with the highest score among the neighboring nodes as the strategy for the next round, characterizing the feature of learning from the strong in evolutionary games.
2.4 Strategy space and equilibrium analysis
The incentive rules here are refined into rewards (R) and punishments (P). The incentive policy will either reward cooperators as the sole strategy or punish defectors as the sole strategy. Individuals will react to external stimuli, that is, they will consider the rewards or punishments given by the central authority before making decisions. The model compares three scenarios: no policy, reward policy, and punishment policy, to determine which one achieves the optimal outcome (the optimal outcome is determined by the number of cooperators), in order to identify the best solution. When a reward mechanism is introduced into the model, corresponding to rewards for cooperators in reality, a reward (reward) is introduced, and the utility function of cooperators increases, while the utility function of individuals adopting a defection strategy remains unchanged. When a punishment mechanism is introduced into the model, corresponding to punishments for defectors in reality, a punishment (punishment) is introduced, and the utility function of defectors will decrease by a value P, while the utility function of individuals adopting a cooperation strategy remains unchanged.
The individual payoff is characterized as follows:
The average revenue is as follows:
where
The expected outcome is related to the number of initial cooperators, the size of the group, the magnitude of the defection payoff, and the network’s topological structure. Subsequently, targeted improvements in parameter settings, as well as the magnitude of imposed incentives, expected rewards, and punishments, will also affect the final evolutionary outcome.
2.5 Paramter settings
The previous section introduced the algorithms of game theory; now we will begin to set initial values for the relevant parameters of network initialization, representing their meanings and ranges.
1) Num—nodes: It represents the total number of nodes in the network, which is also the scale of the gaming group, and its value range varies slightly depending on the network;
2) Initial—cooperation: It represents the initial probability of cooperation, with a value range between 0% to 100%;
3) Defection—award: It represents the defection payoff, with a value range between 0 to 10;
4) In models with incentive mechanisms, there are also parameters for reward and punishment.
Table 2 displays the experimental parameters and their value ranges.
3 Topology reconstruction of railway internet of things based on cooperative benefits
3.1 Network state initialization
Initializing the network requires setting the network’s state information vector to the topological environmental state. The following description details how to convert the IoT topology structure into the corresponding environmental state vector, as shown in Figure 1. It is essential to reduce the storage space of the topology structure for large-scale topologies. First, the topology structure is converted into an adjacency matrix, an operation frequently used in other IoT applications. In this paper, by analyzing the network topology structure and optimization action operations, it is found that only network nodes within each other’s communication range can have a connection relationship. Therefore, information from other nodes within the node’s communication range is of significant value. As shown in Figure 1, node a’s upper triangular relationship is [1, 0, 0, 0], but since a is not within the communication range of c and d, the only effective position is b with [1]; similarly, node b has no connection with node d and node e, so its effective position is c with [1]; node c’s effective position is d with [1]; node d’s effective position is a with [1], and node d has no effective position because it only considers the upper triangular matrix. In summary, finally, the topology is linked in the order of the adjacency matrix numbers to form an environmental vector of [0, 1, 1, 1].

Figure 1. The state information vector of the network is transformed into the state of the topological environment.
3.2 Initialization of network edge weights
In the analysis of complex networks, the degree of a node plays a fundamental and crucial role. BA scale-free networks [17] typically exhibit scale-free characteristics, with a degree distribution that follows a power-law rule, indicating that most nodes in the network have only a few connections, while a small fraction of nodes have a large number of connections. In the context of cooperative and competitive relationships between nodes, the most important factor is the expected benefit of cooperation with neighbors. According to the clustering effect reflected in Ref. [18], it is known that the more neighbors a node has, the easier it is to form a cluster, so nodes with a higher degree may often generate better benefits over time. This paper assigns weights to each edge in the network by calculating the absolute difference in the expected benefits of node cooperation, thereby characterizing the similarity between nodes, and using the magnitude of edge weights to measure whether nodes have the conditions for reconnection, as shown in the following formula:
where
3.3 Edge selection strategy
To enhance the stability of the network, the strategy for selecting edges to swap is to disconnect edges with a large difference in expected benefits, while nodes with similar benefit values are more likely to connect with each other. The algorithm proposed in this paper assigns weights to each edge using Formula 3, and when selecting edges for reconnection, the decision is based on the weight of the edges. The probability of choosing two edges is directly proportional to the weight of the edges, following the rule as stated.
According to Formula 4, edges with larger weights have a higher probability of being selected, and these edges typically connect two nodes with a large deviation in benefit values. Therefore, the algorithm can quickly identify the edges with larger differences and then select the two edges with the highest edge weights (requiring at least four nodes and two edges for disconnection and reconnection), and reconnect their endpoints. This can eliminate the benefit gap and rapidly enhance the stability of the network.
3.4 Node homophily
Homophily can analyze and understand the connection preferences between nodes, which is the phenomenon that similar nodes tend to connect with each other. Connection preferences also stem from the attributes of nodes, such as routing frequency, bandwidth, climatic environment, antenna technology, etc. This can help designers optimize network structures and improve network efficiency and performance. According to Formula 5, prioritize the reconnection operation of four distinct nodes connected by two edges with larger weights. According to the benefit values, the four nodes are sorted in non-decreasing order, i.e.,
The homophily coefficient is an indicator that measures the similarity or difference in connections between nodes in a network. Choosing the reconnection method that results in the smallest change in the homophily coefficient can be considered optimal. The homophily coefficient reveals the preference for connections between nodes in the network. When nodes with higher connectivity in the network tend to connect with other nodes of similar connectivity, the network is referred to as a homophilous network. As shown in Formula 6.
where
Since the reconstruction mechanism in this paper does not change the degree values of the nodes during the reconnection process. Therefore,
From Formulas 6–8, it can be seen that
4 Experimental simulation
4.1 Reconstruction network statistical indicator test
The experiment is conducted using the python, where the network is modeled as a weighted graph and evolves according to the method by Nowak and May in reference [19]. This method places “agents” in a two-dimensional spatial array to explore the changing spatial patterns of nodes. In this paper’s experiment, the two-dimensional grid space is replaced with a more three-dimensional BA scale-free network. In the model, when a reward system is implemented to encourage cooperative behavior, the utility function of cooperators is enhanced, manifested as an additional reward, while the utility function of individuals adopting a defection strategy remains unchanged. Similarly, when the model adopts punitive measures to sanction defection, the utility function of defectors will suffer a loss, specifically reflected in the deduction of a fixed amount P as a penalty. In this case, the utility function of individuals choosing a cooperative strategy remains unchanged. The specific value is set to
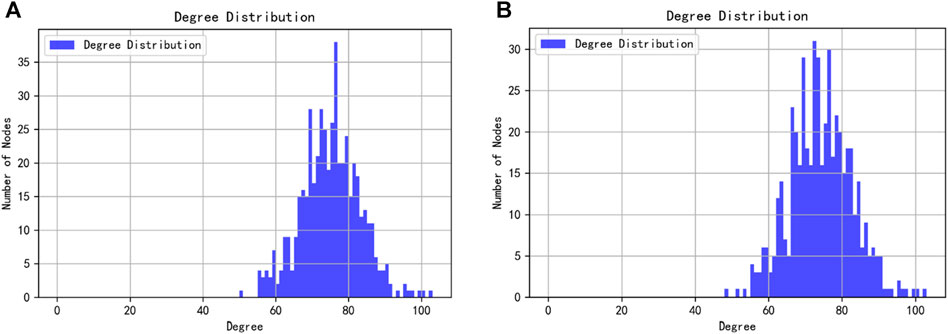
The degree distribution in a communication network describes the probability distribution of the number of connections (degree) of various nodes within the network, such as routers, switches, and terminal devices. This distribution influences the efficiency of communication within the network.
Through the simulation analysis of the optimization of complex network topological structures, the following basic conclusions can be drawn:
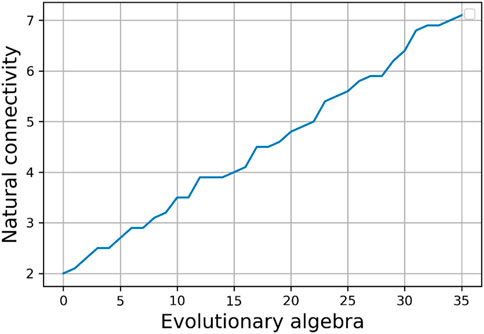
1) The simulation analysis has verified the effectiveness and feasibility of the complex network topology optimization model and the solution model. As the topological structure continues to be optimized, the natural connectivity value continuously increases, indicating that the network’s resilience to destruction is constantly strengthening.
2) By comparing the results of Figures 3A, B, it can be observed that the degree distribution of the network has changed after optimization, where nodes with high degree values and those with low degree values have gradually decreased, while nodes with a moderate degree (around 74) have significantly increased. This results in the entire network’s cooperation rate being in an optimal state, possibly because a very high degree value can lead to traffic congestion, which is not conducive to collective interests; too low a degree value can also affect the decrease in selfish benefits of individual entities. Therefore, the reconnection edge strategy in this paper serves as the best way to balance the interests of individuals and the collective.
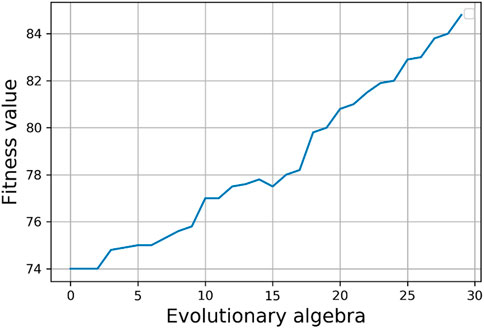
3) Analyzing the relationship between natural connectivity and the number of evolutionary generations, as well as the relationship between fitness values and the number of evolutionary generations, as depicted in Figures 4, 5, reveals a common pattern. It is evident that both of these metrics increase with the increase in the number of evolutionary generations. This suggests that nodes with higher degrees are more likely to form new connections with other nodes that also have high degrees.
4.2 Robustness analysis
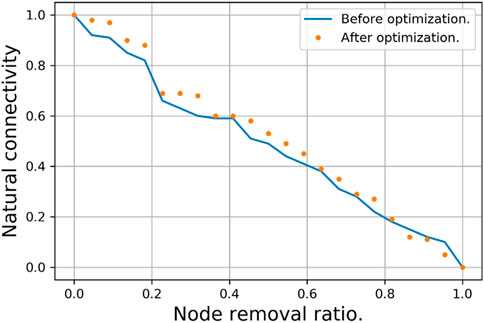
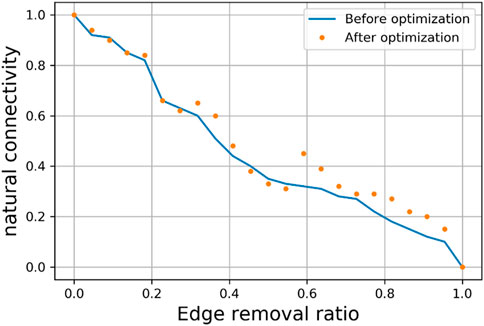
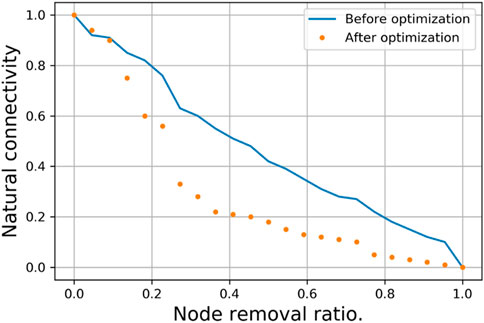
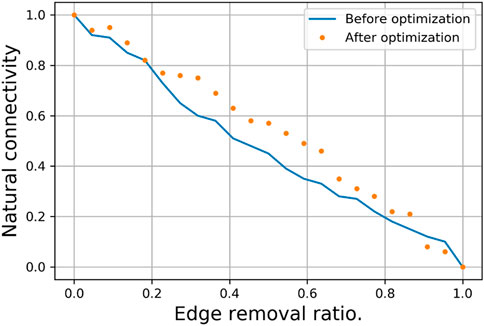
The purpose of complex network topology optimization is to enhance the network’s resilience. The analysis mentioned above establishes a topology optimization model using natural connectivity as a measure of network resilience, significantly improving the network’s resistance to destruction. Here, two types of strategies are adopted: random (node and edge removal) attacks and malicious (node and edge removal) attacks. These are implemented before and after the optimization of complex network topologies to analyze the changes in network resilience, as shown in Figures 6–9.
Through simulation analysis, it is known that complex network topologies before and after optimization exhibit the following characteristics when facing different attack strategies:
1) In the random node removal attack strategy (Figure 6), the optimized network’s resistance to attacks is higher than the resistance before optimization, mainly reflected in the slower decline in network resilience as the proportion of node removal increases. Analyzing the network’s topological structure, using the average degree as a dividing line, the proportion of nodes with low degrees in the optimized network increases, while the proportion of nodes with high degrees decreases. Therefore, under the random attack strategy, the average probability of low-degree nodes being attacked in the optimized network is higher than that of high-degree nodes, and the impact of low-degree nodes on network resilience is also smaller, thus demonstrating stronger resistance to attacks.
2) In the random edge removal attack strategy (Figure 7), the network’s resistance to attacks is similar before and after optimization, and it is only when the edge removal ratio exceeds approximately 0.6 that the optimized network’s resistance to attacks shows a slight improvement.
3) In the degree-based node removal attack strategy (see Figure 8), where nodes are removed in descending order of degree, the optimized network exhibits poorer resilience against this attack method. The removal of a small number (about 10%) of high-degree nodes leads to a significant decrease (about 40%) in network resilience, almost paralyzing the network; whereas the network before optimization demonstrates relatively stronger resilience against such attacks.
4) In the betweenness-based edge removal attack strategy (see Figure 9), where edges are removed in order of their betweenness centrality, the optimized network shows relatively stronger resilience against this attack method. The removal of a minority (about 20%) of edges with high betweenness has a limited impact on network resilience. The analysis attributes this to the tendency of low-degree nodes in the optimized network to connect with high-degree nodes, which results in the edges connecting high-degree nodes also having relatively high betweenness, thus the edges have stronger redundancy. Conversely, for the network structure before optimization, the situation is the opposite.
This paper considers attack strategies, which belong to the dynamic optimization of network topological structures. The optimized network has enhanced resilience against node removal attacks.
5 Conclusion
This paper introduces a rewiring strategy based on node game payoff, which assigns initial cooperation rates to nodes through cooperative game play, and adjusts cooperation benefits during dynamic interactions. It introduces reward and punishment mechanisms to achieve average payoff. In this process, each network node not only makes decisions based on its own payoff but also considers the collective intelligence synergy of the entire network to achieve overall optimization. Building on this, the paper uses the average payoff between nodes for rewiring and evaluates the rewiring effect with the collective cooperation rate. The experimental results show that the optimization algorithm proposed in this paper performs better in terms of the proportion of nodes in natural connectivity and robustness indicators when subjected to attacks such as random node attacks, random edge attacks, degree centrality attacks, and betweenness centrality attacks on the multi-layer network topology of the Internet of Things (IoT) in the railway sector. It is also found that the network exhibits poor resistance to attacks when facing degree-based node removal attacks. Therefore, in practical applications, it is necessary to choose different network topological structures based on the specific real threats faced. In conclusion, the research findings of this paper provide a reference for achieving rapid networking, efficient transmission, and secure and stable operation of communication in the IoT for the railway sector.
Data availability statement
The original contributions presented in the study are included in the article/supplementary material, further inquiries can be directed to the corresponding author.
Author contributions
FW: Formal Analysis, Methodology, Software, Validation, Writing–original draft, Writing–review and editing. KS: Investigation, Methodology, Software, Validation, Writing–original draft, Writing–review and editing. BL: Conceptualization, Funding acquisition, Investigation, Writing–review and editing. JY: Conceptualization, Supervision, Validation, Writing–review and editing. WB: Software, Supervision, Validation, Writing–original draft, Writing–review and editing.
Funding
The author(s) declare that financial support was received for the research, authorship, and/or publication of this article. This paper Supported by the Scientific Funding for China Academy of Railway Sciences-Corporation Limited (Nos 2023YJ125 and 2021YJ183), China Postdoctoral Science Foundation (No. 2021M692400), Fundamental Research Program of Shanxi Province (No. 202203021221017), the special fund for Science and Technology Innovation Teams of Shanxi Province (No. 202204051002015), and Key Laboratory of Complex Systems and Data Science of Ministry of Education. The funder was not involved in the study design, collection, analysis, interpretation of data, the writing of this article, or the decision to submit it for publication.
Conflict of interest
Authors BL, JY, and WB were employed by China Academy of Railway Sciences Company Ltd.
The remaining authors declare that the research was conducted in the absence of any commercial or financial relationships that could be construed as a potential conflict of interest.
Publisher’s note
All claims expressed in this article are solely those of the authors and do not necessarily represent those of their affiliated organizations, or those of the publisher, the editors and the reviewers. Any product that may be evaluated in this article, or claim that may be made by its manufacturer, is not guaranteed or endorsed by the publisher.
References
1. Skouby KE, Lynggaard P. Smart home and smart city solutions enabled by 5G, IoT, AAI and CoT services. In: International conference on contemporary computing and informatics (IC3I) (2014). p. 874–8.
2. Varma PS, Anand V. Intelligent scanning period dilation based Wi-Fi fingerprinting for energy efficient indoor positioning in IoT applications. J supercomputing (2023) 79:7736–61. doi:10.1007/s11227-022-04980-9
3. Yang Y, Zhou W, Zhao SR. Survey of IoT security research: threats, detection and defense. J Commun (2021) 42(8):188–205. doi:10.11959/j.issn.1000-436x.2021124
4. Nie Y, Li J, Liu G, Zhou P. Cascading failure-based reliability assessment for post-seismic performance of highway bridge network. Reliability Eng Syst Saf (2023) 238:109457. doi:10.1016/j.ress.2023.109457
5. Hilal AM, Alohali MA, Al-Wesabi FN, Nemri N, Alyamani HJ, Gupta D. Enhancing quality of experience in mobile edge computing using deep learning based data offloading and cyberattack detection technique. Cluster Comput (2023) 26:59–70. doi:10.1007/s10586-021-03401-5
6. Stiawan D, Wahyudi D, Septian TW. The development of an Internet of Things (IoT) network traffic dataset with simulated attack data. J Internet Tech (2023) 24:345–56. doi:10.53106/160792642023032402013
7. Dilek GF, Salman FS. Assessing the reliability and the expected performance of a network under disaster risk. OR Spectr quantitative approaches Manag (2011) 33(3):499–523. doi:10.1007/s00291-011-0250-7
8. Bródka P, Musial K, Jankowski J. Interacting spreading processes in multilayer networks: a Systematic Review. IEEE Access (2020) 8:10316–41. doi:10.1109/access.2020.2965547
9. Jalili M, Orouskhani Y, Asgari M, Alipourfard N, Perc M. Link prediction in multiplex online social networks. R Soc Open Sci (2017) 4(2):160863. doi:10.1098/rsos.160863
10. Albert R, Jeong H, Barabasi A. Error and attack tolerance of complex networks. Nature (2000) 406(6794):378–82. doi:10.1038/35019019
12. Qiu T, Liu J, Si W, Wu DO. Robustness optimization scheme with multi population co-evolution for scale-free wireless sensor networks. IEEE/ACM Trans Networking (2019) 27:1028–42. doi:10.1109/tnet.2019.2907243
13. Zhao T, Si W, Li W, Zomaya AY. Optimizing the maximum vertex coverage attacks under knapsack constraint. IEEE/ACM Trans Networking (2021) 29(3):1088–104. doi:10.1109/tnet.2021.3056450
14. Qiu T, Zhao A, Xia F, Si W, Wu DO. ROSE: robustness strategy for scale-free wireless sensor networks. IEEE/ACM Trans Networking (2017) 25:2944–59. doi:10.1109/tnet.2017.2713530
15. Mateev V, Marinova I. Modified chromosome pooling genetic algorithm for resource allocation optimization. AIP Conf Proc (2023) 2939(1). doi:10.1063/5.0178510
16. Rong L, Liu J. A heuristic algorithm for enhancing the robustness of scale-free networks based on edge classification. Physica A: Stat Mech its Appl (2018) 503:503–15. doi:10.1016/j.physa.2018.02.173
17. Vázquez A, Moreno Y. Resilience to damage of graphs with degree correlations. Phys Rev E (2003) 67(1):015101. doi:10.1103/physreve.67.015101
18. Wang Y, Wang BH. Evolution of cooperation on spatial network with limited resource. PLoS ONE (2015) 10(8):e0136295. doi:10.1371/journal.pone.0136295
Keywords: railway internet of things, cooperative game, topology reconstruction, network resilience, optimization strategy
Citation: Wang F, Su K, Liang B, Yao J and Bai W (2024) Research on multi-layer network topology optimization strategy for railway internet of things based on game theory benefits. Front. Phys. 12:1409427. doi: 10.3389/fphy.2024.1409427
Received: 30 March 2024; Accepted: 25 April 2024;
Published: 28 May 2024.
Edited by:
Dun Han, Jiangsu University, ChinaReviewed by:
Dawei Zhang, Shandong University, ChinaHaitao Xu, University of Science and Technology Beijing, China
Copyright © 2024 Wang, Su, Liang, Yao and Bai. This is an open-access article distributed under the terms of the Creative Commons Attribution License (CC BY). The use, distribution or reproduction in other forums is permitted, provided the original author(s) and the copyright owner(s) are credited and that the original publication in this journal is cited, in accordance with accepted academic practice. No use, distribution or reproduction is permitted which does not comply with these terms.
*Correspondence: Bo Liang, Ym9fbGlhbmcyMDE2QDEyNi5jb20=
†These authors share first authorship
 Fang Wang1†
 Bo Liang
 Wei Bai

