 I. Kudashev1*
 M. Scotto d’Abusco1,2
 A. Glasser1
 E. Serre1
 F. Schwander1H. Bufferand3
 G. Ciraolo3
 P. Ghendrih3P. Tamain3
- 1Aix Marseille Univ, CNRS, Centrale Med, M2P2, Marseille, France
- 2Princeton Plasma Physics Laboratory, Princeton, NJ, United States
- 3IRFM, CEA Cadarache, Saint-Paul-Lez-Durance, France
This paper deals with the distribution of sources, transport, and exhaust of particles in a tokamak. Knowledge and understanding of all the physical phenomena involved in the global particle buildup are necessary to study and predict density regimes and subsequently to develop optimized scenarios for tokamak operation in order to control heat and particle exhaust. Neutral particles and their interactions with plasma are central in this perspective. This paper discusses the impact of varying the intensity of particle fueling in 2D transport simulations of a WEST discharge. Simulations are performed with an updated version of SOLEDGE-HDG that allows a more realistic transport of neutrals using a self-consistent diffusive model based on charge exchange and ionization processes. New code capabilities allow the entire WEST poloidal cross section to be simulated in a realistic configuration for both geometry and the range of control parameters. A gas puff scan illustrates the main features of the sheath-limited, high-recycling, and detached regimes, such as the buildup of the temperature gradient and the pressure drop in the scrape-off layer (SOL), the target temperature falling to 1 eV, and the ionization source moving away from the targets, as well as the particle flux rollover. A crude estimate of wall erosion is also provided, showing the respective role of each plasma wall component in each of these regimes.
1 Introduction
With targeted self-sustained burning plasmas in ITER [1], the issue of power exhaust and the control of heat fluxes onto the tokamak walls in high-energy confinement configurations remains critical to successfully run future ITER experiments [2]. This calls for the design of scenarios in ITER that are able to mitigate heat fluxes on the dedicated wall components [3]. Since the mid-1990s, reduced divertor heat flux scenarios have been successfully carried out in experiments, reducing the peak power and erosion of divertor components to an acceptable level. They are mostly based on highly dissipative boundary plasmas in divertor tokamaks where divertor radiation is significantly increased through additional gas fueling to raise the density and lower divertor plasma temperature (see results of some of the initial experiments in, for example, JET [4], ASDEX-Upgrade [5], and DIII-D [6]). These divertor plasmas were labeled as “detached” because the primary plasma boundary interaction moved upstream off the divertor target surface. Other attempts were also based on a stochastic boundary, as proposed, for example, in Tore Supra [7]. In the latter, the ergodic divertor configuration demonstrated the capability to control energy and particle deposition while providing both screening of impurities and stable radiating layers.
In order to prepare for the successful operation of ITER, the design of these optimized operations and the prediction of the power load at the wall still require an improvement in our understanding of the mechanisms involved, resulting from the complex interaction of transport processes in the plasma, losses at the wall, and complex atomic and molecular interactions. Together with experimental measurements and theoretical modeling, numerical codes have become powerful interpretation tools for current tokamak operation, with the longer-term objective of becoming predictive. A chain of models is being developed, ranging from simplified models for optimization and uncertainty propagation to state-of-the-art, first principal models of plasma turbulence transport in relevant plasma conditions. As mentioned recently in the review article by Schwander et al. [8], transport codes based on reduced fluid models—in which the turbulence has been smoothed by averaging—remain the current workhorse of physicists, particularly in studies closely linked to operational aspects, aiming to explore and design optimal scenarios for reactor performance. Some of the state-of-the-art transport codes widely used in the community are EDGE2D-EIRENE [9, 10], EMC3-EIRENE [11], SOLEDGE3X-EIRENE [12], SOLPS-ITER [13], and UEDGE-DEGAS2 [14, 15]. It should be highlighted, however, that significant physics can be lost from the model reduction. This, in particular, concerns both cross-field transport, which has proven not to be able to be described convectively [16], and the interaction between fluctuating plasma fields and neutrals [17, 18].
One of the key ingredients in high-fidelity plasma simulations is understanding the global particle buildup, which requires knowledge of the distribution of sources, transport, and exhaust of particles. Neutral particles and their interaction with the ionized species are, therefore, central. The volumetric losses of momentum and energy associated with their recycling back into plasma are the main drivers for accessing the detached conditions mentioned above. Experimental evidence demonstrates an impact of density regimes on the transverse plasma transport, which might, in turn, influence the access to detachment and its stability [19]. These effects can be modeled using averaged plasma and neutral fluid fields. However, employing such an approach hides interactions between blobs and neutrals, which may lead to overestimating density fluxes across the last closed flux surface (LCFS) [20]. The influence of the blobs on the plasma sources is extensively studied in 2D slab turbulent simulations performed by the HESEL group [18, 21, 22]. A more accurate way to simulate neutral transport is based on a Monte Carlo algorithm and is widely used by coupling transport solvers with EIRENE [10] and DEGAS2 [15]. This method generally introduces statistical noise that deteriorates the convergence of the plasma solver and is also computationally expensive, especially in highly collisional regions such as the divertor. The described issues are partially dealt with in [21] by considering neutral-plasma interactions stochastically, while transport of neutrals deterministically with an extensive parallelization of the code and additional smoothening of the sources. Nonetheless, the fluid approach remains attractive with varying degrees of refinement, being fully deterministic and reducing the real computational time. Despite its relative simplicity, the latter can provide a good approximation of the plasma source generated by recycling and the radiation power losses in the divertor, as shown in recent transport studies [23, 24].
The resolution of the conservation equations for mean plasma quantities remains particularly challenging and stressful for the numerical methods. The marked anisotropy linked to the strong magnetization of the plasma in the tokamak and the complex geometry of both the tokamak wall and magnetic equilibrium remain important issues that limit the capabilities of many solvers. As an attempt to solve all these issues, we have been developing SOLEDGE-HDG [25] in the SOLEDGE suite of codes for transport simulations. This code is based on high-order finite elements, where the entire plasma volume, including the core and the scrape-off layer (SOL) plasma up to the wall, is meshed with triangles. This discretization allows the mesh to be magnetic equilibrium free. In addition, a combination with an implicit time integrator using Newton–Raphson iterations allows fast convergence of the code towards plasma equilibrium, enabling parametric studies to be carried out at reasonable computational cost.
This paper deals with the distribution of sources, transport, and exhaust of particles in WEST [26] using SOLEDGE-HDG simulations. These latter are performed with an updated version of the code, which allows a more realistic transport of neutrals using a self-consistent diffusive model based on charge-exchange and ionization processes inspired by [27, 28] and already implemented into SOLPS-ITER [29]. Unlike the state-of-the-art plasma fluid codes mentioned above, which are usually based on the magnetic-field-aligned approach, the SOLEDGE-HDG numerical scheme and mesh are well suited to dealing with neutrals, whose transport is non-aligned with the magnetic field and provide an accurate description of the tokamak wall, with a detailed description of the gas puff region in particular. For example, in the recent work in SOLPS-ITER [29], fluid neutrals require mesh simplification even for the “extended grid” version of the code.
The paper is organized as follows. Section 3 presents the computational domain, describing the complete poloidal cross section of the realistic geometry of the WEST tokamak. In Section 4, the mathematical model is introduced, focusing on the updated fluid neutral model with a self-consistent diffusion based on charge-exchange and ionization processes. A comparison with the former model with constant diffusion is made in Section 5. A gas puff scan illustrates how the main features of the sheath-limited, high-recycling, and detached regimes are recovered in Section 6. Finally, Section 7 concludes the paper and provides some interesting perspectives on this work.
2 A realistic WEST tokamak geometry
The 2D computational domain corresponds to the entire plasma volume in the WEST poloidal cross section, going from the core up to the wall, as shown in Figure 1, and providing a realistic geometrical description.
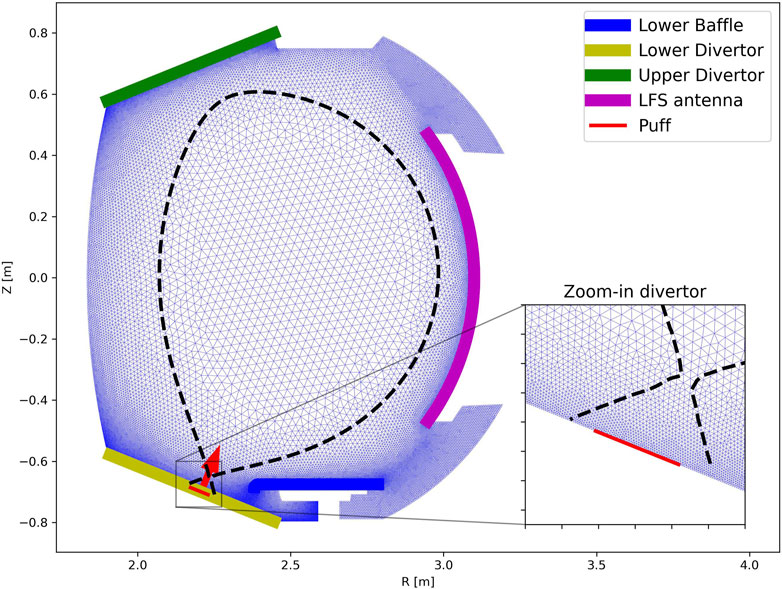
Figure 1. Poloidal cross section of the WEST tokamak operated at CEA-IRFM. The various plasma-facing components are shown with thick colored lines. The puff (red) region is shown with a thin line and an arrow. The separatrix location for the t = 4.73 s of shot #54487 is shown as a dashed black line. The zoomed-in lower divertor mesh is shown in the inset figure. Triangles of a typical mesh show the capability of the numerical scheme to discretize the entire plasma domain.
The axisymmetric equilibrium magnetic field
The strong difference of intensity between the toroidal and poloidal components
3 SOLEDGE-HDG mathematical model
The model is based on the 2D drift-reduced Braginskii conservative fluid equations for a deuterium plasma introduced in [25]. These equations are listed in Supplementary Appendix A together with the boundary conditions in Supplementary Appendix B for the sake of completeness of the paper.
3.1 A self-consistent neutrals diffusion model
The equation representing the neutral density
with a non-uniform diffusion coefficient
where
where
This fluid modeling is theoretically limited to highly collisional, charge-exchange-dominated plasma regions (i.e., divertor targets). Therefore,
The two free parameters in Eq. 4
The model is associated with an appropriate boundary condition at the plasma-facing components that takes into account recycling onto the walls and also includes a puff term in the private flux region (PFR) (Figure 1). The following boundary condition is imposed:
where
where
3.2 Temperature and density-dependent atomic processes: data sources and implications
Only deuterium is considered in this work, both as plasma ions and neutrals. Even in such a simplified model, the choice of atomic data is crucial for the quality of the obtained solutions. They atomic processes define the interactions between plasma and neutrals as well as radiation processes, hence governing the sources and sinks of particles, energy, and momentum in the system. 1D and 2D atomic data are currently available in the code to determine the charge exchange, ionization, and recombination rate coefficients.
For the ionization and recombination rate coefficients, 1D and 2D expressions are respectively extracted from the Naval Research Laboratory (NRL) Plasma formulary in [30] and from the AMJUEL database [32], such as the following:
- 1D expressions of the ionization and recombination rates are functions of the electron temperature only and are expressed as follows [30]:
with
- 2D expressions use splines in log-log space and write in a generalized form [32]:
where
The introduction of 2D atomic data splines can introduce some issues on the numerical stability of the solution. Furthermore, atomic data are only defined over a given range of temperatures and electron densities, whilst values outside these ranges can be encountered in simulations, making it necessary to extrapolate the atomic data. Thus, for the electron density, atomic rates are assumed to be constant for
An approximation of OpenADAS [31] thermal charge-exchange rates from adf11 files is used for charge-exchange rate coefficients because neutrals are assumed to be thermalized. As in Eq. 9, a similar spline of the given atomic data is made but for the electron temperature only, such as
with
Comparisons of the evolution of the ionization, charge-exchange, and recombination atomic rate coefficients using 1D and 2D expressions as a function of electron temperature are shown in Figure 2 for different values of density. The rate coefficients computed from the NRL expressions (magenta lines for both ionization and recombination rates in Figure 2) are similar to those obtained using data from AMJUEL 2.1.5JH for ionization and from AMJUEL 2.1.8a for recombination. As a consequence, in problems where three-body recombination is not of interest, NRL atomic data will be preferred because of their lower computational cost. However, in low-temperature and high-density regions like the divertor region, three-body recombination becomes crucial, and the AMJUEL database must be preferred. Figure 2B shows the large difference between NRL and AMJUEL predictions for
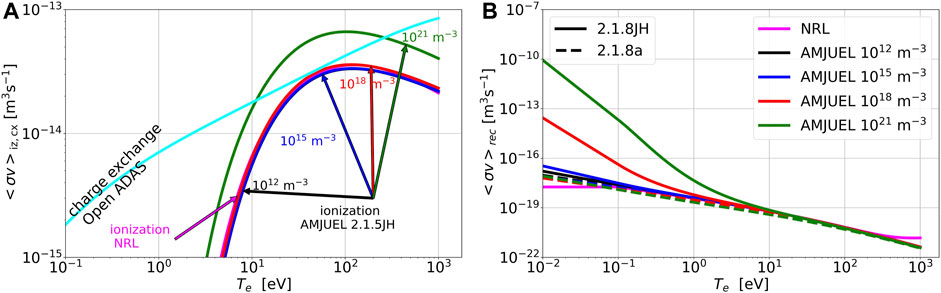
Figure 2. Comparisons of ionization and charge-exchange (A) and recombination (B) atomic rate evolutions as a function of electron temperature for different values of density. (A) Ionization rates from NRL [30] (Eq. 7) and AMJUEL 2.1.5JH [32] (Eq. 9) and charge-exchange atomic rates from OpenADAS [31] (Eq. 10). (B) Recombination atomic rates from NRL [30] (Eq. 8) and AMJUEL 2.1.8JH and 2.1.8a [32] (Eq. 10).
3.2.1 Neutral diffusion model validity
With the given charge-exchange and ionization atomic rate coefficients, we can now estimate the neutrals’ mean free path dependency on plasma density and temperature from Eqs 2, 3. For simplicity, we assume here
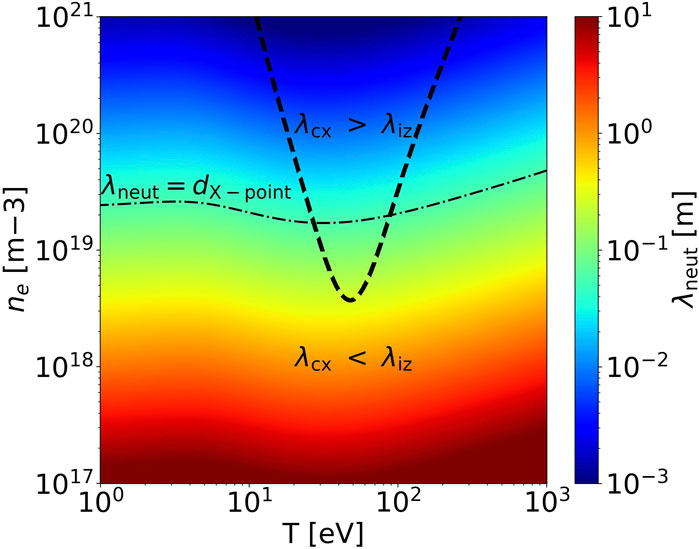
Figure 3. Mean free path of neutrals
We also neglect the impact of molecules in the model; that is, we suppose that neutral deuterium enters the computational domain in the form of atoms. Although this simplification might be important in the case of puff located in the far SOL [17], in this work, this is believed to have a smaller impact because the source of neutral particles is close to the strike points in the private flux region (Figure 1). In addition, for all simulations considered in this work, the total particle source due to recycling was 2–3 orders of magnitude higher than the puff rate. In addition, the front of the charge-exchange rate in most simulations, except for the lowest density one, was located in the vicinity of the strike points. This also supports the validity of the assumption of thermalized neutrals. Moreover, the total charge-exchange source was generally higher than the recycling one by 5%–30% for lower and average puff rates, reaching about an order of magnitude larger value for the most detached simulation considered further.
Therefore, we can state here that the employed neutral model assumptions hold rather well in the discussed simulation range, being most applicable for the highest density, charge-exchange dominant regimes, which also correspond to the hypothesis assumed in [27]. Readers interested in a more general discussion of the validity of neutral fluid models may refer to the recent publication by Kvist et al. [21], which also provides a good overview of state-of-the-art neutral fluid models.
3.3 Numerical and simulation setup
3.3.1 Numerical setup
The equations introduced in Supplementary Appendix A, together with the neutral model described in Section 3.1, are resolved using the high-order finite-elements code SOLEDGE-HDG [25, 33]. The space discretization is based on the hybrid discontinuous Galerkin method on an unstructured triangle mesh, as shown in Figure 1. It is composed of approximately 80,000 triangular elements with interpolation polynomial of degree
3.3.2 Magnetic equilibrium and plasma current reconstruction
Given that the experimental magnetic equilibrium is reconstructed using a simplified rectangular grid, it has significant numerical artifacts (i.e., non-zero magnetic field divergence or noise at the edge of the computational domain). These artifacts necessitate post-processing to adapt the equilibrium for utilization on the refined mesh required by the simulations.
The 2D profile of the poloidal flux is approximated employing a bi-variate cubic spline with a small smoothing factor chosen to reasonably damp out spurious irregularities in the magnetic field at the wall. Using the given spline, the poloidal component of the magnetic field is thus calculated according to [34] as
where
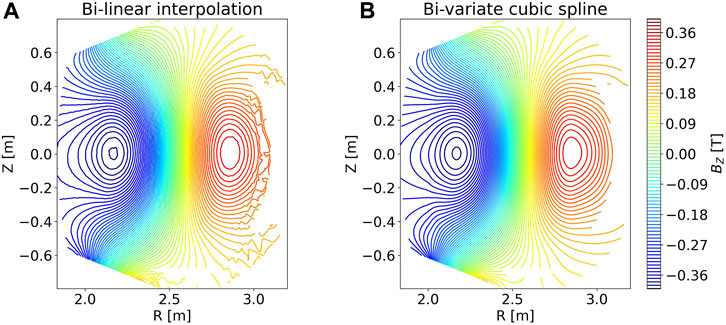
Figure 4. Comparison of the magnetic field component
3.3.3 Simulation setup
In the simulations, the gas valve is located in the private flux region of the lower divertor; see Figure 1.
4 Impact of a non-constant neutral diffusion on neutral transport and plasma equilibrium
Simulations are performed here with a constant gas puff of
The self-consistently determined
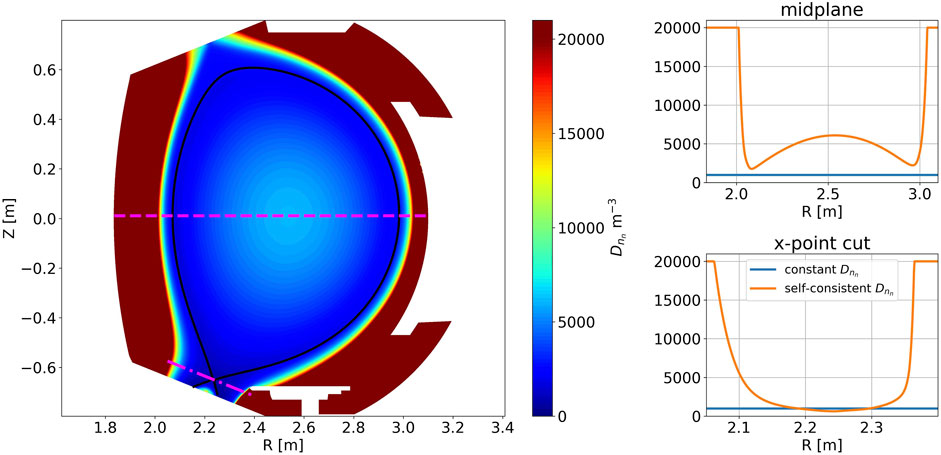
Figure 5. 2D poloidal map of the non-constant neutral diffusion
This is supported by the estimations of the mean free paths of neutrals
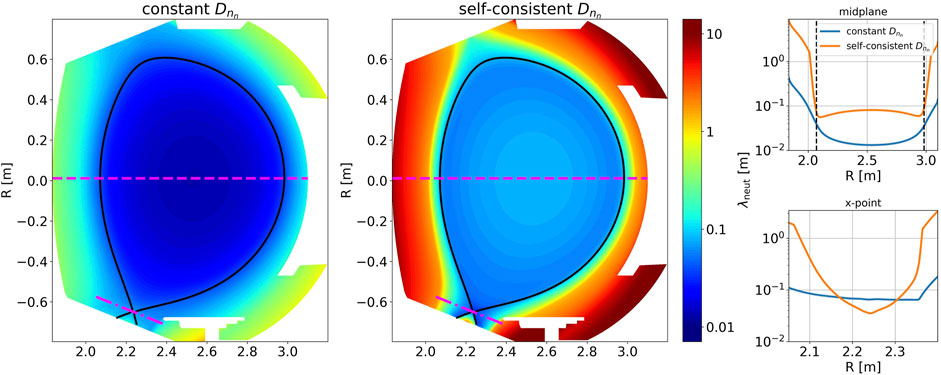
Figure 6. 2D poloidal map of the neutral mean free path as defined from
At the same time, with a non-constant
As expected, these changes in the transport of neutrals impact their distribution in the whole cross section, as shown by the 2D poloidal map of neutral density
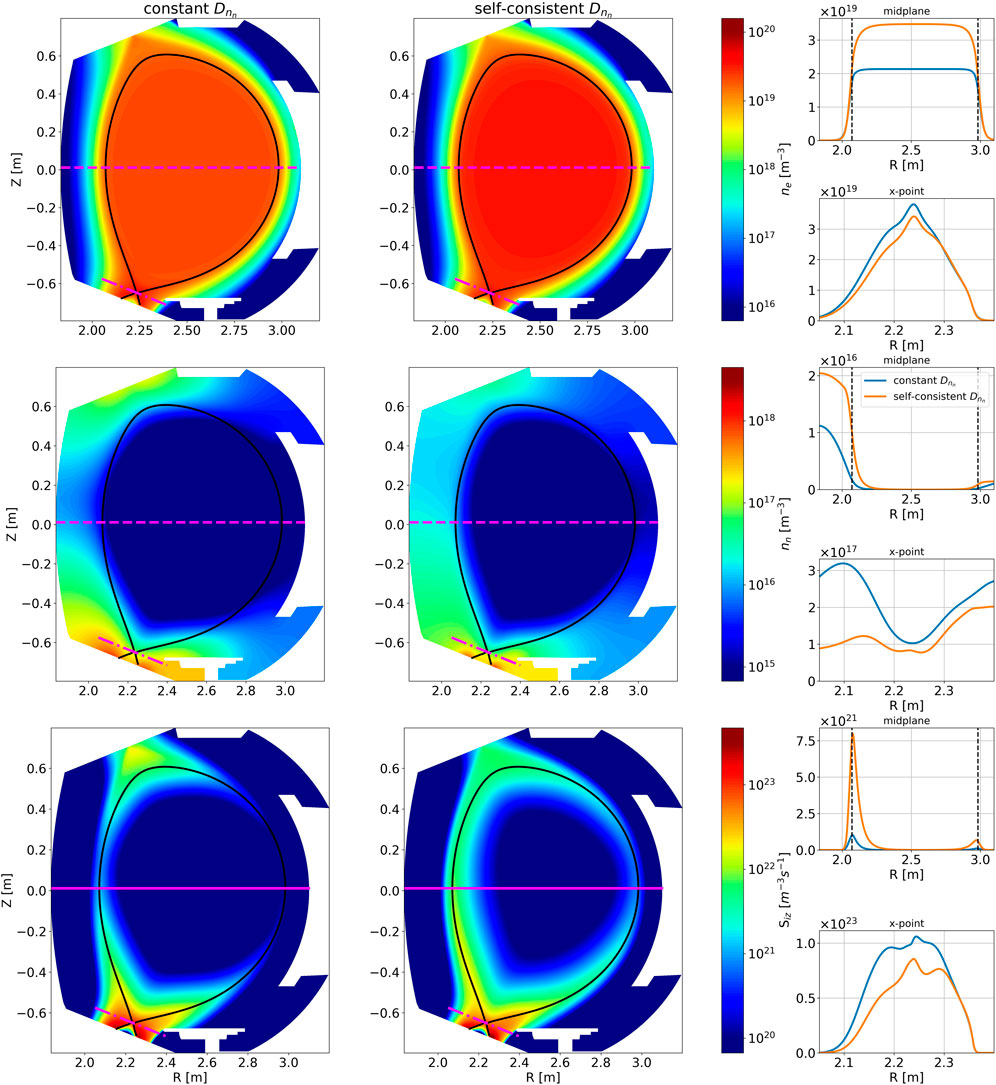
Figure 7. Comparison of solutions with constant (
This is qualitatively similar to what can be observed using a more sophisticated kinetic approach in the Monte Carlo solver EIRENE [38], as shown, for example, in recent SOLEDGE3X-EIRENE simulations (Figure 10 in [39]).
As mentioned above, the higher propagation of neutrals from the walls into the core with the non-constant
Therefore, with non-constant
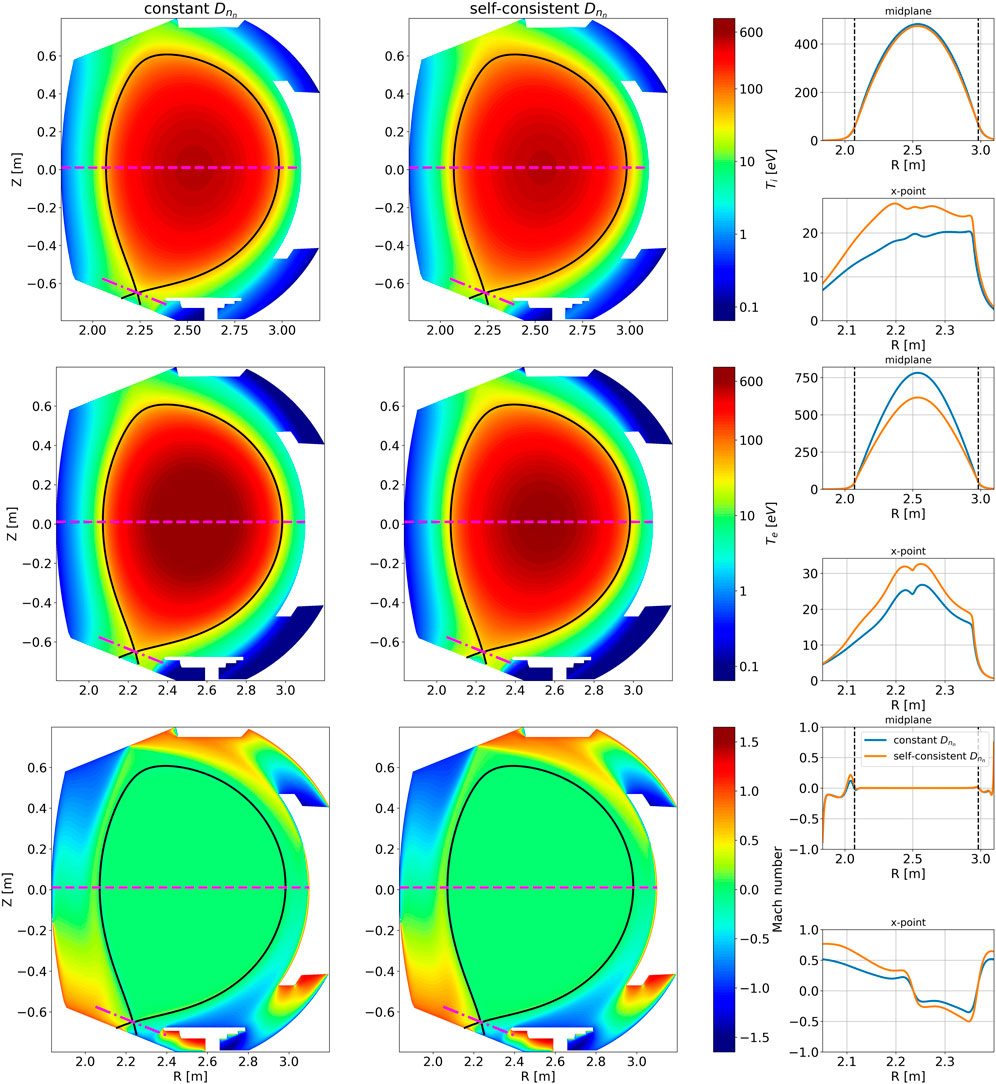
Figure 8. Comparison of solutions with constant (
In summary, this new modeling of neutral transport with self-consistent diffusion removes
5 Gas puff scan
In this section, we describe a gas puff scan investigation, which has been conducted in order to cover all major plasma regimes [36], that is, sheath-limited, high-recycling, and detached. The gas puff rates are varied from
It must be noted that these values of puff rates are at least two orders of magnitude lower than the recycled neutral flux from the wall. Moreover, the change of puff modifies the magnitude of the heat source because the plasma current profile remains the same, while the plasma resistivity has been calculated self-consistently (Supplementary Appendix Equation S7). The increase of the Ohmic heating power with puff rate reaches about 50% of the initial value, varying between 1 MW and 1.5 MW.
We also should underline that this pure puff scan only exists in numerical simulations because changes in the plasma regime will inevitably lead to the modification of the cross-field transport of plasma. Moreover, in real experiments, it is known that transport is not constant across the poloidal cross section; it is usually enhanced at the LFS by interchange instability [40]. Although the work on implementing the self-consistent turbulent model to cover these phenomena is ongoing, it lies beyond the scope of the paper. On top of that, such “isolation” of the pure puff scan effect is an interesting feature, allowing a separate impact on plasma equilibrium due to different drivers.
5.1 Impact of the gas puff on the plasma equilibrium
The evolution of plasma and neutral quantities with gas puff rates is shown in Figures 9, 10. These simulations are representative of sheath-limited, high-recycling, and detached plasma regimes.
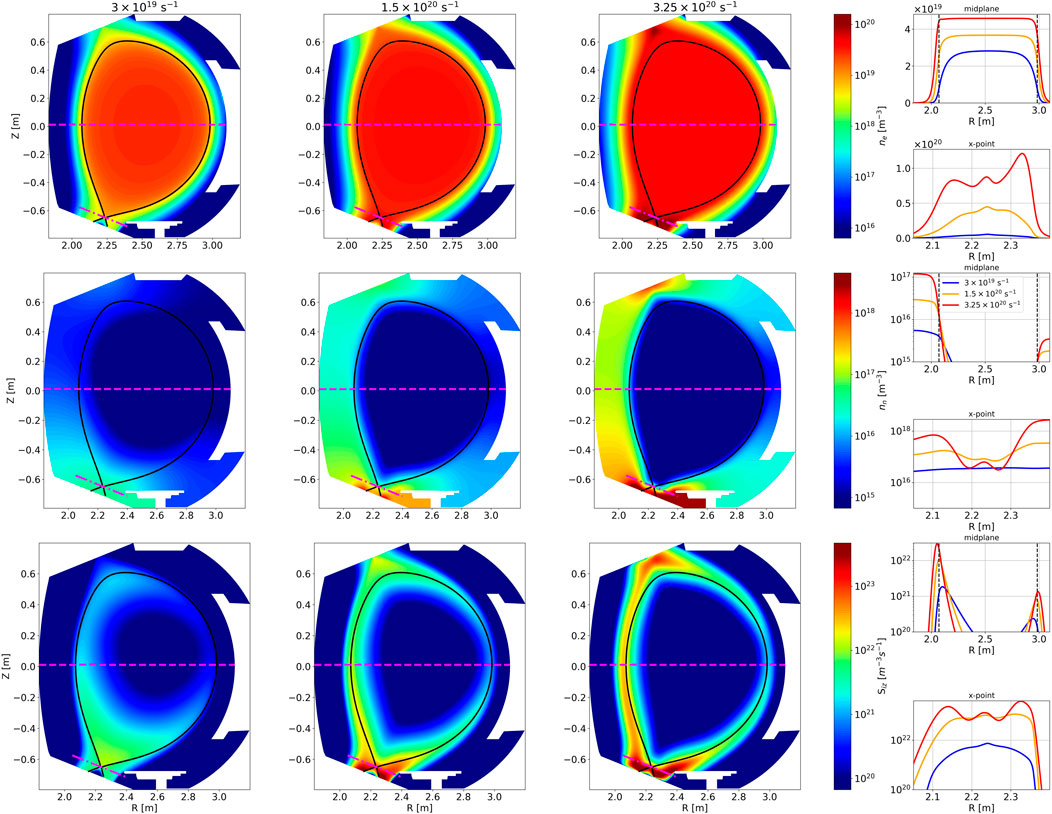
Figure 9. Evolution of plasma equilibrium with gas puff rates (
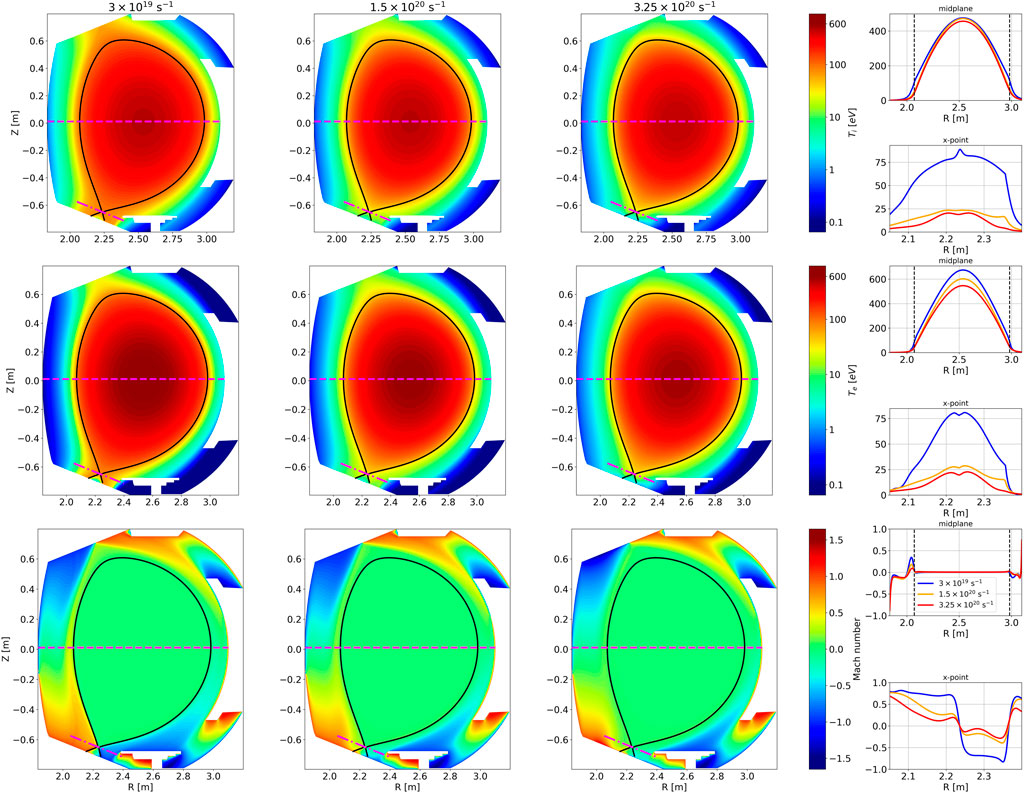
Figure 10. Evolution of plasma equilibrium with gas puff rates (
5.1.1 Plasma density distribution
As expected, the increase in puff rate leads to the global increase of particle content of the plasma (Figure 9 (top row)). Moreover, the density distribution in the poloidal cross section is modified: the larger the puff, the higher the density of the plasma in the SOL, and the greater its propagation towards the wall. The most significant change can be observed in the divertor region. This is particularly evident on the density profiles at the midplane and through the X-point: while the core density increases by less than two times, the density in the vicinity of the X-point rises by more than an order of magnitude.
5.1.2 Neutral distribution
The changes observed on the plasma density profile are caused by changes in the distribution of the ionization source (Figure 9, bottom row). Indeed, at the lowest puff rate, the neutrals are mainly ionized inside the core, whereas as the puff rate increases, the ionization region becomes increasingly narrow around the separatrix and also expands into the SOL. Note that at the highest puff rate, the ionization front is no longer located at the lower divertor target but has moved slightly upstream, which may be one of the features of detachment. The effects described above are also reflected in the neutral density distribution (Figure 9 (middle row)): at the lowest puff rate (
5.1.3 Temperature distribution
Important qualitative changes are also observed in the temperature distribution (Figure 10 (top and middle rows)). As the density of the core increases with the puff,
5.1.4 Mach number distribution
The Mach number is only slightly affected globally by the increase in puff rates except in the vicinity of the X-point into the SOL (Figure 10 (bottom row)). Indeed, profiles at midplane remain almost unchanged, while changes are more significant through the X-point. The Mach number is high for the lowest puff plasma, meaning that a significant part of energy flux is driven by convection. It drops below 0.5 in absolute value for the highest puff case and only reaches 1 at the boundary, according to the Bohm boundary conditions.
All these features suggest that the simulation at the lowest puff corresponds to a sheath-limited regime, characterized by high temperatures in the lower divertor region (peak values of approximately 70 eV) and almost no temperature change between the midplane and the targets, while the simulation at the highest puff corresponds to a detached regime, characterized by low temperatures at the divertor target (peak values of approximately 1 eV) and a significant change between the midplane and the targets. Section 5.2 will focus on the lower divertor target, and detailed comparisons between core, separatrix, and target peak values will be made in Section 5.4.
5.1.5 Neutrals mean free path distribution
The evolution with gas puff is plotted in Figure 11 (top row). For the lowest density case, the mfp of the neutrals does not fall lower than 10 cm in the whole plasma domain and not lower than
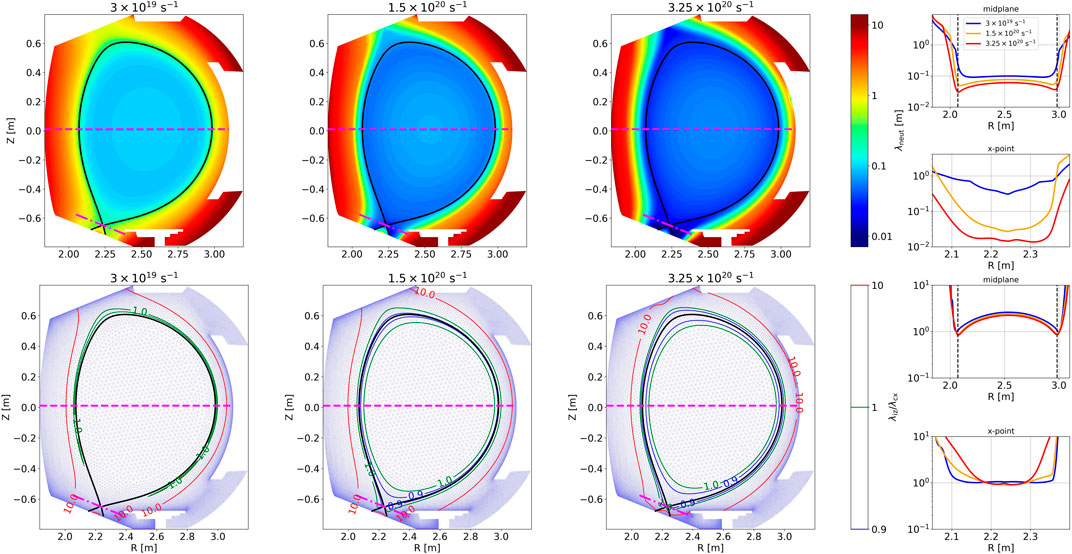
Figure 11. Top line: 2D poloidal map of neutral mean free path as defined by equation Eq. 2 for a simulation with constant low (left) average (middle) and high (right) puff rates. Bottom line: contour plot of the ratio
The bottom row of Figure 11 demonstrates that in most parts of the computational domain, the ionization mfp is larger than the charge-exchange mfp. This is only slightly violated in the vicinity of the LCFS when expanding this region for higher puff-rate simulations. However, one can see that
5.2 Plasma quantities at the divertor targets
The evolution of plasma quantities at the divertor targets as a function of gas puff rates (
5.2.1 Impact on density and temperatures
The profiles in Figure 12 (top row) show that the solutions evolve from a highly attached plasma with temperatures
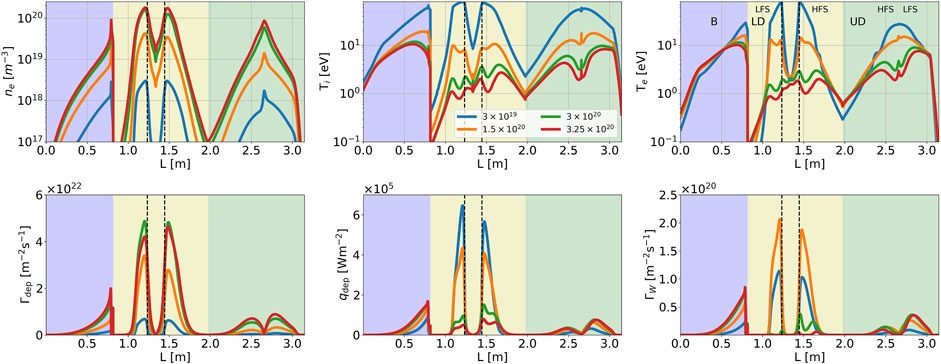
Figure 12. Comparisons of plasma quantity profiles along the tokamak wall for four values of the gas puff rates:
5.2.2 Impact on heat flux
The heat flux at the targets (shown in Figure 12, bottom center) begins to decrease when the puff is increased from
5.2.3 Impact on particle flux
Figure 12 (bottom left) shows the particle flux at the targets monotonously increases with the puff rate up to
As predicted from theory and demonstrated in the experiments [36], one would expect a faster detachment onset at the inner leg of the divertor. However, due to the proximity of the baffle from the X-point and the LCFS, there are more neutrals near the outer leg (Figure 9, middle row), which leads to more power and momentum losses due to charge exchange, with a corresponding reduction of target temperatures (Figure 12 top row: center
5.3 Impact on the estimated flux of sputtered tungsten
Modeling the material erosion of PFCs depending on plasma conditions is a long-term effort that remains very challenging in fluid transport codes, but it is crucial to target realistic predictions on plasma evolution and fusion performances. A reasonably accurate modeling of this phenomenon can be provided by a dedicated code such as ERO2.0 [41], which can be coupled with SOLEDGE-HDG as proposed in [42]. However, this approach remains computationally expensive, and when only the overall behavior of the wall depending on plasma conditions is of interest, analytical expressions for sputtering such as that proposed in [36] and based on the impact energy of the plasma provide a valuable first guess, as was already shown in [25]. It is written as follows:
with
Because the sputtering yield is estimated by Eqs 13–15, the flux of tungsten sputtered
where
Its evolution with the gas puff rate is shown along the tokamak wall in Figure 12 (bottom row, right column). Despite the increase in plasma flux on the lower divertor (LD) targets, the reduction of the temperatures is more significant and leads to a reduction in tungsten sputtering yields. Indeed, sputtering on the LD targets becomes low for a puff rate of
The coherence observed in the current results suggests that this rough modeling of erosion, which is dependent on the plasma temperature, one of the most driving parameters in this phenomenon, can nevertheless be used to describe the overall qualitative behavior of the wall in relation to the gas puff.
5.4 Further discussion
The results presented in this paper showed the evolution of plasma quantities as a function of the gas puff rate. These findings can be further discussed to bring new information on some challenging questions related to the tokamak operation.
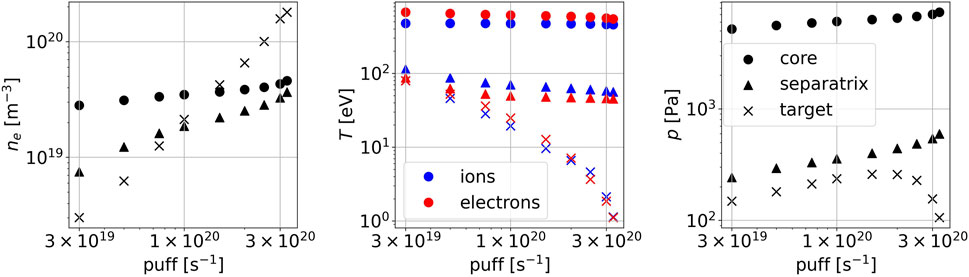
Figure 13. Evolution as a function of puff rate of the density (left), ion (blue) and electron (red) temperatures (middle), total dynamic plasma pressure (right) at three locations in the tokamak cross-section: the magnetic axis (full circles), the outer midplane separatrix (full triangles), and at the target (peak value over the target, crosses).
Considered hereinafter, peak values at the outer targets serve as a valuable proxy for the discussion of the plasma behavior with the change of the puff rate, reasonably reducing the amount of data shown in the figures. We also highlight that if a more detailed perpendicular transport model is included, these peak values (as well as the shape of the profile) can be significantly altered [45]. However, the global trends should be conserved with probably modified exact values of puff rate, corresponding to different regimes.
The temperature evolution at these three locations clearly shows the transition from the sheath-limited to the high-recycling regimes, the latter being characterized by the onset of a significant temperature gradient between the outer midplane and the LD targets. This transition is evaluated here for a gas puff between 5
The transition from the high-recycling regime to a detached plasma is best shown by the evolution of the plasma pressure (Figure 13, right). For puff rates below 1–2
Figure 13 also shows the gap between the upstream plasma density (at the separatrix) and in the core (at the magnetic axis), although the latter shows the same tendency to increase with gas puff. However, the density value at the separatrix increases more rapidly than at the magnetic axis, the two becoming comparable at the highest puff rate. In the 2PM analysis of the experiments, when the target and upstream density values are compared, the core or the average
It is remarkable that
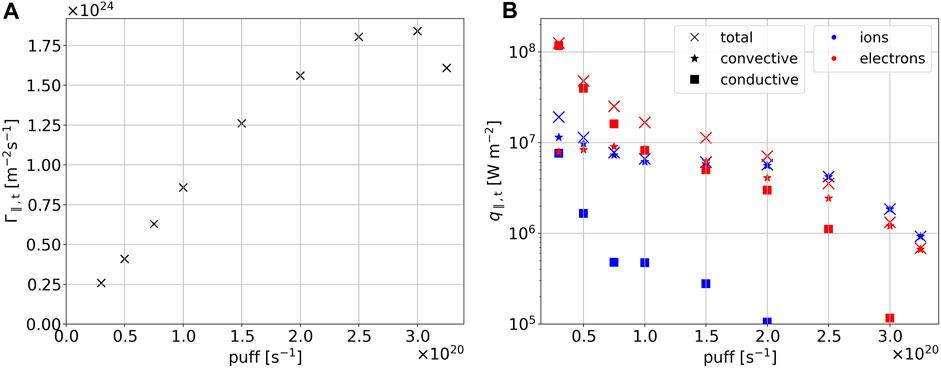
Figure 14. Peak target values for the parallel flux of particle (A) and ion and electron heat (B) predicted by the simulations as the function of the gas puff rate. Additionally, convective (stars) and conductive (squares) contributions to the heat fluxes are shown. WEST lower divertor, outer target.
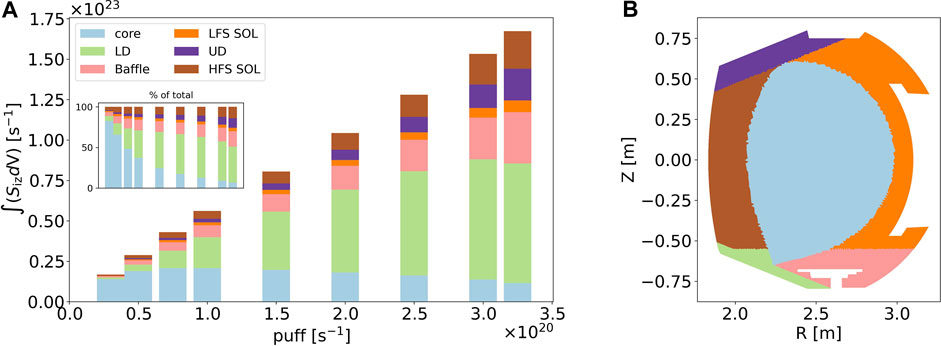
Figure 15. Distribution of the total particle sources in different plasma regions (A). The inset shows the relative part of each region in percentages. Map of the plasma regions (B).
The separation between the other regions is made to take into account the features of the ionization sources observed in the 2D profiles of
6 Conclusion and perspectives
This paper investigates the impact of the gas puff magnitude on the mean quantities in a WEST plasma (discharge #54487). The numerical simulations have been performed using the advanced 2D transport code SOLEDGE-HDG based on an original high-order finite-elements method that makes the spatial discretization magnetic equilibrium free. This feature allows accurate discretizing of the tokamak wall and provides a very accurate discretization of the singularities as the X-point or the center of the poloidal section.
In the present work, the fluid neutral transport model has been updated with a self-consistent diffusion that depends on the atomic rates estimated using splines from well-referenced databases and background plasma quantities. This diffusion coefficient is further interpreted by the mean free path of neutrals in the plasma, offering valuable insights into the neutral source distributions depending on the simulation parameters. Additionally, we have presented an investigation into the quality of the magnetic equilibrium reconstruction from experimental data essential for the refined SOLEDGE-HDG meshes.
The main findings of the paper can be summarized as follows.
- The sheath-limited regime (gas puff rates
- In the high-recycling regime (gas puff rate between
- The detached regime (gas puff rate from
This new modeling in SOLEDGE-HDG opens many perspectives in realistic tokamak configurations. Further work will be devoted to a deeper investigation of the detached regime conditions when varying not only the gas puff as here but also the heating sources. In particular, a focus will be made on the X-point radiator regime with deep divertor detachment induced by impurity seeding, which allows radiation concentration in a small region at the X-point. Indeed, this regime, observed in several machines, needs to be better characterized so that it can be optimized to control heat exhaust in optimized divertor scenarios. This new study will be facilitated by the new set of synthetic diagnostics recently developed by the team [51], which will enable more rigorous comparisons with experiments.
Data availability statement
The raw data supporting the conclusions of this article will be made available by the authors, without undue reservation.
Author contributions
IK: conceptualization, data curation, formal analysis, investigation, methodology, software, visualization, writing–original draft, and writing–review and editing. Md’A: conceptualization, data curation, investigation, methodology, software, and writing–review and editing. AG: investigation, project administration, resources, supervision, and writing–review and editing. ES: conceptualization, formal analysis, funding acquisition, investigation, methodology, project administration, resources, supervision, writing–original draft, and writing–review and editing. FS: software and writing–review and editing. HB: methodology, software, and writing–review and editing. GC: resources and writing–review and editing. PG: formal analysis, investigation, and writing–review and editing. PT: software and writing–review and editing.
Funding
The author(s) declare that financial support was received for the research, authorship, and/or publication of this article. This work has been carried out within the framework of the EUROfusion Consortium, funded by the European Union via the Euratom Research and Training Programme (Grant Agreement No. 101052200 — EUROfusion). This work has been supported by the French National Research Agency grant SISTEM (ANR-19-CE46-0005-03).
Acknowledgments
The authors would like to thank Clarisse Bourdelle for the fruitful discussions and for sharing her experimental insights. They also would like to thank David Moiraf for providing the experimental equilibrium profiles for the discussed WEST discharge.
Conflict of interest
The authors declare that the research was conducted in the absence of any commercial or financial relationships that could be construed as a potential conflict of interest.
Publisher’s note
All claims expressed in this article are solely those of the authors and do not necessarily represent those of their affiliated organizations, or those of the publisher, the editors, and the reviewers. Any product that may be evaluated in this article, or claim that may be made by its manufacturer, is not guaranteed or endorsed by the publisher.
Author disclaimer
The views and opinions expressed are those of the author(s) only and do not necessarily reflect those of the European Union or the European Commission. Neither the European Union nor the European Commission can be held responsible for them.
Supplementary material
The Supplementary Material for this article can be found online at: https://www.frontiersin.org/articles/10.3389/fphy.2024.1407534/full#supplementary-material
References
1. Ikeda K. Progress in the ITER physics basis. Nucl Fusion (2007) 47:E01. doi:10.1088/0029-5515/47/6/e01
2. Bigot B. ITER construction and manufacturing progress toward first plasma. Fusion Eng Des (2019) 146:124–9. doi:10.1016/j.fusengdes.2018.11.052
3. ITER-JCT. Status of ITER. Plasma Phys Controlled Fusion (1995) 37:A19–35. doi:10.1088/0741-3335/37/11A/002
4. Loarte A, Monk R, Martín-Solís J, Campbell D, Chankin A, Clement S, et al. Plasma detachment in JET mark i divertor experiments. Nucl Fusion (1998) 38:331–71. doi:10.1088/0029-5515/38/3/303
5. Kallenbach A, Dux R, Mertens V, Gruber O, Haas G, Kaufmann M, et al. H mode discharges with feedback controlled radiative boundary in the asdex upgrade tokamak. Nucl Fusion (1995) 35:1231–46. doi:10.1088/0029-5515/35/10/I07
6. Petrie T, Hill D, Allen S, Brooks N, Buchenauer D, Cuthbertson J, et al. Radiative divertor experiments in DIII-D with d2 injection. Nucl Fusion (1997) 37:321–38. doi:10.1088/0029-5515/37/3/I03
7. Ghendrih P, Grosman A, Capes H. Theoretical and experimental investigations of stochastic boundaries in tokamaks. Plasma Phys Controlled Fusion (1996) 38:1653–724. doi:10.1088/0741-3335/38/10/002
8. Schwander F, Serre E, Bufferand H, Ciraolo G, Ghendrih P. Global fluid simulations of edge plasma turbulence in tokamaks: a review. Comput Fluids (2024) 270:106141. doi:10.1016/j.compfluid.2023.106141
9. Simonini R, Corrigan G, Radford G, Spence J, Taroni A. Models and numerics in the multi-fluid 2-D edge plasma code EDGE2D/U. Contrib Plasma Phys (1994) 34:368–73. doi:10.1002/ctpp.2150340242
10. Reiter D, May C, Coster D, Schneider R. Time dependent neutral gas transport in tokamak edge plasmas. J Nucl Mater (1995) 220:987–92. doi:10.1016/0022-3115(94)00648-2
11. Frerichs H, Bonnin X, Feng Y, Loarte A, Pitts R, Reiter D, et al. Stabilization of EMC3-EIRENE for detachment conditions and comparison to SOLPS-ITER. Nucl Mater Energ (2019) 18:62–6. doi:10.1016/j.nme.2018.11.022
12. Bufferand H, Bensiali B, Bucalossi J, Ciraolo G, Genesio P, Ghendrih P, et al. Near wall plasma simulation using penalization technique with the transport code SolEdge2D-Eirene. J Nucl Mater (2013) 438:S445–8. doi:10.1016/j.jnucmat.2013.01.090
13. Wiesen S, Reiter D, Kotov V, Baelmans M, Dekeyser W, Kukushkin A, et al. The new SOLPS-ITER code package. J Nucl Mater (2015) 463:480–4. doi:10.1016/j.jnucmat.2014.10.012
14. Rognlien T, Brown P, Campbell R, Kaiser T, Knoll D, McHugh P, et al. 2-D fluid transport simulations of gaseous/radiative divertors. Contrib plasma Phys (1994) 34:362–7. doi:10.1002/ctpp.2150340241
15. Stotler D, Skinner C, Budny R, Ramsey A, Ruzic D, Turkot JR. Modeling of neutral hydrogen velocities in the tokamak fusion test reactor. Phys Plasmas (1996) 3:4084–94. doi:10.1063/1.871540
16. Garcia OE, Pitts R, Horacek J, Nielsen A, Fundamenski W, Graves J, et al. Turbulent transport in the TCV SOL. J Nucl Mater (2007) 363:575–80. doi:10.1016/j.jnucmat.2006.12.063
17. Coroado A, Ricci P. Numerical simulations of gas puff imaging using a multi-component model of the neutral–plasma interaction in the tokamak boundary. Phys Plasmas (2022) 29. doi:10.1063/5.0077336
18. Thrysøe A, Madsen J, Naulin V, Rasmussen JJ. Influence of molecular dissociation on blob-induced atom density perturbations. Nucl Fusion (2018) 58:096005. doi:10.1088/1741-4326/aac8a4
19. Krasheninnikov S, Kukushkin A. Physics of ultimate detachment of a tokamak divertor plasma. J Plasma Phys (2017) 83:155830501. doi:10.1017/s0022377817000654
20. Thrysøe AS, Tophøj LE, Naulin V, Rasmussen JJ, Madsen J, Nielsen AH. The influence of blobs on neutral particles in the scrape-off layer. Plasma Phys Controlled Fusion (2016) 58:044010. doi:10.1088/0741-3335/58/4/044010
21. Kvist K, Thrysøe AS, Haugbølle T, Nielsen AH. A direct Monte Carlo approach for the modeling of neutrals at the plasma edge and its self-consistent coupling with the 2d fluid plasma edge turbulence model hesel. Phys Plasmas (2024) 31. doi:10.1063/5.0188594
22. Thrysøe AS, Løiten M, Madsen J, Naulin V, Nielsen A, Rasmussen JJ. Plasma particle sources due to interactions with neutrals in a turbulent scrape-off layer of a toroidally confined plasma. Phys Plasmas (2018) 25. doi:10.1063/1.5019662
23. Bufferand H, Bucalossi J, Ciraolo G, Falchetto G, Gallo A, Ghendrih P, et al. Progress in edge plasma turbulence modelling—hierarchy of models from 2D transport application to 3D fluid simulations in realistic tokamak geometry. Nucl Fusion (2021) 61:116052. doi:10.1088/1741-4326/ac2873
24. Zholobenko W, Body T, Manz P, Stegmeir A, Zhu B, Griener M, et al. Electric field and turbulence in global braginskii simulations across the asdex upgrade edge and scrape-off layer. Plasma Phys Controlled Fusion (2021) 63:034001. doi:10.1088/1361-6587/abd97e
25. d’Abusco MS, Giorgiani G, Artaud JF, Bufferand H, Ciraolo G, Ghendrih P, et al. Core-edge 2D fluid modeling of full tokamak discharge with varying magnetic equilibrium: from WEST start-up to ramp-down. Nucl Fusion (2022) 62:086002. doi:10.1088/1741-4326/ac47ad
26. Bourdelle C, Artaud J, Basiuk V, Bécoulet M, Brémond S, Bucalossi J, et al. WEST physics basis. Nucl Fusion (2015) 55:063017. doi:10.1088/0029-5515/55/6/063017
27. Horsten N, Samaey G, Baelmans M. Development and assessment of 2D fluid neutral models that include atomic databases and a microscopic reflection model. Nucl Fusion (2017) 57:116043. doi:10.1088/1741-4326/aa8009
28. Borodin DV, Schluck F, Wiesen S, Harting D, Boerner P, Brezinsek S, et al. Fluid, kinetic and hybrid approaches for neutral and trace ion edge transport modelling in fusion devices. Nucl Fusion (2022) 62:086051. doi:10.1088/1741-4326/ac3fe8
29. Van Uytven W, Dekeyser W, Blommaert M, Carli S, Baelmans M. Assessment of advanced fluid neutral models for the neutral atoms in the plasma edge and application in ITER geometry. Nucl Fusion (2022) 62:086023. doi:10.1088/1741-4326/ac72b4
31. Summers H. The adas user manual (2004). Available from: http://www.adas.ac.uk/.
32. Reiter D, et al. The data file AMJUEL: additional atomic and molecular data for EIRENE. Forschungszentrum Juelich GmbH (2000) 52425.
33. Giorgiani G, Bufferand H, Ciraolo G, Ghendrih P, Schwander F, Serre E, et al. A hybrid discontinuous Galerkin method for tokamak edge plasma simulations in global realistic geometry. J Comput Phys (2018) 374:515–32. doi:10.1016/j.jcp.2018.07.028
35. Kudashev I, Glasser AM, d’Abusco MS, Serre E. Impact of variable perpendicular transport coefficients in WEST simulations using SolEdge-HDG. IEEE Trans Plasma Sci (2024) 1–6. doi:10.1109/tps.2024.3384031
36. Stangeby PC, et al. The plasma boundary of magnetic fusion devices. Inst Phys Pub. Philadelphia, Pa (2000) 224. doi:10.1201/9780367801489
37. Horvath L, Lomanowski B, Karhunen J, Maslov M, Schneider P, Simpson J, et al. Pedestal particle balance studies in JET-ILW h-mode plasmas. Plasma Phys Controlled Fusion (2023) 65:044003. doi:10.1088/1361-6587/acbb23
38. Reiter D, Baelmans M, Boerner P. The EIRENE and B2-EIRENE codes. Fusion Sci Technol (2005) 47:172–86. doi:10.13182/fst47-172
39. Yang H, Ciraolo G, Bucalossi J, Bufferand H, Fedorczak N, Tamain P, et al. Numerical modelling of the impact of leakage under divertor baffle in WEST. Nucl Mater Energ (2022) 33:101302. doi:10.1016/j.nme.2022.101302
40. Ghendrih P, Dif-Pradalier G, Panico O, Sarazin Y, Bufferand H, Ciraolo G, et al. Role of avalanche transport in competing drift wave and interchange turbulence. J Phys Conf Ser (IOP Publishing) (2022) 2397:012018. doi:10.1088/1742-6596/2397/1/012018
41. Romazanov J, Borodin D, Kirschner A, Brezinsek S, Silburn S, Huber A, et al. First ERO2. 0 modeling of be erosion and non-local transport in JET ITER-like wall. Phys Scr (2017) 2017:014018. doi:10.1088/1402-4896/aa89ca
42. Di GS, Gallo A, Fedorczak N, Yang H, Ciraolo G, Romazanov J, et al. Modelling of tungsten contamination and screening in WEST plasma discharges. Nucl Fusion (2021) 61:106019. doi:10.1088/1741-4326/ac2026
43. Stangeby P. Interpretation of Langmuir, heat-flux, deposition, trapping and gridded energy analyser probe data for impure plasmas. J Phys D: Appl Phys (1987) 20:1472–8. doi:10.1088/0022-3727/20/11/017
45. Myra J, D’Ippolito D, Russell D. Turbulent transport regimes and the scrape-off layer heat flux width. Phys Plasmas (2015) 22. doi:10.1063/1.4919255
46. Stangeby P. Basic physical processes and reduced models for plasma detachment. Plasma Phys Controlled Fusion (2018) 60:044022. doi:10.1088/1361-6587/aaacf6
47. Kaveeva E, Makarov S, Senichenkov I, Rozhansky V, Veselova I, Bonnin X, et al. SOLPS-ITER modeling of deuterium throughput impact on the ITER SOL plasma. Nucl Mater Energ (2023) 35:101424. doi:10.1016/j.nme.2023.101424
48. Park JS, Bonnin X, Pitts R, Lore J. Impact of gas injection location and divertor surface material on ITER fusion power operation phase divertor performance assessed with SOLPS-ITER. Nucl Fusion (2024) 64:036002. doi:10.1088/1741-4326/ad1d11
49. Brunner D, LaBombard B, Churchill R, Hughes J, Lipschultz B, Ochoukov R, et al. An assessment of ion temperature measurements in the boundary of the Alcator C-Mod tokamak and implications for ion fluid heat flux limiters. Plasma Phys Controlled Fusion (2013) 55:095010. doi:10.1088/0741-3335/55/9/095010
50. Tamain P, Kočan M, Gunn J, Kirk A, Pascal JY, Price M. Ion energy measurements in the scrape-off layer of MAST using a retarding field analyzer. J Nucl Mater (2011) 415:S1139–42. doi:10.1016/j.jnucmat.2010.11.078
Keywords: magnetic fusion, WEST tokamak, transport simulation, gas puff, density regimes, detachment
Citation: Kudashev I, Scotto d’Abusco M, Glasser A, Serre E, Schwander F, Bufferand H, Ciraolo G, Ghendrih P and Tamain P (2024) Global particle buildup simulations with gas puff scan: application to WEST discharge. Front. Phys. 12:1407534. doi: 10.3389/fphy.2024.1407534
Received: 26 March 2024; Accepted: 20 May 2024;
Published: 14 August 2024.
Edited by:
Jens Juul Rasmussen, Technical University of Denmark, DenmarkReviewed by:
Alexander Simon Thrysøe, Technical University of Denmark, DenmarkAntti Salmi, VTT Technical Research Centre of Finland Ltd., Finland
Copyright © 2024 Kudashev, Scotto d’Abusco, Glasser, Serre, Schwander, Bufferand, Ciraolo, Ghendrih and Tamain. This is an open-access article distributed under the terms of the Creative Commons Attribution License (CC BY). The use, distribution or reproduction in other forums is permitted, provided the original author(s) and the copyright owner(s) are credited and that the original publication in this journal is cited, in accordance with accepted academic practice. No use, distribution or reproduction is permitted which does not comply with these terms.
*Correspondence: I. Kudashev , aXZhbi5rdWRhc2hldkB1bml2LWFtdS5mcg==