- State Key Laboratory of Networking and Switching Technology, Beijing University of Posts and Telecommunications, Beijing, China
To explore heterogeneous behavior diffusion in the same population under a heterogeneous network, this study establishes a dual-layer heterogeneous network model to simulate the spreading patterns of hesitant individuals and regular individuals in different networks. It analyzes the influence of to investigate heterogeneous behavior diffusion within the same population in a heterogeneous network, this paper establishes a dual-layer heterogeneous network model to simulate the spreading patterns of hesitant individuals and regular individuals in different networks. It analyzes the influence of individuals’ hesitation states and different spreading patterns in heterogeneous networks on the information diffusion mechanism. In the propagation of this model, when either layer of the dual-layer network becomes the dominant spreading layer, second-order continuous spreading is observed. However, when the regular adoption behavior serves as the dominant spreading layer, its spreading threshold occurs earlier than the spreading threshold when hesitant adoption behavior is the dominant spreading layer. When there is no dominant spreading layer, first-order discontinuous spreading is observed, and the spreading threshold occurs later than the threshold in the presence of a dominant spreading layer. Additionally, the study discovers the existence of cross-phase transitions during the spreading process. The results of theoretical analysis align with the simulation results.
1 Introduction
In the field of network science, the study of social communication has garnered widespread attention among researchers [1, 2]. It can be applied to analyze financial behaviors [3, 4], social information diffusion [5], and emotional contagion [6]. Furthermore, it can be utilized for disaster prediction [7] and risk mitigation [8]. Scholars have explored the mechanisms of social communication through both theoretical analysis and extensive experimental validation. Research has revealed that social communication exhibits certain unique reinforcement effects compared to biological propagation [9, 10].
In the early stages of research, the most commonly used approach was the threshold model based on memoryless Markov processes [11]. In this threshold model, a behavior is adopted when the number of adopting neighbors exceeds a predetermined threshold [12, 13]. Given the small proportion of initial seeds, the initial infection rate is predicted using percolation principles [14, 15]. Based on the assumption of constant thresholds, because of variations in the average degree, saddle-node bifurcation occurs, leading to a continuous increase and subsequent discontinuous decrease in the final adoption size with increasing network average degree. Research has found that factors such as the initial number of seeds [16, 17], clustering coefficient [18], multilayer networks [19], network temporal dynamics [20] and time-varying [21] significantly affect information propagation in the threshold model.
In the field of complex networks, numerous scholars have conducted extensive research on propagation behaviors in single-layer networks. However, studies have shown that multilayer networks better represent real-world social networks. In the context of bio-information networks [22], individuals can access various information in the information network to execute different strategies in the biological network [23]. For example, during the COVID-19 pandemic, people could obtain preventive measures through the internet, leading to improved habits and reduced chances of contracting the virus in the biological network. In the case of multilayer information networks, individuals often do not rely on a single channel to interact with the external world. Each person has multiple social channels, such as WeChat, Twitter, Instagram, and more. Thus, in a multilayer network, information does not propagate solely within a single layer but rather disseminates through multiple coupled networks. However, individual information acquisition remains singular [24]. For instance, on the YouTube platform, users can upload and share video content, and other users can subscribe to their channels. This forms a user-user connectivity network. Each video can be viewed, commented on, and shared by other users, creating a video-user connectivity network. When a user uploads a video, their subscribers can see it in their subscription feed. If these subscribers find the video appealing or valuable, they can choose to share it with their own audience. Consequently, the video spreads through user-to-user sharing in the network. In this example, the social network among users and the video-user connectivity network constitute a multilayer network. Video content propagates through sharing and viewing behaviors among users, and this multilayer network structure can influence the dissemination path, view counts, and impact of videos. In conclusion, multilayer networks better capture the essence of real-world networks, allowing us to simulate human behavior in real-life situations.
With the diversification of information channels and the complexity of information forms, people are living in an era of fragmented information, and the adoption patterns of information have gradually become differentiated and heterogeneous. This is especially true for differentiating information sources. For information channels with low trustworthiness, people may encounter a mix of correct and incorrect information, leading to skepticism towards the information from these channels. Conversely, for information channels with high trustworthiness, such as those associated with authoritative sources or long-standing trust, people are more likely to trust and adopt information from these channels [25]. Therefore, the two-layer network model [26] takes into account the more complex information transmission, which has significant practical implications. Previous research has not extensively addressed heterogeneous threshold functions. While some studies have explored two-layer networks, they often assume the same threshold function for both layers. However, in real life, due to the heterogeneity between layers, people have different levels of trust and acceptance for information from different sources. Consequently, people behave differently after acquiring information from different platforms. Therefore, adopting heterogeneous functions for different channels better reflects reality. In this study, a heterogeneous threshold function is employed in the two-layer model to capture this phenomenon.
Existing research has shown that individuals exhibit different adoption attitudes towards the same information on different network layers, and their attitudes may change as the amount of information they receive fluctuates [27]. However, there is relatively limited research on considering heterogeneous adoption in information propagation within complex networks. In real social networks, individuals vary in their level of adoption across different layers of information. Based on the adoption attitudes towards information on different layers, this study categorizes heterogeneous adoption in social networks into two types: regular adoption and hesitant adoption. Regular adoption refers to a linear increase in the willingness to adopt with the number of received information or behaviors. Hesitant adoption, on the other hand, involves a state of hesitation regarding whether to adopt, requiring repeated verification of information and accumulating more information before developing the willingness to adopt. For instance, when a popular piece of information appears on the internet, an individual is more likely to increase their trust and adopt it on reliable information platforms, leading to a rapid saturation of adoption on such platforms. However, when the same individual encounters this information on an untrustworthy platform, they may exhibit a hesitant adoption stance, repeatedly verifying the information before deciding to adopt. As a result, the propagation speed on such platforms is slower, and it takes some time for the adoption to reach a relative saturation point. Therefore, studying the behavioral division of inter-layer adoption heterogeneity will contribute to a deeper understanding of the propagation mechanisms in multi-layer social networks.
The paper proposes a heterogeneous threshold adoption function on a two-layer model and constructs a heterogeneous adoption behavior network model for the same information on the two layers. It investigates the heterogeneous information propagation in a heterogeneous network of the same population. Through extensive simulation and theoretical analysis, the study reveals that when either layer dominates, the final outbreak of the adoption range manifests a second-order continuous phase transition. In contrast, when there is no clear dominant layer, the outbreak follows a first-order discontinuous phase transition. The timing and extent of the outbreak are influenced by various factors such as hesitant adoption parameter, degree heterogeneity parameter, and propagation probability. In the steady state, the final propagation range reaches global dissemination.
2 Model introduction
2.1 SAR model and information adoption mechanism
To investigate heterogeneous adoption behavior in a heterogeneous network within the same population, this study utilizes the SF network model and ER network model as the physical network structure models for the experiments. In each layer, a bipartite network model with N nodes and a degree distribution of P(k) is constructed. The layers A and B stand for two different social networks, while the edges between nodes stand for their social connections. To explain heterogeneous behavior propagation on the multilayer network, a generalized Susceptible-Adopter-Recovered (SAR) model is used. At any given time, each node can only be in one of the following three states: susceptible (S), adopter (A), or recovered (R). S-state nodes can only obtain behavioral information from their neighboring nodes and adopt that information with a certain probability. A-state nodes have already adopted the behavior and are willing to propagate the behavioral information to their neighbors. R-state nodes are not interested in the behavioral information and do not propagate it to other neighbors.
The variables mA and mB are used to accumulate the information received by nodes in layers A and B, respectively. At each time step, when a node successfully gets information from neighbors in layer A or layer B, the corresponding variable
Figure 2 more intuitively illustrates the relationship between Layers A and B as discussed earlier. Arrows and directional cues emphasize the flow of information or influence from Layer A to Layer B, indicating the dynamic relationship between them. This illustration aims to enhance understanding by providing a visual aid that complements the textual description, helping to grasp the complex interactions between the layers more visually.
2.2 Heterogeneous adoption functions
For layer A, Eq. 1 is as follows:
When 0 ≤ x < α (Region I in Figure 1D), the adoption probability initially increases non-linearly to its maximum value β and then decreases to 0. When α ≤ x < 1 (Region II in Figure 1D), the adoption probability increases non-linearly with x from 0 to 1:
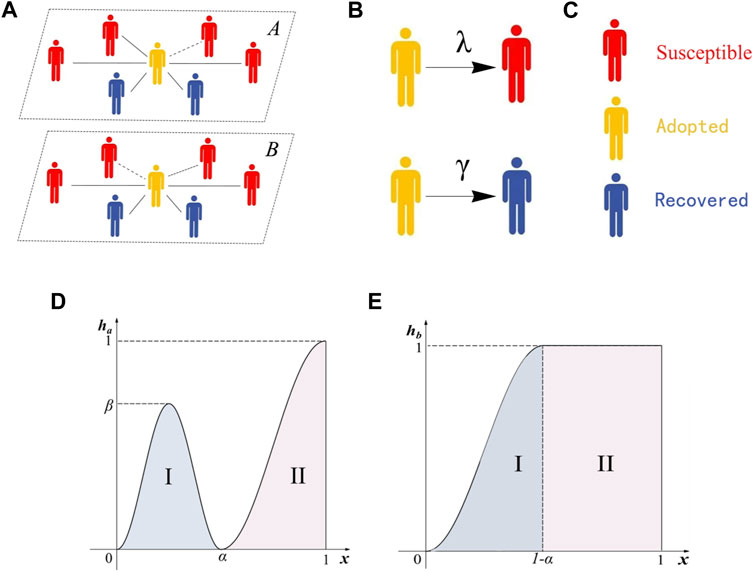
Figure 1. (A) shows the connections between individuals and the information dissemination of individuals in a two-layer heterogeneous network. (B) The probability of an adoptive individual transferring information to a susceptible individual is λ. The probability of an adoptive individual changing into a recovered individual is γ. (C) shows different colors represent different individual states. (D) shows the individual adoption behavior function image of an individual at layer A, and (E) shows the individual adoption behavior function image of an individual at layer B.
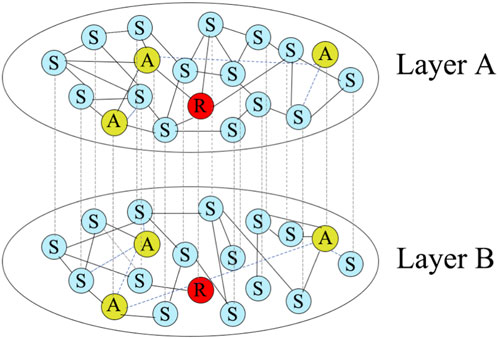
Figure 2. Figure illustrates the intricate connections within a complex network comprising multiple nodes. The states of the nodes and their relationships are essentially identical to those described in Figure 1. Layer A and Layer B represent the social context of the same node within two distinct social communication networks. While the node maintains the same status across different social networks, its connectivity varies. Within each layer, solid lines denote connected nodes that do not propagate information, while dashed lines indicate the transmission of information between two nodes connected by an edge.
For layer B, Eq. 2 is as follows:
When 0 ≤ x < 1 − α, as Region I in Figure 1E, the adoption probability increases with the increase of x until it reaches 1. On the other hand, when 1 − α ≤ x < 1, as Region II in Figure 1E, the adoption probability remains constant at 1. When x < 1 − α, the increase in x enhances the individual’s adoption capability, while when x < 1 − α, the adoption capability remains stable.
2.3 Propagation process and methods
• The network consists of N individuals, with a portion initially in state A and the remaining in state S, without any behavioral information (mX = 0). The quantity ρ0 stands for the initial ratio of individuals in state A, defined as the proprtion of the number of individuals in state A to the total number of individuals in the network.
• The probability of an individual in state S receiving behavioral information from an individual in state A is λ. When an individual receives behavioral information from another individual in state A, the information count m of that individual increases by 1. Due to the non-redundancy of information, an individual cannot receive the same neighbor’s information repeatedly.
• In layers A and B, individuals in state S adopt behavioral information with probabilities N and M, respectively. If adopted, the individual transitions to state A; otherwise, it remains in state S. Additionally, whenever the state of a node changes in one layer, the state of the other layer also changes accordingly.
• When an individual in state A transmits behavioral information to neighboring individuals, there is a possibility of transitioning to state R with probability γ, ceasing to take part in the subsequent propagation process.
• Repeat the process from Step 2 to Step 4 until the state of individual nodes in the network remains unchanged, with only nodes in states S and R. At this moment, the propagation reaches a steady state, and the behavioral information stops spreading.
3 Formula derivation
Based on Ref. [28], this study employs an edge-based compartmental (EBC) method for theoretical analysis of the model. By analyzing the variation in the number of individuals in different states in a multilayer network, the study provides a theoretical evaluation of the propagation mechanism in a heterogeneous adoption behavior network for the same information in a dual-layer setting.
Inspired by the “Hole Theory” [29], it shows that individual i is in a “hole” state, meaning it cannot transmit information to its neighbors but can receive information from them. Let
and
Based on the assumption that
Therefore, the probability that node i does not adopt any behavior in layer A and remains in state S is
So, the probability that node i, with
If S(t), A(t), R(t) are used to represent the proportions of nodes in different states, considering nodes with different degrees, the proportion of nodes in the susceptible state at time t can be expressed as Eq. 9:
Considering that the neighbors of individual i can be in the susceptible, adopter, or recovered state,
In this case,
In layer X, the probability that node j remains in the susceptible state at time t is as Eqs 13, 14:
and
Since the probability of transmitting information through edges is λ, and the recovery probability of adopter nodes is γ, the equation for
At time t, the probability of information being transmitted through an edge is equal to the probability of an adopter node transmitting the information to a susceptible neighbor. Therefore, Eq. 16 is as follows:
By combining Eqs 12 and 13, Eq. 17 can be obtained:
By substituting Eqs 8 and 14 into Eq. 13, Eq. 18 can be obtained:
Given the initial conditions for θX (0) = 1 and
By substituting the expression for
To simplify the notation, let’s use the function f(x) to represent θX (∞).
By substituting the obtained equations into (4)–(7), it can be derived that the proportion of susceptible nodes S (∞). Since the growth of
and
Based on S (∞), it can be obtained that R (∞) as a complement to 1, since the proportions of nodes in all states must sum up to 1.
To further investigate the conditions for non-continuous growth of the function, the situation can be determined when Eq. 17 is tangent to θX (∞) < 1 by calculating the following Eq. 23:
4 Parameter settings
To ensure simulation accuracy, a minimum of 103 dynamic realizations are recommended in the network for this study. The network size is set to N = 104, with an average degree of
The heterogeneity of the network degree distribution is negatively correlated with the degree distribution exponent ν. When ν is small, the network contains a few high-degree nodes and many low-degree nodes. Additionally, to make the process more convenient, the information transmission probability is set as λA = λB = λ, and the recovery rate is set as γ = 1.0.
The peak of the relative variance χ curve of the final adoption range and the corresponding information transmission probability at the critical points are as Eq. 24:
The symbol
5 Simulation and discussion
In this paper, the first exploration is about the propagation of information on a weighted ER network, where the nodes in the ER network follow a Poisson distribution, denoted as [
5.1 ER network
From Figure 3A, it can be observed that when the individual hesitation amplitude is relatively small (β = 0.5), the outbreak of R (∞) exhibits second-order continuous phase transitions for α = 0.2 and α = 0.8. The propagation outbreak occurs earlier but with a slower growth rate for α = 0.2 compared to α = 0.8. However, when α = 0.5, the outbreak point occurs later, and the growth pattern is characterized by discontinuous growth with a faster rate. In the steady state, the final propagation size reaches complete spread for all values of α. Figure 3C indicates that when the individual hesitation amplitude is relatively large (β = 0.8), the propagation patterns are similar to those in Figure 3A, but the outbreak of R (∞) occurs earlier, and there are cross-over phase transitions in the propagation. Additionally, when α = 0.2 and α = 0.8, the outbreak point for α = 0.2 precedes that of α = 0.8, indicating that the impact of the hesitation amplitude β on the propagation differs for different hesitation degrees α.
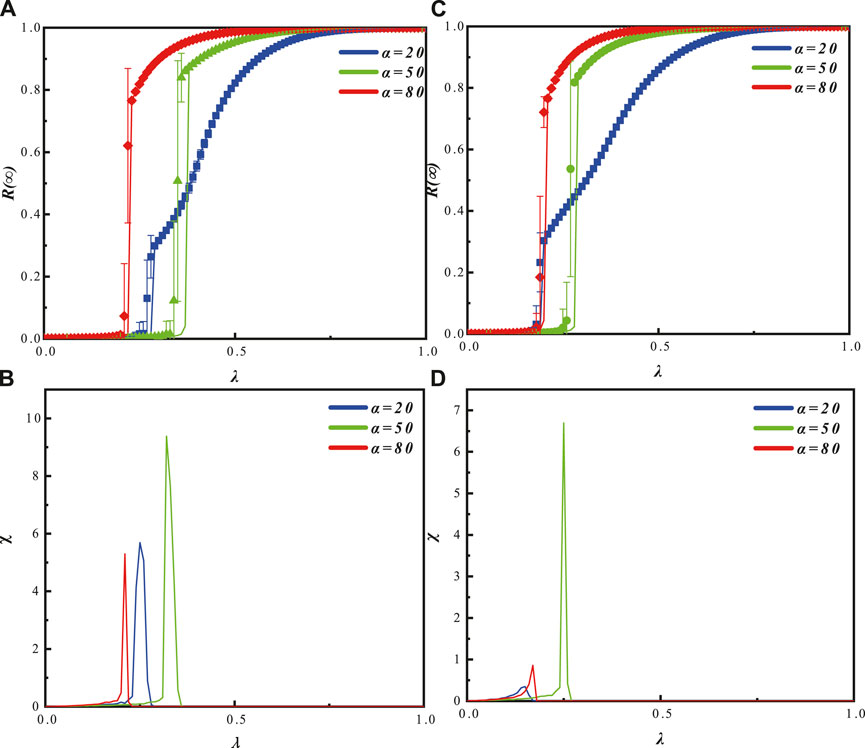
Figure 3. The graph illustrates the impact of the hesitation degree parameter α and the propagation probability λ on the information outbreak size R (∞), the final adoption range, and the relative variance in an ER-ER network, with a fixed hesitation amplitude parameter β. In graph (A) (β = 0.5) and graph (C) (β = 0.8), the influence of α on the information outbreak size is shown as the propagation probability varies. The symbols represent simulation results, while the lines depict theoretical predictions. Different values of α correspond to different propagation patterns of information. In graph (B) (β = 0.5) and graph (D) (β = 0.8), the peak distribution of the relative variance of the adoption range is shown as the propagation probability varies for different α values. The peaks correspond to the outbreak points in graph (A) and graph (C), respectively. The remaining parameters are set as ρ0 and γ = 1.
Figure 3B demonstrates that when β = 0.5, the relative variance of the adoption range exhibits an earlier outbreak for α = 0.8, followed by α = 0.2, and finally α = 0.5. The saturation order is α = 0.8, α = 0.2, α = 0.5. In Figure 3D, when β = 0.8, the relative variance of the adoption range exhibits an earlier outbreak for α = 0.2, followed by α = 0.8, and finally α = 0.5. The saturation order is α = 0.2, α = 0.8, α = 0.5.
Figure 4A represents the joint effect of the hesitation amplitude parameter β and the hesitation degree parameter α on the final adoption range R (∞) in an ER network. Based on different phase transition patterns, Figure 4A can be divided into four regions. In regions I (0.75 < α ≤ 1) and III (0.09 < α ≤ 0.41), as λ increases, a second-order continuous phase transition is observed. This is because when α is large (dominance of the ordinary state) or small (dominance of the hesitant state), both layer A (ordinary state adoption) and layer B (hesitant state adoption) exhibit single-layer outbreaks, where the outbreak of one layer leads to the outbreak of the other layers, resulting in continuous propagation. In region II (0.41 < α ≤ 0.75), a discontinuous first-order phase transition is observed as λ increases. This occurs when both layers simultaneously outbreak, but with a delayed outbreak point, indicating the absence of a dominant propagation layer. In region IV (0 < α ≤ 0.09), there is no growth, indicating the absence of information outbreak in this region.
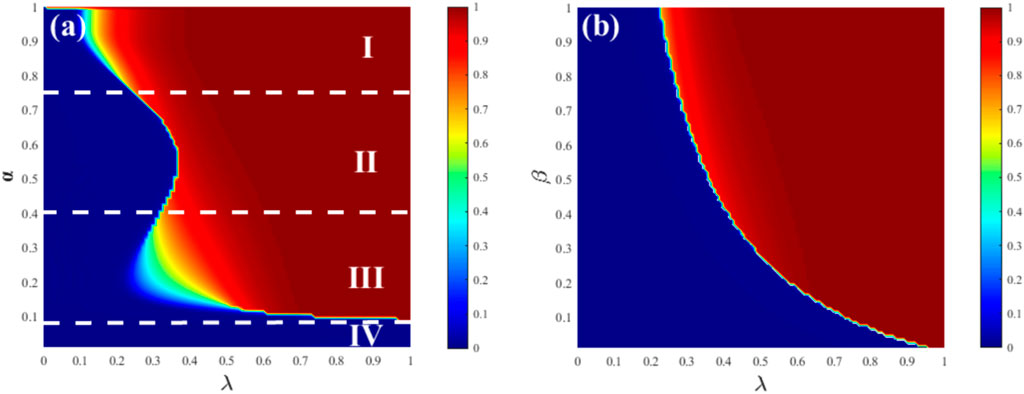
Figure 4. Graph (A) represents the relationship between the information outbreak size and the hesitation degree parameter α and propagation probability λ in an ER-ER network, with a fixed hesitation amplitude parameter β = 0.5. Graph (B) represents the relationship between the information outbreak size and the hesitation amplitude parameter β and propagation probability λ in an ER-ER network, with a fixed hesitation degree parameter α = 0.5. The remaining parameters are set as ρ0 and γ = 1.
Figure 3B represents a continuous single-stage process, exhibiting a continuous second-order phase transition as λ increases. As β decreases, the propagation becomes slower, indicating a positive correlation between the hesitation amplitude parameter and the hesitant population.
5.2 SF network
In a weighted SF network, there is a negative correlation between the heterogeneity of node degree distribution and the degree exponent ν. Node degrees in this network follow a power-law distribution, denoted as
• for ν = 2.1
In Figure 5A, it is shown that when the individual hesitation amplitude is relatively low (β = 0.5), the values of the outbreak threshold for α = 0.2, α = 0.5, and α = 0.8 are all relatively large, indicating a first-order discontinuous phase transition. The outbreaks in these cases are rapid and of short duration. In the steady state, the final propagation size is fully spread. In Figure 5C, it is shown that when the individual hesitation amplitude is relatively high (β = 0.5), the outbreaks for α = 0.2 and α = 0.8 exhibit second-order continuous phase transitions. The outbreak point for α = 0.2 occurs earlier than that for α = 0.8, which is different from the case when β = 0.5. This indicates that the impact of changes in the hesitation amplitude β on the propagation varies depending on the hesitation degree α. For α = 0.5, the outbreak exhibits a first-order discontinuous phase transition. Additionally, when the individual hesitation amplitude is larger, the outbreaks occur earlier, and there is evidence of cross-contagion.
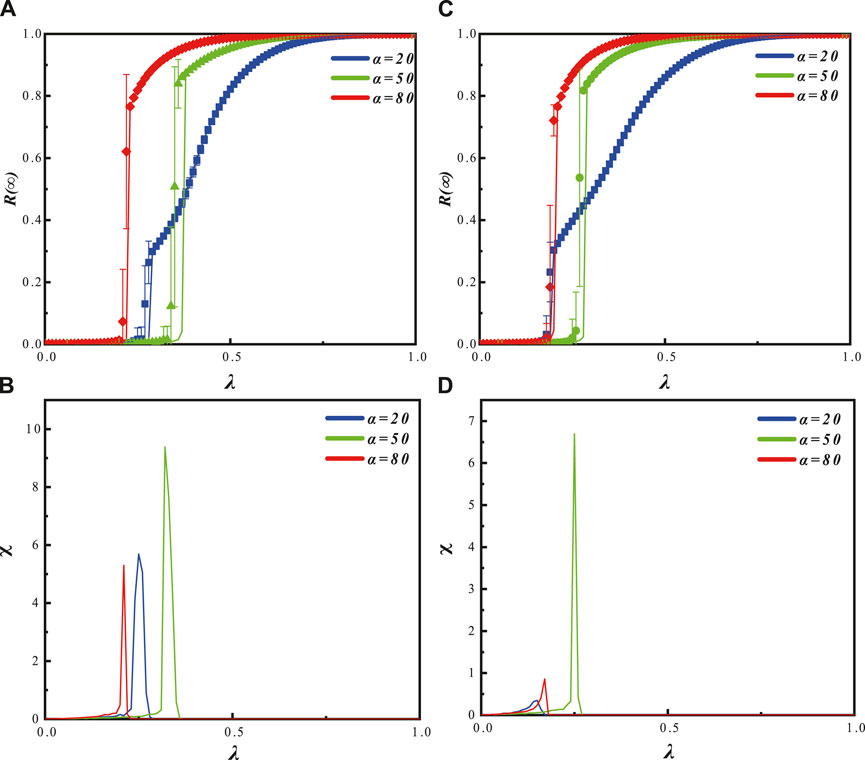
Figure 5. The graph shows the effects of the hesitation degree parameter α and the propagation probability λ on the information outbreak size R (∞) and the relative variance of the final adoption range in an SF-SF network with a fixed hesitation amplitude parameter β, where the heterogeneity parameter V is set to 2.1. Graphs (A) (β = 0.5) and (C) (β = 0.8) illustrate the influence of α on the information outbreak size as the propagation probability varies. The symbols represent simulation results, while the lines depict theoretical predictions. Different propagation patterns of information are observed for different values of α. Graphs (B) (β = 0.5) and (D) (β = 0.8) display the distribution of the relative variance of the adoption range for different α values as the propagation probability changes. They correspond to the variations observed in graphs (A, C), respectively. The remaining parameters are set as ρ0 and γ = 1.
In Figure 5B, when β = 0.5, the relative variance of the adoption range first reaches its outbreak point for α = 0.8, followed by α = 0.2, and finally α = 0.5. The saturation order of the relative variance is α = 0.8, α = 0.2, α = 0.5. In Figure 5D, when β = 0.8, the relative variance of the adoption range first reaches its outbreak point for α = 0.2, followed by α = 0.8, and finally α = 0.5. The saturation order of the relative variance is α = 0.2, α = 0.8, α = 0.5.
Figure 6 represents the joint effect of the hesitation amplitude parameter α and the hesitation degree parameter β on the final adoption range R (∞) in an ER network. Based on different phase transition patterns, Figure 6A can be divided into three regions. In regions I (0.84 < α ≤ 1) and III (0 < α ≤ 0.32), as λ increases, there is a continuous second-order phase transition. This is because when α is large (dominance of ordinary state) or small (dominance of hesitant state), in layer A (ordinary state adoption) and layer B (hesitant state adoption), there is a single-layer outbreak triggered by the outbreak of the other layer, resulting in continuous propagation. In region II (0.32 < α ≤ 0.84), as λ increases, there is a discontinuous first-order phase transition. This is because both layers simultaneously undergo an outbreak, and the outbreak occurs relatively late, indicating that there is no dominant propagating layer. In region III, as λ increases, there is a continuous second-order phase transition, similar to region I. Comparing Figures 6A, B, it can be observed that when the hesitation amplitude is higher, a larger λ is required to achieve the same adoption range.
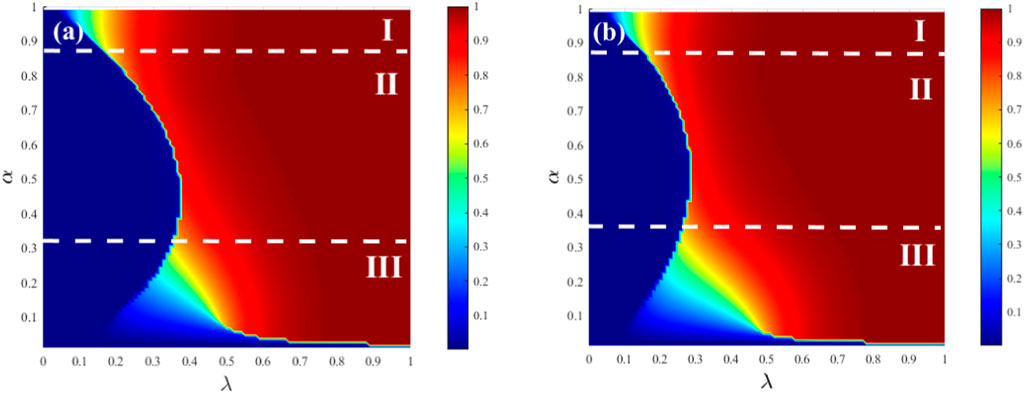
Figure 6. The graphs represent the relationship between the information outbreak size and the hesitation degree parameter α and the propagation probability λ in an SF-SF network with ν = 2.1, while the hesitation amplitude parameter β is fixed. In Graph (A), the hesitation amplitude parameter β is set to 0.5, while in graph (B), it is set to 0.8. The remaining parameters are set as ρ0 and γ = 1.
• for ν = 4
Figure 7A indicates that when the individual hesitation amplitude is relatively low (β = 0.5), the outbreaks for α = 0.2 and α = 0.8 exhibit second-order continuous phase transitions. The outbreaks occur earlier compared to α = 0.5, but the growth rate is slower for α = 0.2 compared to α = 0.8. For α = 0.5, the outbreak shows a first-order discontinuous phase transition. The outbreak occurs later but with a faster growth rate, and in the end, the propagation is fully spread. Figure 7C shows that when the individual hesitation amplitude is relatively high (β = 0.8), the propagation patterns are similar to those in Figure 7A, but the outbreaks occur earlier. Additionally, there is evidence of cross-contagion in the propagation. Furthermore, for α = 0.2 and α = 0.8, the outbreak point occurs earlier for α = 0.2 compared to α = 0.8, indicating that the impact of changes in the hesitation amplitude β on the propagation varies depending on the hesitation degree α.
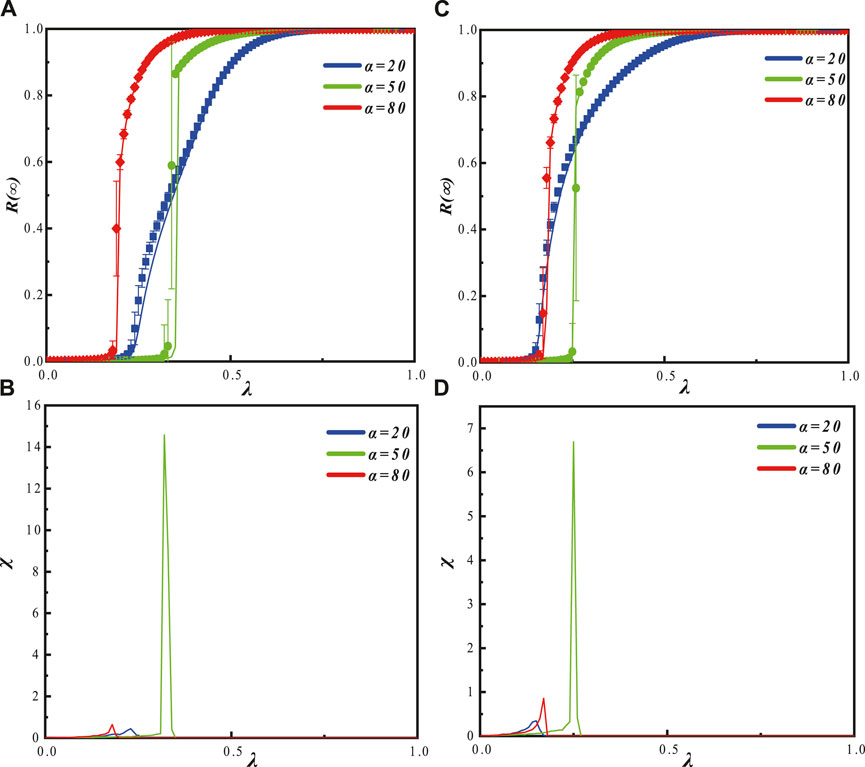
Figure 7. ν = 4, with a fixed hesitation amplitude parameter β, the graphs (A) (β = 0.5) and (C) (β = 0.8) illustrate the effects of the hesitation degree parameter α and the propagation probability λ on the information outbreak size R (∞) and the relative variance of the final adoption range. Graphs (A) and (C) show the impact of α on the information outbreak size as the propagation probability varies. The symbols represent simulation results, while the lines depict theoretical predictions. Different propagation patterns of information are observed for different values of α. Graphs (B) (β = 0.5) and (D) (β = 0.8) display the distribution of the relative variance of the adoption range for different α values as the propagation probability changes. They correspond to the variations observed in graphs (A) and (C), respectively.
In Figure 7B, when β = 0.5, the relative variance of the adoption range first reaches its outbreak point for α = 0.8, followed by α = 0.2, and finally α = 0.5. The saturation order of the relative variance is α = 0.8, α = 0.2, α = 0.5. In Figure 7D, when β = 0.8, the relative variance of the adoption range first reaches its outbreak point for α = 0.2, followed by α = 0.8, and finally α = 0.5. The saturation order of the relative variance isα = 0.2, α = 0.8, α = 0.5.
Figure 8 represents the process of change in four stages. In regions I (0.75 < α ≤ 1) and III(0.05 < α ≤ 0.41), as λ increases, there is a continuous second-order phase transition. This is because when α is large (dominance of the ordinary state) or small (dominance of the hesitant state), in layer A (adoption of the ordinary state) and layer B (adoption of the hesitant state), there is a single-layer outbreak triggered by the outbreak of the other layer, resulting in continuous propagation. In region II(0.41 < α ≤ 0.75), as λ increases, there is a discontinuous first-order phase transition. This is because both layers simultaneously undergo an outbreak, and the outbreak occurs relatively late, indicating that there is no dominant propagating layer. In region IV(0 < α ≤ 0.05), there is no growth, indicating the absence of information outbreaks in this region. Additionally, from the Figures 8A, B, it can be observed that as β decreases, the propagation becomes slower, indicating a positive correlation between the hesitation amplitude parameter and the hesitant population.
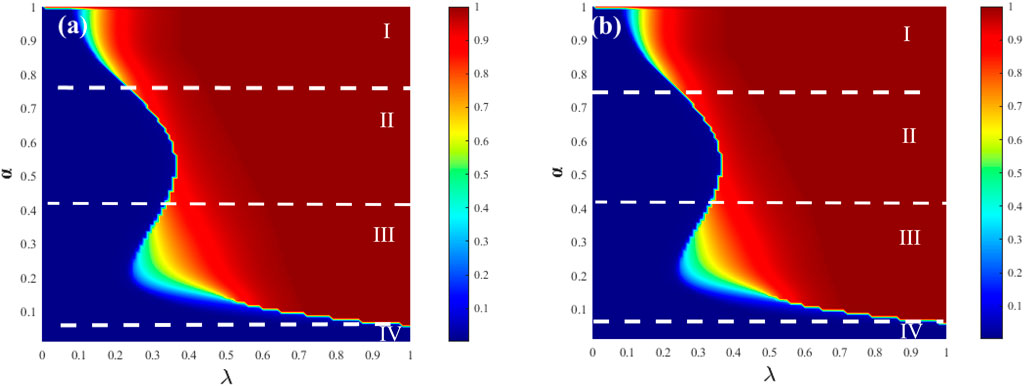
Figure 8. The graphs illustrate the relationship between the information outbreak size and the hesitation degree parameter α and the propagation probability λ in an SF-SF network with v = 4, while the hesitation amplitude parameter β is fixed. In graph (A), the hesitation amplitude parameter β is set to 0.5, while in graph (B), it is set to 0.8. The remaining parameters are set as ρ0 and γ = 1.
6 Conclusion
In real-life, individuals exhibit different social behaviors within various social networks. To analyze the propagation mechanisms and investigate heterogeneous adoption behavior in a heterogeneous network of the same population, this study proposes a dual-layer heterogeneous adoption information propagation network model from both simulation and theoretical perspectives. A heterogeneous threshold function based on realistic psychological research is designed, and extensive experiments demonstrate the consistent results between simulations and theory.
This paper focuses on the innovative aspect of heterogeneous adoption behavior within a dual-layer model and explores the propagation of heterogeneous behavior within the same population in a dual-layer heterogeneous network. Through extensive simulation and theoretical analysis in SF and ER networks, it is observed that when either layer dominates, the final adoption range exhibits a second-order continuous phase transition. In the absence of a clear dominant layer, a first-order discontinuous phase transition occurs with the presence of cross-propagation phenomena. The propagation process and modes are influenced by factors such as hesitation parameters, degree heterogeneity parameters, and propagation probabilities, ultimately leading to complete propagation.
The inter-layer adoption heterogeneity in information propagation networks has a crucial impact, yet there is limited research in this area. This paper rigorously models and analyzes the significant influence of heterogeneous adoption behavior within multi-layer networks on information propagation. The study also provides a new direction for information propagation in multi-layer heterogeneous networks. However, this article has certain limitations. Firstly, it does not use real datasets, lacks standardized data representing human behavioral characteristics, and cannot extensively validate the behavior propagation with real-world data. Secondly, it does not consider several conventional parameters that may influence the research process, such as weights and fluctuation-based adoption. To emphasize the influence of heterogeneous adoption behavior within this model, other parameters were reduced to better highlight the significance of studying heterogeneous adoption behavior. It is hoped that more experts and scholars will pay attention to this field and further expand the research.
Data availability statement
The raw data supporting the conclusion of this article will be made available by the authors, without undue reservation.
Author contributions
SC: Writing–review and editing, Writing–original draft, Visualization, Software, Project administration, Investigation, Formal Analysis, Data curation. XZ: Writing–review and editing, Writing–original draft, Visualization, Validation, Resources, Methodology, Investigation, Formal Analysis, Conceptualization.
Funding
The author(s) declare that no financial support was received for the research, authorship, and/or publication of this article.
Acknowledgments
We would like to thank the reviewers for their insightful comments on the manuscript, as their remarks led to an improvement of the work.
Conflict of interest
The authors declare that the research was conducted in the absence of any commercial or financial relationships that could be construed as a potential conflict of interest.
Publisher’s note
All claims expressed in this article are solely those of the authors and do not necessarily represent those of their affiliated organizations, or those of the publisher, the editors and the reviewers. Any product that may be evaluated in this article, or claim that may be made by its manufacturer, is not guaranteed or endorsed by the publisher.
References
1. Kobayashi T, Ogisu Y, Onaga T. Unstable diffusion in social networks. J Econ Dyn Control (2022) 146:104561. doi:10.1016/j.jedc.2022.104561
2. Furutani S, Shibahara T, Akiyama M, Aida M. Analysis of homophily effects on information diffusion on social networks. IEEE Access (2023) 11:79974–83. doi:10.1109/access.2023.3299854
3. Cai X, Xia W, Huang W, Yang H. Dynamics of momentum in financial markets based on the information diffusion in complex social networks. J Behav Exp Finance (2024) 41:100897. doi:10.1016/j.jbef.2024.100897
4. Lin M, Duan L, Li Y, Xiao Q. The roles of information diffusion on financial risk spreading on two-layer networks. Front Phys (2022) 10. doi:10.3389/fphy.2022.905205
5. Gaeta R. A model of information diffusion in interconnected online social networks. ACM Trans Web (2018) 12:1–21. doi:10.1145/3160000
6. Jiang M, Wang M, Kong J. Prototype equilibrium network with group emotional contagion for few-shot emotion recognition in conversation. Int J Machine Learn Cybernetics (2023) 15:2229–46. doi:10.1007/s13042-023-02025-y
7. Yin C, Wang Z, Zhao X. Spatial prediction of highway slope disasters based on convolution neural networks. Nat Hazards (2022) 113:813–31. doi:10.1007/s11069-022-05325-8
8. Yu Y, Yin X. Financial risk avoidance based on the sensor network and edge computing. J Electr Comp Eng (2022) 2022:1–11. doi:10.1155/2022/2028155
9. Wang F. Research on optimization algorithms for artificial intelligence network security management based on all ip internet of things fusion technology. Comput Electr Eng (2024) 115:109105. doi:10.1016/j.compeleceng.2024.109105
10. Tsai K-C, Zhuang Z, Lent R, Wang J, Qi Q, Wang L-C, et al. Tensor-based reinforcement learning for network routing. IEEE J Selected Top Signal Process (2021) 15:617–29. doi:10.1109/jstsp.2021.3055957
11. Bryc W, Wang Y, Kuznetsov A, Wesołowski J. Markov processes related to the stationary measure for the open kpz equation. Probab Theor Relat Fields (2023) 185:353–89. doi:10.1007/s00440-022-01110-7
12. Moser BA, Lunglmayr M. On quasi-isometry of threshold-based sampling. IEEE Trans Signal Process (2019) 67:3832–41. doi:10.1109/tsp.2019.2919415
13. Han JG, Park TH, Moon YH, Eom IK. Efficient markov feature extraction method for image splicing detection using maximization and threshold expansion. J Electron Imaging (2016) 25:023031. doi:10.1117/1.jei.25.2.023031
14. Fan J, Meng J, Liu Y, Saberi AA, Kurths J, Nagler J. Universal gap scaling in percolation. Nat Phys (2020) 16:455–61. doi:10.1038/s41567-019-0783-2
15. Hermon J, Sousi P. A comparison principle for random walk on dynamical percolation. Anim Probab (2020) 48:2952–87. doi:10.1214/20-AOP1441
16. Zhou H, Chen X, He S, Zhu C, Leung VCM. Freshness-aware seed selection for offloading cellular traffic through opportunistic mobile networks. IEEE Trans Wireless Commun (2020) 19:2658–69. doi:10.1109/twc.2020.2967658
17. Shekatkar SM, Barve S. Importance of initial conditions in the polarization of complex networks. EPL (2018) 122:38002. doi:10.1209/0295-5075/122/38002
18. Masuda N, Sakaki M, Ezaki T, Watanabe T. Clustering coefficients for correlation networks. Front Neuroinformatics (2018) 12:7. doi:10.3389/fninf.2018.00007
19. Ding J, Zhang Y, Song K, Li G, Wang W, Liu K. Target controllability of multiplex networks with weighted interlayer edges. IEEE Trans Netw Sci Eng (2024) 11:313–25. doi:10.1109/tnse.2023.3296706
20. Xue X, Pan L, Zheng M, Wang W. Network temporality can promote and suppress information spreading. Chaos Interdiscip J Nonlinear Sci (2020) 30:113136. doi:10.1063/5.0027758
21. Huang P, Chen X-L, Tang M, Cai S-M. Coupled dynamic model of resource diffusion and epidemic spreading in time-varying multiplex networks. Complexity (2021) 2021:1–11. doi:10.1155/2021/6629105
22. Wang J, Cai S, Wang W, Zhou T. Link cooperation effect of cooperative epidemics on complex networks. Appl Math Comput (2022) 437:127537. doi:10.1016/j.amc.2022.127537
23. Wang J, Cai S-M, Zhou T. Immunization of cooperative spreading dynamics on complex networks. Complexity (2021) 2021:1–7. doi:10.1155/2021/6645113
24. Zhang H, Cao L, Fu C, Cai S, Gao Y. Epidemic spreading on multi-layer networks with active nodes. Chaos Interdiscip J Nonlinear Sci (2023) 33:073128. doi:10.1063/5.0151777
25. Ting L, Ahn J. Understanding the roles of interaction and trust in formation of loyalty toward customer-to-customer (c2c) platforms. Asia Pac J Marketing Logistics (2023) 35:2565–81. doi:10.1108/APJML-12-2022-1072
26. Lv H, Zhang B, Li T, Hu S. Construction and analysis of multi-relationship bipartite network model. Complex Intell Syst (2023) 9:5851–63. doi:10.1007/s40747-023-01038-y
27. Huo L, Yu Y. Impact of individual behavior adoption heterogeneity on epidemic transmission in multiplex networks. Chin Phys B (2023) 32:108703. doi:10.1088/1674-1056/acea65
28. Zhang Y-X, Zou L. Research on information dissemination on social networks based on edge-based compartmental theory. Int J Mod Phys B (2021) 35. doi:10.1142/s0217979221502490
Keywords: complex network, nonlinear dynamics, behavioral propagation, heterogeneous network layer, heterogeneous adoption functions
Citation: Cui S and Zhu X (2024) The information propagation mechanism of individual heterogeneous adoption behavior under the heterogeneous network. Front. Phys. 12:1404464. doi: 10.3389/fphy.2024.1404464
Received: 21 March 2024; Accepted: 16 May 2024;
Published: 14 June 2024.
Edited by:
Chengyi Xia, Tiangong University, ChinaReviewed by:
Shimin Cai, University of Electronic Science and Technology of China, ChinaHai-Feng Zhang, Anhui University, China
Xiaoyang Liu, Chongqing University of Technology, China
Copyright © 2024 Cui and Zhu. This is an open-access article distributed under the terms of the Creative Commons Attribution License (CC BY). The use, distribution or reproduction in other forums is permitted, provided the original author(s) and the copyright owner(s) are credited and that the original publication in this journal is cited, in accordance with accepted academic practice. No use, distribution or reproduction is permitted which does not comply with these terms.
*Correspondence: Xuzhen Zhu, emh1eHV6aGVuQGJ1cHQuZWR1LmNu
 Shiru Cui
 Xuzhen Zhu