 Zhongjiang Yu
 Shaoping Yang
94% of researchers rate our articles as excellent or good
Learn more about the work of our research integrity team to safeguard the quality of each article we publish.
Find out more
ORIGINAL RESEARCH article
Front. Phys. , 22 April 2024
Sec. Radiation Detectors and Imaging
Volume 12 - 2024 | https://doi.org/10.3389/fphy.2024.1401857
This article is part of the Research Topic Advanced Deep Learning Algorithms for Multi-Source Data and Imaging View all 10 articles
Introduction: Log anomaly detection is essential for monitoring and maintaining the normal operation of systems. With the rapid development and maturation of deep learning technologies, deep learning-based log anomaly detection has become a prominent research area. However, existing methods primarily concentrate on directly detecting log data in a single stage using specific anomaly information, such as log sequential information or log semantic information. This leads to a limited understanding of log data, resulting in low detection accuracy and poor model robustness.
Methods: To tackle this challenge, we propose LogMS, a multi-stage log anomaly detection method based on multi-source information fusion and probability label estimation. Before anomaly detection, the logs undergo parsing and vectorization to capture semantic information. Subsequently, we propose a multi-source information fusion-based long short-term memory (MSIF-LSTM) network for the initial stage of anomaly log detection. By fusing semantic information, sequential information, and quantitative information, MSIF-LSTM enhances the anomaly detection capability. Furthermore, we introduce a probability label estimation-based gate recurrent unit (PLE-GRU) network, which leverages easily obtainable normal log labels to construct pseudo-labeled data and train a GRU for further detection. PLE-GRU enhances the detection capability from the perspective of label information. To ensure the overall efficiency of the LogMS, the second-stage will only be activated when anomalies are not detected in the first stage.
Results and Discussion: Experimental results demonstrate that LogMS outperforms baseline models across various log anomaly detection datasets, exhibiting superior performance in robustness testing.
Logs are vital for the upkeep of large-scale software systems as they capture crucial data produced during system operation, documenting essential details regarding server and application software activities [1–3]. With the rapid development of the information age, software systems have become increasingly intricate, resulting in a significant surge in log data volume [4, 5]. Analyzing log data allows developers to meticulously assess system status, identify anomalies, and understand their root causes [6]. Timely detection and resolution of anomalies serve as a proactive measure to prevent system crashes and mitigate potential economic losses [7].
In the early stages of log anomaly detection, developers typically relied on manual methods such as keyword searches or simple alert rules set by log investigation tools [8, 9]. However, with the prevalence of large-scale systems today, traditional manual detection methods are no longer adequate [10]. To meet the demands of modern anomaly detection in large-scale systems, extensive research has been conducted on automatic log analysis technology utilizing deep learning [11, 12]. These technologies automate the learning of log patterns and analyze connections to identify potential anomalies effectively. Examples include LogRobust [13], DeepLog [14], and LogAnomaly [15]. Nevertheless, most existing methods focus on direct detection of log data using specific anomaly information in a single stage. This limited perspective results in lower detection accuracy and model robustness.
To overcome this limitation, we introduce LogMS, a multi-stage log anomaly detection method based on multi-source information fusion and probability label estimation. Prior to anomaly detection, logs are parsed by Drain [16] and vectorized based on TF-IDF to capture semantic information. A multi-source information fusion-based long short-term memory (MSIF-LSTM) network is proposed for the first-stage anomaly log detection, enhancing anomaly detection by fusing semantic information, sequential information, and quantitative information. Subsequently, we introduce a probability label estimation-based gate recurrent unit (PLE-GRU) network, which leverages easily obtainable normal log labels to construct pseudo-labeled data and train a GRU for further detection. PLE-GRU enhances the detection capability from the perspective of label information. To ensure the overall efficiency of the LogMS, the second-stage will only be activated when anomalies are not detected in the first stage. By modeling the correlation between log data from two stages and three perspectives, LogMS effectively mines log data to detect anomalies. The key contributions of this paper include:
1) Introducing LogMS, a multi-stage log anomaly detection method employing multi-source information fusion and probability label estimation to capture deeper relationships among log sequences, thereby enhancing anomaly detection performance.
2) Conducting systematic experiments on the HDFS [17] and BGL [18] dataset to evaluate the LogMS model. The results demonstrate the method’s effectiveness in detecting various anomalous logs, showing significant improvements in accuracy and robustness compared to baseline models.
Anomaly detection techniques based on automated log analysis can be broadly classified into two categories: supervised methods and unsupervised methods.
The supervised approach [13] involves training the model with labeled training data and then applying anomaly detection on log data. However, in practical scenarios, researchers have noted that many existing log anomaly detection studies have not met expectations [19]. Most models assume a closed-world assumption, which includes the stability of log data over time and a known set of log events for training and testing [20]. Yet, due to the evolving nature of log data, unforeseen log events or sequences often arise. To tackle such log instability issues, Zhang et al. [13] introduced a novel log-based anomaly detection method named LogRobust. This method extracts semantic information from log events, transforms it into semantic vectors, and employs an attention-based Bi-LSTM model for anomaly detection. By capturing contextual information and learning diverse log event features, LogRobust effectively identifies and manages unstable log events and sequences. In fact, semantic information is a vital component in natural language understanding [21, 22], and logs can be understood as a special form of natural language. Furthermore, Lu et al. [23] pioneered a detection model based on Convolutional Neural Network (CNN) [24] in log-based anomaly detection, showcasing the potential of CNN in this domain. Their CNN-based method incorporates logkey2vec embedding, three one-dimensional convolutional layers, a dropout layer, and a max-pooling layer. Initially, log content is numerically encoded, and logkey2vec generates embeddings, which are then passed through convolutional layers with varying filters. The max-pooling layer selects the maximum feature value, and a fully connected softmax layer produces probability distribution results. In experiments on anomaly detection in Hadoop Distributed File System (HDFS) logs, the CNN-based approach outperformed Long Short-Term Memory (LSTM) and Multilayer Perceptron (MLP) methods in accuracy.
Supervised methods rely on annotated training data, which requires high data quality. However, in real-world scenarios, log data is very extensive, making data annotation impractical. Furthermore, log data also suffers from class imbalance issues, where abnormal events are usually of relatively small scale, while normal events dominate the vast majority, leading to uneven data distribution. When dealing with such imbalanced data situations, supervised learning algorithms may tend to predict normal events while ignoring abnormal events.
In contrast to supervised methods, unsupervised methods offer the advantage of not requiring annotated data [25]. This characteristic makes them well-suited for real-world environments with abundant unlabeled log data. Essentially, unsupervised methods aim to establish a baseline of normal log data by analyzing internal data correlations such as sequential relationships and quantitative associations. Any data that deviates from this established baseline is classified as anomalous. For instance, Du et al. [14] introduced the DeepLog model, which treats system logs as natural language sequences and employs Long Short-Term Memory (LSTM) networks for unsupervised log anomaly detection. The model initially learns log patterns by examining sequential relationships between log events and then uses these patterns for log prediction. This pioneering approach to anomaly detection has since been widely embraced in subsequent research. Another noteworthy model, LogAnomaly developed by Ma et al. [15], also represents log streams as natural language sequences and introduces a simple yet effective semantic information extraction method called template2vec. This method can simultaneously identify sequential and quantitative log anomalies. LogAnomaly comprises offline learning and online detection components. In the offline learning phase, templates are extracted from historical logs using FT-Tree, and the logs are matched with these templates. Subsequently, log sequences are converted into template vector sequences through template2vec. LSTM models are then used to extract sequential and quantitative features from log sequences to determine anomalies based on these features. Periodic offline learning, such as weekly updates, ensures the integration of newly emerged log templates into the updated offline models. In the online detection component of LogAnomaly, real-time logs are matched with existing templates. If a match is found, the log is converted into a template vector. Otherwise, based on template vector similarities, the real-time log’s “temporary” template vector is approximated to an existing template vector. Consequently, each real-time log is associated with a template vector, and real-time logs are converted into template vector sequences. By leveraging the LSTM model trained in the offline learning phase, LogAnomaly can identify anomalous log sequences. Additionally, Farzad et al. [26] proposed a novel unsupervised log anomaly detection model that integrates Isolation Forests with two deep autoencoder networks. Autoencoders facilitate feature learning for subsequent anomaly detection, while Isolation Forests are employed for positive sample prediction.
Unsupervised methods struggle to determine the threshold range of abnormal logs, and log data typically exhibit complex data distributions, containing multiple categories and patterns, some of which may represent normal behavior while others may indicate anomalous behavior. Therefore, in unsupervised learning, without explicit labels to guide the learning process, models find it difficult to accurately discern whether logs are abnormal.
To address the above issues, this paper introduces a multi-stage log anomaly detection method named LogMS, which relies on multi-source information fusion and probability label estimation. The architecture of LogMS is depicted in Figure 1, which comprises the following components: Log Parsing and Semantic Vectorization, MSIF-LSTM, and PLE-GRU.
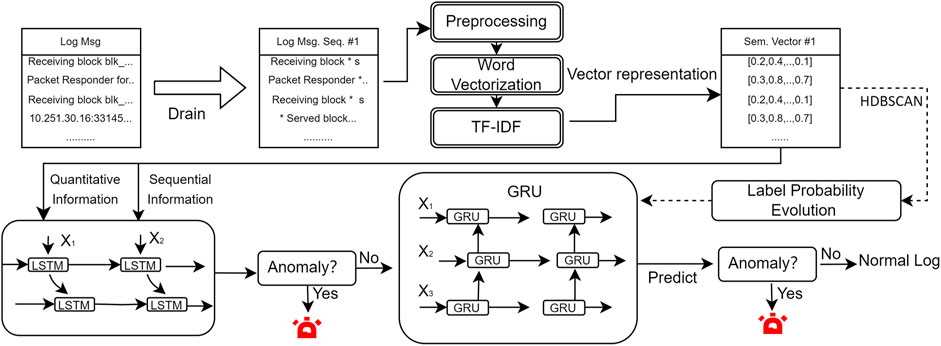
Figure 1. The overall architecture of LogMS.
Raw log messages are commonly unstructured as developers have the flexibility to create free-text log messages within the source code. Hence, the initial phase in log anomaly detection involves log parsing, which aims to convert unstructured log messages into structured events. With the deepening of research on log anomaly detection, there have been many ready-to-use parsing tools that have emerged, such as Spell [27], Drain [16], Brain [28], and DivLog [29]. In this study, we have selected Drain as our log parsing tool due to its proven effectiveness and accuracy. Upon receiving a new raw log message, Drain initiates preprocessing using basic regular expressions guided by domain expertise. Subsequently, the tool searches for a log group (referred to as a leaf node of the tree) by following the specific rules embedded in the internal nodes of the tree. If an appropriate log group is identified, the incoming log message is compared with the stored log event in that group. If no suitable log group is found, a new log group is created based on the incoming log message. An illustration of log message parsing using Drain is provided in Figure 2. For instance, in the case of the initial line of the raw unstructured log message “Receiving block blk_579248908079 sc:/10.251.215.16:33145 dest:/10.251.30.6 … ,” Drain extracts the data block name, source address, and destination address by replacing them with wildcards, resulting in the structured log event “Receiving * src: * dest:*.”

Figure 2. Log parsing by Drain.
In this section, we will preprocess and vectorize the parsed log events following a structured workflow as depicted in Figure 3. This process encompasses preprocessing, word vectorization, and TF-IDF-based semantic vectorization.
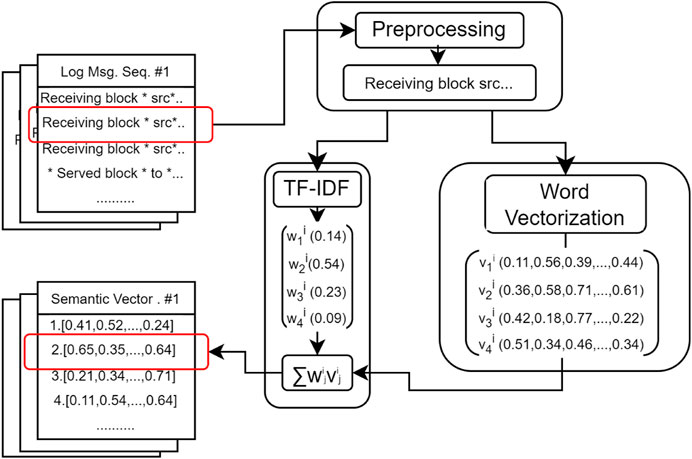
Figure 3. Preprocessing and semantic vectorization.
Preprocessing: The parsed log events often contain non-character tokens (such as separators, operators, and punctuation), stop words (like “a” and “the”), and compound words (e.g., “TypeDeclaration” composed of “type” and “declaration,” or “isCommitable” composed of “is” and “Commitable”). These elements can impede subsequent processes such as vectorization and anomaly detection, necessitating further preprocessing of log events. Specifically, all non-character tokens and stop words will be eliminated, and compound words will be segmented into individual words.
Word Vectorization: Following the preprocessing steps, each word in the log events will be vectorized with the objectives of ensuring high discriminability among different log events and identifying log events with similar semantics. To achieve this, we will utilize FastText [30] to convert words in log events into semantic vectors. FastText, pretrained on the Common Crawl corpus dataset, effectively captures intrinsic word relationships in English sentences, including semantic similarities. Implementation involves invoking the “get_word_vectors” function of FastText to acquire word vectors. The vector representation of the j-th word in the i-th log event is denoted as
TF-IDF-based Semantic Vectorization: The word vectors will be combined using TF-IDF to derive the semantic vector for each log event. In TF-IDF, the Term Frequency (TF) component gauges word importance within a sentence, promoting high discriminability. For instance, a frequently occurring word like “Block” indicates its significance. The TF calculation is defined as:
Here,
Conversely, if a term like “Receiving” is prevalent across all log events, its ubiquity may reduce event distinctiveness. To address this, the Inverse Document Frequency (IDF) in TF-IDF decreases the weight of frequently occurring terms, enhancing the weighting scheme’s discriminative power. IDF calculation is as follows:
Here, N denotes the total log event count and
Finally, the semantic vector vi of the i-th log event is determined as:
As mentioned above, existing methods mainly focus on directly detecting log data in a single stage using specific anomaly information, such as log sequential information or log semantic information. Therefore, we propose a multi-source information fusion-based long short-term memory (MSIF-LSTM) network for the initial stage of anomaly log detection. This method can integrate multiple information such as semantic information, sequential information, and quantitative information through multi-source information fusion. Specifically, we utilize semantic vectors representing semantic information and train the model using both sequential information and quantized information to achieve the fusion of information. We will first introduce the structure of MSIF-LSTM, and then discuss how to obtain the two information to train MSIF-LSTM. During the training process, we update the model parameters using backpropagation.
MSIF-LSTM extends the traditional LSTM architecture to handle multiple information simultaneously. The key components include the cell state (Ct), the hidden state (ht), and multiple sets of gates - forget gates
(1) Forget Gate:
(2) Input Gate:
(3) Candidate Cell State:
(4) Update Cell State:
(5) Output Gate:
(6) Hidden State:
where xt denotes the input log event at time step t, ht−1 represents the previous time step’s hidden state,
Logging procedures are typically executed in accordance with well-defined processes, resulting in the natural emergence of sequential patterns within normal logs. In essence, when observing a sequence of log events, it becomes possible to forecast the subsequent log event in the absence of anomalies. Therefore, we utilize the sequential information to train LSTM. The input of LSTM is a log event sequence (e.g., {vi−3, vi−2, vi−1}), the output is the probability of the next log event.
In addition to sequential information, log event sequences (i.e., sequences formed by multiple log events occurring in order) also contain quantitative information. Typically, during normal program execution, certain invariants and quantitative relationships persist within the logs, regardless of varying inputs and workloads. For example, it is an invariant fact that every opened file will eventually undergo closure at some point. Therefore, in normal scenarios, the frequency of logs indicating“open file” should be equivalent to the frequency of logs denoting “closed file.” These quantitative relationships embedded within the logs serve as valuable indicators of standard program execution behavior. Deviation from these established invariants by a new log event signals an exception within the system’s execution. Therefore, we utilize the quantitative information to train LSTM. First, the we need to calculate the count vector Ak of k-th log event sequence as:
where n denotes the total count of unique log event vectors, ak (vi) signifies the occurrence of vi in the k-th log event sequence. Subsequently, A1, A2, …, Ak, … are fed into LSTM for the acquisition of quantitative insights.
In the first stage, the focus is on modeling some characteristics of the log data itself. The MSIF-LSTM method construct in this stage is unsupervised, lacking the utilization of label information, especially readily available normal log labels, thereby limiting the detection capability. To tackle this problem, we design a semi-supervised learning method called PLE-GRU, which will only be activated when anomalies are not detected in the first stage, aiming to ensure the overall efficiency of the LogMS algorithm. PLE-GRU consists of three parts: log sequence clustering, label probability evaluation, and the structure and training of PLE-GRU. The first two steps entail creating pseudo-labels by utilizing annotated labels from a portion of normal log sequences within the training dataset.
Based on the idea that log sequences that have similar meanings are expected to be assigned identical labels, PLE-GRU utilizes advanced clustering techniques to group log sequences with comparable meanings. In this study, we utilize HDBSCAN [32] to cluster both labeled and unlabeled log sequences within the training set. The reason for this choice is that HDBSCAN is a data clustering technique that does not necessitate predefining the cluster count, unlike approaches such as K-means, and it has fewer parameters and is robust to parameter settings. The implementation of log sequence clustering is achieved through the hdbscan (https://hdbscan.readthedocs.io/en/latest/) package.
Given the complexity of achieving perfect clustering results, PLE-GRU adopts a strategy of assigning probabilistic labels to unlabeled log sequences instead of deterministic ones. This method involves evaluating the probability that an unlabeled log sequence corresponds to each label, thereby reducing the impact of noise introduced during clustering. Specifically, we compute the probability of an unlabeled log sequence belonging to each label based on clustering outcomes. Using HDBSCAN, each log sequence in a cluster receives a score indicating the uncertainty of its cluster membership. This score, ranging from 0 to 1, serves as a measure of confidence in clustering the log sequence with its respective group; a lower score indicates higher confidence. Despite potential uncertainty, assigning a probabilistic label is crucial to align with the initial label estimation framework. By leveraging these principles and the scores from HDBSCAN clustering, each preliminary label is converted into a probabilistic label where P (anomalous) = 1 − score/2 and P (normal) = score/2.
The pseudo-labels derived from the training dataset by estimating label probabilities will be utilized for training a Gated Recurrent Unit (GRU) neural network, establishing a robust and efficient anomaly detection model. GRU is a type of recurrent neural network (RNN) architecture devised to combat the vanishing gradient problem encountered in traditional RNNs. It bears resemblance to LSTM but boasts a simpler structure featuring two primary gates: the update gate and the reset gate. GRU is renowned for its ability to capture long-term dependencies in sequential data effectively, requiring fewer parameters compared to LSTM.
For a log sequence represented as S = {v1, v2, …, vt}, where vt (1 < t < T) denotes the t-th log event, and T signifies the total log events in S, the input to the GRU at time step t is the semantic vector of vt designated as xt. The GRU cell computation involves two key elements: the hidden state (ht) and the update gate (zt) along with the reset gate (rt). The computations for these components at time step t are expressed by the following formulas:
(1) Update Gate:
(2) Reset Gate:
(3) Candidate Hidden State:
(4) Update Hidden State:
At each time step t, xt denotes the input log event, ht−1 stands for the hidden state from the preceding time step, and Wz, Wr, Wh represent weight matrices. The function σ signifies the sigmoid activation, with ∗ indicating element-wise multiplication. The ultimate hidden state is leveraged to predict whether the input log sequence is anomalous.
To evaluate the performance of LogMS, experiments were carried out on the Hadoop Distributed File System (HDFS) dataset and the Blue Gene/L supercomputer (BGL) dataset, followed by a comprehensive analysis of the outcomes. These datasets are commonly utilized in log anomaly detection, with their characteristics outlined in Table 1. The HDFS dataset, generated by over 200 Amazon EC2 nodes, comprises a total of 11,175,629 log messages. These log entries are segmented into distinct log windows based on their corresponding block_id, representing the program execution status within the HDFS system. Among the log entries, 16,838 log blocks (2.93%) indicate system anomalies. On the other hand, the BGL dataset encompasses 4,747,963 log messages from the “Blue Gene/L” supercomputer, which houses 128 K processors at Lawrence Livermore National Laboratory. This dataset spans over 7 months, with experts in the BGL domain manually categorizing each log entry as abnormal or normal. Notably, there are 348,460 abnormal log messages in the BGL dataset. Unlike HDFS, the BGL dataset lacks explicit labels like block_id, making it challenging to extract log sequences effectively.
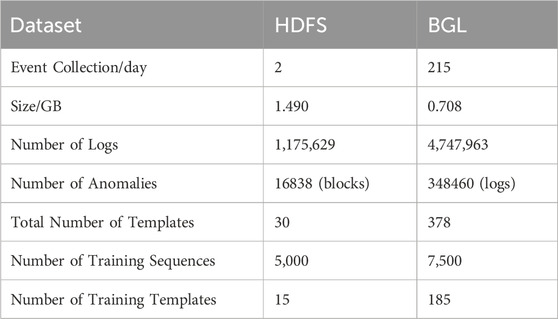
Table 1. Statistics of HDFS and BGL.
After log parsing, a total of 30 HDFS log templates and 378 BGL log templates are obtained. For HDFS, the logs are divided into sequences based on block_id. For BGL, as the logs do not record identifiers for each sequence, a fixed window size of 150 is used to segment the logs into sequences.
In this study, precision, recall, and F1-score are employed as evaluation metrics, commonly utilized in log anomaly detection research [13–15]. Precision measures the proportion of accurately identified abnormal log sequences among all sequences flagged as anomalies by the model, calculated as:
Recall gauges the proportion of correctly identified abnormal log sequences among all actual anomalies, expressed as:
F1-score, the harmonic mean of precision and recall, is calculated as:
Here, TP (True Positive) indicates the count of abnormal log sequences correctly identified by the model, FP (False Positive) represents the number of normal log sequences inaccurately classified as anomalies, and FN (False Negative) denotes the count of abnormal log sequences overlooked by the model.
We implement LogMS based on Python 3.8.3 and PyTorch 1.5.1. All experiments are conducted on a single RTX 3090Ti 24 GB GPU. In MSIF-LSTM, we set the weight decay to 0.0001, momentum to 0.9, initial learning rate to 0.01, use cross-entropy as the loss function, set the mini-batch size to 128, and train for 10 epochs. In PLE-GRU, we set the min_cluster_size parameter in HDBSCAN to 100, min_samples to 100, and train for 20 epochs.
We compare LogMS with the following four widely used methods, and the comparison of the model structures are shown in Table 2.
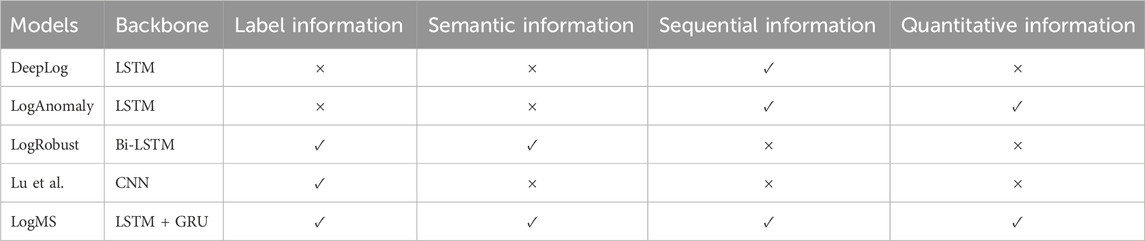
Table 2. Comparison of the model structures of the baseline methods and LogMS.
DeepLog [14]: This method treats system logs as natural language sequences and uses LSTM to model the sequential information of the logs.
LogAnomaly [15]: This method also treats system logs as natural language sequences, but uses LSTM to model sequential and quantitative information of the logs.
LogRobust [13]: This method is able to identify and handle unstable log events and sequences and uses Bi-LSTM to model label and sematic information.
Lu et al. [23]: This method can automatically learn event relationships in system logs and uses CNN to model label information.
Table 3 displays the results of comparative experiments. In HDFS, LogRobust achieves the highest F1 score, mainly due to its higher recall rate. LogMS performs second best, with a F1 score only 0.001 lower than LogRobust, but it has a higher precision by 0.17 compared to LogRobust. The worst performing models are DeepLog and LogAnomaly, mainly because they both not utilize label information and belong to unsupervised methods. Although LogRobust achieves the best results in HDFS, its performance in BGL is even worse than that of LogAnomaly, which does not utilize label information. Meanwhile, LogMS obtained the highest F1 score in BGL. Overall, LogMS performs well in both datasets and exhibited stable results. Compared to other methods, the key feature of LogMS lies in its effective fusion of multiple sources of information, demonstrating that the fusion of semantic, sequential, quantitative, and label information is an effective way to enhance the performance of log anomaly detection.
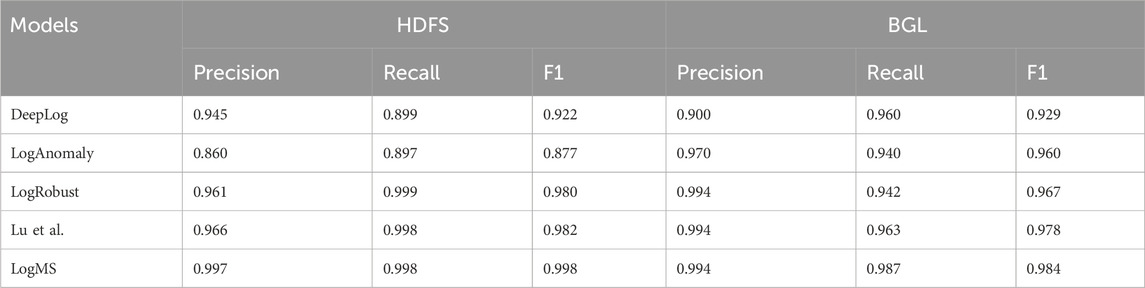
Table 3. The results of comparative experiments on HDFS and BGL.
To assess the effectiveness of each improvement in LogMS, we conduct ablation experiments in HDFS and BGL. We divide LogMS into two parts: MSIF-LSTM, which integrates semantic, sequential, and quantitative information; PLE-GRU, which incorporates label information. LogMS fuses all four types of information. Table 4 presents the results of the ablation experiments.
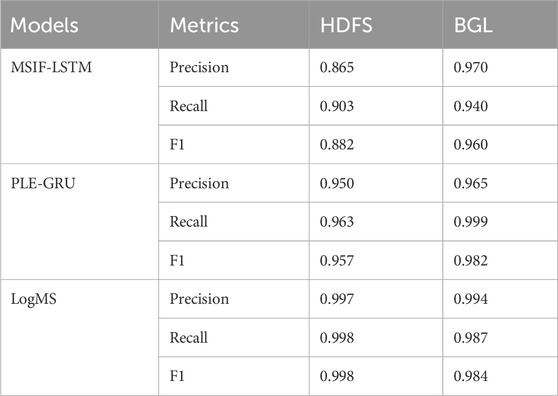
Table 4. The results of ablation experiments on HDFS and BGL.
Based on the experimental results, it is evident that MSIF-LSTM performs better in terms of precision, while PLE-GRU exhibits higher recall. LogMS combines the strengths of both, achieving the best precision and recall simultaneously. It is noteworthy that in the two-stage process of LogMS, MSIF-LSTM serves as the first stage, and only when MSIF-LSTM fails to detect anomalies, it proceeds to the second stage, PLE-GRU. The high precision of MSIF-LSTM in the first stage ensures a low false negative rate, while the high recall of PLE-GRU in the second stage minimizes missing anomalies, thus LogMS effectively integrates the strengths of both approaches.
A significant feature of log data is the substantial class distribution imbalance between normal logs and anomaly logs, as observed in datasets like HDFS where anomalies represent only about 2.9% of the data. Therefore, the ability of a model to deal with such situation is crucial [33]. In order to systematically assess our approach, we introduce various imbalanced scenarios by randomly excluding normal or abnormal log sequences from the HDFS and BGL dataset. We vary the imbalance ratio from 1% to 15%, indicating the percentage of anomalies present in the dataset. This process results in the creation of four synthetic datasets with imbalance ratios set at 0.1%, 0.5%, 1%, 5%, and 10%. To comprehensively evaluate our model, we conduct class imbalance experiments not only across different methods but also on the various components of LogMS. The experimental results are illustrated in Figures 4, 5.
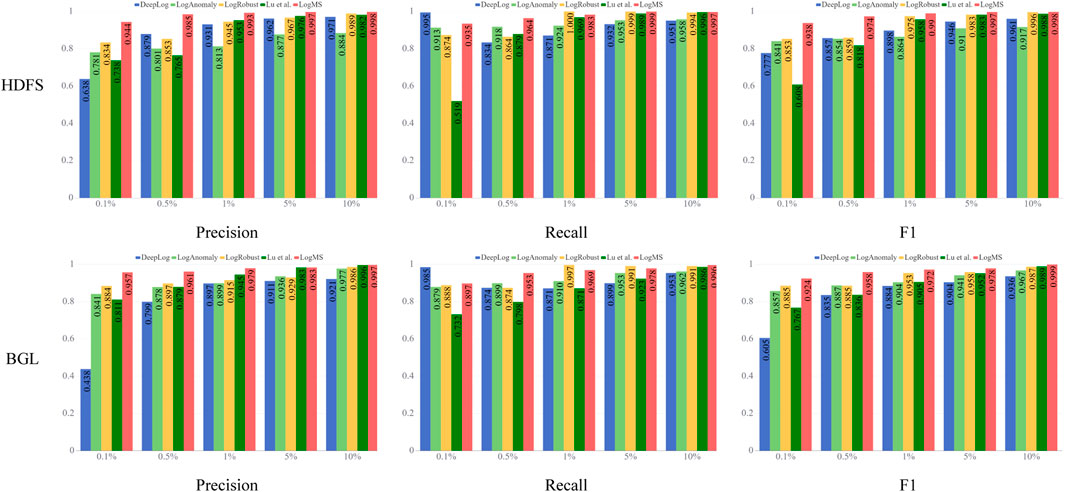
Figure 4. The results of class imbalance experiments in different methods.
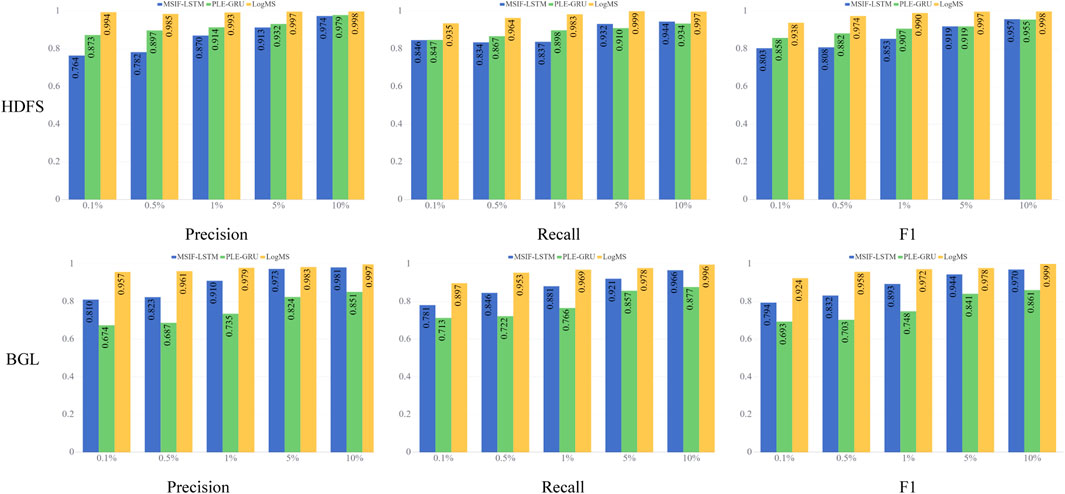
Figure 5. The results of class imbalance experiments in different component of LogMS.
From Figure 4, we can observe that as the proportion of abnormal labels increases, both precision and F1 improve, while recall remains stable. The reason for this phenomenon is as follows: due to the scarcity of positive samples, an increase in the number of positive samples results in an increase in true positives without a significant rise in false positives, leading to an enhancement in precision. However, recall is influenced by the imbalance in samples; when the number of positive samples is low, even with an increase in true positives, the number of false negatives may also rise, causing recall to be unstable and unable to consistently improve with an increase in positive samples. Despite the unstable recall, the improvement in precision leads to an overall increase in the F1 score. Overall, LogMS demonstrates robustness to severe class imbalance, particularly achieving optimal performance at the anomaly ratio of 0.1%.
We can see a similar phenomenon in Figure 5 as in Figure 4. However, the two-stage strategy of LogMS enables the effective integration of both components, thus maintaining the stability of log anomaly detection performance even under class imbalance conditions.
Deep learning-based log anomaly detection models primarily adopt a single-stage detection method and mainly focus on a specific aspect of log information. However, logs contain multiple sources of information (such as semantic information, sequential information, quantitative information, and label information). By focusing solely on a single aspect, the detection models are limited in their understanding of logs, resulting in compromised detection performance and suboptimal robustness. To address this issue, the paper introduces a multi-stage log anomaly detection method named LogMS. This method is based on the fusion of multiple sources of information (i.e., MSIF-LSTM) and probability label estimation (i.e., PLE-GRU), allowing for comprehensive utilization and fusion of various hidden information embedded in log data from multiple perspectives. Experimental results demonstrate that LogMS outperforms baseline models on various log anomaly detection datasets, demonstrating superior performance in robustness testing. In future research, we will consider integrating more sources of information such as system metrics, network traffic, or user behavior patterns to provide more comprehensive insights into log anomalies. By integrating these contextual factors into the detection process, it is possible to improve the accuracy and robustness of log anomaly detection models.
Publicly available datasets were analyzed in this study. This data can be found here: https://github.com/logpai/loghub.
ZY: Data curation, Formal Analysis, Methodology, Writing–original draft. SY: Methodology, Supervision, Writing–review and editing. ZL: Data curation, Formal Analysis, Writing–review and editing. LL: Investigation, Validation, Writing–review and editing. HL: Data curation, Formal Analysis, Writing–review and editing. FY: Formal Analysis, Investigation, Writing–review and editing.
The author(s) declare that financial support was received for the research, authorship, and/or publication of this article. Key Technology Project of China Tobacco Yunnan Industrial (2023ZN04). The funder was not involved in the study design, collection, analysis, interpretation of data, the writing of this article, or the decision to submit it for publication.
Authors ZY, SY, ZL, LL, HL, and FY were employed by China Tobacco Yunnan Industrial Co., Ltd.
All claims expressed in this article are solely those of the authors and do not necessarily represent those of their affiliated organizations, or those of the publisher, the editors and the reviewers. Any product that may be evaluated in this article, or claim that may be made by its manufacturer, is not guaranteed or endorsed by the publisher.
1. Landauer M, Onder S, Skopik F, Wurzenberger M. Deep learning for anomaly detection in log data: a survey. Machine Learn Appl (2023) 12:100470. doi:10.1016/j.mlwa.2023.100470
2. Chen Z, Liu J, Gu W, Su Y, Lyu MR. Experience report: deep learning-based system log analysis for anomaly detection. arXiv preprint arXiv:2107.05908 (2021).
3. Le V-H, Zhang H. Log-based anomaly detection without log parsing. In: 2021 36th IEEE/ACM International Conference on Automated Software Engineering (ASE). IEEE (2021). p. 492–504.
4. Ko J, Comuzzi M. A systematic review of anomaly detection for business process event logs. Business Inf Syst Eng (2023) 65:441–62. doi:10.1007/s12599-023-00794-y
5. Guo H, Yuan S, Wu X. Logbert: log anomaly detection via bert. In: 2021 international joint conference on neural networks (IJCNN). IEEE (2021). p. 1–8.
6. Breier J, Brani sová J. Anomaly detection from log files using data mining techniques. Inf Sci Appl (2015) 339:449–57. doi:10.1007/978-3-662-46578-3_53
7. He S, Zhu J, He P, Lyu MR. Experience report: system log analysis for anomaly detection. In: 2016 IEEE 27th international symposium on software reliability engineering (ISSRE). IEEE (2016). p. 207–18.
8. Han D, Wang Z, Chen W, Wang K, Yu R, Wang S, et al. (2023). Anomaly detection in the open world: normality shift detection, explanation, and adaptation. In , doi:10.14722/ndss.2023.24830NDSS
9. Le V-H, Zhang H. Log-based anomaly detection with deep learning: how far are we? In: Proceedings of the 44th international conference on software engineering (2022). p. 1356–67. doi:10.1145/3510003.3510155
10. Nassif AB, Talib MA, Nasir Q, Dakalbab FM. Machine learning for anomaly detection: a systematic review. Ieee Access (2021) 9:78658–700. doi:10.1109/access.2021.3083060
11. Guo H, Guo Y, Yang J, Liu J, Li Z, Zheng T, et al. Loglg: weakly supervised log anomaly detection via log-event graph construction. In: International Conference on Database Systems for Advanced Applications. Springer (2023). p. 490–501.
12. Lee Y, Kim J, Kang P. Lanobert: system log anomaly detection based on bert masked language model. Appl Soft Comput (2023) 146:110689. doi:10.1016/j.asoc.2023.110689
13. Zhang X, Xu Y, Lin Q, Qiao B, Zhang H, Dang Y, et al. Keratin 6, 16 and 17-critical barrier alarmin molecules in skin wounds and psoriasis. In: Proceedings of the 2019 27th ACM Joint Meeting on European Software Engineering Conference and Symposium on the Foundations of Software Engineering, 8 (2019). p. 807–17. doi:10.3390/cells8080807
14. Du M, Li F, Zheng G, Srikumar V. Deeplog: anomaly detection and diagnosis from system logs through deep learning. In: Proceedings of the 2017 ACM SIGSAC conference on computer and communications security (2017). p. 1285–98. doi:10.1145/3133956.3134015
15. Meng W, Liu Y, Zhu Y, Zhang S, Pei D, Liu Y, et al. Loganomaly: unsupervised detection of sequential and quantitative anomalies in unstructured logs. IJCAI (2019) 19:4739–45. doi:10.24963/ijcai.2019/658
16. He P, Zhu J, Zheng Z, Lyu MR. Drain: an online log parsing approach with fixed depth tree. In: 2017 IEEE international conference on web services (ICWS). IEEE (2017). p. 33–40.
17. Xu W, Huang L, Fox A, Patterson D, Jordan M. Largescale system problem detection by mining console logs. In: Proceedings of SOSP’09 (2009).
18. Oliner A, Stearley J. What supercomputers say: a study of five system logs. In: 37th annual IEEE/IFIP international conference on dependable systems and networks (DSN’07). IEEE (2007). p. 575–84.
19. Wang H, Bah MJ, Hammad M. Progress in outlier detection techniques: a survey. Ieee Access (2019) 7:107964–8000. doi:10.1109/access.2019.2932769
20. Reidemeister T, Jiang M, Ward PA. Mining unstructured log files for recurrent fault diagnosis. In: 12th IFIP/IEEE International Symposium on Integrated Network Management (IM 2011) and Workshops. IEEE (2011). p. 377–84.
21. Bai Y, Shu Z, Yu J, Yu Z, Wu X-J. Proxy-based graph convolutional hashing for cross-modal retrieval. IEEE Trans Big Data (2023) 1–15. doi:10.1109/tbdata.2023.3338951
22. Li L, Shu Z, Yu Z, Wu X-J. Robust online hashing with label semantic enhancement for cross-modal retrieval. Pattern Recognition (2024) 145:109972. doi:10.1016/j.patcog.2023.109972
23. Lu S, Wei X, Li Y, Wang L. Detecting anomaly in big data system logs using convolutional neural network. In: 2018 IEEE 16th Intl Conf on Dependable, Autonomic and Secure Computing, 16th Intl Conf on Pervasive Intelligence and Computing, 4th Intl Conf on Big Data Intelligence and Computing and Cyber Science and Technology Congress (DASC/PiCom/DataCom/CyberSciTech). IEEE (2018). p. 151–8.
24. LeCun Y, Bottou L, Bengio Y, Haffner P. Gradient-based learning applied to document recognition. Proc IEEE (1998) 86:2278–324. doi:10.1109/5.726791
25. Shu Z, Li B, Mao C, Gao S, Yu Z. Structure-guided feature and cluster contrastive learning for multi-view clustering. Neurocomputing (2024) 582:127555. doi:10.1016/j.neucom.2024.127555
26. Farzad A, Gulliver TA. Unsupervised log message anomaly detection. ICT Express (2020) 6:229–37. doi:10.1016/j.icte.2020.06.003
27. Du M, Li F. Spell: streaming parsing of system event logs. In: 2016 IEEE 16th International Conference on Data Mining (ICDM). IEEE (2016). p. 859–64.
28. Yu S, He P, Chen N, Wu Y. Brain: log parsing with bidirectional parallel tree. IEEE Trans Serv Comput (2023) 16:3224–37. doi:10.1109/tsc.2023.3270566
29. Xu J, Yang R, Huo Y, Zhang C, He P. Divlog: log parsing with prompt enhanced in-context learning. In: 2024 IEEE/ACM 46th International Conference on Software Engineering (ICSE). IEEE Computer Society (2024). p. 983.
30. Joulin A, Grave E, Bojanowski P, Douze M, Jégou H, Mikolov T (2016). Fasttext. zip: compressing text classification models. arXiv preprint arXiv:1612.03651
31. Shu Z, Li L, Yu J, Zhang D, Yu Z, Wu X-J. Online supervised collective matrix factorization hashing for cross-modal retrieval. Appl intelligence (2023) 53:14201–18. doi:10.1007/s10489-022-04189-6
32. McInnes L, Healy J, Astels S. hdbscan: hierarchical density based clustering. J Open Source Softw (2017) 2:205. doi:10.21105/joss.00205
Keywords: log anomaly detection, multi-source information fusion, probability label estimation, long short-term memory, gate recurrent unit
Citation: Yu Z, Yang S, Li Z, Li L, Luo H and Yang F (2024) LogMS: a multi-stage log anomaly detection method based on multi-source information fusion and probability label estimation. Front. Phys. 12:1401857. doi: 10.3389/fphy.2024.1401857
Received: 16 March 2024; Accepted: 05 April 2024;
Published: 22 April 2024.
Edited by:
Zhenqiu Shu, Kunming University of Science and Technology, ChinaReviewed by:
Kun Cheng, Beihang University, ChinaCopyright © 2024 Yu, Yang, Li, Li, Luo and Yang. This is an open-access article distributed under the terms of the Creative Commons Attribution License (CC BY). The use, distribution or reproduction in other forums is permitted, provided the original author(s) and the copyright owner(s) are credited and that the original publication in this journal is cited, in accordance with accepted academic practice. No use, distribution or reproduction is permitted which does not comply with these terms.
*Correspondence: Shaoping Yang, eWFuZ3NwQHluenktdG9iYWNjby5jb20=
Disclaimer: All claims expressed in this article are solely those of the authors and do not necessarily represent those of their affiliated organizations, or those of the publisher, the editors and the reviewers. Any product that may be evaluated in this article or claim that may be made by its manufacturer is not guaranteed or endorsed by the publisher.
Research integrity at Frontiers
Learn more about the work of our research integrity team to safeguard the quality of each article we publish.