 Gao Wang
 Jiangwei Li
 Haishu Tan
 Xiaosong Li
- 1State Key Laboratory of Dynamic Measurement Technology, North University of China, Taiyuan, China
- 2School of Physics and Optoelectronic Engineering, Foshan University, Foshan, China
Full-field optical angiography (FFOA)—a real-time non-invasive imaging technique for extracting biological blood microcirculation information—contributes to an in-depth understanding of the functional and pathological changes of biological tissues. However, owing to the limitation of the depth-of-field (DOF) of optical lenses, existing FFOA imaging methods cannot capture an image containing every blood-flow information. To address this problem, this study develops a long-DOF full-field optical angiography imaging system and proposes a novel multi-focus image fusion scheme to expand the DOF. First, FFOA images with different focal lengths are acquired by the absorption intensity fluctuation modulation effect. Second, an image fusion scheme based on gradient feature detection in a nonsubsampled contourlet transform domain is developed to capture focus features from FFOA images and synthesize an all-focused image. Specifically, FFOA images are decomposed by NSCT into coefficients and low-frequency difference images; thereafter, two gradient feature detection-based fusion rules are used to select the pre-fused coefficients. The experimental results of both phantom and animal cases show that the proposed fusion method can effectively extend the DOF and address practical FFOA image defocusing problems. The fused FFOA image can provide a more comprehensive description of blood information than a single FFOA image.
1 Introduction
Blood microcirculation information is critical for gaining insights into both the normal development and pathogenesis of diseases such as cancer and diabetic retinopathy [1–3]; for example, microvascular rarefaction is a hallmark of essential hypertension [4]. Therefore, it is essential to accurately depict high-resolution full-field images of blood vessels to enhance the accuracy of biological studies. In existing full-field optical imaging methods, such as full-field optical coherence tomography [5], laser scatter contrast imaging [6], and full-field optical angiography (FFOA) [7, 8], the imaging speed and sensitivity of bio-optical imaging can be slightly improved, but the imaging range is limited to the depth-of-field (DOF). In addition, high-resolution images are usually obtained by increasing the magnification of the lens, which further reduces the DOF range and cannot ensure that all relevant objects in focus are distinctly imaged. The multi-focus image fusion technique is a feasible method for addressing the issue of a limited DOF. Images of the same scene with different DOFs can be obtained by changing the focal length; thereafter, the focus features from these images are extracted to synthesize a sharp image to extend the DOF.
Current multi-focus image fusion methods can be essentially classified into four categories [9]: transform domain [10–13], spatial domain [14–19], sparse representation (SR) methods [20–25], and deep learning methods [26–30]. The spatial domain methods implement image fusion mainly by detecting the activity level of pixels or regions. For example, Xiao et al. [31] used the multi-scale Hessian matrix to acquire the decision maps. SAMF [32]proposes a new small-area-aware algorithm for enhancing object detection capability. MCDFD [33]proposes a new scheme based on multi-scale cross-differencing and focus detection for blurred edges and over-sharpening of fused images. Spatial domain methods are known for their simplicity and speed; however, accurately detecting pixel activity poses a significant challenge. Inaccurate pixel activity detection may lead to block artifact occurrence and introduce spectral distortions of the fusion results. Since the overcomplete dictionaries of SR methods contain richer basis atoms, SR methods are more robust to misalignment than spatial domain methods [34]. Tang et al. [35] used joint patch grouping and informative sampling to build an overcomplete dictionary for SR. SR is usually time-consuming, and sparse coding using SR is complex; furthermore, it inevitably loses important information of source images. Recently, deep learning methods have gained widespread attention owing to their excellent feature representation capabilities. Liu et al. [26] first applied a CNN to obtain the initial decision of focused and out-of-focus regions. Thereafter, other authors proposed extensive deep learning image fusion algorithms, including generative adversarial network-based [36], encoder-decoder-network based [37], and transform-based methods [27]. REOM [38] measure the similarity between the source images and the fused image based on the semantic features at multiple abstraction levels by CNN. AttentionFGAN [39] used dual discriminators in order to avoid the modal unevenness caused by a single discriminator. Tang et al. [40] proposed an image fusion method based on multiscale adaptive transformer, which introduces adaptive convolution to perform convolution operation to extract global contextual information. CDDFuse [41] propose a novel correlation-driven feature decomposition fusion network, to tackle the challenge in modeling cross-modality features and decomposing desirable modality-specific and modality-shared features. However, these training data lack consistency with real multi-focal images; therefore, real multi-focal images cannot be processed effectively. Transform domain methods decompose images into different scales, analogous to the process of human eyes handling visual information ranging from coarse to fine; thus, the latter can achieve a better signal-to-noise ratio [42]. Transform domain methods usually include pyramid transform [43], wavelet transform [44, 45], and nonsubsampled contourlet transform (NSCT) [46, 47].
In a previous study, a large-DOF FFOA method was developed that uses the contrast pyramid fusion algorithm (CPFA) to achieve image fusion [48]. Pyramid transform is a popular tool that is simple and easy to implement; however, it creates redundant data in different layers and easily loses high-frequency details. In comparison with the pyramid transform, the wavelet transform has attracted more attention owing to its localization, direction, and multi-scale properties. Nevertheless, discrete wavelet transform cannot accurately represent anisotropic singular features [16]. Because it is flexible, multi-scale, multi-directional, and sift-invariant, NSCT has gained an encouraging reputation for multi-focus image fusion and can decompose images in multiple directions and obtain fusion results with more correct information. Li et al. [16] performed comprehensive experiments to analyze the performance of different multi-scale transforms in image fusion and their experimental results demonstrated that the NSCT can overperform other multi-scale transforms in terms of multi-focus image fusion. This study devised a long-DOF full-field optical technique based on gradient feature detection (GFD). A series of FFOA images with different focal lengths were first acquired by the absorption intensity fluctuation modulation (AIFM) effect [8]. Subsequently, a novel multi-focus image fusion method in the NSCT domain was developed to fuse the source FFOA images to extend the DOF. The proposed fusion scheme includes the following three steps. First, the initial images (FFOA images with different DOFs) are decomposed by NSCT into corresponding low-frequency coefficients (LFCs); thereafter, a series of high-frequency directional coefficients (HFDCs), and low-frequency difference images (LFDIs) are obtained by subtracting the LFCs from the source images. Second, two gradient feature detection-based fusion rules are proposed to select the pre-fused coefficients. Finally, the fused image is generated by taking the inverse NSCT (INSCT) on different pre-fused coefficients. This article compared the fusion results using objective assessment and subjective visual evaluation. The experimental results show that the proposed GFD fusion scheme can yield better blood microcirculation images and effectively retain the focus information in the source image.
The main contributions of this study are as follows:
(1) This article constructs a full-field optical imaging system to acquire phantom and animal FFOA images with different DOFs.
(2) This article proposes a gradient feature detection-based image fusion scheme in the NSCT domain that can effectively fuse FFOA images to extend the DOF.
(3) This article develops two fusion rules to fuse the LFCs and HFDCs of NSCT that can be used to extract more detailed and structured FFOA image information, thereby improving the visual perception of the fused images.
The remainder of this paper is organized as follows. Section 2 introduces the imaging system, acquisition of FFOA images, and proposed fusion model based on GFD in the NSCT domain. Section 3 focuses on the experimental results and discussion. Finally, Section 4 provides the conclusions of the study.
2 Materials and methods
2.1 System setup
A schematic of the constructed system is given in Figure 1. The 80-mW laser beam (λ0 = 642 nm, bandwidth = 10 nm) from the semiconductor is reflected by the beam splitter (BS), thus vertically illuminating the sample; the speckle pattern is recorded by a complementary metal-oxide semiconductor (CMOS) camera (acA2000-340km, Basler. Pixel size, 5.5 μm × 5.5 μm; sampling rate, 42 fps; exposure time, 20 ms). Samples were placed on the optical mobile platform (OMP), and the focal length in the z-direction was changed by computer control of the electric zoom lens (EZL) to obtain FFOA images (
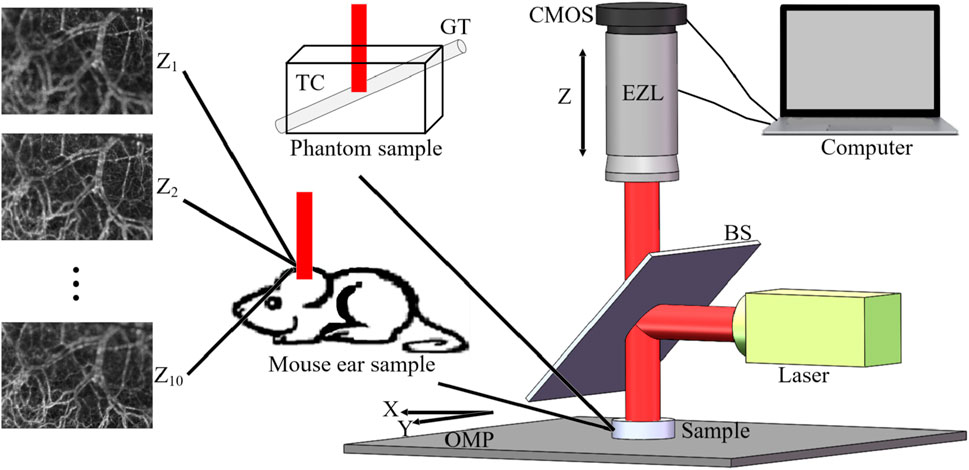
Figure 1. GFD FFOA fusion system. Z1 to Z10 represent 10 FFOA images with different foci, OMP is the optical mobile platform, BS is the beam splitter, EZL is electric zoom lens, TC is the transparent container, and GT is the glass tube.
2.2 Acquisition of FFOA image
First, describe the theory of the AIFM effect in realizing the FFOA image [8]. Under irradiation from a low-coherence light source, the red blood cell (RBC) absorption coefficient is significantly higher than the background tissue. In the vascular region, when the RBCs flow, a high-frequency fluctuation signal (IAC) is generated by the combination of different absorptions of RBCs and background tissue; the above phenomenon is called the AIFM effect. However, the region outside the blood vessels produces a DC signal (IDC) that does not fluctuate over time because it only contains background tissue. Thereafter, the time sequences (IAC) and (IDC) are independently demodulated by respectively applying a high-pass filter (HPF) and low-pass filter (LPF) in the frequency domain. The employed formulas are as Eq. (1):
where
In current FFOA methods [7, 8], the imaging parameter is called averaged modulation depth (AMD), defined as the ratio of the average dynamic signal intensity
2.3 Proposed fusion scheme for FFOA images
The proposed fusion scheme is illustrated in Figure 2. For a convenient explanation, only two FFOA images are used for the entire process, and the above process is iterated to achieve the fusion of three or even more images. The fusion scheme mainly includes three steps. First, the NSCT is performed on the source images to obtain the corresponding LFCs and HFDCs, and LFDIs are obtained by subtracting the LFCs from the source images. Thereafter, a sum-modified-Laplacian and local energy (SMLE) is used to fuse the LFCs, and the structural tensor and local sharpness change metric (SOLS) is used to process the LFDIs to obtain the initial decision map. Finally, the HFDC of the fused image is obtained by fusing the HFDC obtained by the final decision map, and an INSCT is performed on all coefficients to generate the final fused image.
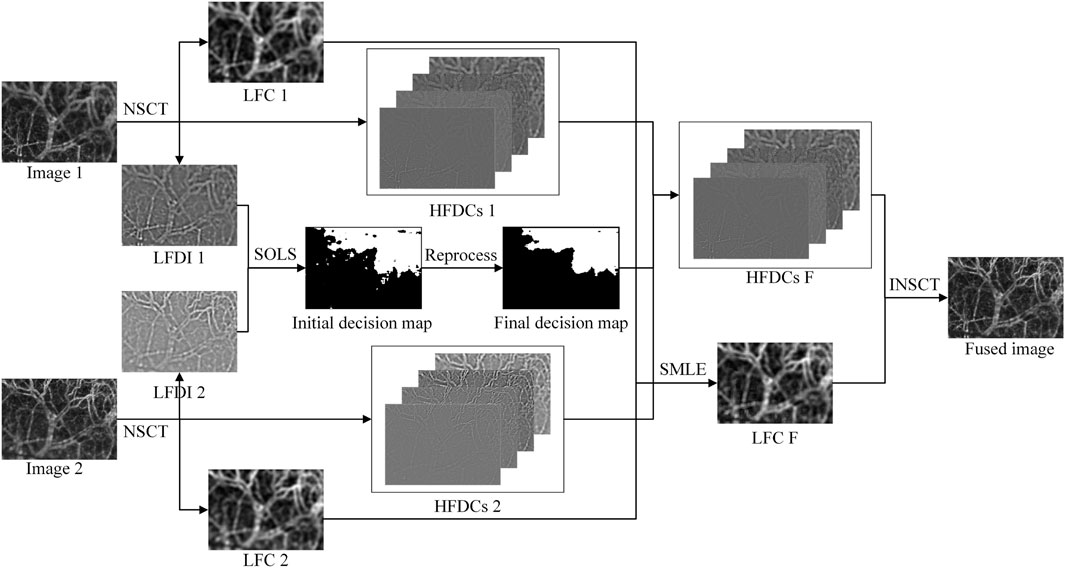
Figure 2. Proposed FFOA images fusion scheme.
2.3.1 NSCT
The NSCT consists of a non-subsampled pyramid (NSP) structure and non-subsampled directional filter banks (NSDFBs) to provide a decomposition of images [47]. Figure 3 depicts an overview of the NSCT. The ideal support regions of the low-frequency and high-frequency filters at the j level are complementary and can be expressed as
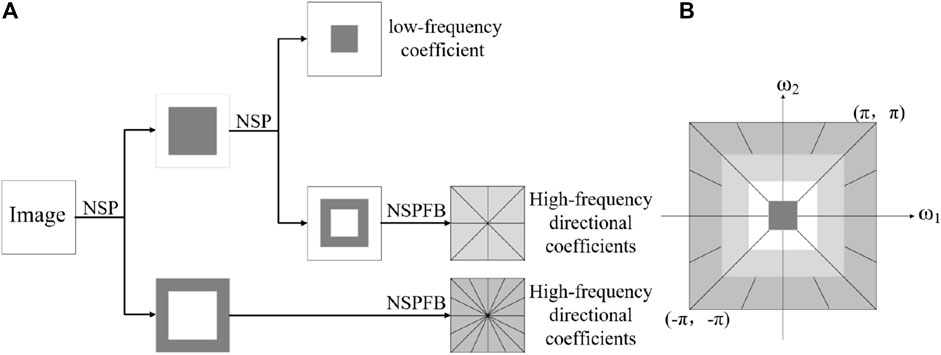
Figure 3. Overview of NSCT (A) Nonsubsampled filter bank structure. (B) Idealized frequency partitioning.
The k-th level NSP is defined as Eq. (4):
where
To understand the following presentation, let us recall some frequently used symbols. A, B, and X denote the source images, F indicates the fused image, and
2.3.2 LFCs fusion based on SMLE
In addition to the selection of transform domain, fusion rules are also critical in the multi-focus fusion method. For a pair of LFCs of image X obtained by NSCT decomposition, which retains the majority of the energy information from the source image, the energy change between the clear and defocused objects in the image is relatively large. According to existing literature [49], sum-modified-Laplacian
where
where
SMLE is selected as the fusion rule, and the coefficient with a larger SMLE is taken as the LFC after fusion. The coefficient selection principle for an LFC can be described as Eq. (9):
where
2.3.3 HFDCs fusion based on SOLS
The process of HFDC fusion based on SOLS consists of three steps. First, the initial decision map is obtained by describing the changes in LFCs using SOLS; thereafter, the initial decision map is optimized using consistency verification and morphological filtering operations to obtain the final decision map; and finally, the final decision map is used to guide the fusion of HFDCs.
The HFDCs obtained by the NSCT decomposition mainly contain most of the detailed information, such as contours, lines, edges, region boundaries, and textures, and the local geometric structures (LGS) of the focused region tend to be more prominent [50]. Therefore, fusion can be achieved by describing the variation of LGS in HFDC. In recent years, the SOT has gained widespread adoption in image fusion, emerging as a critical method for analyzing the LGS of images [51]. This article selected SOT as a descriptive tool to describe the variation of LGS in the HFDC; however, when SOT is directly selected to guide HFDC fusion, the decision maps of different HFDCs may not be consistent, which can lead to the introduction of error information in the fused images; thus, the fusion decision maps of HFDCs of decision maps are obtained by LFDIs. The process steps are described as follows.
Considering the low frequency difference image
where the window
where
where
In general, relatively small values of
STO can describe the amount of LGS information in LFDIs; however, it cannot accurately reflect the changes in local contrast. In this study, the sharpness change metric (SCM) is used to overcome this deficiency, and the SCM is defined as Eq. (15):
In the formula,
where
Consequently, the process of constructing the initial decision map
where
where MDM denotes the intermediate decision map. The “bwareaopen” filter removes isolated areas smaller than the threshold (th) in the binary map. Considering that different image sizes adapt to different values of th, th = 0.015 × S in our scheme, where S denotes the image area. Considering the object integrity, the MDM can be further improved using the consistency verification operations., as described in Eq. (20):
where
The fusion detail layer is generated using the final decision map as Eq. (21):
where
Finally, the fused image is obtained by INSCT using the LFC
2.4 Evaluation of the FFOA images
For subjective visual evaluation, this article measured the quality of fusion using the difference image, which was obtained by subtracting the fused image from the source image; the difference image
where
For the same focused regions in the fused images, less residual information in the difference image indicates better performance of the fusion method; therefore, difference images are employed for subjective visual evaluation.
Subjective visual evaluation offers a direct comparison, but occasionally, it may be difficult to determine the best performing case. In contrast, objective evaluations can provide a quantitative analysis of fusion quality. In this study, six popular metrics were used to evaluate fusion quality: 1) Normalized Mutual Information
The proposed method was compared with four advanced methods—CPFA [48], IFCNN [61], U2Fusion [62], and NSSR [63]— to verify its effectiveness. For a fair comparison, the parameter settings of all the methods were consistent with the original publications. In the fusion experiments, the CPFA, NSSR and proposed methods were implemented in MATLAB 2019a, IFCNN and U2Fusion methods were implemented in PyCharm 2022. All the fusion methods were executed on a PC using an Intel(R) Core (TM) i7-5500U CPU @ 2.40 GHz (2,394 MHz) and 12 GB RAM.
3 Results and discussion
To verify the effectiveness of the GFD scheme, this article compared the CPFA, IFCNN, U2Fusion, NSSR, and GFD using phantom and animal experimental results. In all examples, using 10 images with different DOFs for fusion, the DOF was extended by multiples of three. For the NSCT used in the proposed method, a four-layer decomposition was performed from coarse to fine in [1, 1, 1, 1] directions, with “vk” and “pyrexc” as the pyramid and the direction filter, respectively. In addition, owing to the limited DOF extended by the fusion of the two images, in all experiments, this article chose to fuse 10 images to get the final fusion results.
3.1 Phantom experimental
This article first demonstrates the validity of the method through simulation experiments, the experimental results of which are shown in Figure 4. A glass tube with a 0.15 mm radius was placed inside the transparent container at an angle of 60° to the horizontal for simulating blood vessels, and the transparent container was filled with 3.2 mg/mL of agar solution to imitate background tissue. RBCs were simulated using an approximately 5 μm radius
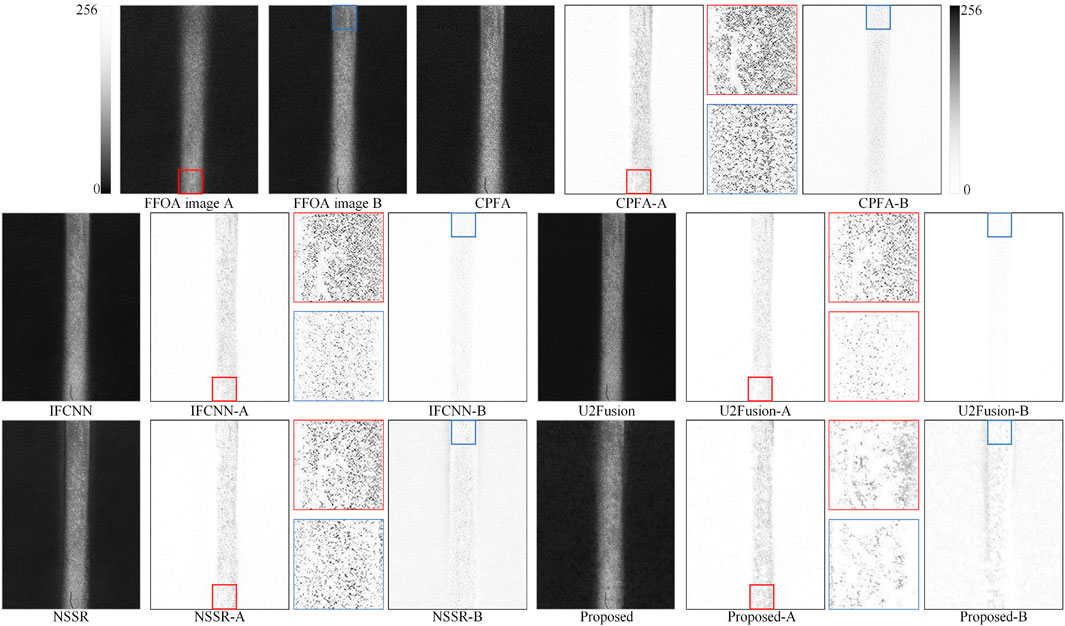
Figure 4. Subjective evaluation of phantom experiments.
Figure 4 shows the FFOA fusion results generated by the different methods. FFOA images A and B represent the first and 10th images, with the focus regions in the images boxed in red and blue, respectively. The fusion results of each method contain three images; the first image represents the fused image produced by fusing 10 FFOA images, and the second and third images are the difference images produced by subtracting the fused image from FFOA images A or B, respectively. The magnified image of the boxed region was placed in the middle of the two difference images for better visibility. By analyzing the red and blue boxed regions, it can be found that the proposed method and U2Fusion had fewer residuals; in contrast, the difference images of CPFA, IFCNN, and NSSR had more residual information. The above results indicate that the proposed method can retain more source image information than other methods. Figure 5 was obtained by excluding the subjective visual evaluation in Figure 4; it was used to validate the effectiveness of the proposed method and shows the objective evaluation metrics of the nine fusions used in the phantom experiment. Furthermore, it shows that in the objective evaluation of
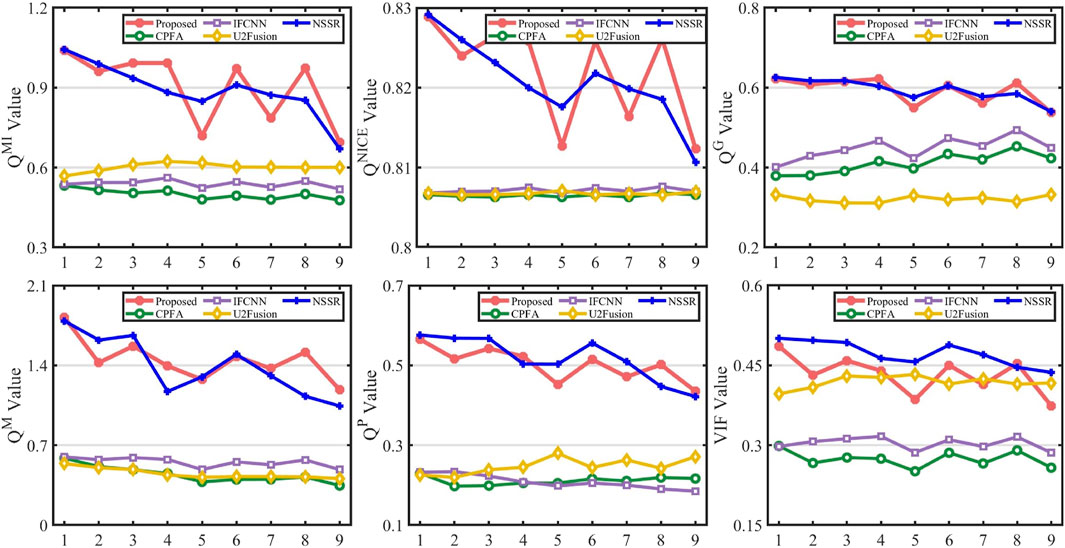
Figure 5. Objective evaluation of phantom experiments.
3.2 Animal experimental
This article performed vivo experiments using mouse ears to validate the proposed method further. The mouse (C57BL/6, 9 weeks old, and 21 g in weight) was anesthetized with 0.12 mL of chloral hydrate at a concentration of 0.15 g/mL. In the experiment, the EZL increased the focal length by 2.4 mm each time to acquire FFOA images, the magnification of the lens was 1.15, and the camera exposure time and frame rate were 0.45 ms and 42 fps, respectively. For a fair comparison, the experimental data of the first group mouse ear is from literature [48], and the second group mouse ear is from literature [63].
Figures 6, 7 show the experimental results of two different groups of mouse ears. The DOF was expanded from 0.8 to ∼3.3 mm. Figure 6 presents the first group of mouse ear experiments, and the FFOA images A and B are mouse ears with different DOFs; the focused regions are marked with red and blue boxes. This article boxed some blood vessels with different thicknesses in FFOA image A and one complete vascular vein in FFOA image B. The fusion results of each method contain three images: the first image is the fused image, and the second and third images are the difference images. A comparison of the red-boxed regions shows that the residual information from the boxed regions of the proposed method and U2Fusion is smaller, which indicates that the GFD scheme was able to retain more information from the source image for different vessel thicknesses. Figure 7 shows the second group of mouse ear experiments. Here, the boxed region in the FFOA image A contains relatively more background tissue and fewer capillaries, and the boxed region in the FFOA image B contains rich capillary information; the other images in Figure 7 were obtained in the same manner as those in Figure 6. The blue zoomed area shows that there are cloud-like residuals in the fusion results of CPFA, IFCNN, and U2Fusion, suggesting that the GFD scheme can be effective for regions with fewer capillaries and more background tissue. In the difference images of the red focus region, CPFA, IFCNN, and U2Fusion show more evident vascular veins and lose some important contour edge details of the source images. NSSR also has a large number of residuals, demonstrating that NSSR poorly preserves the edge details of capillaries. The GFD scheme retains only a few residual information.
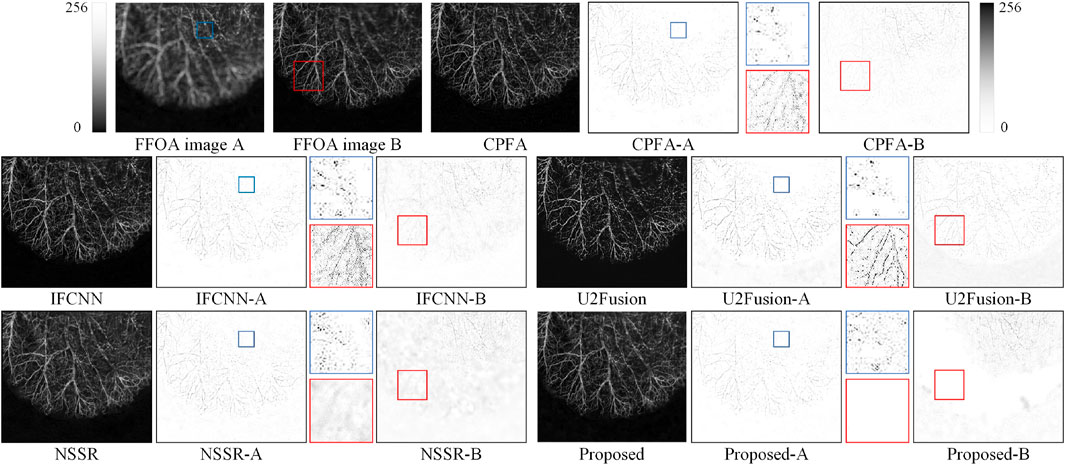
Figure 6. Subjective evaluation of the first of group mouse ear experiments.
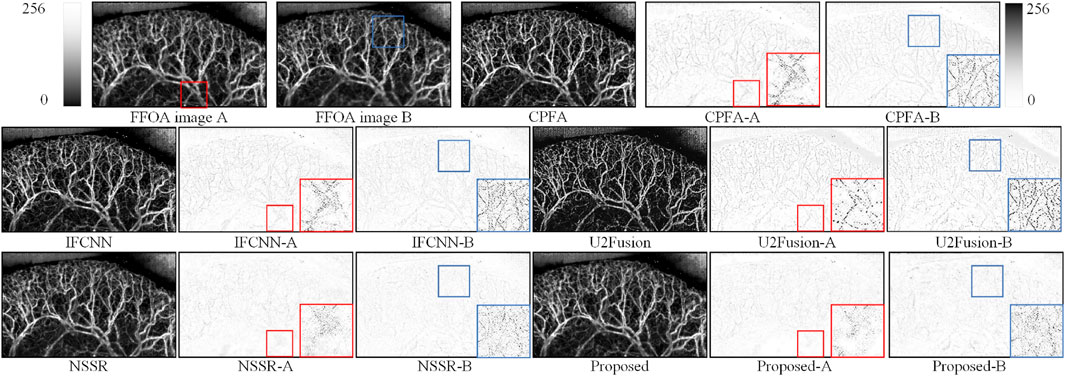
Figure 7. Subjective evaluation of the second group mouse ear experiments.
To evaluate the fusion results,
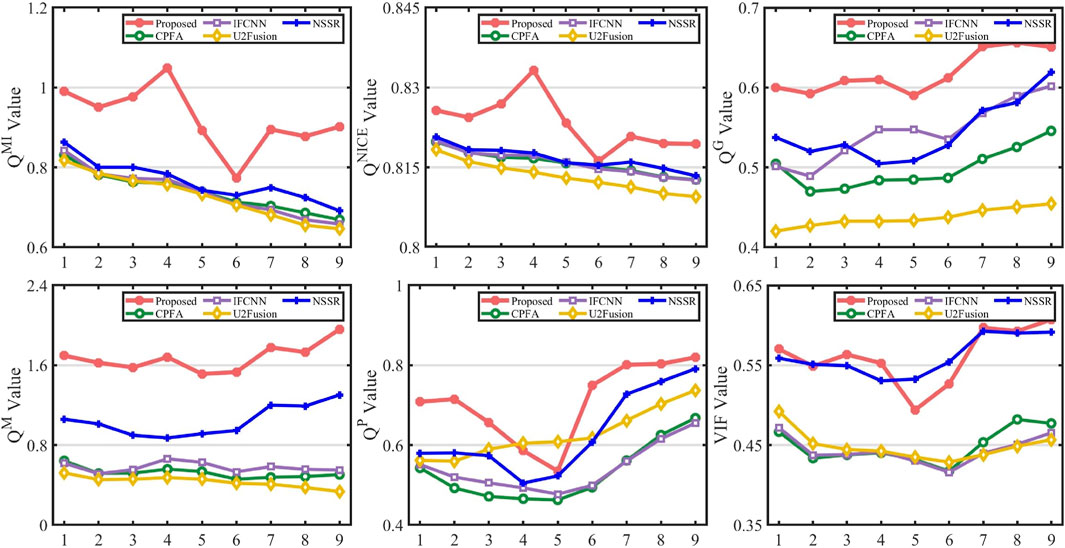
Figure 8. Objective evaluation of the first of group mouse ear.
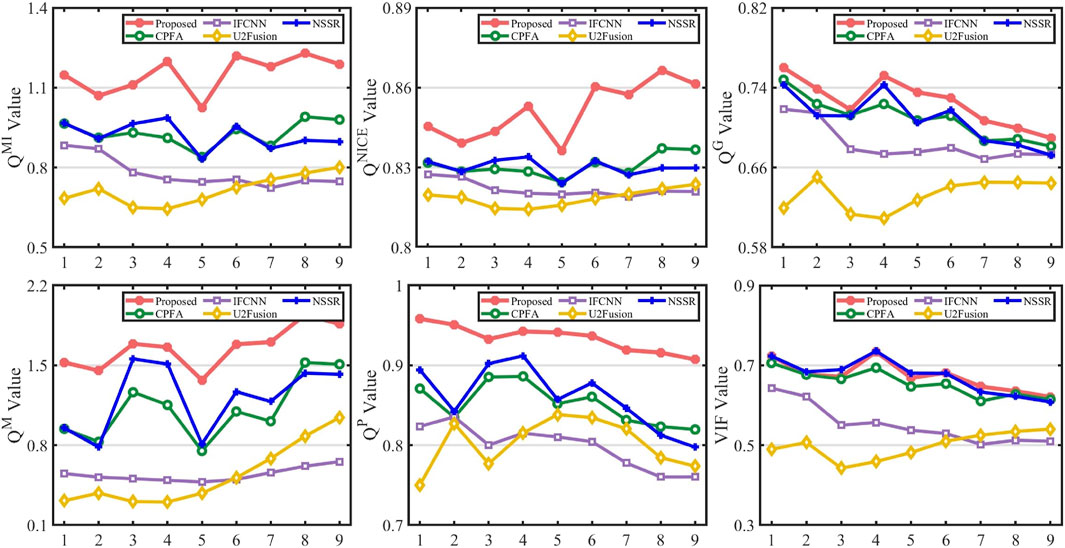
Figure 9. Objective evaluation of second of group mouse ear.
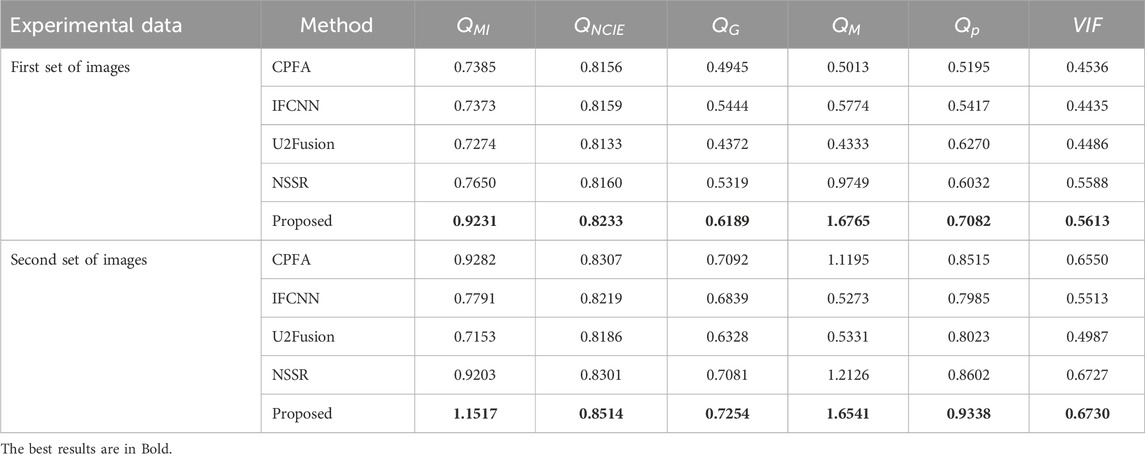
Table 1. Objective evaluation of mouse ears.
3.3 Fusion on the public dataset
To demonstrate the generalization of the proposed method, the Lytro dataset [64], which contains 20 pairs of multi-focus images, was used to validate the effectiveness of the method. The fusion results produced by the different methods on a set of Lytro dataset are shown in Figure 10. The average values of the objective evaluation of the Lytro dataset and Figure 10 are presented in Table 2.
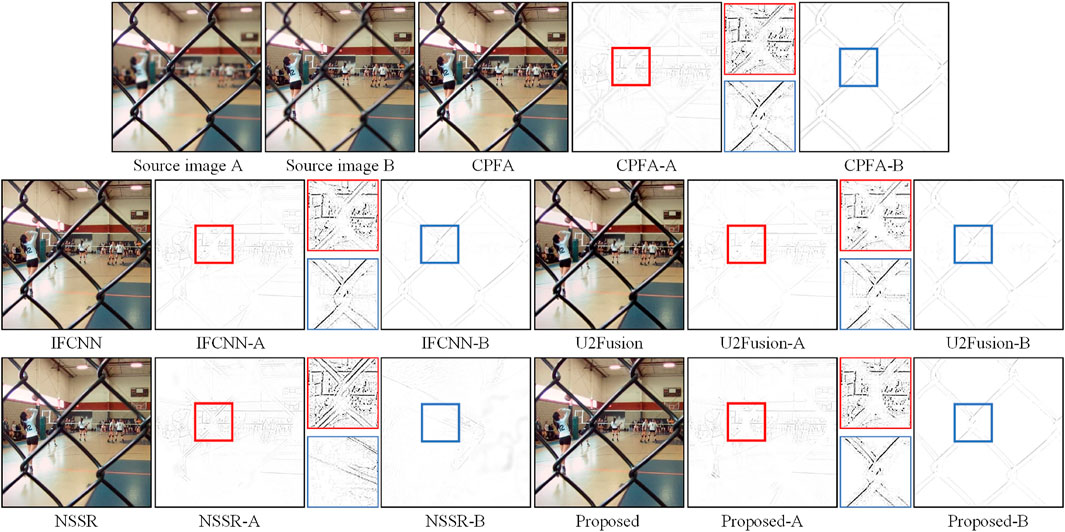
Figure 10. Subjective evaluation of the Lytro dataset.
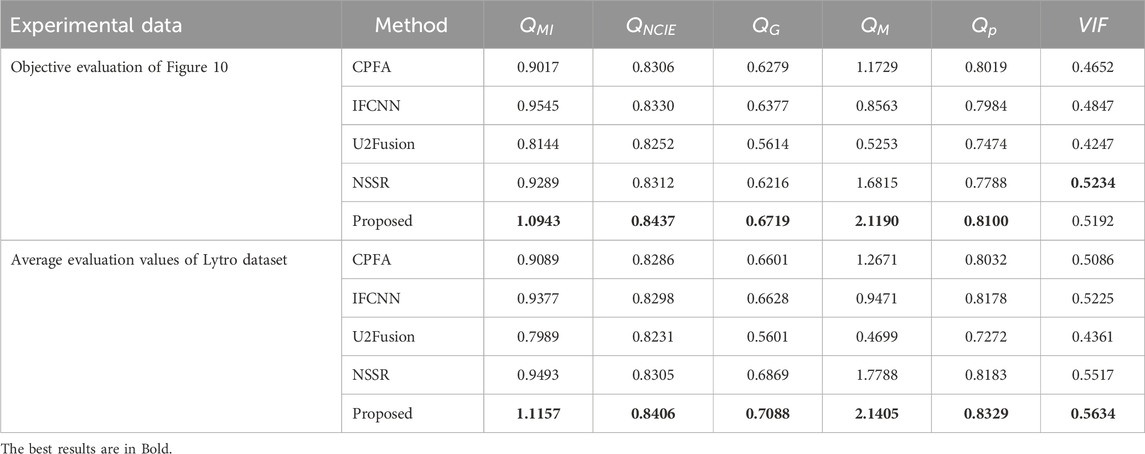
Table 2. Objective evaluation of the Lytro dataset.
In Figure 10, images A and B are produced by DOF in the same scene, which contains a motion field and a metal grid. The fusion result of each method consists of a fusion image and two difference images. The difference images were produced from the fusion result and original images A and B. Regions in the difference map containing focus and out-of-focus information were selected and enlarged in the middle of the two difference maps. From the overall fusion results, all methods can retain the brightness and color information in the source image satisfactorily; however, the fused images produced by NSSR and the proposed method achieve satisfactory results in terms of sharpness. The different methods showed a distinct gap in the difference images. In the difference images of CPFA, IFCCN, U2Fusion, and NSSR, residuals appeared in the focus region, indicating that these methods introduce information concerning the out-of-focus region in the fusion results. Particularly in the difference images NSSR-A and NSSR-B, there is almost no metal lattice shown in the out-of-focus images; this is attributable to the limited ability of the dictionary to characterize the image in the SR methods. In a comprehensive comparison, the proposed method achieved satisfactory subjective results in the subjective evaluation. In the objective evaluation results of the Lytro dataset, the proposed method achieved the best rankings in the metrics
Based on the above discussion, this article confirmed the validity and stability of the proposed program. First, this is because, in contrast to CPFA, NSCT does not perform upsampling and downsampling. Thus, it reduces the redundancy between data in different layers and reduces the possibility of losing high-frequency detailed information in upsampling and downsampling, which may blur the fused images in the reconstruction process. Second, the NSCT can extract more accurate directional information to better represent image information. Finally, different fusion rules were adopted for different coefficients separately, which can stably retain the source image information. The proposed method could have potential applications in optical angiography experiments to extend the DOF.
3.4 Discussion on time efficiency
In this section, the time efficiency of the proposed method will be compared with other methods on grayscale images (size 710 × 620). As summarized in Table 3, the NSSR method takes the longest time because it uses a dictionary for the SR of the image. In contrast, the CPFA has the shortest time because of the fast contrast pyramid construction process and the simple fusion rules used. The computational efficiencies of the deep learning methods IFCNN and U2Fusion were relatively high because they use pre-trained models. In terms of the time required, proposed method ranked fourth; this is attributable to the large amount of time spent on the NSCT decomposition and the relative complexity of the computation of the fusion rule. The speed of proposed method may not be the highest, but its high performance makes it effective. Additionally, optimizing the underlying code and utilizing tools such as GPUs and C++ holds the potential to significantly reduce the execution time of proposed method, which will enable the method to meet the requirements of a wider range of applications.

Table 3. Running time of different methods.
4 Conclusion
Blood microcirculation information is essential for biological research. This article developed a GFD method to solve the defocusing problems by extending the DOF. FFOA images with different DOFs were obtained using the AIFM effect; subsequently, the DOF was extended using the proposed fusion method. The proposed fusion methodology consists of three steps. First, the NSCT decomposes the FFOA images into LFC and HFDCs. GFD rules are employed to fuse the LFC and HFDCs, and the final fused images are obtained by performing INSCT. Subjective visual comparison and objective assessment in the experiments can certify the validity and stability of the proposed scheme. Experimental results show that the proposed method can solve the FFOA scattering problem biological samples due to surface and thickness inhomogeneity, and has the potential applications in optical angiography experiments; notably, it provides effective technical support for target identification and tracking.
Although the proposed GFD method can obtain high-resolution blood flow images by extending the DOF, there are some limitations. First, the EZL has a limited focusing speed, resulting in the inability to image in real time. Second, the decomposition level of NSP and decomposition direction of NSDFB in the NSCT must be set using artificial empirical values, which increases the uncertainty of the fusion effect; moreover, the computational efficiency of the GFD needs to be refined. Finally, the completed FFOA image must be registered to reduce artifacts from the sample jitter in the fused image. In future work, the designed algorithm will be improved to enhance the robustness of fusing noise-disturbing and misregistered images.
Data availability statement
The original contributions presented in the study are included in the article/supplementary material, further inquiries can be directed to the corresponding author.
Ethics statement
The animal study was approved by School of Physics and Optoelectronic Engineering, Foshan University, Foshan 528225, China. The study was conducted in accordance with the local legislation and institutional requirements.
Author contributions
GW: Visualization, Writing–original draft. JL: Conceptualization, Methodology, Software, Writing–review and editing. HT: Data curation, Supervision, Writing–review and editing. XL: Funding acquisition, Writing–review and editing.
Funding
The author(s) declare that financial support was received for the research, authorship, and/or publication of this article. This research is funded by the National Natural Science Foundation of China under Grant (No. 62201149), the Joint Fund for Basic and Applied Basic Research of Guangdong Province under Grant (No. 2023A1515140077), the Natural Science Foundation of Guangdong Province under Grant (No. 2024A1515011880), the Guangdong Higher Education Innovation and Strengthening of Universities Project under Grant (No. 2023KTSCX127), and the Foshan Key Areas of Scientific and Technological Research Project under Grant (No. 2120001008558).
Conflict of interest
The authors declare that the research was conducted in the absence of any commercial or financial relationships that could be construed as a potential conflict of interest.
Publisher’s note
All claims expressed in this article are solely those of the authors and do not necessarily represent those of their affiliated organizations, or those of the publisher, the editors and the reviewers. Any product that may be evaluated in this article, or claim that may be made by its manufacturer, is not guaranteed or endorsed by the publisher.
References
1. Taqueti VR, Di Carli MF Coronary microvascular disease pathogenic mechanisms and therapeutic options JACC state-of-the-art review. J Am Coll Cardiol (2018) 72(21):2625–41. doi:10.1016/j.jacc.2018.09.042
2. Simo R, Stitt AW, Gardner TW. Neurodegeneration in diabetic retinopathy: does it really matter? Diabetologia (2018) 61(9):1902–12. doi:10.1007/s00125-018-4692-1
3. Montone RA, Niccoli G, Fracassi F, Russo M, Gurgoglione F, Cammà G, et al. Patients with acute myocardial infarction and non-obstructive coronary arteries: safety and prognostic relevance of invasive coronary provocative tests. Eur Heart J (2018) 39(2):91–8. doi:10.1093/eurheartj/ehx667
4. Feihl F, Liaudet L, Waeber B, Levy BI. Hypertension - a disease of the microcirculation? Hypertension (2006) 48(6):1012–7. doi:10.1161/01.hyp.0000249510.20326.72
5. de Boer JF, Hitzenberger CK, Yasuno Y. Polarization sensitive optical coherence tomography - a review Invited. Biomed Opt Express (2017) 8(3):1838–73. doi:10.1364/boe.8.001838
6. Briers D, Duncan DD, Hirst E, Kirkpatrick SJ, Larsson M, Steenbergen W, et al. Laser speckle contrast imaging: theoretical and practical limitations. J Biomed Opt (2013) 18(6):066018. doi:10.1117/1.jbo.18.6.066018
7. Zhang FL, Wang MY, Han DA, Tan H, Yang G, Zeng Y. In vivo full-field functional optical hemocytometer. J Biophotonics (2018) 11(2). doi:10.1002/jbio.201700039
8. Wang MY, Mao WJ, Guan CZ, Feng G, Tan H, Han D, et al. Full-field functional optical angiography. Opt Lett (2017) 42(3):635–8. doi:10.1364/ol.42.000635
9. Liu Y, Wang L, Cheng J, Chen X. Multi-focus image fusion: a Survey of the state of the art. Inf Fusion (2020) 64:71–91. doi:10.1016/j.inffus.2020.06.013
10. Zhu ZQ, Zheng MG, Qi GQ, Wang D, Xiang Y. A Phase congruency and local laplacian energy based multi-modality medical image fusion method in NSCT domain. Ieee Access (2019) 7:20811–24. doi:10.1109/access.2019.2898111
11. Li XS, Zhou FQ, Tan HS, et al. Multi-focus image fusion based on nonsubsampled contourlet transform and residual removal. Signal Process. (2021) 184. doi:10.1016/j.sigpro.2021.108062
12. Meher B, Agrawal S, Panda R, Abraham A. A survey on region based image fusion methods. Inf Fusion (2019) 48:119–32. doi:10.1016/j.inffus.2018.07.010
13. Li X, Li X, Ye T, Cheng X, Liu W, Tan H. Bridging the gap between multi-focus and multi-modal: a focused integration framework for multi-modal image fusion. arXiv preprint arXiv:231101886, (2024):2023. doi:10.1109/wacv57701.2024.00165
14. Li J, Han D, Wang X, Yi P, Yan L, Li X. Multi-Sensor medical-image fusion technique based on embedding bilateral filter in least squares and salient detection. Sensors (2023) 23(7):3490. doi:10.3390/s23073490
15. Wang JW, Qu HJ, Wei YA, et al. Multi-focus image fusion based on quad-tree decomposition and e dge-weighte d focus measure. Signal Process. (2022) 198. doi:10.1016/j.sigpro.2022.108590
16. Li ST, Yang B, Hu JW. Performance comparison of different multi-resolution transforms for image fusion. Inf Fusion (2011) 12(2):74–84. doi:10.1016/j.inffus.2010.03.002
17. Li XL, Wang XP, Cheng XQ, Tan H. Multi-focus image fusion based on hessian matrix decomposition and salient difference focus detection. Entropy (2022) 24(11):1527. doi:10.3390/e24111527
18. Li XS, Zhou FQ, Tan HS, Zhang W, Zhao C. Multimodal medical image fusion based on joint bilateral filter and local gradient energy. Inf Sci (2021) 569:302–25. doi:10.1016/j.ins.2021.04.052
19. Jie YC, Li XS, Wang MY, et al. Medical image fusion based on extended difference-of-Gaussians and edge-preserving. Expert Syst Appl (2023) 227. doi:10.1016/j.eswa.2023.120301
20. Zhu ZQ, Yin HP, Chai Y, Li Y, Qi G. A novel multi-modality image fusion method based on image decomposition and sparse representation. Inf Sci (2018) 432:516–29. doi:10.1016/j.ins.2017.09.010
21. Zhang YF, Yang MY, Li N, et al. Analysis-synthesis dictionary pair learning and patch saliency measure for image fusion. Signal Process. (2020) 167. doi:10.1016/j.sigpro.2019.107327
22. Li HF, Wang YT, Yang Z, Wang R, Li X, Tao D. Discriminative dictionary learning-based multiple component decomposition for detail-preserving noisy image fusion. Ieee Trans Instrumentation Meas (2020) 69(4):1082–102. doi:10.1109/tim.2019.2912239
23. Li HF, He XG, Tao DP, Tang Y, Wang R. Joint medical image fusion, denoising and enhancement via discriminative low-rank sparse dictionaries learning. Pattern Recognition (2018) 79:130–46. doi:10.1016/j.patcog.2018.02.005
24. Li XS, Zhou FQ, Tan HS. Joint image fusion and denoising via three-layer decomposition and sparse representation. Knowledge-Based Syst (2021) 224. doi:10.1016/j.knosys.2021.107087
25. Li XS, Wan WJ, Zhou FQ, Cheng X, Jie Y, Tan H. Medical image fusion based on sparse representation and neighbor energy activity. Biomed Signal Process Control (2023) 80:104353. doi:10.1016/j.bspc.2022.104353
26. Liu Y, Chen X, Peng H, Wang Z. Multi-focus image fusion with a deep convolutional neural network. Inf Fusion (2017) 36:191–207. doi:10.1016/j.inffus.2016.12.001
27. Ma JY, Tang LF, Fan F, Huang J, Mei X, Ma Y. SwinFusion: cross-domain long-range learning for general image fusion via swin transformer. Ieee-Caa J Automatica Sinica (2022) 9(7):1200–17. doi:10.1109/jas.2022.105686
28. Zhang XC. Deep learning-based multi-focus image fusion: a survey and a comparative study. Ieee Trans Pattern Anal Machine Intelligence (2022) 44(9):4819–38. doi:10.1109/tpami.2021.3078906
29. Liu Y, Qi Z, Cheng J, Chen X. Rethinking the effectiveness of objective evaluation metrics in multi-focus image fusion: a statistic-based approach. IEEE Trans pattern Anal machine intelligence (2024) 1–14. doi:10.1109/tpami.2024.3367905
30. Li HF, Liu JY, Zhang YF, Liu Y. A deep learning framework for infrared and visible image fusion without strict registration. Int J Comput Vis (2023). doi:10.1007/s11263-023-01948-x
31. Xiao B, Ou G, Tang H, Bi X, Li W. Multi-focus image fusion by hessian matrix based decomposition. Ieee Trans Multimedia (2020) 22(2):285–97. doi:10.1109/tmm.2019.2928516
32. Li X, Li X, Tan H, Li J. SAMF: small-area-aware multi-focus image fusion for object detection. arXiv preprint arXiv:240108357 (2024) doi:10.1109/icassp48485.2024.10447642
33. Li XL, Li XS, Cheng XQ, Wang M, Tan H. MCDFD: multifocus image fusion based on multiscale cross-difference and focus detection. IEEE Sens J (2023) 23(24):30913–26. doi:10.1109/jsen.2023.3330871
34. Zhang Q, Liu Y, Blum RS, Han J, Tao D. Sparse representation based multi-sensor image fusion for multi-focus and multi-modality images: a review. Inf Fusion (2018) 40:57–75. doi:10.1016/j.inffus.2017.05.006
35. Tang D, Xiong QY, Yin HP, et al. A novel sparse representation based fusion approach for multi-focus images. Expert Syst Appl (2022) 197. doi:10.1016/j.eswa.2022.116737
36. Guo XP, Nie RC, Cao JD, Zhou D, Mei L, He K. FuseGAN: learning to fuse multi-focus image via conditional generative adversarial network. Ieee Trans Multimedia (2019) 21(8):1982–96. doi:10.1109/tmm.2019.2895292
37. Luo X, Gao Y, Wang A, et al. IFSepR: a general framework for image fusion based on separate representation learning. IEEE Trans Multimedia (2021) 1. doi:10.1109/TMM.2021.3129354
38. Zhu Z, Sun M, Qi G, Li Y, Gao X, Liu Y. Sparse Dynamic Volume TransUNet with multi-level edge fusion for brain tumor segmentation. Comput Biol Med (2024) 172:108284. doi:10.1016/j.compbiomed.2024.108284
39. Li J, Huo H, Li C, Wang R, Feng Q. AttentionFGAN: infrared and visible image fusion using attention-based generative adversarial networks. IEEE Trans Multimedia (2020) 23:1383–96. doi:10.1109/tmm.2020.2997127
40. Tang W, He F, Liu Y, Duan Y. MATR: multimodal medical image fusion via multiscale adaptive transformer. IEEE Trans Image Process (2022) 31:5134–49. doi:10.1109/tip.2022.3193288
41. Zhao Z, Bai H, Zhang J, Zhang Y, Xu S, Lin Z, et al. CDDFuse: correlation-driven dual-branch feature decomposition for multi-modality image fusion. Computer Vis Pattern Recognition, 2023: 5906–16. doi:10.1109/CVPR52729.2023.00572
42. Zhao HJ, Shang ZW, Tang YY, Fang B. Multi-focus image fusion based on the neighbor distance. Pattern Recognition (2013) 46(3):1002–11. doi:10.1016/j.patcog.2012.09.012
43. Petrovic VS, Xydeas CS. Gradient-based multiresolution image fusion. Ieee Trans Image Process (2004) 13(2):228–37. doi:10.1109/tip.2004.823821
44. Wan T, Canagarajah N, Achim A. Segmentation-driven image fusion based on alpha-stable modeling of wavelet coefficients. Ieee Trans Multimedia (2009) 11(4):624–33. doi:10.1109/TMM.2009.2017640
45. Lewis JJ, O’Callaghan RJ, Nikolov SG, et al. Pixel- and region-based image fusion with complex wavelets. Inf Fusion (2007) 8(2):119–30. doi:10.1016/j.inffus.2005.09.006
46. Zhang Q, Guo BL. Multifocus image fusion using the nonsubsampled contourlet transform. Signal Process. (2009) 89(7):1334–46. doi:10.1016/j.sigpro.2009.01.012
47. da Cunha AL, Zhou JP, Do MN. The nonsubsampled contourlet transform: theory, design, and applications. Ieee Trans Image Process (2006) 15(10):3089–101. doi:10.1109/tip.2006.877507
48. Wang MY, Wu NS, Huang HH, Luo J, Zeng Y, et al. Large-depth-of-field full-field optical angiography. J Biophotonics (2019) 12(5):e201800329. doi:10.1002/jbio.201800329
49. Huang W, Jing Z. Evaluation of focus measures in multi-focus image fusion. Pattern Recognition Lett (2007) 28(4):493–500. doi:10.1016/j.patrec.2006.09.005
50. Zhu X, Milanfar P. Automatic parameter selection for denoising algorithms using a No-reference measure of image content. Ieee Trans Image Process (2010) 19(12):3116–32. doi:10.1109/TIP.2010.2052820
51. Du J, Li WS, Tan HL. Three-layer medical image fusion with tensor-based features. Inf Sci (2020) 525:93–108. doi:10.1016/j.ins.2020.03.051
52. Jin L, Liu H, Xu X, Song E. Improved direction estimation for Di Zenzo's multichannel image gradient operator. Pattern Recognition (2012) 45(12):4300–11. doi:10.1016/j.patcog.2012.06.003
53. Zhou Z, Li S, Wang B. Multi-scale weighted gradient-based fusion for multi-focus images. Inf Fusion (2014) 20:60–72. doi:10.1016/j.inffus.2013.11.005
54. Qu GH, Zhang DL, Yan PF. Information measure for performance of image fusion. Electron Lett (2002) 38(7):313–5. doi:10.1049/el:20020212
55. Wang Q, Shen Y, Zhang JQ. A nonlinear correlation measure for multivariable data set. Physica D-Nonlinear Phenomena (2005) 200(3-4):287–95. doi:10.1016/j.physd.2004.11.001
56. Xydeas CS, Petrovic V. Objective image fusion performance measure. Electron Lett (2000) 36(4):308–9. doi:10.1049/el:20000267
57. Wang PW, Liu B (2008). “A novel image fusion metric based on multi-scale analysis,” in 9th international conference on signal processing, 26-29 October 2008, beijing.
58. Zhao JY, Laganiere R, Liu Z. Performance assessment of combinative pixel-level image fusion based on an absolute feature measurement. Int J Innovative Comput Inf Control (2007) 3(6A):1433–47.
59. Sheikh HR, Bovik AC. Image information and visual quality. Ieee Trans Image Process (2006) 15(2):430–44. doi:10.1109/tip.2005.859378
60. Liu Z, Blasch E, Xue ZY, Zhao J, Laganiere R, Wu W. Objective assessment of multiresolution image fusion algorithms for context enhancement in night vision: a comparative study. Ieee Trans Pattern Anal Machine Intelligence (2012) 34(1):94–109. doi:10.1109/tpami.2011.109
61. Zhang Y, Liu Y, Sun P, Yan H, Zhao X, Zhang L. IFCNN: a general image fusion framework based on convolutional neural network. Inf Fusion (2020) 54:99–118. doi:10.1016/j.inffus.2019.07.011
62. Xu H, Ma JY, Jiang JJ, Guo X, Ling H. U2Fusion: a unified unsupervised image fusion network. Ieee Trans Pattern Anal Machine Intelligence (2022) 44(1):502–18. doi:10.1109/tpami.2020.3012548
63. Jie YC, Li XS, Wang MY, Tan H. Multi-focus image fusion for full-field optical angiography. Entropy (2023) 25(6):951. doi:10.3390/e25060951
Keywords: full-field optical angiography, gradient feature detection, multi-focus image fusion, nonsubsampled contourlet transform, fusion rule
Citation: Wang G, Li J, Tan H and Li X (2024) Fusion of full-field optical angiography images via gradient feature detection. Front. Phys. 12:1397732. doi: 10.3389/fphy.2024.1397732
Received: 08 March 2024; Accepted: 19 April 2024;
Published: 10 May 2024.
Edited by:
Zhiqin Zhu, Chongqing University of Posts and Telecommunications, ChinaReviewed by:
Tao Ye, China University of Mining and Technology, ChinaWangxia Zuo, University of South China, China
Guanqiu Qi, Arizona State University, United States
Copyright © 2024 Wang, Li, Tan and Li. This is an open-access article distributed under the terms of the Creative Commons Attribution License (CC BY). The use, distribution or reproduction in other forums is permitted, provided the original author(s) and the copyright owner(s) are credited and that the original publication in this journal is cited, in accordance with accepted academic practice. No use, distribution or reproduction is permitted which does not comply with these terms.
*Correspondence: Jiangwei Li, amlhbmd3ZWlsaTIwMjNAMTYzLmNvbQ==