- 1College of Automation, Chongqing University, Chongqing, China
- 2China Merchants Auto-trans Technology Co., Ltd., Chongqing, China
- 3China Merchants Testing Vehicle Technology Research Institute Co., Ltd., Chongqing, China
- 4Chongqing University of Technology, Chongqing, China
- 5Chongqing Expressway Group Co., Ltd., Chongqing, China
Road surface detection plays a pivotal role in the realm of autonomous vehicle navigation. Contemporary methodologies primarily leverage LiDAR for acquiring three-dimensional data and utilize imagery for chromatic information. However, these approaches encounter significant integration challenges, particularly due to the inherently unstructured nature of 3D point clouds. Addressing this, our novel algorithm, specifically tailored for predicting drivable areas, synergistically combines LiDAR point clouds with bidimensional imagery. Initially, it constructs an altitude discrepancy map via LiDAR, capitalizing on the height uniformity characteristic of planar road surfaces. Subsequently, we introduce an innovative and more efficacious attention mechanism, streamlined for image feature extraction. This mechanism employs adaptive weighting coefficients for the amalgamation of the altitude disparity imagery and two-dimensional image features, thereby facilitating road area delineation within a semantic segmentation framework. Empirical evaluations conducted using the KITTI dataset underscore our methodology’s superior road surface discernment and extraction precision, substantiating the efficacy of our proposed network architecture and data processing paradigms. This research endeavor seeks to propel the advancement of three-dimensional perception technology in the autonomous driving domain.
1 Introduction
In the evolving landscape of intelligent transportation, the escalating demand for precision in perception algorithms renders single image sensor modalities inadequate. Visual imagery is susceptible to ambient light intensity variations, where shadows cast by tall structures and trees can precipitate algorithmic inaccuracies or omissions. In scenarios devoid of depth information, conventional visual image-based algorithms exhibit limited efficacy in discerning road edges and pedestrian crossings. Conversely, LiDAR radar, impervious to lighting and shadows, provides high-precision environmental depth data, enhancing detection stability significantly. Perceiving road information using LiDAR point cloud, which is collected by LiDAR sensors, is both a challenging research area and a key focus in the field.
Several researchers have explored LiDAR-based road information extraction techniques. Zhang et al. [1] utilized Gaussian difference filtering for point cloud segmentation, aligning the results with a model to isolate ground points. Chen et al. [2], targeting lane edge information, segmented lanes post feature extraction. Asvadi et al. [3] adopted segmented plane fitting as their evaluative criterion. Wijesoma et al. [4] approached the challenge by focusing on road edge detection, employing extended Kalman filtering for lane edge feature extraction.
The fusion of LiDAR and camera data for road perception has garnered increasing scholarly interest. The inherent disparity between three-dimensional LiDAR point clouds and two-dimensional image pixels presents a significant data space challenge. Innovative algorithms have been developed to transform and densify sparse point cloud data into continuous, image-like formats. Chen et al. [5] leveraged LiDAR’s scanning angle data to create image-like representations from point clouds. Thrun et al. [6] introduced a top-down radar feature representation based on vertical point cloud distribution. Gu et al. [7] employed linear upsampling for point cloud data preprocessing, extracting features from the densified clouds for road perception. Similarly, Fernandes et al. [8] utilized upsampling but projected the point cloud onto the X-Y plane before extracting Z-axis height values. Caltagirone et al. [9] generated a top view of point clouds by encoding their average degree and density, facilitating road perception. Han X et al. [10] and Liu Z et al. [11] further contributed with high-resolution depth image generation and directional ray map implementation, respectively.
Existing methods that densify point clouds into more manageable data forms often lead to computationally intensive outputs, compromising the real-time capabilities of the overall algorithm. To address this, our paper introduces a novel method for 3D point cloud conversion, leveraging weighted altitude differences. This approach not only efficiently preserves essential road information but also enhances the distinction between road and non-road areas.
In this study, we propose distinct fusion strategies at both the data and feature levels, tackling the challenges posed by disparate sensor data structures and varied road characteristics. Initially, we transform three-dimensional point cloud data into a two-dimensional weighted altitude difference map. This process, anchored on the uniform height variation in flat road areas, not only retains crucial road features but also facilitates data-level fusion. Subsequently, we introduce a LiDAR-camera feature adaptive fusion technique. This innovative method refines the semantic segmentation network encoder and integrates a feature adaptive fusion module. This module, comprising an adaptive feature transformation network and a multi-channel feature weighting cascade network, adeptly linearly transforms LiDAR radar features. These transformed features are then coalesced with visual image features across multiple levels, achieving effective feature-level fusion of multimodal data.
2 Weighted altitude difference map based on point cloud data
2.1 Altitude difference map
The disparity between original LiDAR data and visual data presents significant challenges in direct data fusion and feature extraction. LiDAR data, comprising tens of thousands of points in a three-dimensional space, assigns each point with 3D coordinates (x, y, z). In contrast, visual data consists of an array of pixels on a two-dimensional image plane, each pixel defined by an RGB value. This fundamental difference in data space complicates their direct integration.
In the context of road areas, the LiDAR point cloud exhibits a unique smoothness compared to other objects. This smoothness is evident as the road area’s point cloud in 3D space shows fewer irregularities, unlike non-road areas and entities like vehicles and pedestrians. The discontinuities in the point cloud bounding box are more pronounced for these non-road elements. The road surface’s smoothness is quantified by the minimal average altitude difference between road surface points and their neighboring points.
Through the process of joint calibration parameters and sparse point cloud densification, a detailed projection image of the dense LiDAR point cloud is obtained. This involves projecting the 3D coordinate vectors of the LiDAR points onto a 2D image plane, resulting in varying shapes depending on the observation coordinates along the X, Y, and Z-axes. By defining the X-Y plane as the base, the Z-axis can be interpreted as the height value of the point cloud, providing a crucial dimensional perspective.
As shown in Figure 1A, the absolute value of the altitude difference between two positions (such as

Figure 1. Altitude difference image conversion process. (A) The point cloud image, (B) the calculated altitude difference image.
In the formula,
Finally, all calculated
The relationship between the average altitude difference of a point relative to its neighbors and the resultant grayscale value in the converted height map is inversely proportional. As illustrated in Figure 1B, an upright and sharply defined object will cast a projection with a significant altitude difference on the image plane. Consequently, the road area, characterized by minimal intensity, appears darker in the image. In contrast, other objects typically exhibit higher altitude values, resulting in more pronounced intensity differences when compared to the road area. This conversion from original 3D data to point cloud altitude difference effectively encapsulates the road’s inherent characteristics and smoothness present in the initial LiDAR data. The height map thus produced simplifies the task for a deep convolutional neural network model in discerning and identifying the road, enhancing the model’s ability to differentiate between various features.
2.2 Weighted altitude difference map
The elevation difference image principally focuses on the height variation between a central point and its surrounding points. Upon examination, it becomes apparent that the low grayscale values in road areas on this image stem from the negligible height changes extending in all directions from any given point on the road, leading to minimal elevation difference values. Conversely, the areas of higher intensity on the elevation difference image are predominantly located where road and non-road areas intersect. These high-intensity regions usually align approximately along the Y-axis. A marked change in elevation difference values is observed when neighboring points along the X-axis direction are selected for calculation, distinguishing them from the road surface area.
To leverage this characteristic, we propose an enhanced elevation difference conversion method. The novel formula for calculating elevation difference values is structured to more accurately reflect these spatial variations. This approach aims to provide a clearer distinction between road and non-road areas, improving the precision of the elevation difference image for subsequent analysis and application. The new formula for calculating elevation difference values is as follows:
In the formula,
When considering the altitude difference between the neighborhood points and the center point, the altitude difference changes of the points closer to the center point can better reflect the overall flatness of the neighborhood. Therefore, the weight values of the points closer to the center point should be increased. The formula with the added distance weight is as follows:
Where,
For the conversion of point cloud data, we set a 5 × 5 grid centered around
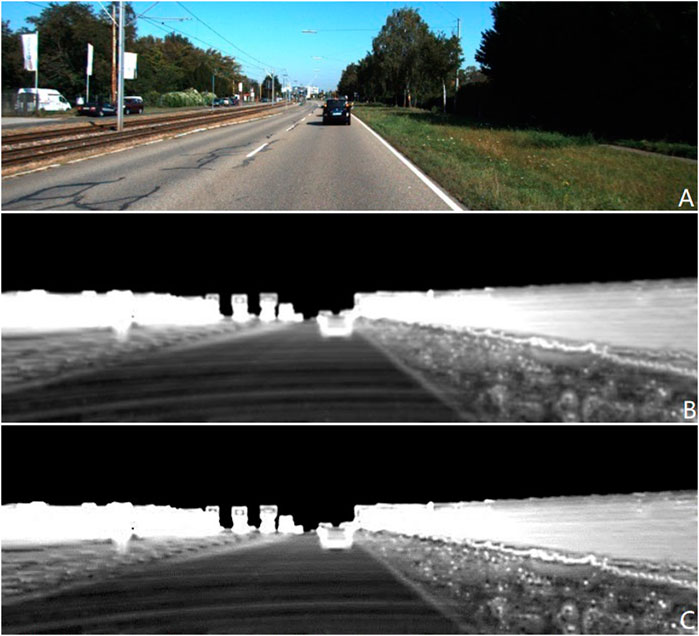
Figure 2. Point cloud data conversion results, (A) is the RGB image, (B) is the original Altitude Difference Map, and (C) is the Weighted Altitude Difference Map. (C) Contains more details, and the changes in height are more pronounced in the pixel values.
3 Feature adaptive fusion network
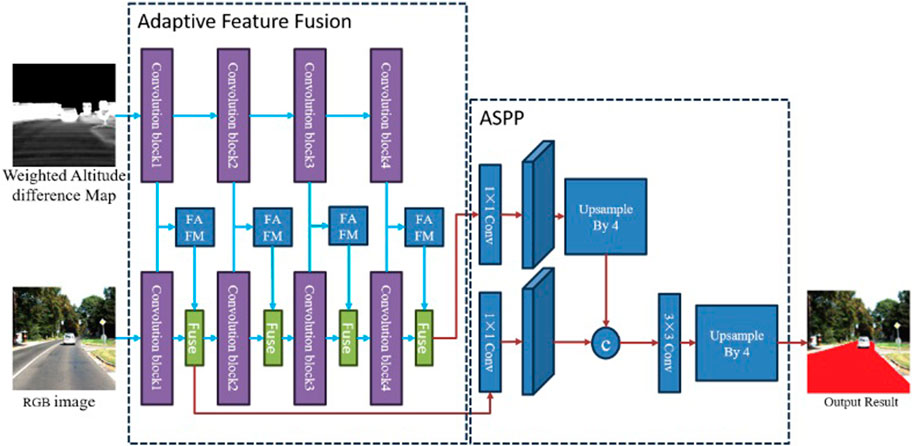
To integrate the transformed 3D point cloud data with visual image data for better road surface recognition results, we designed a dual-source feature adaptive fusion network, as shown in Figure 3.
The diverse input data sources within our network contribute to a notable disparity between features extracted from the altitude difference map and those derived from visual images. This disparity presents a challenge to the effective fusion of LiDAR and vision features, hindering seamless integration. To address this challenge, we have devised a methodology for refining features extracted from LiDAR point cloud data. This refinement process enhances the compatibility and synergistic enhancement of LiDAR features with visual features, consequently bolstering road perception performance based on visual inputs.
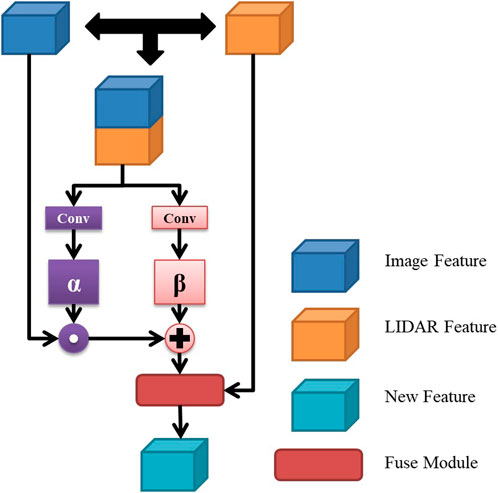
To materialize this approach, we have developed the Feature Adaptive Fusion Module (FAFM), a novel component comprising two essential elements: the Feature Transformation Network (FTN) and a multi-channel feature weighting cascaded network. The FTN is specifically engineered to adapt LiDAR-derived features to align more cohesively with visual features, facilitating a smoother integration process. Meanwhile, the multi-channel network orchestrates the weighted amalgamation of these refined features. The overarching architecture, illustrated in Figure 4, delineates a sophisticated system that harmoniously leverages the strengths of both LiDAR and visual data for superior road perception capabilities.
3.1 Feature transformation network
The primary objective of the Feature Transformation Network (FTN) is to conduct a linear transformation of LiDAR-derived features, generating new features that exhibit similarity and compatibility with visual image features. This linear transformation is achieved through the following formula:
Where,
The number of output channels for each layer is unified to 256.
3.2 Multi-channel feature weighted cascade network
The fusion function is achieved by taking the visual image features and the transformed lidar features as inputs, as shown below:
In the context of the road detection system, let k denote the features from the kth convolution stage of the Deep Convolutional Neural Network (DCNN), and
4 Experiments and results
This paper’s experimental evaluation comprises two distinct parts: 1) assessing the efficacy of fusing point cloud altitude difference data with the feature-adaptive module; 2) benchmarking the recognition accuracy against other leading road detection algorithms.
(1) In the first part, we conducted quantitative assessments of our algorithm’s enhancement in road perception accuracy on the public KITTI dataset. We configured three distinct network structures for this purpose: 1) Image: inputs only the visual image, representing the baseline unoptimized network; 2) Image + WADM (Weighted Altitude difference Map): combines the visual image with the adaptive weighted altitude difference map; 3) Image + WADM + FAFM: integrates the visual image and the adaptive weighted altitude difference map, incorporating the feature-adaptive fusion network for a fully optimized algorithm.
As depicted in Figure 5, the results before and after optimization reveal notable differences. The unoptimized road perception algorithm shows marginally weaker semantic segmentation, influenced more significantly by shadows and background luminosity. However, the optimizations, specifically the altitude difference conversion and feature-adaptive fusion, markedly enhance segmentation accuracy. These optimizations address semantic segmentation blurring due to shadows and object occlusion, improving the delineation of segmentation boundaries and the accuracy of distant object perception. Additionally, the integration of LiDAR data bolsters the segmentation effects across various environmental objects.
We further analyzed the performance enhancement of the altitude difference weighted transformation and feature adaptive fusion network. Comparative experiments were conducted under three scenarios, with statistical analyses of various performance metrics tabulated in Table 1. The results affirm that both improvements substantially optimize the algorithm. We used parameters such as MaxF, AP, PRE, and REC to evaluate the algorithm. Their meanings are as follows: MaxF stands for Maximum F1-measure; AP refers to Average Precision as used in PASCAL VOC challenges; PRE indicates Precision; and REC denotes Recall. Notably, the Image + WADM network configuration enhanced the MaxF by 1.49% compared to the baseline, underscoring the significant impact of incorporating LiDAR point cloud information. This addition also positively influenced other parameters, evidencing the improved robustness of the algorithm. The final algorithm model (Image + WADM + FAFM) exhibited the best performance overall, with notable advancements in recall rate and a more balanced performance across all parameters. This underscores the effectiveness and necessity of the feature-adaptive fusion network, confirming its pivotal role in enhancing the algorithm’s overall robustness.
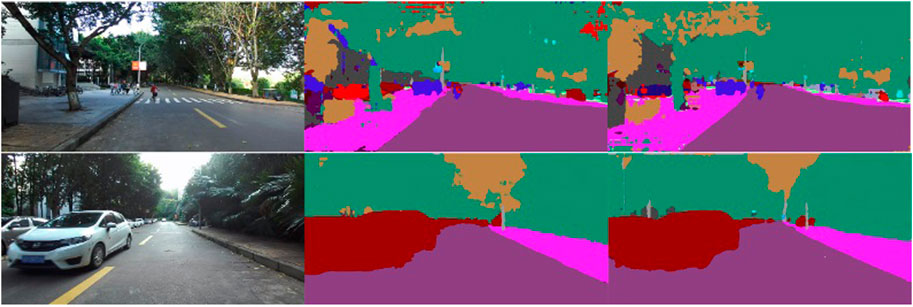
In addition, we tested the road perception accuracy of the algorithm before and after full optimization in a real environment. In Figure 6, the first column shows the original visual image (a) in the input network, the second column shows the road perception result under the Image condition (b), and the third column shows the road result under the Image + WADM + FAFM condition (c).
The road perception algorithm designed in this study performs well on both simple and complex structured roads. Compared with the algorithm before optimization, the proposed improvement scheme has improved the accuracy of the algorithm perception and has better robustness under different road conditions. The lane segmentation results are more detailed.
(2) In the lane boundary recognition accuracy experiment, the efficacy of our proposed algorithm was benchmarked against other leading algorithms on the KITTI road dataset. The training process is shown in Figure 7. As detailed in Figure 8; Table 2, our algorithm demonstrates substantial improvements across all accuracy parameters. However, it's noteworthy that the incorporation of two DCNN networks and the fusion network has resulted in a decrease in algorithm speed.
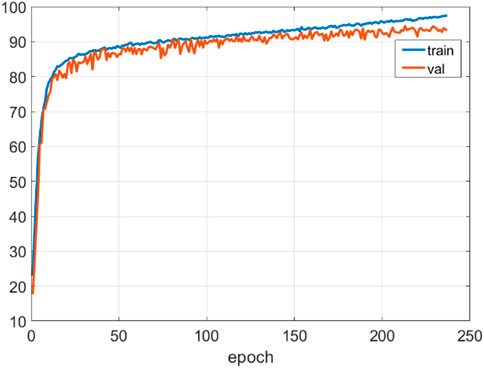
Figure 7. Training process diagram. The figure shows the changes in AP during the training process. The model quickly converged to a relatively high level after 50 epochs, and finally completed training after about 240 epochs.
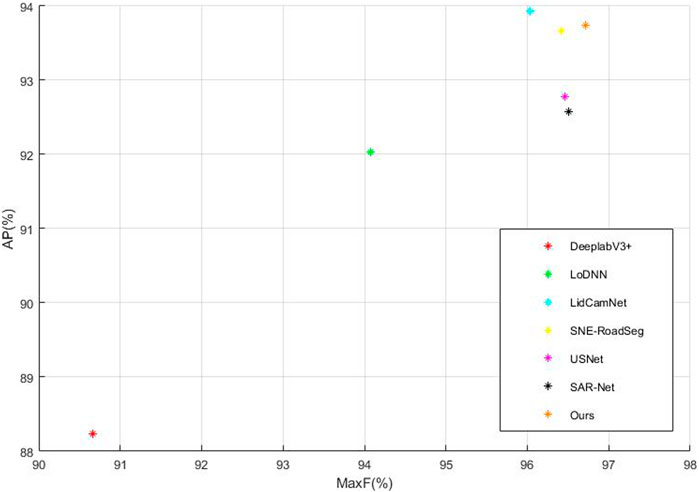
Figure 8. Comparison of different algorithms. We used MaxF and AP, the two most significant parameters, as comparison metrics. Our algorithm exhibited a considerable advantage in MaxF and achieved a second-best performance in AP.
When comparing specific inputs, the LoDNN network, which solely relies on point cloud data, and the DeeplabV3+, which only uses image data, both fall short in overall accuracy compared to algorithms that integrate Image + LiDAR inputs. Among algorithms that employ visual image and LiDAR point cloud data fusion, including LidCamNet, SNE-RoadSeg, USNet, SARNet, and our proposed algorithm, ours shows superior performance in MaxF, PRE, and REC parameters. Although it slightly lags behind LidCamNet in the AP parameter, it maintains a competitive edge.
Based on the subjective and objective evaluation indicators of comprehensive road perception and lane extraction, it can be proved that the algorithm proposed in this paper not only takes into account the effect of road perception, but also has high-precision lane extraction capability.
Our proposed up-sampling network, an enhancement of the Deeplabv3+ network, underwent comparative experiments with the original network. The detailed results, as shown in Figure 9, highlight the algorithm’s proficiency. The original image data, road perception results, and lane boundary details are sequentially presented. The proposed algorithm excels at delineating the intersection between lanes and other objects, yielding more precise lane extraction results. This improvement is attributed to the addition of lane edge constraints when converting LiDAR point cloud data into a weighted altitude difference map. This enhancement clarifies lane edge features, heightening their distinctiveness from other objects and facilitating the network’s ability to extract the lane area, thereby improving lane recognition accuracy.
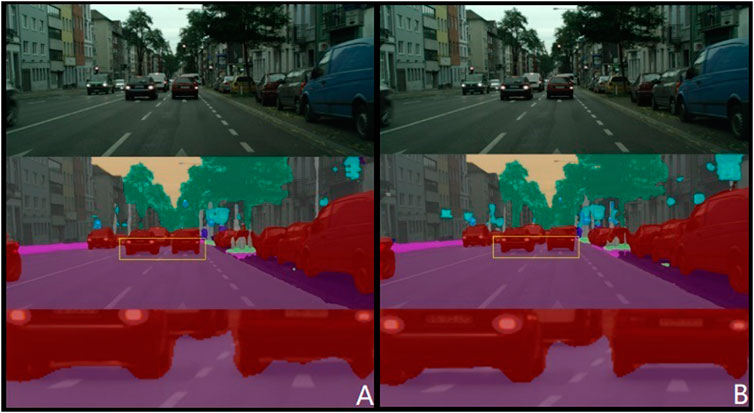
In Figure 10, a comparative analysis of segmentation results between two algorithms for lanes and sidewalks underscores our algorithm’s superior detection capabilities, even with distant objects. It achieves precise segmentation of lanes and sidewalks, thus significantly enhancing the accuracy of road segmentation at extended distances.
5 Summary
In this study, we meticulously preprocessed the LiDAR point cloud data by removing noise points and optimizing the information within the cloud. This refined 3D point cloud was then projected onto the image plane using specific calibration parameters. A pivotal method based on weighted altitude difference was developed for converting the LiDAR point cloud data. This technique harnessed the height consistency characteristic of flat road areas to extract an altitude difference map from the LiDAR-derived height map. We integrated neighborhood point distance constraints and road boundary point constraints, culminating in the formation of a detailed weighted height map. This innovative approach transforms 3D point cloud data into 2D weighted height map data, adeptly preserving road surface characteristics and accentuating road boundary features. This transformation lays a solid foundation for subsequent fusion with visual imagery. The incorporation of spatial point coordinate information in the point cloud data, coupled with boundary constraints during the conversion process, enabled the explicit representation of road boundary features. This enhancement made the delineation between road and non-road areas more pronounced, greatly benefiting the feature extraction capabilities of subsequent semantic segmentation networks. Additionally, the weighted altitude difference map addresses the susceptibility of visual images to lighting and shadow effects. It remains effective even under challenging conditions of strong light and shadow occlusion, consistently conveying comprehensive road information. The integration of this weighted altitude difference map has significantly bolstered the accuracy of our road perception algorithm, marking a substantial advancement in the field.
Data availability statement
Publicly available datasets were analyzed in this study. This data can be found here: https://www.cvlibs.net/datasets/kitti/eval_road.php Road/Lane Detection Evaluation 2013.
Author contributions
BW: Conceptualization, Data curation, Formal Analysis, Investigation, Resources, Software, Writing–original draft. ZL: Data curation, Formal Analysis, Resources, Writing–review and editing. XC: Funding acquisition, Supervision, Writing–original draft, Writing–review and editing. CF: Formal Analysis, Funding acquisition, Supervision, Writing–review and editing. MZ: Formal Analysis, Funding acquisition, Writing–review and editing. DS: Writing–review and editing. WW: Formal Analysis, Methodology, Writing–review and editing. SW: Funding acquisition, Project administration, Writing–review and editing.
Funding
The author(s) declare that financial support was received for the research, authorship, and/or publication of this article. The National Natural Science Foundation of China (Grant No. 62273063) the Science and Technology Innovation Key R&D Program of Chongqing, China (Grant No. CSTB2022TIAD-STX0003) the China National Foreign Experts Program (G2022165017L).
Conflict of interest
Authors BW and XC were employed by China Merchants Auto-trans Technology Co., Ltd. Authors BW, XC, and CF were employed by China Merchants Testing Vehicle Technology Research Institute Co., Ltd. Author WW was employed by Chongqing Expressway Group Co., Ltd.
The remaining authors declare that the research was conducted in the absence of any commercial or financial relationships that could be construed as a potential conflict of interest.
Publisher’s note
All claims expressed in this article are solely those of the authors and do not necessarily represent those of their affiliated organizations, or those of the publisher, the editors and the reviewers. Any product that may be evaluated in this article, or claim that may be made by its manufacturer, is not guaranteed or endorsed by the publisher.
References
1. Zhang W. Lidar-based road and road-edge detection. In: IEEE Intelligent Vehicles Symposium. IEEE; June, 2010; La Jolla, CA, USA (2010). p. 845–8.
2. Chen T, Dai B, Wang R, Liu D. Gaussian-process-based real-time ground segmentation for autonomous land vehicles. J Intell Robotic Syst (2014) 76(3):563–82. doi:10.1007/s10846-013-9889-4
3. Asvadi A, Premebida C, Peixoto P, Nunes U. 3D Lidar-based static and moving obstacle detection in driving environments: an approach based on voxels and multi-region ground planes. Robotics Autonomous Syst (2016) 83(83):299–311. doi:10.1016/j.robot.2016.06.007
4. Wijesoma WS, Kodagoda KRS, Balasuriya AP. Road-boundary detection and tracking using ladar sensing. IEEE Trans robotics automation (2004) 20(3):456–64. doi:10.1109/tra.2004.825269
5. Chen L, Yang J, Kong H. Lidar-histogram for fast road and obstacle detection. In: IEEE international conference on robotics and automation (ICRA); May, 2017; Singapore (2017). p. 1343–8.
6. Thrun S, Montemerlo M, Dahlkamp H, Stavens D, Aron A, Diebel J, et al. Stanley: the robot that won the DARPA grand challenge. J field Robotics (2006) 23(9):661–92. doi:10.1002/rob.20147
7. Gu S, Zhang Y, Yang J, Kong H. Lidar-based urban road detection by histograms of normalized inverse depths and line scanning. In: 2017 European Conference on Mobile Robots (ECMR); September, 2017; Paris, France (2017). p. 1–6.
8. Fernandes R, Premebida C, Peixoto P, Wolf D, Nunes U. Road detection using high resolution lidar. In: 2014 IEEE Vehicle Power and Propulsion Conference (VPPC); October, 2014; Coimbra, Portugal (2014). p. 1–6.
9. Caltagirone L, Bellone M, Svensson L, Wahde M. LIDAR–camera fusion for road detection using fully convolutional neural networks. Robotics Autonomous Syst (2019) 111(111):125–31. doi:10.1016/j.robot.2018.11.002
10. Han X, Lu J, Zhao C, Li H. Fully convolutional neural networks for road detection with multiple cues integration. In: 2018 IEEE International Conference on Robotics and Automation (ICRA); May, 2018; Brisbane, QLD, Australia (2018). p. 4608–13.
11. Liu H, Yao Y, Sun Z, Li X, Jia K, Tang Z. Road segmentation with image-LiDAR data fusion in deep neural network. Multimedia Tools Appl (2020) 79(47):35503–18. doi:10.1007/s11042-019-07870-0
12. Chen LC, Papandreou G, Schroff F, Adam H. Rethinking atrous convolution for semantic image segmentation[J] (2017). doi:10.48550/arXiv.1706.05587
13. Caltagirone L, Svensson L, Wahde M, Sanfridson M. Lidar-camera Co-training for semi- supervised road detection[J] (2019). doi:10.48550/arXiv.1911.12597
14. Gu S, Yang J, Kong H, A cascaded LiDAR-camera fusion network for road detection. In: 2021 IEEE International Conference on Robotics and Automation (ICRA); May, 2021; Xi'an, China (2021).
15. Fan R, Wang H, Cai P, Liu M, SNE-RoadSeg: incorporating surface normal information into semantic segmentation for accurate freespace detection. In: European Conference on Computer Vision; October, 2020; Tel Aviv, Israel (2020). p. 340–56.
16. Chang Y, Xue F, Sheng F, Liang W, Ming A, Fast road segmentation via uncertainty-aware symmetric network. In: IEEE International Conference on Robotics and Automation (ICRA); May, 2022; Philadelphia, PA, USA (2022).
17. Lin H, Liu Z, Cheang C, Xue X. SAR-net: shape alignment and recovery network for category-level 6D object pose and size estimation[J] (2021). doi:10.48550/arXiv.2106.14193
18. Chen L, Papandreou G, Kokkinos I, Murphy K, Yuille A, Deeplab: semantic image segmentation with deep convolutional nets,atrous convolution, and fully connected CRFS. IEEE Trans Pattern Anal Machine Intelligence (2017) 40:834–48. doi:10.1109/tpami.2017.2699184
19. Wang P, Chen P, Yuan Y, Liu D, Huang Z, Hou X, et al. Understanding convolution for semantic segmentation. In: Proceedingsof the 2018 IEEE Winter Conference on Applications of Computer Vision(WACV); March, 2018; Lake Tahoe, NV, USA. p. 1451–60.
20. Xiang T, Zhang C, Song Y, Yu J, Cai W. Walk in the cloud: learningcurves for point clouds shape analysis. In: Proceedings of the IEEE/CVF International Conference onComputer Vision (ICCV); October, 2021; Montreal, QC, Canada (2021). p. 915–24.
21. Yu X, Tang L, Rao Y, Huang T, Zhou J, Lu J. Point-bert: pre-training 3dpoint cloud transformers with masked point modeling. In: Proceedings of the IEEE/CVF Conference on Computer Vision and Pattern Recognition (CVPR); June, 2022; New Orleans, LA, USA (2022).
Keywords: road vehicles, convolutional neural nets, image processing, data fusion, semantic segmentation
Citation: Wang B, Long Z, Chen X, Feng C, Zhao M, Sun D, Wang W and Wang S (2024) Research on LiDAR point cloud data transformation method based on weighted altitude difference map. Front. Phys. 12:1387717. doi: 10.3389/fphy.2024.1387717
Received: 18 February 2024; Accepted: 06 May 2024;
Published: 04 June 2024.
Edited by:
Guanqiu Qi, Buffalo State College, United StatesReviewed by:
Mianyi Chen, Xverse Co., Ltd., ChinaYixin Liu, China Academy of Engineering Physics, China
Yongfeng Liu, Yangzhou University, China
Yukun Huang, Shanghai United Imaging Medical Technology Co., Ltd., China
Maria Del Rocio Camacho Morales, Australian National University, Australia
Copyright © 2024 Wang, Long, Chen, Feng, Zhao, Sun, Wang and Wang. This is an open-access article distributed under the terms of the Creative Commons Attribution License (CC BY). The use, distribution or reproduction in other forums is permitted, provided the original author(s) and the copyright owner(s) are credited and that the original publication in this journal is cited, in accordance with accepted academic practice. No use, distribution or reproduction is permitted which does not comply with these terms.
*Correspondence: Min Zhao, emhhb21pbkBjcXUuZWR1LmNu
 Bosi Wang
 Zourong Long
 Xinhai Chen1,2,3
 Chenjun Feng