 Muhammad Waheed Rasheed
 Abid Mahboob
 Iqra Hanif
94% of researchers rate our articles as excellent or good
Learn more about the work of our research integrity team to safeguard the quality of each article we publish.
Find out more
ORIGINAL RESEARCH article
Front. Phys., 18 April 2024
Sec. Chemical Physics and Physical Chemistry
Volume 12 - 2024 | https://doi.org/10.3389/fphy.2024.1381887
In this article, a quantitative structure-property relationship is performed for the prediction of six physico-chemical properties of 16 alkaloid structures using three different types of degree-based topological indices. Chemical structures are considered as graphs, where elements are taken as vertices and bounds between them are taken as edges. We defined two new degree-based topological indices, namely, the “modified harmonic index” and the “advanced harmonic index,” to analyze and examine the properties of alkaloids. The topological indices and experimental values act as the inputs of linear and quadratic regression models. The correlation values and p-values for all the indices are significant which describe the validity and usefulness of the results. The outcomes determined in this article assist pharmacists and chemists in studying the structures of alkaloids for use in daily life, agriculture, pharmacy, and industries. The study of chemical structures with the help of molecular descriptors and regression models is a theoretical method that saves time and money.
Alkaloids are a large group of organic compounds found in nature and have structures that contain nitrogen atoms. They are odorless, colorless, crystalline liquids with a yellowish tint and commonly have a bitter flavor. Plants are the major sources of alkaloids, which have been used as medicines for hundreds of years. The agricultural industry relies heavily on alkaloids for herbicides and pesticides. They have a wide range of physiological effects on animals and humans.
Galantamine is used to treat the symptoms of Alzheimer’s disease, which is a brain disease that slowly destroys memory as well as the ability to think, learn, communicate, and manage daily activities. Salsoline is a drug that is used as an antihypertensive because it crystallizes in alcohol solutions. The fruit of the Piper nigrum (black pepper) plant yields piperine. It has numerous pharmacological effects and numerous health benefits, particularly against chronic diseases like insulin resistance reduction, anti-inflammatory effects, and hepatic steatosis improvement. Lycorine hydrochloride is one of many derivatives of lycorine used in cancer research. Tomatoes, potatoes, and the tobacco plant all contain nicotine. It is a stimulant that is used to treat smoking addiction because it speeds up the transmission of messages between the brain and body. The coffee plant is the main source of caffeine, which is used to treat headaches, improve athletic performance, improve mental alertness, and treat obesity. To study the role of alkaloids in production of different disease drugs see [1, 2].
Alkaloids are toxic and addictive, and can cause serious illness if used without supervision. Itching, nausea, vomiting, and mild gastrointestinal disturbances are the mild toxic effects. Chronic effects include psychosis, paralysis, teratogenicity, arrhythmias, and sudden death. Coniine is an alkaloid that causes respiratory arrest and is referred to as the “killer of Socrates.” Tropane can cause mydriasis, mouth dryness, thirst, diarrhea, confusion, hallucinations, ataxia, convulsions, and respiratory failure-related death. To study the toxic effects of alkaloids on human and other organism’s health see [3].
The topological index is a function that converts molecular structures into structural descriptors expressed as numerical indices. Topological indices should be interpreted structurally, have a good correlation with at least one property, be locally defined, be independent of other descriptors, be simple, have a correct size dependence, and change slowly as structures change. A set of parameters known as chemical descriptors are calculated for the chemical compound under study [4]. Topological indices fall into one of five distinct subcategories: degree, distance, mixed, matching, and eigenvalue. This article discusses degree-related indices for sixteen commonly used alkaloid structures. The idea of a topological index was given by Harry Wiener in 1947 to calculate the boiling points of alkanes [5]. This index was a distance-related index that proved to be a bridge between chemistry and mathematics. After some years, degree-related indices such as the Zagreb and Randic indices are introduced. The degree-related indices are the most useful and successful indices, especially to understand the chemical structures [6]. Quantitative structure-property relationship (QSPR) models are used in chemistry to predict the properties of chemical compounds based on their molecular structure. These models use mathematical equations or algorithms to correlate the structure of molecules with their physical, chemical, or biological properties. QSPR models offer valuable insights into compounds’s properties without extensive experimental testing, saving time and resources in areas like drug discovery, environmental studies, and material science. They can help predict the biological activity, toxicity, and pharmacokinetic properties of new compounds, assess the environmental fate of chemicals, predict the properties of polymers, solvents, and catalysts, and support regulatory decisions. In short, QSPR models accelerate the design and development of new compounds and materials while minimizing the need for costly and time-consuming experimental testing. For more information about QSPR models and their results, see [7–10].
The correlation coefficient (r) between physico-chemical properties and topological indices is used to determine if a topological index can be used to predict the behavior of a chemical compound. The topological indices with r greater than 0.8 are very useful in QSPR and QSAR analysis. A large number of articles have been written on the significance of the degree-related indices using the statistical approach. This work motivated us to study the degree-related indices and alkaloid structures. In recent times, Zhang et al. made a study on the QSPR analysis of malaria medications in which nine medications were taken into consideration for the regression analysis of six physicochemical properties [11]. Fozia et al. analyze the nine drugs of cardiovascular disease by using eight definitions of degree-related indices [12]. The QSPR modeling of drugs came to the conclusion that the ABC index, which has a correlation of 0.984, is used to approximate molar volume, the R index is useful for measuring molar refractivity, with correlations of 0.990, and the GA index is used to predict the polarity of cardiovascular drugs, with a correlation of 0.988. Gnanaraj et al. studied the ten commonly used painkillers with the help of degree-related indices and different regression models [13]. The effectiveness of the TIs is examined by different regression models, such as linear and quadratic, used for understanding the structures of alkaloids. Abid et al. studied the medicines used for the treatment of lyme disease [14]. The QSAR modeling of the statistical data of lyme drugs show that there is a strong relationship between experimental and estimated values of the medicines. Parveen et al. studied the rheumatoid arthritis treatment medicines by applying degree-related indices and statistical analysis [15].
This article consists of six sections. Section 1 has information about the alkaloids and basic formulae used for computations. Section 2 provides an explanation of the working procedure and methods. Section 3 contains experimental and estimated values of the alkaloids’ structures. An example to explain the way of calculating topological indices is also discussed in this section. All the statistical work is done in Section 4. This section contains detailed information about the linear and quadratic models. Section 5 has a discussion of results, their importance and applications. The conclusion and future work are explained in Section 6. The references related to the article are mentioned at the end of the article.
Let
In 2020, Jamil et al. introduced the concept of the face index to understand the characteristics of benzenoid hydrocarbons [16]. He studied 21 benzene derivative structures with the help of the face index. He calculated the boiling point and π-electron energy of benzene derivatives with the face index using multilinear regression. The boiling point and π-electron energy were already calculated with the help of different degree-related indices, but FI gave the maximum correlation with the structures. The FI is basically related to the shape and geometry of structures. The π-electron energies give r = 0.9933 and r = 0.9996 for linear and multivariate correlation, respectively. The linear and multivariate correlations between FI and the boiling point of benzene derivatives are r = 0.9886 and r = 0.9985. The FI show a very high correlation and a very low percentage of error for determining the boiling point and pi electron energies of benzenoid hydrocarbons. A face f ∈ F(G) is incident to an edge e ∈ E(G) if e is one of those edges which surrounds the face. Similarly, a face f ∈ F(G) is incident to a vertex h in G if h is at the end of one of those incident edges. The face index is determined by using degree of the vertex “h” incident on the face f of a graph. The mathematical definition of face index is:
where v ∼ f represents the incidency of the vertex h with the face f.
After 1 year, Ding et al. studied the characteristics and features of the regular hexagonal lattices and nanotubes [17]. The structures of nanotubes are extremely useful in technology today. The face index is used for the analysis of polycyclic compounds such as silicon and honeycomb networks [18].
The neighborhood face index is introduced by explaining the significance of the face index. In the case of FI, the degree of the vertices is counted, and in NFI, the sum of degrees of vertices is counted. The mathematical definition of NFI is:
where h ∼ f represents the incidency of the vertex h with the face f. In 1972, Gutman and Trinajstic proposed a formula to investigate the effect of total π-electron energy on a molecule’s structure called the first Zagreb index [19]. The sum of the squares of the vertex degrees Φh and Φk of vertices h and k in
The M-indices are the most widely used and powerful topological indices for understanding the structures of a large number of chemical and non-chemical graphs. A large number of articles have been written on M-indices. In 2018, Gutman et al. analyzed and examined the work done by the M-indices. He investigated the seven distinct Zagreb indices; leap, reduced, coindices, banhatti, reformulated, sigma, and generalized Zagreb indices that exist [21].
In 2019, Mondal et al. proposed the concept of neighborhood topological indices to examine the properties of octane isomers [22]. He introduced a new approach to calculating all the old indices in a different way. He used the linear regression model and neighborhood indices to estimate the physical parameters of octane isomers. The neighborhood Zagreb indices are computed as:
The neighborhood sum indices proved to be very effective in studying the different properties of the chemical structures. In the same year, Modal et al. studied the graphene and the line graph of the graphene with the help of these indices [23]. The neighborhood sum degree indices are very powerful. In 2022, Chamua et al. studied the polycyclic aromatic hydrocarbons using these indices and obtained a valid and significant correlation [24].
In 1987, Fajtlowicz proposed the idea of the harmonic index in computer science to study different networks [25]. In 2012, Zhong introduced this concept in chemistry [26]. He investigated the minimum and maximum values of the H-index for the tree graphs. He also studied simple and connected graphs in general, using the H-index. The mathematical definition of H-index is:
The harmonic index has lots of implications in different fields like computer science, group theory, chemistry, and pharmacy. Shao et al. make use of the H-index and regression analysis to examine the characteristics of cancer treatments [27].
In 2019, Verma et al. proposed the neighborhood harmonic index to examine the bismuth tri-iodide graphs [28]. The neighborhood sum-degree harmonic index proposed by inspiring from harmonic index has high values of correlation with different chemical compounds. The neighborhood harmonic index is abbreviated as NH
We introduced the two unique indices inspired by the harmonic index. The formula that has the square root of the sum and product of edge degrees is called the modified harmonic index (MHI), and the formula that has the sum of the square root of degrees is called the advanced harmonic index (AHI). These indices show a strong relationship with the chemical structures of alkaloids. The mathematical definitions of the MH and AH indices are:
Arockiaraj et al. (2023) recently introduced the concept of hybrid indices and applied it on the famous classical degree-based topological indices to understand the properties of polycyclic aromatic hydrocarbons [29]. For more information and deep analysis of different topological indices see [30, 32–34]. Arockiaraj et al. [31] recently studied the properties of blood cancer drugs with the help of different types of topological indices and statistical tools.
This article has two kinds of computations: the calculation of topological indices and statistical analysis. All the descriptors are of an additive nature, meaning that results are obtained by adding the terms. The indices, namely,
• Find the vertex degrees, neighborhood degrees and divide the edges of all the alkaloids structures according to the edge partitions.
• Put the values of all the edge partitions into the formulae of the degree-related topological indices and collected the experimental values of the properties of alkaloid structures by ChemSpider.
• The experimental values and estimated values are the inputs of the linear and quadratic regression models.
• Analysis the relationship between experimental values and estimated values by the help of SPSS.
• The molecular descriptors with good correlations are significant and non-significant values are not useful to describe the properties of alkaloid structure. Apply other indices to get a good correlation for these not-significant values, such as logP and melting point.
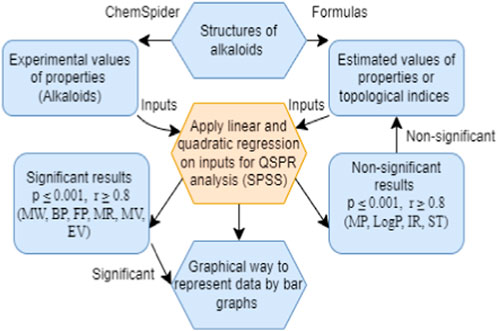
Figure 1. Procedure to estimate the properties of alkaloids.
This section is divided into two subsections that discuss the experimental and estimated values of the alkaloid structures. The first part discusses the six parameters of alkaloids structures, their units, and their importance. The second part of the deal has the estimated values. The values of topological indices are the predictive values of the physical parameters of alkaloids. There are hundreds of indices that have been introduced till now, but only those indices called the predicting values whose correlation is very strong.
There are six characteristics of all the alkaloids’ structures that are estimated with the help of different molecular descriptors. There are several types of alkaloids found in nature, but only 16 are examined with the help of topological indices and regression models. The 16 alkaloids given in Figure 2, namely, galantamine, salsoline, piperine, lycorine, nicotine, caffeine, reserpine, colchicine, emetine, physostigmine, vohimbine, vincamine, tropolone, phennylethylamine, aporphine, and indolizidine, are used to be analyzed by the QSPR modeling. The chemicals that are extracted from plants, called alkaloids, have multi-dimensional structures in real life, but we study the two-dimensional graphs. The unit of molar weight used in this manuscript is g/mol. It is clear from Table 1 that reserpine has the highest values of molar weight and tropolone has the lowest values of molar weight. All the structures and data about drugs are taken from ChemSpider, a reliable source for chemical information. The molecular structures of alkaloids are given in Figure 2.

Figure 2. Structures of alkaloids.

Table 1. Physicochemical properties of alkaloids.
The molar weight of the chemicals describe the simpler and complex nature of the structures. The molar wight has sharp values but other five properties such as boiling point, flash point, enthalpy of vaporization, molar refractivity and molar volume do not have sharp values. Their values are different on the different places so a range or predicted values of these parameters are used. The boiling point is the temperature at which a liquid boils and turns into vapor. The unit of BP is degrees Celsius, and colchicine has maximum values of BP BP(726 ± 60). Out of all the selected alkaloids, colchicine has the highest FP values. The flash point is the lowest temperature (in degrees Celsius) at which a liquid in a test vessel produces enough vapor to combine with the air at its surface to ignite. The unit of EV, MR and MV are kJ/mol, cm3 and cm3, respectively. The units of parameters do not effect the correlation but must be same for all chemical structures.
There are three types of degree-related indices studied in this manuscript to get a suitable and perfect correlation with the parameters of alkaloids. The face index and neighborhood degree face index are related to the overall degrees of face in a structure. It involves the outer degree of the face and the inner degree of the face. There are a total of nine faces of different degrees present in alkaloid structures. The degrees of faces are f12, f13, f14, f15, f16, f17, f18, f19 and an external face f∞. There are 23 possible faces of neighborhood degrees are f25, f28, f29, f31, f32, f33, f34, f35, f36, f37, f40, f41, f42, f43, f44, f45, f46, f47, f49, f52, f55 and one external face f∞. The numerical descriptors such as
The numerical descriptors such as;
The face index of a graph G is determined by the vertex’s incidence on the faces. The term h ∼ f means the vertex h is incident on the face f. In face index, first we count and mention all the degrees of the vertices in the graph, and then count the internal and external degrees of the faces of the graph. The face index in a detailed way is determined below for the structure of naphthalene. Here f∞ is the external degree computed by adding all the degrees of vertices in outer layer of the graph. The face index values are mentioned on the structure of naphthalene is Figure 3.
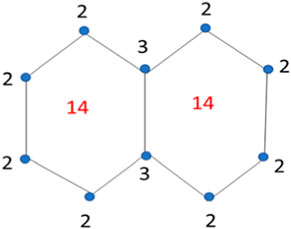
Figure 3. Face index of Naphthalene.
The computations of three type of indices for the 16 structures of alkaloids are very lengthy, so only the resultant values of the topological indices are mentioned in Table 2. Galanthamine is the first structure on the list of alkaloids. We apply some index formulae to the structure of galanthamine to clarify the concepts related to face index, neighborhood face index, simple edge partition, neighborhood edge partition, and the newly introduced modified harmonic index.
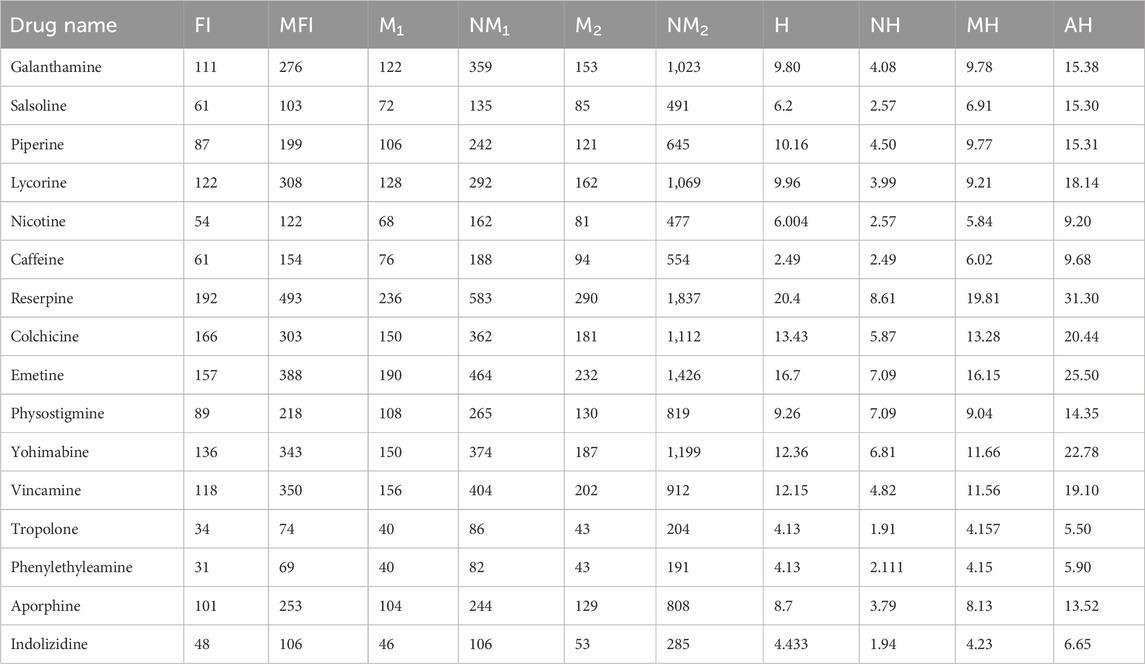
Table 2. Estimated values of the physicochemical parameters of alkaloids.
The face index of galanthamine is computed as:
The neighborhood degree face index for galanthamine is calculated as follows:
There are 24 edges and 21 vertices in the chemical structure of galanthamine. The edges galanthamine structure can be divided into seven packets such as; |E(1,2)| = 1, |E(2,3)| = 11, |E(3,1)| = 2, |E(4,2)| = 2, |E(4,3)| = 2, |E(3,3)| = 3, |E(2,2)| = 3. The harmonic index for galanthamine is determined as:
The newly introduced modified harmonic index is based on the simple degree edge partition and can be determined as:
The neighborhood partition of edges is basically the sum of incident degree on a vertex. There are 16 parcels of edges with the respective frequencies are; |S(2,4)| = 1, |S(5,3)| = 2, |S(4,7)| = 1, |S(6,8)| = 3, |S(5,6)| = 2, |S(5,5)| = 2, |S(6,7)| = 1, |S(7,5)| = 2, |S(5,6)| = 2, |S(5,5)| = 1, |S(7,8)| = 1, |S(8,10)| = 1, |S(7,10)| = 1, |S(6,10)| = 2, |S(8,10)| = 1 and |S(10,10)| = 1. The neighborhood harmonic index is calculated as:
The neighborhood partition of edges is basically the sum of incident degree on a vertex. There are 16 parcels of edges with the respective frequencies are; |S(2,4)| = 1, |S(5,3)| = 2, |S(4,7)| = 1, |S(6,8)| = 3, |S(5,6)| = 2, |S(5,5)| = 2, |S(6,7)| = 1, |S(7,5)| = 2, |S(5,6)| = 2, |S(5,5)| = 1, |S(7,8)| = 1, |S(8,10)| = 1, |S(7,10)| = 1, |S(6,10)| = 2, |S(8,10)| = 1 and |S(10,10)| = 1. The neighborhood harmonic index is calculated as:
All the topological indices given in Table 2 are calculated in the similar manner as describe in the example mentioned above.
This section discusses all the statistical computations used in this manuscript. There are two regression equations used for the desired and accurate results of the alkaloids. The simple linear regression equation compares the data according to the straight line. The quadratic regression involves the square of the dependent variable, so compare the data with the parabolic curve. If the coefficient of the square term becomes zero, then the quadratic equation of regression converts into a linear one. A straight line is used in linear regression models, whereas a curved line is used in logistic and nonlinear regression models. The regression equations are given in the first part of this section, and parameters related to the statistical computations are discussed in the second part of this section.
A simple linear regression determines the interaction of two quantitative variables. It uses a linear equation to quantitatively describe the relationship between the unknown or dependent variable and the known or independent variable. A statistical method called quadratic regression is used to find the parabola equation that best fits a set of data. A quadratic equation depicted on a scatter plot takes the form of a concave or convex “U” shape. The equations of regression used in computations are defined as follows:
where Y is dependent or response and X is representing the independent variable. The term “a” is the constant of the linear and quadratic regressions. The term bn (n = 1,2) are coefficients of regression. The quadratic regression is also called the polynomial regression of degree two. The number of coefficients bn varies with the power of the independent variable X. The term Y stands for the properties of the alkaloid structures and X stands for the simple degree and neighborhood degree related topological indices. All the equations of the both regression are discussed for the ten degree related TIs. The equations of the regression are given in parallel for a better comparison of the data. The statistical computation is done using SPSS software. It is clear from the equations given below that the values of the coefficient of X2 are approximately zero. The small values of coefficients of X2 describe that no scatter plot is “U” shaped. The values of the slopes and intercepts are negative as well as positive for all six properties of the alkaloid structures.
The significance, importance, and variations of each statistical parameter in relation to the T-indices are discussed in this section. There are five parameters related to statistics that are used to indicate the importance of computations. A population’s size is typically referred to by the parameter N. 16 alkaloid structures are used, and the sample size is the same for all alkaloid properties. Two tests, the p-test and the F-test, are used to test the null hypothesis. The p-value is the least significant point at which the null hypothesis would be rejected, and a higher p-value means a greater chance that the experiment will fail. If the values of p are zero, then it is an ideal significant value. The range of p values varies from 0 to 1. It is clear from the tables given below that all the values of p are less than 0.001≅0. The p-test is significant if p ≤ 0.05 but in this manuscript, the p values for all the computations are lower than 0.001, which is evidence of a significant experiment. There are ten indices applied to six properties of alkaloid structures. The eight indices that are already defined are great indices with very low p values, but two indices introduced in this article, namely, the modified harmonic index and the advanced harmonic index, also have significant p values. A positive sign for experiment selection is an F-test score greater than 2.5. F values can be anything from 0 to an infinitely large number. The range of F-test values for the face index is 23.1705–81.3911, given in Table 3. The values of the F-test for the NF-index vary from 14.2701 to 82.3884, which is much higher and more significant than the 2.5 given in Table 4. In both, linear and quadratic regression the maximum and minimum values of F for first Zagreb indices are 26.2429–622.0212 given in Table 5. It is clear from Tables 3–12 that no topological index show less value than 2.5 that represents all TI are significant according to F-test.
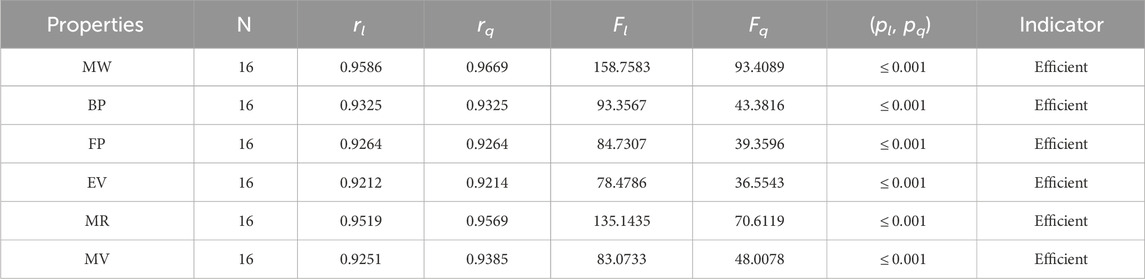
Table 3. Statistical parameters of linear and quadratic QSPR model for F
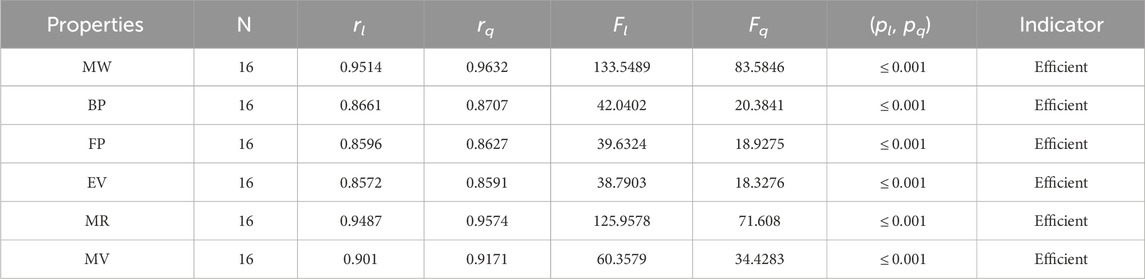
Table 4. Statistical parameters of linear and quadratic QSPR model for NF
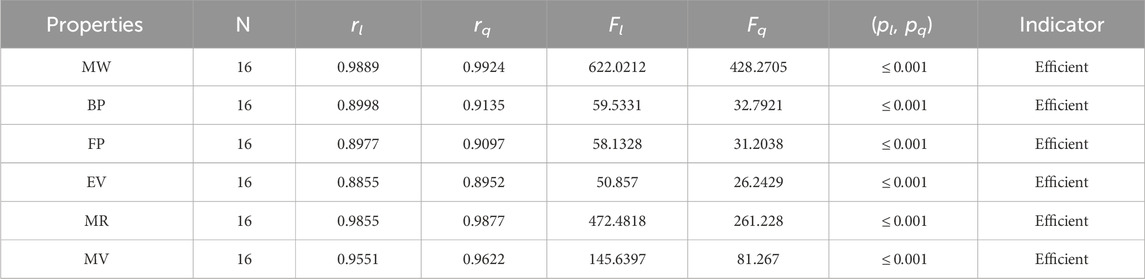
Table 5. Statistical parameters of linear and quadratic QSPR model for
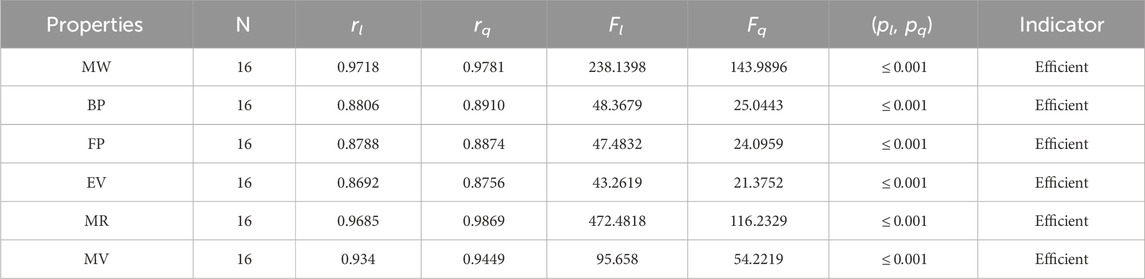
Table 6. Statistical parameters of linear and quadratic QSPR model for
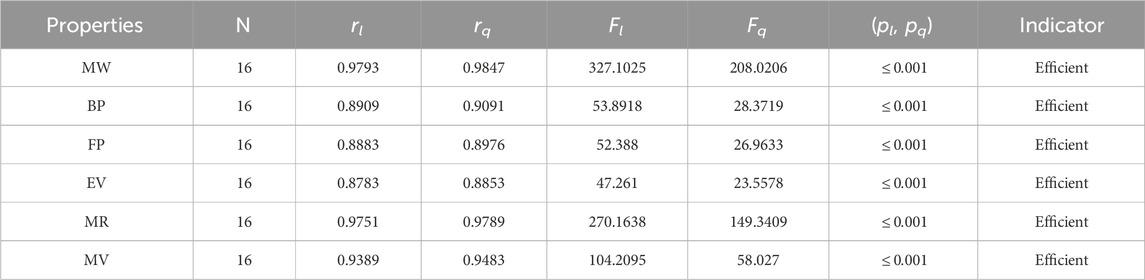
Table 7. Statistical parameters of linear and quadratic QSPR model for
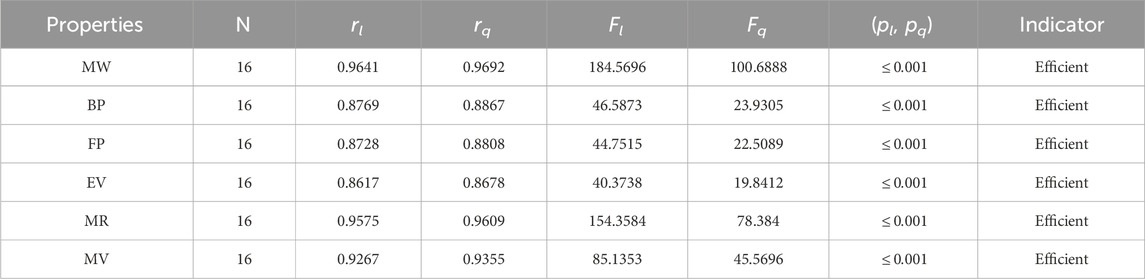
Table 8. Statistical parameters of linear and quadratic QSPR model for
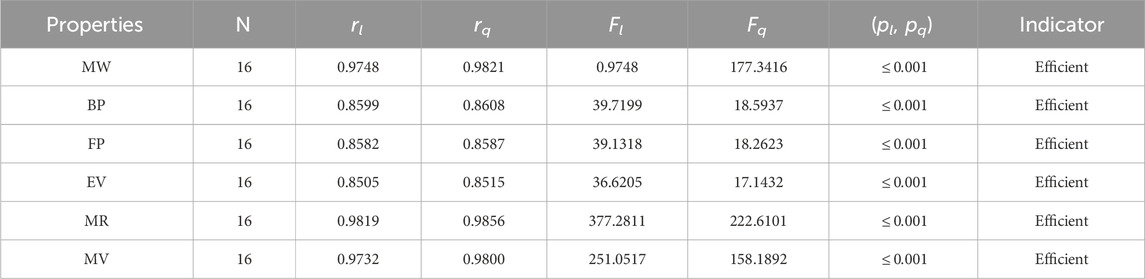
Table 9. Statistical parameters of linear and quadratic QSPR model for H
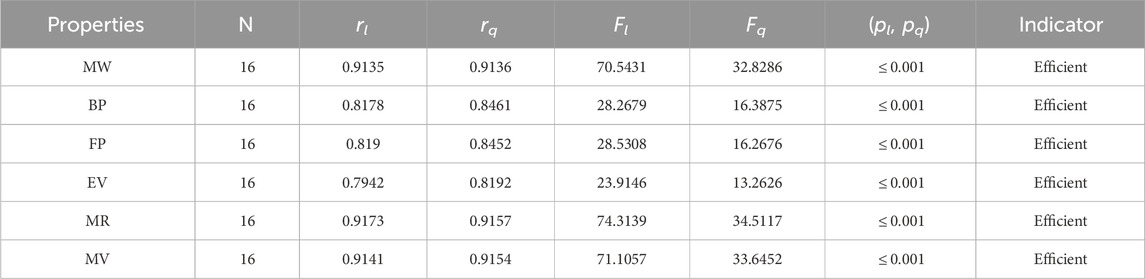
Table 10. Statistical parameters of linear and quadratic QSPR model for NH
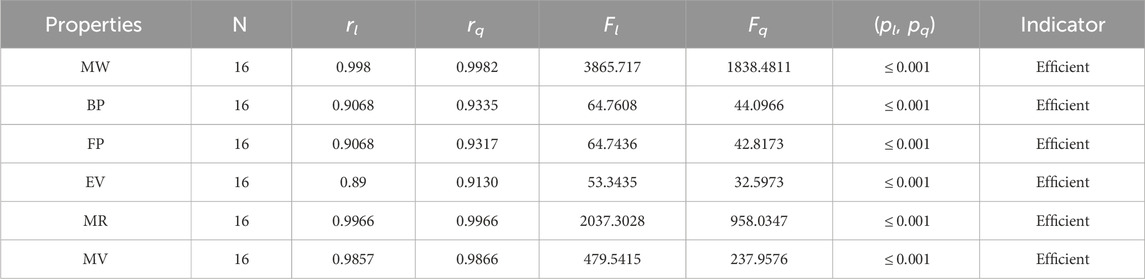
Table 11. Statistical parameters of linear and quadratic QSPR model for MH
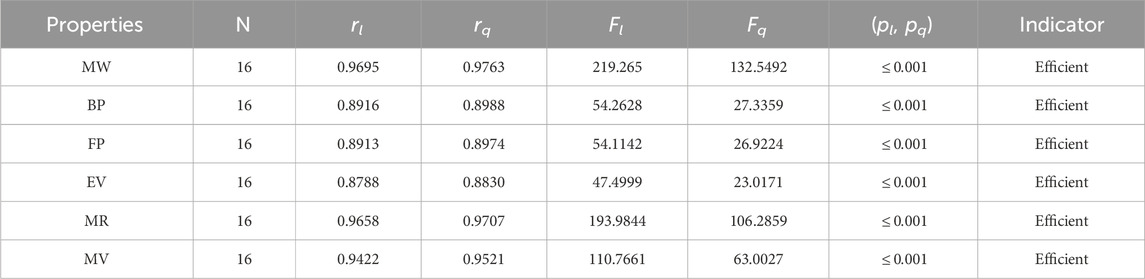
Table 12. Statistical parameters of linear and quadratic QSPR model AH
The parameters rl, Fl, pl, rq, Fq, pq represent the correlation coefficient, F-test and p-test values of the linear as well as the quadratic regression respectively. A correlation coefficient is a number that describes the relationship between two quantities and is represented by r. The values of r lie between −1 and 1. The values of r may be negative and positive according to the nature of the relationship between two quantities. The number r near zero shows no relation and near −1 or 1 is a very strong correlation. There are six properties of the alkaloid structures are examined with the help of statistical tools but no correlation value is less than 0.6. It can be observed from Tables 3–12 almost the correlation values between TIs and properties of alkaloids are greater than 0.8. The correlation between flash point and face index in quadratic regression is only the low correlation r = 0.6638. There is no index in linear and quadratic regression that shows the inverse relationship with negative values of the correlation coefficient.
Linear and quadratic regression models have different curves. We applied two regression models to get good, suitable, and significant results. It is clear from Tables 3–12 that the results of quadratic regression are higher and more beneficial in studying the properties of alkaloids. A number of articles have been written on the same pattern, using more than two regression models. The use of two regression models tells us which is better and also gives the computational comparison. Using multiple regression models in an article enhances analysis robustness, reliability, and depth, enabling researchers to explore diverse data aspects and draw more comprehensive conclusions. The linear regression model is good, but the quadratic model has more relevance without results for alkaloid structures. Quadratic models are useful for capturing complex relationships in real-world data, allowing for curved relationships, and detecting nonlinearity. They improve model fit, leading to more accurate predictions and a better understanding of underlying phenomena. Quadratic models also capture curvature, providing a more nuanced interpretation. They can also identify threshold effects, which are crucial in fields like economics and environmental science.The graphs of all six properties, such as molar weight, boiling point, enthalpy of vaporization, flash point, molar refractivity, and molar volume, are given in Figures 4–9. The regression models of all properties are described with the first Zagreb index. The QSPR analysis of all the numerical descriptors is done in the same way. In every graph, the relationship is significant, but quadratic regression seems to be more suited to estimating the properties of alkaloids.
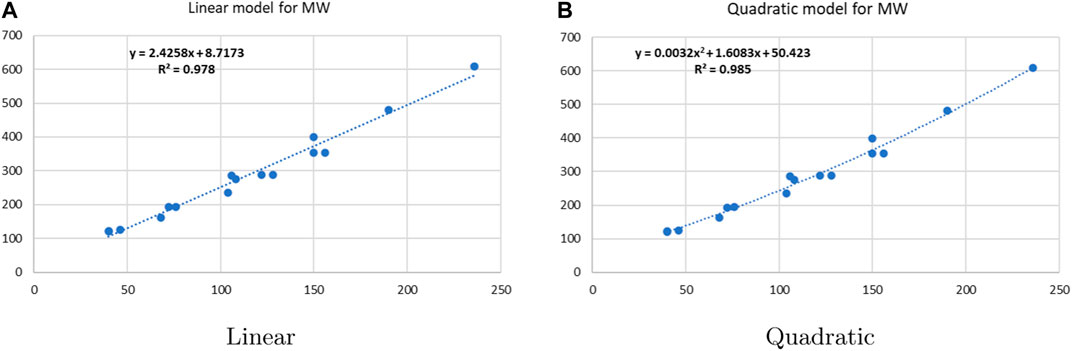
Figure 4. Linear vs. quadratic regression for molar weight.
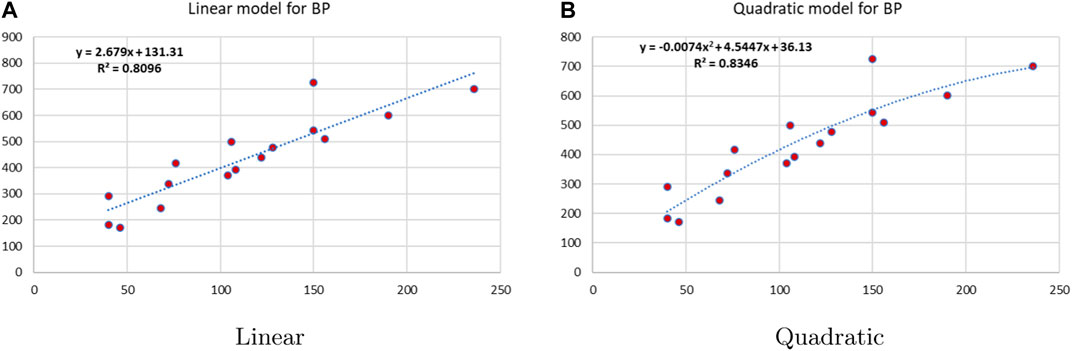
Figure 5. Linear vs. quadratic regression for boiling point.
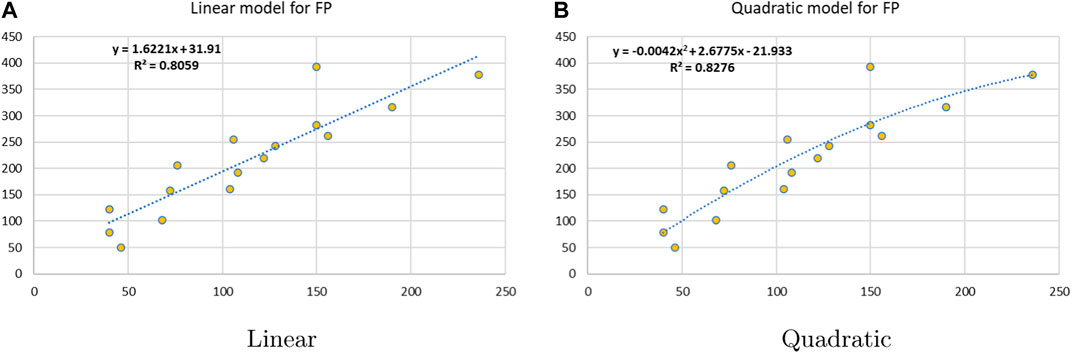
Figure 6. Linear vs. quadratic regression for flash point.
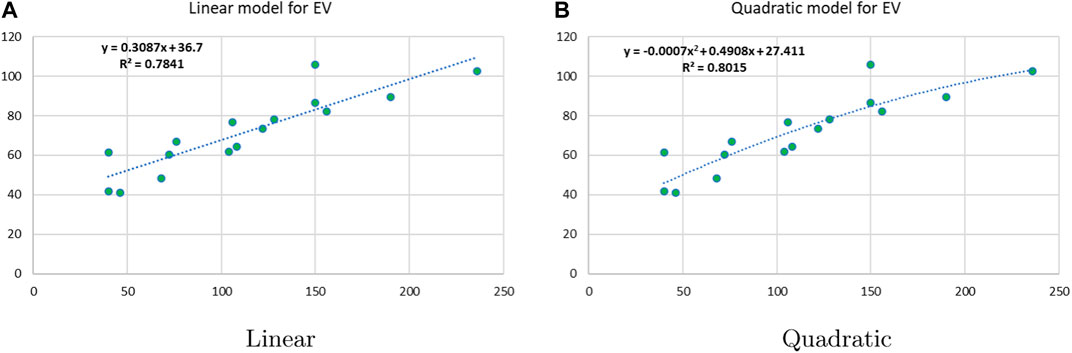
Figure 7. Linear vs. quadratic regression for enthalpy of vaporization.
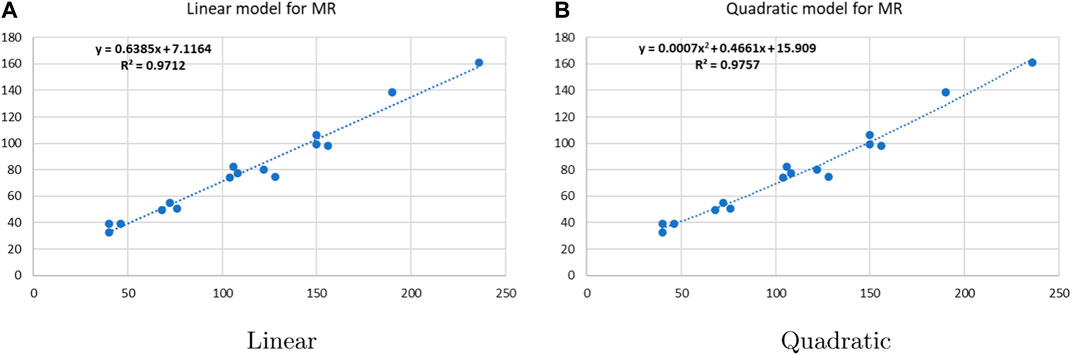
Figure 8. Linear vs. quadratic regression for molar refractivity.
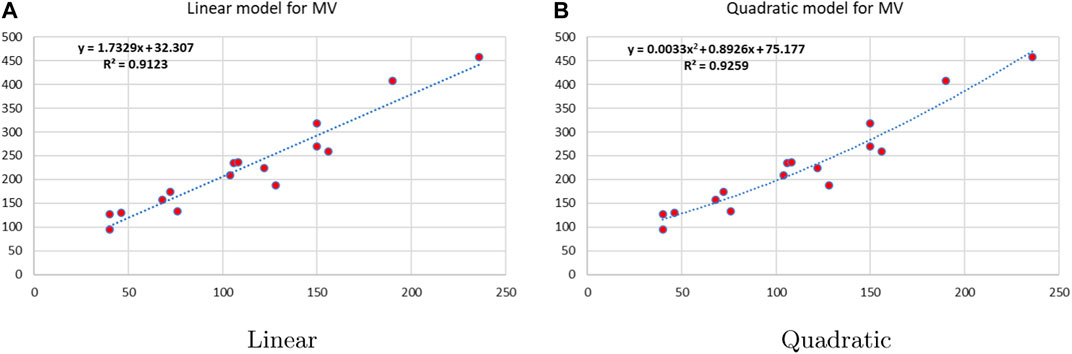
Figure 9. Linear vs. quadratic regression for molar volume.
It is possible to derive a number of results for the given degree-based topological indices by examining the data in Tables 3–12.
• The first index, the face index, has suitable values for the correlation. The correlation ranges for FI are 0.9212–0.9669. The results of correlations are obtained from both types of regression models. The FI has the highest values of the association with a molar weight of 0.9669 and the lowest values with an EV of 0.9212. The FI is a recent index but gives excellent predictions of the chemical compounds, especially the rang-shaped structures. The FI is new, so not much work is done on it. It is clear from Table 3 that r is greater than 0.9, which describes the significance of the FI in the QSPR modeling.
• The QSPR analysis of the neighborhood sum degree face (NFI) index demonstrates that the NF-index is a successful technique for predicting the molar volume and molar weight of alkaloids, with correlation coefficient values of r = 0.9171 and 0.9632. The range of the correlation for linear regression varies from 0.8596 to 0.9514. The range of quadratic regression correlations changes from 0.8627 to 0.9632. The examination of Table 4 reveals that both regression models show good correlations, but the quadratic one is more predictable and strong.
• The QSPR study of the first Zagreb index demonstrates that the M1 index outperforms face indices in terms of predictive power. According to Table 5, the quadratic regression model’s correlation coefficients for the M1 index with alkaloids’ molar weight, boiling point, molar refractions, flash point, and molar volume are all fairly good, with r values of 0.9924, 0.9135, 0.9877, 0.9097, and 0.9622, respectively. The correlation range for the M1 index in the linear regression ranges from 0.8855 to 0.9889.
• Gutman is the first to discuss the significance of the M2 index in determining the π-electron energy. In comparison to the M1 index, the correlation between the M2 index and the properties of alkaloids is slightly weaker, as shown in Table 7. The M2 index has the strongest correlation with an alkaloid’s boiling point, with a quadratic regression value of 0.9091.
• The neighborhood version of M-indices is a relatively new method for comprehending the molecular structures of various chemicals. In the QSPR study, it was discovered that the predicting power of the NM-indices for the physical properties of alkaloids was comparable to that of the NF-index. The correlation coefficient has values between 0.8678 and 0.9781. As can be seen in Table 6, the molar weight correlation is strong and positive, with r = 0.9781. As a result, alkaloids’ properties can be approximated by using NM-indices.
• The harmonic index is a simple index that is easy to calculate. At first, it did not get much attention, but over time, it was used to get information about the structures of many drugs. With correlation coefficients of r = 0.9821, 0.9856, and 0.98, respectively, Table 9 demonstrates that the H-index is a useful tool for predicting the molar weight, molar volume, and molar volume of alkaloids. The correlation range for quadratic regression is 0.8515–0.9821, whereas the correlation range for linear regression is 0.8505–0.9748.
• The modified harmonic index is the most suitable and efficient index for comprehending alkaloids’ properties. The QSPR study in Table 11 reveals that the predicting power of the MH-index is very high compared to other degree-based topological indices. For the linear regression, the correlation coefficient of the MH-index with the physical properties of alkaloids is between 0.89 and 0.998, while for the quadratic regression, it is between 0.9130 and 0.9982. In addition, the molar refractivity (0.9966) and molar weight (0.9982) have extremely high r values for the MH-index. As a result, the QSPR study demonstrates that the MH-index is an amazing tool for predicting alkaloids’ physical properties. The fact that this index has the highest correlation values with each of the six properties of alkaloids in both the linear and quadratic cases is what makes it stand out the most.
• For the purpose of analyzing the structures of alkaloids, the advanced harmonic index is introduced. For the linear regression, the AH-index has a correlation greater than or equal to 0.9 for three parameters: the molar weight (0.9695), the molar refractivity (0.9658), and the molar volume (0.9422). As an alternative to the experimental values, the relationship between the AH-index and all physical parameters is very strong and direct. The calculations uncovered that this recently presented index is powerful and beneficial for concentrating on alkaloid structures.
The aim of this manuscript is to investigate the six properties of the alkaloid structures without doing any lab experiments. The experimental values are already defined and are very time-consuming, costly, and difficult to calculate. In recent years, a large number of articles have been published on the significance of numerical descriptors and statistical techniques. A large number of medicinal structures are explored and examined with the help of different types of indices and different types of regression. To calculate the relationship between experimental and approximate results, the linear regression model is mostly used because it gives the highest value of the relationship. Here we mention some results similar to our work to show the validity and significance of computations. Abid et al. analyzed the lyme drugs with the help of degree-based indices and a linear regression model, and their results are given in Table 13. Diabetes is one of the most common and fatal diseases today. The results of the correlation for the first Zagreb index, the second Zagreb index, and the harmonic index are given in Table 13 for the study of four parameters: molar volume, flash point, boiling point, and molar refractivity. All the correlations of the indices for the alkaloids are higher than 0.8. The correlations for the diabetes drugs are also greater than 0.8, which describes the selection of suitable indices given in Table 13.

Table 13. Comparison of results with literature.
For more applications of the QSPR model method and topological indices see [35–38].
In this article, we analyze six properties of the chemical structures called alkaloids with the help of topological indices and regression models. In QSPR studies, old and new indices are useful for predicting the characteristics of alkaloids. All the TIs have positive values for the correlation, which means there is a direct relationship between all the topological indices and the six properties of alkaloids. The novel indices defined in this manuscript have a strong correlation with all six properties of alkaloids. It is important to note that the newly defined modified harmonic index has the highest values of correlation with all properties of alkaloids and has a preference over other indices. The linear and quadratic regression models are used to get suitable results. All the correlation values are above 0.8, and p values less than 0.001 are considered experimentally useful. The quadratic regression model is more efficient for studying alkaloid structures. The logarithmic and exponential regression models cannot be used because of low and nonsignificant correlation values. Alkaloids are important chemicals that are used to make drugs and other medicines. Therefore, chemists can use the results derived in this article to study alkaloids for a variety of purposes. We work on different topological indices to estimate the properties of the alkaloids, but only include those descriptors that show a significant relationship with the properties of the alkaloids. The outcomes derived from the topological indices are the estimated values, which may be significant or not. The validity of the molecular descriptors is checked with the help of statistical tools.
The characteristics of alkaloids structures, such as melting point, density, logP, and surface tension, cannot be estimated with the help of the indices used in this manuscript because of low correlation coefficients. Mathematicians may not be able to decide on the values they obtain for various chemical compounds because chemists have not published the range of topological indices online. A large number of molecular descriptors have been defined, but still, some properties of the complicated structures cannot be described with the help of the QSPR model method. This means that mathematicians may not be able to determine whether the compounds the researchers selected will be the subject of future research.
In the future, might come up with some new indices to learn about different structures, such as the structures of medicines used to treat high blood pressure.
The original contributions presented in the study are included in the article/supplementary material, further inquiries can be directed to the corresponding author.
MR: Conceptualization, Data curation, Formal Analysis, Funding acquisition, Investigation, Methodology, Project administration, Resources, Software, Supervision, Validation, Visualization, Writing–original draft, Writing–review and editing. AM: Conceptualization, Data curation, Formal Analysis, Funding acquisition, Investigation, Methodology, Project administration, Resources, Software, Supervision, Validation, Visualization, Writing–original draft, Writing–review and editing. IH: Conceptualization, Data curation, Formal Analysis, Funding acquisition, Investigation, Methodology, Project administration, Resources, Software, Supervision, Validation, Visualization, Writing–original draft, Writing–review and editing.
The authors declare that no financial support was received for the research, authorship, and/or publication of this article.
The authors declare that the research was conducted in the absence of any commercial or financial relationships that could be construed as a potential conflict of interest.
All claims expressed in this article are solely those of the authors and do not necessarily represent those of their affiliated organizations, or those of the publisher, the editors and the reviewers. Any product that may be evaluated in this article, or claim that may be made by its manufacturer, is not guaranteed or endorsed by the publisher.
1. Hussain G, Rasul A, Anwar H, Aziz N, Razzaq A, Wei W, et al. Role of plant derived alkaloids and their mechanism in neurodegenerative disorders. Int J Biol Sci (2018) 14(3):341–57. doi:10.7150/ijbs.23247
2. Faisal S, Badshah SL, Kubra B, Emwas AH, Jaremko M. Alkaloids as potential antivirals. A comprehensive review. Nat Prod Bioprospecting (2023) 13(1):4–38. doi:10.1007/s13659-022-00366-9
3. Adibah KZM, Azzreena MA. Plant toxins: alkaloids and their toxicities. GSC Biol Pharm Sci (2019) 6(2). doi:10.30574/gscbps.2019.6.2.0003
4. Rauf A, Naeem M, Hanif A. Quantitative structure properties relationship analysis of Eigen value based indices using COVID−19 drugs structure. Int J Quan Chem (2023) 123(4):e27030–16. doi:10.1002/qua.27030
5. Wiener H. Structural determination of paraffin boiling points. J Am Chem Soc (1947) 69(1):17–20. doi:10.1021/ja01193a005
6. Huilgol MI, Sriram V, Balasubramanian K. Structure−activity relations for antiepileptic drugs through omega polynomials and topological indices. Mol Phys (2022) 120(3):e1987542. doi:10.1080/00268976.2021.1987542
7. Chamua M, Buragohain J, Bharali A. Some novel neighborhood degree sum-based versus degree-based topological indices in QSPR analysis of alkanes from n-butane to nonanes. Int J Quan Chem (2024) 124(1):37–46. doi:10.1002/qua.27292
8. Arockiaraj M, Greeni AB, Kalaam AA. Linear versus cubic regression models for analyzing generalized reverse degree based topological indices of certain latest corona treatment drug molecules. Int J Quan Chem (2023) 123(16):255–68. doi:10.1002/qua.27136
9. Ravi V, Chidambaram N, Colakoglu O, Ahmed H, Jaganathan S, Jaganathan J. QSPR study and distance-based new topological descriptors of some drugs used in the COVID-19 treatment. J Maths (2023) 2023:1–15. doi:10.1155/2023/1187415
10. Kansal N, Garg P, Singh O. Temperature-based topological indices and QSPR analysis of COVID-19 drugs. Polycyclic Aromatic Compd (2023) 43(5):4148–69. doi:10.1080/10406638.2022.2086271
11. Zhang X, Reddy HG, Usha A, Shanmukha MC, Farahani MR, Alaeiyan M. A study on anti-malaria drugs using degree−based topological indices through QSPR analysis. Math Biosciences Eng (2023) 20(2):3594–609. doi:10.3934/mbe.2023167
12. Bashir Farooq F, Ul Hassan Awan N, Parveen S, Idrees N, Kanwal S, Abdelhaleem TA. Topological indices of novel drugs used in cardiovascular disease treatment and its QSPR modeling. J Chem (2022) 2022:1–13. doi:10.1155/2022/9749575
13. Gnanaraj LRM, Ganesan D, Siddiqui MK. Topological indices and QSPR analysis of NSAID drugs. Polycyclic Aromatic Compd (2023) 3(2):9479–95. doi:10.1080/10406638.2022.2164315
14. Huang R, Mahboob A, Rasheed MW, Alam SM, Siddiqui MK. On molecular modeling and QSPR analysis of lyme disease medicines via topological indices. The Eur Phys J Plus (2023) 138(3):243–18. doi:10.1140/epjp/s13360-023-03867-9
15. Parveen S, Farooq FB, Awan NUH, Fanja R, Choudhary MF. Topological indices of drugs used in rheumatoid arthritis treatment and its QSPR modeling. J Maths (2022) 2022:1–11. doi:10.1155/2022/1562125
16. Jamil MK, Imran M, Abdul Sattar K. Novel face index for benzenoid hydrocarbons. Mathematics (2020) 8(3):312–23. doi:10.3390/math8030312
17. Ding S, Qureshi MI, Shah SF, Fahad A, Jamil MK, Liu JB. Face index of nanotubes and regular hexagonal lattices. Int J Quan Chem (2021) 121(19):1–11. doi:10.1002/qua.26761
18. Luo R, Dawood K, Jamil MK, Azeem M. Some new results on the face index of certain polycyclic chemical networks. Math Biosciences Eng (2023) 20(5):8031–48. doi:10.3934/mbe.2023348
19. Gutman I, Trinajstic N. Graph theory and molecular orbitals. Total π electron energy of alternant hydrocarbons. Chem Phys Lett (1972) 17(4):535–8. doi:10.1016/0009-2614(72)85099-1
20. Gutman I, Rusic B, Trinajstic N, Wilcox Jr CF. Graph theory and molecular orbitals. XII. Acyclic polyenes. XII Acyclic Polyenes Journal Chemical Physics (1975) 62(9):3399–405. doi:10.1063/1.430994
21. Gutman I, Milovanovic E, Milovanovic I. Beyond the Zagreb indices. AKCE International Journal of Graphs and Combinatorics (2018).
22. Mondal S, De N, Pal A. On some new neighbourhood degree based indices (2019). p. 1–17. arXiv preprint arXiv:1906.11215.
23. Mondal S, De N, Pal A. Topological properties of Graphene using some novel neighborhood degree-based topological indices. Int J Maths Industry (2019) 11(01):1–14. doi:10.1142/s2661335219500060
24. Chamua M, Buragohain J, Bharali A, Nazari ME. Predictive ability of neighborhood degree sum−based topological indices of Polycyclic Aromatic Hydrocarbons. J Mol Struct (2022) 1270(1):133904–15. doi:10.1016/j.molstruc.2022.133904
26. Zhong L. The harmonic index for graphs. Appl Math Lett (2012) 25(3):561–6. doi:10.1016/j.aml.2011.09.059
27. Shao Z, Jahanbani A, Sheikholeslami SM. Multiplicative topological indices of molecular structure in anticancer drugs. Polycyclic Aromatic Compd (2022) 42(2):475–88. doi:10.1080/10406638.2020.1743329
28. Verma A, Mondal S, De N, Pal A. Topological properties of bismuth Tri−iodide using neighborhood M-polynomial. Int J Maths Trends Technol (2019) 67(10):83–90. doi:10.14445/22315373/ijmtt-v65i10p512
29. Arockiaraj M, Paul D, Clement J, Tigga S, Jacob K, Balasubramanian K. Novel molecular hybrid geometric-harmonic-Zagreb degree-based descriptors and their efficacy in QSPR studies of polycyclic aromatic hydrocarbons. SAR QSAR Environ Res (2023) 34(7):569–89. doi:10.1080/1062936x.2023.2239149
30. Mahboob A, Alrowaili D, Alam SM, Ali R, Rasheed MW, Siddique I. Topological attributes of silicon carbide SiC4 − II[i, j] based on ve−degree and ev−degree. J Chem (2022) 2022(1):1–11. doi:10.1155/2022/7311404
31. Arockiaraj M, Greeni AB, Kalaam AA. Comparative analysis of reverse degree and entropy topological indices for drug molecules in blood cancer treatment through QSPR regression models. Polycyclic Aromatic Compd (2023) 1–18. doi:10.1080/10406638.2023.2271648
32. Alam SM, Jarad F, Mahboob A, Siddique I, Altunok T, Waheed Rasheed M. A survey on generalized topological indices for silicon carbide structure. J Chem (2022) 2022(2):1–11. doi:10.1155/2022/7311404
33. Mehboob A, Rasheed MW, Hanif I. On some scientific results of Abid−Waheed graph (AW7r). Utilitas Mathematica (2022) 119:36–45. https://utilitasmathematica.com/index.php/Index/article/view/1552.
34. Parveen S, Hassan Awan NU, Mohammed M, Farooq FB, Iqbal N. Topological indices of novel drugs used in diabetes treatment and their QSPR modeling. J Maths (2022) 2022(1):1–17. doi:10.1155/2022/5209329
35. Mahboob A, Waheed Rasheed M, Hanif I, Siddique I. Approximating the properties of some chemical solvents by two-dimensional molecular descriptors. Int J Quan Chem (2024) 124(1):76–82. doi:10.1002/qua.27305
36. Mahboob A, Rasheed MW, Amin L, Hanif I. A study of novel molecular descriptors and quantitative structure–property relationship analysis of blood cancer drugs. Eur Phys J Plus (2023) 138(9):856–65. doi:10.1140/epjp/s13360-023-04499-9
37. Mahboob A, Rasheed MW, Dhiaa AM, Hanif I, Amin L. On quantitative structure-property relationship (QSPR) analysis of physicochemical properties and anti-hepatitis prescription drugs using a linear regression model. Heliyon (2024) 10(1):e25908–140. doi:10.1016/j.heliyon.2024.e25908
Keywords: face index, vertex degrees, neighborhood vertex degrees, QSPR analysis, linear regression model, quadratic regression model
Citation: Rasheed MW, Mahboob A and Hanif I (2024) Uses of degree-based topological indices in QSPR analysis of alkaloids with poisonous and healthful nature. Front. Phys. 12:1381887. doi: 10.3389/fphy.2024.1381887
Received: 04 February 2024; Accepted: 25 March 2024;
Published: 18 April 2024.
Edited by:
Mihalj Posa, University of Novi Sad, SerbiaReviewed by:
Murat Cancan, Van Yuzuncu Yil University, TürkiyeCopyright © 2024 Rasheed, Mahboob and Hanif. This is an open-access article distributed under the terms of the Creative Commons Attribution License (CC BY). The use, distribution or reproduction in other forums is permitted, provided the original author(s) and the copyright owner(s) are credited and that the original publication in this journal is cited, in accordance with accepted academic practice. No use, distribution or reproduction is permitted which does not comply with these terms.
*Correspondence: Muhammad Waheed Rasheed, d2FoZWVkcmFzaGVlZDQ2MUBnbWFpbC5jb20=
Disclaimer: All claims expressed in this article are solely those of the authors and do not necessarily represent those of their affiliated organizations, or those of the publisher, the editors and the reviewers. Any product that may be evaluated in this article or claim that may be made by its manufacturer is not guaranteed or endorsed by the publisher.
Research integrity at Frontiers
Learn more about the work of our research integrity team to safeguard the quality of each article we publish.