- 1School of Architectural Engineering, Huanghuai University, Zhumadian, China
- 2Henan International Joint Laboratory of Structural Mechanics and Computational Simulation, Huanghuai University, Zhumadian, China
The spatial autocorrelation method is an important method for extracting the velocity dispersion curve from microtremor data. However, site data typically cannot strictly meet spatial and temporal stationary feature, and this greatly affects the accuracy of the calculation results of this method. Therefore, based on the cosine similarity theory, this study deduces the applicability of the spatial autocorrelation method to unidirectional Rayleigh surface waves and again verifies the applicability of this method to spatially and temporally stationary Rayleigh waves. The numerical simulation results demonstrate that the velocity dispersion curve can be extracted from a one-way Rayleigh wave using the spatial autocorrelation method to obtain an accurate geological profile, whereas the superposition of finite groups of Rayleigh waves in different directions cannot yield an accurate geological profile. In this study, we quantitatively analyzed the impact of the spatial autocorrelation method on the extraction of the velocity dispersion curve when the signal could not meet the characteristics of temporal and spatial stationarity through numerical simulation. The results reveal that the velocity-dispersion curve can be accurately extracted only when the signal satisfies both spatial and temporal stationarity. When a signal is closer to the spatial and temporal stationary characteristics, this indicates that a more accurate velocity dispersion curve can be extracted. These results provide a reference for improving the calculation accuracy of spatial autocorrelation methods.
1 Introduction
Microtremors are ubiquitous in nature and include various linearly polarized waves (body and longitudinal waves) and elliptically polarized Rayleigh surface waves [1–6]. It has been observed that the Rayleigh surface waves in the far field are dominant, and the spectral characteristics are closely related to the site changes [7]. This study provides a feasible basis for geological exploration using micromotion Rayleigh surface waves. The micro-motion signal contains rich information, including wide-frequency Rayleigh waves from 0.1 Hz to tens of Hz, and the detection depth can also reach from a few meters to several thousand meters. Therefore, researchers have begun to study the application of microtremor Rayleigh wave signals in the context of geological engineering exploration. Seismic exploration using a micromotion signal is termed the micromotion method and is also known as the microtremor method. It is used to deduce the geological structure by studying the frequency spectrum, velocity dispersion, and particle motion of the wave in the microtremors signal of the surface of the Earth. This enables the micro-motion signal to be widely used in site evaluation, engineering geophysics, and large-scale research examining the crust and mantle such as the frequency wavenumber method (F-K), the spatial correlation method (SPAC), the horizontal and vertical component Purby method (HVSR), and others [8–13].
The spatial autocorrelation method is important for extracting geological structural information using micromotion signals. This method was first proposed by Aki (1957). The basic principle of this method is to assume that the background noise fields incident in different directions around the array possess stationary random characteristics and the same phase velocity at the same frequency. Under this assumption, the cross-correlation of the spatial coordinates of the noise signal (vertical component) is received by two stations at different positions, and the azimuth average of the station pairs at different positions and the same distance is then calculated to obtain the spatial autocorrelation coefficient after the azimuth average. The spatial autocorrelation coefficient was used to fit the zero-order Bessel function of the first type, to calculate the phase velocity at different frequencies, and to obtain the dispersion curve of the surface wave. However, in theory, this method requires that geophones be uniformly distributed around the circumference, and this cannot be achieved in actual data acquisition [3]. In 1983, Okada and Sakajiri studied the collection and arrangement of spatial autocorrelation methods and demonstrated the rationality of a regular triangular arrangement. These research results promote a leap in the spatial autocorrelation method in practical applications [14]. Cho et al. analyzed the feasibility of the spatial autocorrelation method in 2008 and studied the error caused by the influence factors on the correlation coefficient, thus providing a theoretical basis for optimizing the results of the method [15]. In 1973, Cox et al. demonstrated the equivalence relationship between the spatial autocorrelation coefficient and the time-domain cross-correlation spectrum in Aki’s spatial autocorrelation formula method [16]. Horike, Matsushima, Okada, Tokimatsu, and others studied the method of spatial autocorrelation to extract the velocity dispersion curve from the microtremor signal [17–22]. Okada introduced a theoretical derivation of microtremor spatial autocorrelation and its application in a literature review published in 2003 [22]. Asten studied the inversion of spatial autocorrelation velocity dispersion and the effects of array mode and signal incidence direction on velocity dispersion [23–25]. Luo studied the application of a spatial autocorrelation method to extract velocity dispersion from one-way Rayleigh surface waves [26]. However, it is difficult to arrange circular arrays in complex terrain sites. To adapt SPAC to more complex site conditions, Ling and Okada proposed the extended spatial auto-correlation (ESPAC) method in 1993, improved the SPAC method geophone array, allowed the diversity of array layouts, and designed linear array, T-type, and L-type geophone arrays [27]. Ohori (2002) and Parolai used the ESPAC method to detect underground structures and achieved good results [28–30]. Although its effect is not as accurate as that of the circular array, it can make the geophone array shape not limited to the circular array and promote further development of the spatial sub-correlation method. Cho et al. used numerical simulations to study the characteristics of the spatial autocorrelation method in the case of a full-wave field. These results imply a possible improvement in the accuracy of the microtremor array survey analysis for velocity-structure interference by applying the full-wave theory to the peak phase velocity [31]. Ikeda et al. corrected the correlation coefficient using the imaginary portion of the signal to improve the accuracy of the velocity dispersion curve and achieved good results in field data applications [32, 33].
Although this method has been extensively studied by many scholars and is widely used in engineering, most of the research focuses on improving the accuracy of the velocity dispersion curve using methods such as virtual spectral density, the number of circular geophones, nested geophones, changing the shape of geophones, joint active source exploration, and further mining of useful information in the microtremor signal. However, many problems remain associated with this method. The fundamental reason for this is that the theoretical assumption of this method is that the micromotion signal possesses the characteristics of space and time stability, and the geophones are densely distributed in the circumference. However, these two preconditions cannot be strictly met in practical applications. Skaji studied the time-stationary characteristics of a microtremor signal using the frequency distribution of the amplitude of the microtremor signal and its autocorrelation coefficient. The research demonstrates that microtremor data with a sampling time of 10 min are stable over time, but stationary characteristics cannot be maintained when the sampling time is greater than 3 hours. Additionally, the noise interference between nearby and other vehicles breaks the stationary state. The spatial stability must consider the spatial interval of data acquisition [7]. Toks et al. (1964) observed that the micromotion signal in the range of 1–6s s contains multiple directional signal sources, and the short-period micromotion signal was unstable for more than 5 or 10 min. It can be observed that the conditions required for the microtremor signals of different frequency bands to meet the stationary characteristics are different [34]. This causes the velocity dispersion curve extracted using this method to be erroneous.
In summary, research examining spatial autocorrelation methods has primarily focused on arrangement, data acquisition, and joint inversion. Although current research focused on spatial autocorrelation is fruitful and has been applied to some practical projects, the problem of the accuracy of the velocity–dispersion curve extraction of this method has still not been perfectly solved. This significantly limits the application of this method in engineering. However, few studies have been conducted examining the influence of the time- and space-stationary characteristics of data on the velocity dispersion curve. Based on the cosine similarity theory and numerical simulations, this study analyzes the influence mechanism of time and space stationarity on the spatial autocorrelation method to extract the velocity dispersion curve from the perspective of theory and simulation, thus providing a reference for further research on the calculation accuracy and application range of this method.
2 Methods
In this study, the spatial autocorrelation method was derived based on the cosine similarity theory that measures the similarity between two vectors using the cosine value of their angle. The similarity between the two vector directions can be determined using the cosine of the angle between the two vectors. When two vectors possess the same direction, the cosine similarity value is 1, and when the angle between two vectors is 90°, the cosine similarity is zero. When two vectors point in opposite directions, the cosine similarity value is −1. This result is independent of the vector length and is related only to the direction of the vector. This method of measuring the vector similarity is also applicable to multi-dimensional vectors.
As any signal of finite length is discretized into finite points when received, this study addresses each segment of the signal as a multi-dimensional vector, and the cosine similarity of the two vectors can be expressed by formula (1).
The more similar the two vectors, the smaller the angle is between them. The larger the absolute value of the cosine, the more negative is the value, and the two vectors are negatively correlated. The inner product of the vector is expressed as follows:
Where,
If vectors
The definite integral of function
According to the definition of the definite integral, when the sampling interval is infinite and the number of sampling points
According to the Fourier transform, any seismic wave signal can be obtained by the harmonic superposition of different frequencies and amplitudes. We first assume that
We can simplify Equation 6 to yield:
The integral in formula (7) is only related to vector θ, specifically:
It can be observed from Equation 8 that when the functions
Any signal in nature can be regarded as a superposition of multiple sinuses or cosines of different frequencies. Eq. 6 represents the similarity of the single-frequency harmonic signals, and
The numerator and denominator correspond to the spectral density functions. The left side of (10) is the correlation coefficient of signals
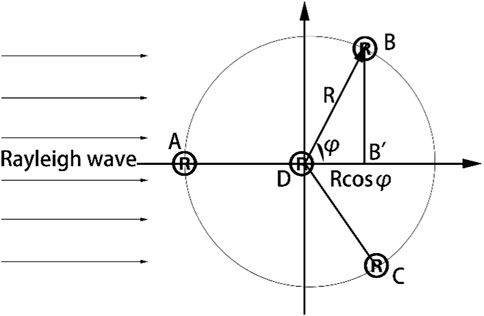
Two-dimensional spatial geophones are arranged in a circular manner, and a triangular arrangement as an example is presented in Figure 1.
When a unidirectional plane Rayleigh surface wave is transmitted, if there are only two AB geophones arranged along the wave propagation direction, the velocity dispersion curve can be calculated according to (11).
As presented in the figure, when AB is not arranged along the wave propagation direction, Eq. 11 cannot accurately provide the velocity dispersion curve. For the plane Rayleigh surface wave signal, the signal received at point B is the same as that at point B Therefore, the following formula can be used to calculate the velocity dispersion curve from the signals at points B and D:
When the geophones are uniformly and densely arranged on the circumference, the data of each point on the circumference can be processed in the same manner as for that of B. The following formula can be obtained by averaging the results of all the points:
This conclusion is the same as that of the spatial autocorrelation method under the conditions of spatial and temporal stationarity in which the formula for calculating the correlation coefficient is as follows:
Where
A single-direction Rayleigh surface wave is calculated using a circular spatial autocorrelation array. When the signal meets the spatial and temporal stationary characteristics, the spatial autocorrelation method can be used to calculate the dispersion curve. However, in actual received signals, it is difficult to meet the requirements of time and space stationarity in many cases. Therefore, this study considers a situation in which the signal does not meet the stationarity characteristics in the later numerical simulation portion of the paper. It is likely that a precise spatial autocorrelation exploration can be realized by combining stationary and nonstationary signals.
3 Numerical simulation
The finite element method has a wide range of applications in the simulation of acoustic and seismic wave propagation [35–38]. This section primarily focuses on three aspects that include the establishment of a numerical model, the extraction of the velocity dispersion curve of a single group of Rayleigh waves in a homogeneous half-space, and the extraction of the velocity dispersion curve of multiple Rayleigh waves.
3.1 Numerical model
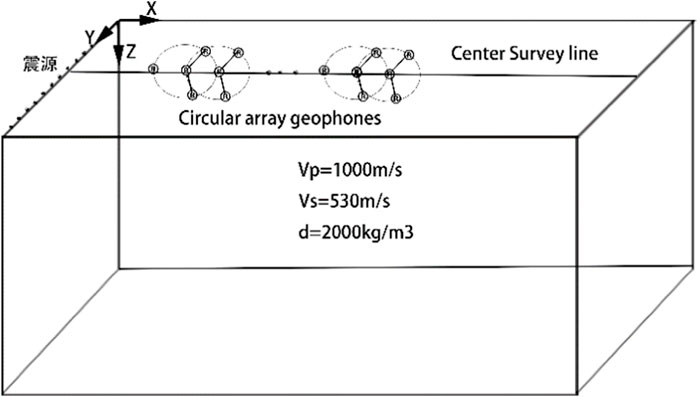
First, the numerical models and parameters used in the velocity-dispersion simulation are introduced. Considering the far-field characteristics of the microtremor signal, a plane-wave source was used for numerical simulation. Each plane-wave source is composed of a linear array of point sources. According to Huygens’ principle, the wavefront of a Rayleigh wave radiated by a linear array of point sources is of the plane type. In this study, the plane-wave field was simulated in this manner. The model grid was divided into 2m, and the 20 Hz dominant frequency of the Rick wavelet was selected as the source. The circular array radius of the geophones was 2m, and 15 survey lines were set with each side-line 4m apart. The basic model is presented in Figure 2 and indicates only a circular geophone array on the central side.
This study primarily focused on two aspects that included the velocity profile characteristics of the half-space model and the influence of the multi-directional Rayleigh surface wave on the spatial autocorrelation method to extract the velocity dispersion curve. According to different research contents, different sources and geophone distributions were set in this study as presented in Figure 3. All of the data related to the velocity profile in this study are derived from the layout in Figure 3A. Among them, Rayleigh surface wave data with two propagation directions were additionally loaded with linear sources as presented in Figure 3A. Relevant research data for the velocity dispersion curve of a single array were derived from the layout presented in Figure 3B. The multi-source data revealed a continuous increase in linear sources around the circular array as presented in Figure 3B. The vertical distance between the linear sources and the circular array was the same. The difference in the wave arrival times was determined by adjusting the shooting time. Table 1 presents the elastic parameters of the half-space model.
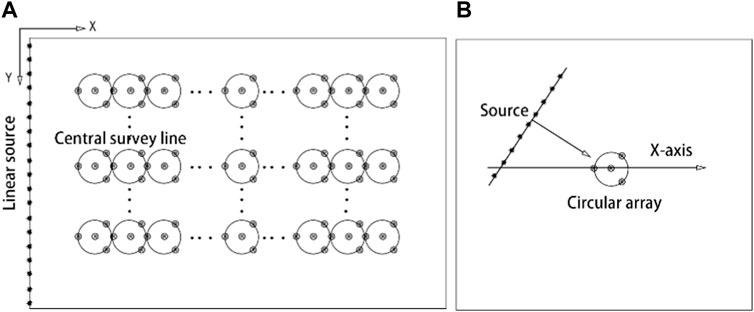
FIGURE 3. Arrangement of source and geophone. (A) Arrangement of geophone; (B) arrangement of source.
3.2 Application analysis of numerical simulation
First, the wave field distribution and velocity dispersion characteristics of a single-source Rayleigh wave inhomogeneous half-space were analyzed. To clearly reveal the distribution of the wave field excited by a plane source in a homogeneous half-space, we extracted snapshots of the vertical wave field along the central line and the horizontal wave field on the free surface as presented in Figure 4. The vertical wave field snapshot (Figure 4A) clearly distinguishes the S wave (shear waves), P wave (longitudinal waves), and R wave (Rayleigh surface waves) after 0.2s. After 0.35s, the reflected wave of P wave reflected from the bottom boundary appears below. To prevent the interference caused by boundary reflection, the operation time was set to be less than the time required for the reflected wave to reach the ground. Figure 4B presents a snapshot of the wave field in the horizontal section. The P and R waves can also be clearly distinguished after 0.2s. As the energy of the P wave is weak, and the diffusion speed is faster than that of the Rayleigh surface wave, the color code in the figure is shallow. The wave field distribution of the plane-wave source in the homogeneous model is clearly presented.
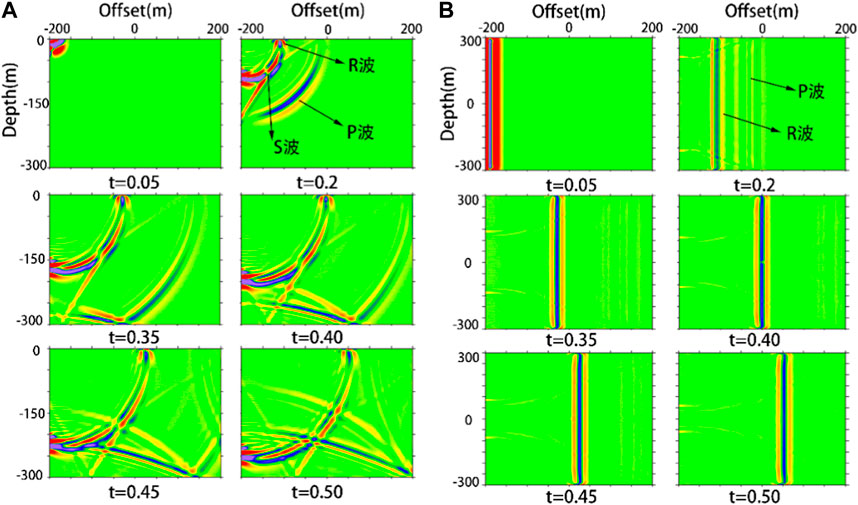
FIGURE 4. Arrangement of source and geophone. (A) the vertical section wave field; (B) the horizontal section wave field.
According to the needs of the experiment, the sampling interval of the homogeneous half-space model data was 0.0005s, the sampling time was 0.7s, and the seismic records of 15 survey lines were obtained. Figure 5A presents the data of an array in the central line, whereR1, R2, and R3 are the three vertical component seismic records uniformly distributed on the circumference of the array, and R0 is the vertical component seismic record at the center of the circle. It can be observed from the seismic records that there was no interference (similar to the coda and refraction waves) before and after the primary wave peak.
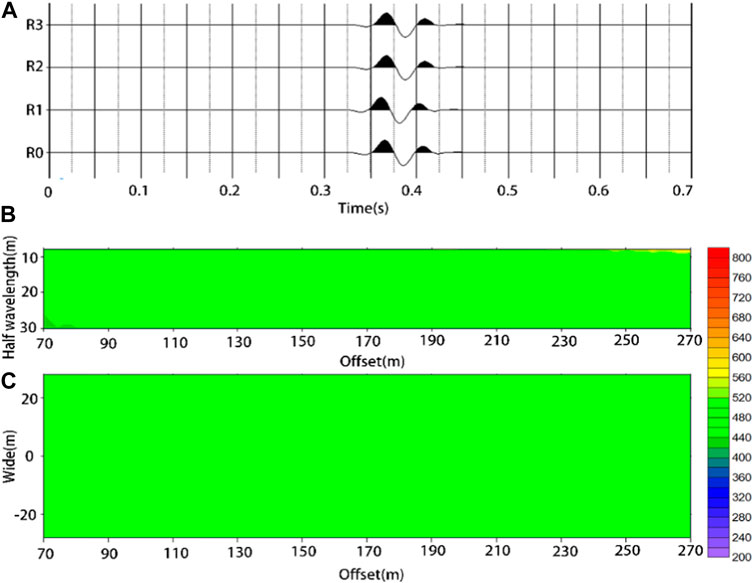
FIGURE 5. Single source simulation results of homogeneous half-space model; (A) vertical component seismic records of single circular array; (B) the vertical velocity profile of the centerline; (C) the velocity horizontal slice at 20m from the free surface.
Next, we analyzed the velocity dispersion of the homogeneous half-space data. According to this theory, the spatial autocorrelation method calculates the velocity dispersion curve using the relationship between the correlation coefficient and the first zero-order Bessel function. A velocity-dispersion curve can be obtained if an accurate correlation coefficient is obtained. The correlation coefficient and velocity dispersion curve were calculated using (13) and 14, respectively.
The spatial autocorrelation method was used to calculate the velocity-dispersion curve of each measuring point in the 15 measuring lines. The corresponding velocity profile was obtained by collecting the dispersion curves. Figure 5B presents the vertical velocity profile obtained from the seismic records of the central line. The depth of the profile was converted to a half wavelength. Figure 5C presents the calculation results of the seismic records of the 15 survey lines and the construction of a horizontal section with a half-wavelength of 20 m. The two sections clearly reflect the homogeneous properties of the half-space. The calculated Rayleigh wave velocity was also consistent with the theoretical Rayleigh wave velocity, where Vs .= 490 m/s. This indicates that the spatial autocorrelation method can be used to calculate the velocity dispersion curve of a single set of Rayleigh waves and that the seismic records obtained by the numerical simulation software and method are reliable.
When the micromotion signal satisfies the spatial and temporal stationary characteristics, the velocity dispersion curve obtained by the spatial autocorrelation method can truly reflect the velocity property of the medium, and the theoretical and practical applications have been verified. The above numerical simulation verified that a single-plane Rayleigh surface wave can also reflect the medium properties of a homogeneous half-space. However, the composition of the surface waves of microtremor signals is complex and typically contains multiple sets of surface waves. Therefore, considering the superposition of two sets of Rayleigh surface waves as an example, this study uses a numerical simulation method to study a situation in which the signal contains two sets of Rayleigh surface waves with mutually perpendicular propagation directions. Two sets of plane sources were set in the homogeneous half-space model with one along the central line direction and the other perpendicular to the central line direction. The simulation results are presented in Figure 6.
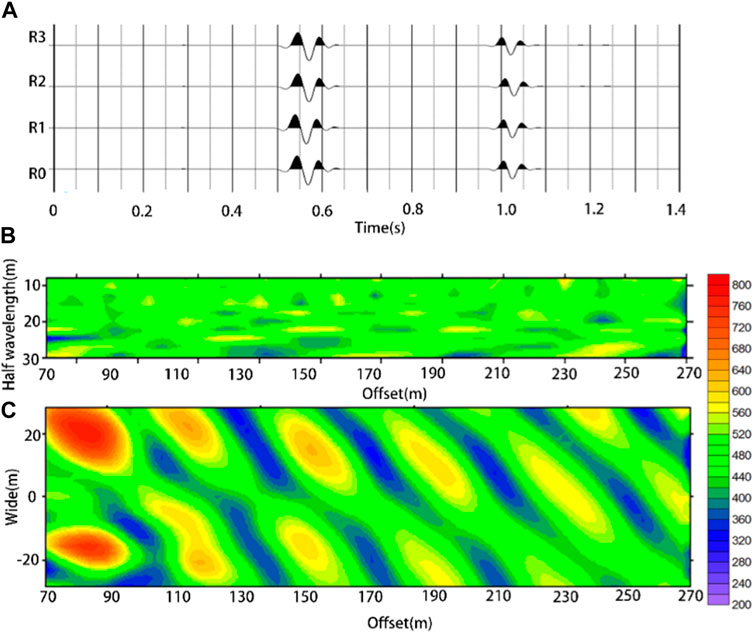
FIGURE 6. Multi-direction Rayleigh surface wave simulation results of the homogeneous half-space model. (A) vertical component seismic records of single circular array; (B) the vertical velocity profile of the centerline; (C) the horizontal velocity profile at 20m from the free surface.
Figure 6A presents the vertical component of the seismic record of one of the circular array geophones. Both the vertical (Figure 6B) and horizontal velocity profiles (Figure 6C) exhibit obvious high- and low-velocity anomalies. As the alternation of high- and low-velocity anomalies is relatively evident with frequency, the anomalies in the fixed-frequency wave velocity distribution profile (Figure 6C) were more evident than were those in the vertical profile (Figure 6B). However, regardless of the horizontal or vertical velocity profiles, the velocity distribution was significantly different from the theoretical velocity distribution of the homogeneous half-space model. This also indicates that the credibility of the velocity dispersion curve extracted by the spatial autocorrelation method is significantly reduced when the Rayleigh surface wave superposition in different directions does not satisfy the stationary condition.
From the above numerical simulation experiment results, it can be observed that a single set of Rayleigh surface waves can accurately extract the velocity dispersion curve through the spatial autocorrelation method, but the nonstationary superposition of multiple sets of Rayleigh surface waves may affect the calculation of the velocity dispersion curve. The following section discusses the influence of nonspatial and time-stationary signals superimposed by multiple groups of surface waves on the velocity dispersion curve of the spatial autocorrelation method.
4 Analysis of influencing factors of the velocity dispersion curve
When the micromotion signal meets the requirements of spatial and temporal stationarity, the spatial autocorrelation method can be used to calculate the velocity dispersion curve, and this has been confirmed by Aki’s theory and has been widely applied by many scholars [10]. Concurrently, through the theoretical derivation and simulation results in the previous section, it can be observed that the spatiotemporal autocorrelation method is also valid when only a single-plane Rayleigh wave is accepted by a circular array. However, many scholars have demonstrated that it is difficult for ground pulsation signals to satisfy stationary characteristics in space and time. It is necessary to consider the length and spatial distance of a section of the signal, particularly for surrounding cities and high-speed railways, as some frequency-band signals exhibit obvious directionality. In these cases, the traditional spatial autocorrelation method cannot be used to calculate the velocity-dispersion curve. Specifically, when the Rayleigh surface wave superposition in different directions in the signal does not satisfy the spatial and temporal stationary characteristics, the velocity dispersion cannot accurately analyze the characteristics of the medium.
This section primarily studies the situation in which the signal does not meet the stationary characteristics of space and time and contains multiple sets of Rayleigh surface waves as well as the influence of the non-stationary state of the microtremor signal on the spatial autocorrelation method to extract the velocity dispersion curve. The stationary characteristics of time and space are primarily reflected in the arrival time interval and propagation direction of different waves in the signal. Focusing on these two characteristics, two groups and multiple groups of Rayleigh wave superpositions were discussed. As the purpose of the experiment was to analyze the influence of the characteristics of the signal itself on the velocity dispersion curve, all the experimental data were from the homogeneous model. There was no interference caused by the difference in geological structure, and only the Rayleigh surface wave was retained by filtering when processing the data. The experimental half-space model is presented in Figure 2 and Figure 3B As the data were too large, only a single circular array was arranged in the center of the model in this section. The array comprises four sensors. The following describes the numerical experimental analysis process and research results presented in this section.
4.1 Two groups of Rayleigh wave superposition
This section primarily considers the influence of two groups of Rayleigh surface waves superimposed at different time intervals or in different directions on the spatial autocorrelation velocity-dispersion curve. First, the influence of two sets of Rayleigh waves propagating in the same direction on the velocity-dispersion curve was studied. In this study, the same source was used for two consecutive shots within 2s with time intervals of 0.25, 0.251, 0.252, and 0.253s to obtain four sets of data. Each dataset contained two Rayleigh surface waves that propagated in the same direction. One group of seismic records is presented in Figure 7A, and Figure 7B presents the spectral distribution of the seismic records.
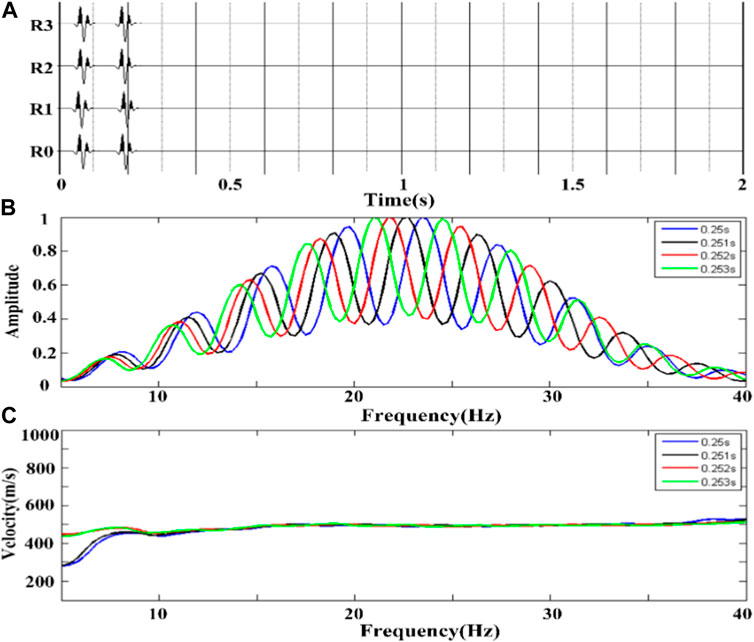
FIGURE 7. Same direction Rayleigh surface wave with different time intervals. (A) a single-array Rayleigh wave vertical component seismic record with an interval of 0.253s; (B) the spectrum diagram of four groups of seismic records; (C) the velocity dispersion curve of each group of seismic records.
Figure 7A presents four vertical-component seismic records of the circular array and center point, including two groups of co-propagating Rayleigh surface waves. It can be observed from Figure 7B that the effective frequency band of seismic records is 10 Hz–30 Hz, and there is a zigzag fluctuation that is caused by the time-shift characteristic of Fourier transform. Coherent phase cancellation occurred when the Rayleigh wave Fourier transform was superimposed. The velocity-dispersion curve was calculated using four sets of data as presented in Figure 7C The blue, black, red, and green curves in the figure correspond to the velocity dispersion curves of the two sets of seismic records with arrival intervals of 0.25, 0.251, 0.252, and 0.253s for the Rayleigh surface waves in the data. It can be observed from the figure that within the effective frequency band, the four curves are almost identical, and this can reflect the Rayleigh surface wave velocity of 490 m/s in the homogeneous half-space model. This also demonstrates that the superposition of two Rayleigh surface waves in the same direction does not affect the spatial autocorrelation method used for calculating the velocity–dispersion curve. The arrival times of the two sets of Rayleigh surface waves did not affect the velocity dispersion.
Next, we studied the influence of the superposition of two sets of Rayleigh surface waves in different directions on the dispersion curve. We fixed a plane source and continuously adjusted the angle between the other source and the fixed source to obtain four groups of seismic records of two Rayleigh surface wave superpositions with the angles of 0°, 45°, 90°, and 180° in the propagation direction.
Figure 8A presents a single array Rayleigh wave vertical component seismic record with the same time interval and opposite propagation direction, and Figure 8B corresponds to the spectrum of two groups of superimposed Rayleigh wave propagation directions with included angles of 0°, 45°, 90°, and 180°, respectively. It can be observed that the spectrum of four groups of seismic records is completely consistent, thus indicating that the coherent cancellation of the spectrum of Rayleigh wave superposition is only related to the time interval. The four curves (blue, black, red, and green, respectively) represent the velocity dispersion curves when the propagation directions of two groups of Rayleigh surface waves differ by 0°, 45°, 90°, and 180°. Experiments confirmed that the velocity dispersion curve of the superposition of two groups of Rayleigh surface waves in the same direction is consistent with the theoretical velocity. When the propagation directions of the two groups of superimposed Rayleigh surface waves differed, the velocity-dispersion curve periodically fluctuated around the theoretical value. As presented in Figure 8C, the fluctuation became increasingly intense with an increase in the difference in direction. The experimental results demonstrate that Rayleigh surface wave superposition in different directions affects the velocity dispersion curve, and the degree of influence is related to the included angle of the propagation direction.
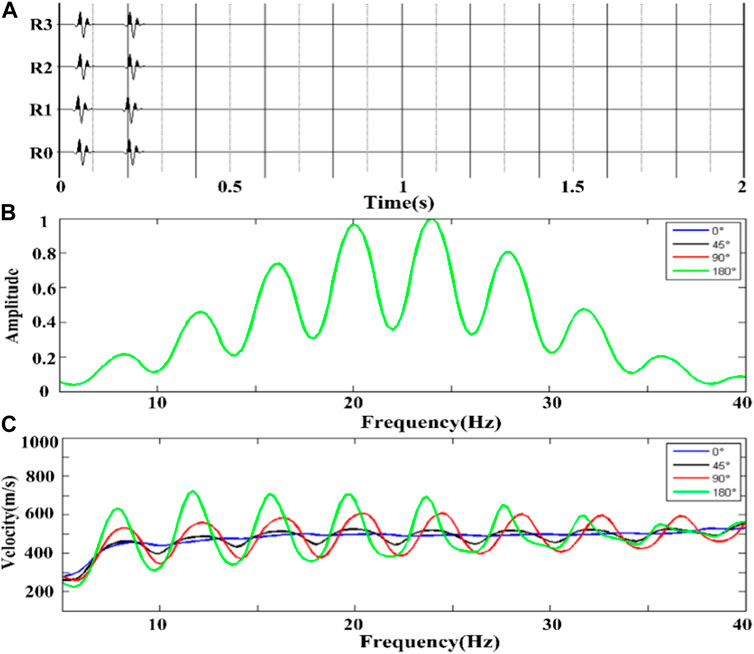
FIGURE 8. Rayleigh surface waves with different propagation directions at the same time interval. (A) a single array Rayleigh wave vertical component seismic record with opposite propagation direction; (B) frequency spectrum of four groups of seismic records; (C) velocity dispersion curve of each group of seismic records.
Taking Rayleigh surface waves with opposite propagation directions as an example, the effect of time interval on the velocity dispersion curve of two groups of Rayleigh surface waves with different propagation directions was studied. The plane sources were set at the left and right ends of the model, and a circular array of geophones was placed in the middle of the model. After the left source was fired, the right source was fired with delays of 0.25, 0.251, 0.252, and 0.253 s. Four groups of seismic records are simulated as presented in Figure 9A Figure 9B presents the spectra of the corresponding seismic records. The spectral curves exhibit periodic fluctuations. With a change in the time interval, fluctuations appear and correspond to translation.
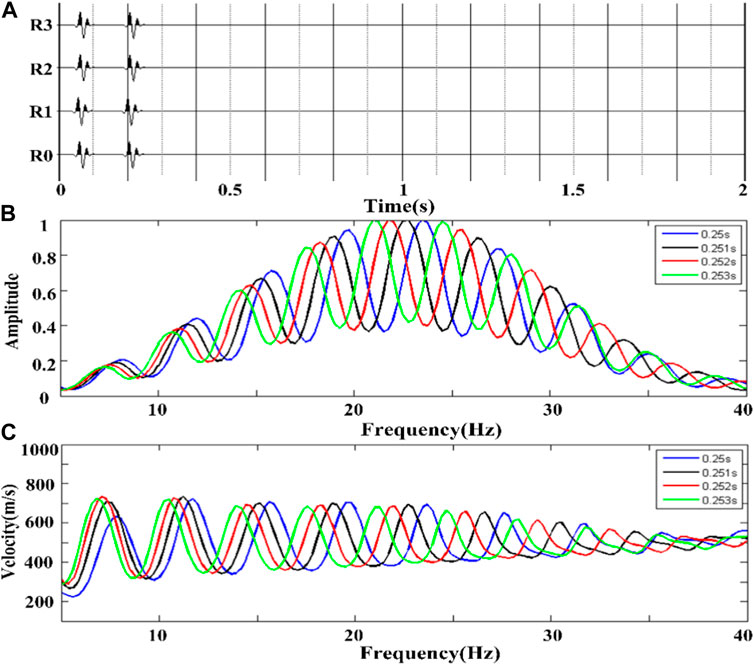
FIGURE 9. Reverse Rayleigh surface wave superposition at different time intervals. (A) a single-array Rayleigh wave vertical component seismic record with an interval of 0.253s; (B) frequency spectrum of four groups of seismic records; (C) velocity dispersion curve of each group of seismic records.
The blue, black, red, and green curves presented in Figure 9C correspond to the velocity dispersion curves extracted from the two sets of seismic records at intervals of 0.25, 0.251, 0.252, and 0.253s for the Rayleigh surface wave in the data, respectively. The figure indicates that the four groups of dispersion curves possess the same fluctuation amplitudes and similar fluctuation trends. The difference in time interval caused the wave to shift along the horizontal direction. The results revealed that when two groups of Rayleigh surface waves with different propagation directions were superimposed, the arrival time interval of the Rayleigh surface waves affected the velocity dispersion curve. Concurrently, it was also observed that a higher frequency resulted in a higher fluctuation frequency of the influence, and the internal influence mechanism requires further study.
The above experimental results reveal that the superposition of Rayleigh surface waves propagating in the same direction does not affect the spatial autocorrelation method to extract the velocity dispersion curve. If the two groups of waves are superimposed by Rayleigh surface waves propagating in different directions, the velocity dispersion curve fluctuates periodically around the theoretical value, and the size of the time interval between the two Rayleigh surface waves also affects the velocity dispersion curve. The wave phase of the dispersion curve changes with a change in the time interval.
4.2 Multi-group Rayleigh surface wave superposition
This section discusses the effects of changing the time interval and spatial distribution of the source on the velocity dispersion curve when multiple groups of Rayleigh surface waves are superpositioned. First, the influence of increasing the number of Rayleigh waves at equal time intervals on the velocity-dispersion curve was analyzed. A circular array of geophones was placed in the middle of the model, and four, eight, and 24 sources were loaded in different directions. The sources are evenly distributed. Each source was shot at equal time intervals of 0.25s. The seismic records of four, eight, and 24 groups of Rayleigh surface wave superposition with uniform distribution in the direction and equal time intervals were obtained. The seismic records of the 24 groups of Rayleigh surface-wave superpositions are presented in Figure 10A Figure 10B presents the spectral distribution of each group of seismic records. The figure indicates that the superposition spectrum of the Rayleigh surface waves in different directions exhibits coherent cancellation, and the effect of coherent cancellation increases with an increase in the number of equally spaced Rayleigh surface waves. This demonstrates that increasing the number of Rayleigh surface wave overlays in different directions at equal time intervals strengthens coherent cancellation in the fixed frequency band.
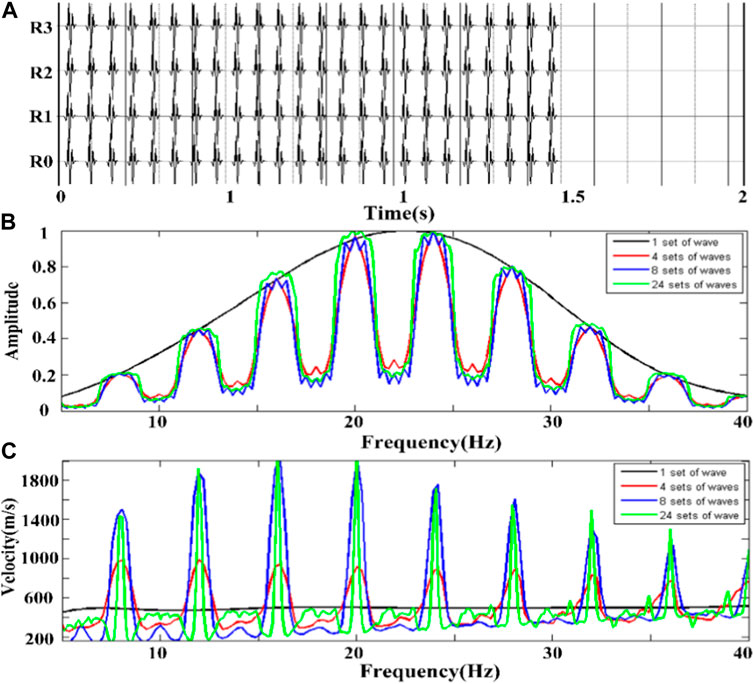
FIGURE 10. Multiple sets of Rayleigh surface waves in different directions with equal time intervals. (A) the single array Rayleigh wave vertical component seismic record when 24 groups of waves are superpositioned; (B) the spectrum diagram of four groups of seismic records; (C) the velocity dispersion curve of each group of seismic records.
The four curves presented in Figure 10C (black, red, blue, and green) correspond to the velocity dispersion curves recorded by equal-interval superposition of Rayleigh surface waves in directions 1, 4, 8, and 24, respectively. It can be observed from the figure that by increasing the number of Rayleigh surface waves in different directions, the dispersion curve still fluctuates violently. Specifically, the emphasis on the average of the source direction cannot eliminate the volatility of the velocity dispersion. Additionally, a comparison of the velocity dispersion and spectrum distribution reveals that the fluctuation period of the velocity versus dispersion curve is consistent with the period of coherent cancellation, and the underlying reason requires further study.
Next, we studied the effect of the superposition of multiple Rayleigh surface waves at equal intervals and different intervals on the extraction of velocity dispersion curves. First, by simulating four shots of the same plane source at equal time intervals of 2s, we obtained the same direction and equal interval multiple groups of Rayleigh surface wave superposition seismic records. Then, the source shooting time was changed such that the time interval between each shot was different, and the seismic records of multiple groups of Rayleigh surface wave superpositions in the same direction and at different time intervals are presented in Figure 11A. Figure 11B presents the spectrum distribution diagram. By comparing the spectral distribution in the figure, it can be observed that the coherent cancellation effect of the seismic records at the same interval is significantly stronger than that of the superposition at different intervals for the same four groups of Rayleigh surface waves. When the time interval of the four groups of Rayleigh surface waves was changed, the coherent cancellation effect of the spectrum was significantly weakened, and the effect became more obvious when the number of different interval waves was further increased.
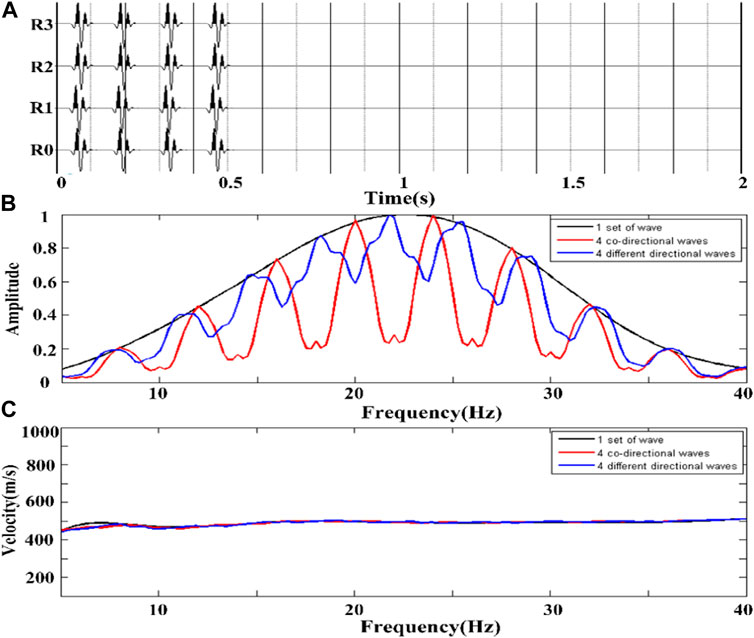
FIGURE 11. Multiple sets of Rayleigh surface waves in the same direction at different time intervals. (A) a single array vertical component seismic record with 4 groups of Rayleigh surface wave intervals superimposed at different times; (B) the spectrum diagram of three groups of seismic records; (C) the velocity dispersion curve of each group of seismic records.
Figure 11C presents the velocity-dispersion curve extracted from the four groups of Rayleigh surface-wave superposition records in the same direction and at different intervals. It can be observed from the figure that the velocity dispersion curve is approximately equal to the theoretical value, regardless of if the time interval is the same. When multiple Rayleigh surface waves in the same direction are superimposed, the frequency distribution is coherently cancelled; however, this does not affect the velocity dispersion curve. Therefore, it cannot be observed that changing the superposition time interval will affect the velocity dispersion curve.
The experimental results of multiple groups of Rayleigh surface wave superposition indicate that increasing the number of Rayleigh surface waves at equal time intervals does not eliminate the influence of Rayleigh surface wave superposition in different directions on the spatial autocorrelation extraction of the velocity dispersion curve. With an increase in the number of Rayleigh surface waves, the fixed-frequency coherence cancellation becomes more severe, and the effect of coherent cancellation will be weakened with the increase in Rayleigh surface waves at different time intervals.
4.3 Analysis of the joint effect of time interval and propagation direction
The influence of Rayleigh surface wave superposition on the spatial autocorrelation velocity dispersion curve was analyzed from the perspective of the Rayleigh surface wave time interval and direction distribution. Different directions led to periodic fluctuations in the velocity dispersion curve, and a change in the time interval led to a shift in the dispersion curve along the frequency direction. Changing only one of the variables cannot eliminate the influence of the Rayleigh wave superposition on the velocity dispersion curve.
This section considers the influence of changes in the time interval and direction distribution on the velocity dispersion curve. The experiment continuously increased the number of uniformly distributed Rayleigh surface waves, changed the time interval of arrival of the two waves, gradually simulated the uniform characteristics of the microtremor signal in the spatial direction and arrival time, and studied the influence of the microtremor signal on the spatial autocorrelation velocity dispersion curve when stationary and non-stationary. The seismic records of 4, 8, 64, and 128 groups of Rayleigh surface wave superpositions were simulated by increasing the number of sources and adjusting the source shooting interval. Figure 12A presents the seismic records of the 128 groups of Rayleigh surface-wave superpositions. These seismic records consider the direction of Rayleigh surface waves and the shooting time interval simultaneously so that the seismic records gradually meet the uniform distribution of source space and time. Figure 12B presents the spectral distributions of the five groups of seismic records. It can be seen from the figure that between 15 Hz and 30 Hz, the spectrum gradually tends to become uniform with the change in the number of superimposed waves and the time interval. This is due to the observation that the signal tends to be stable in space and time with a change in the number of superimposed waves and time interval.
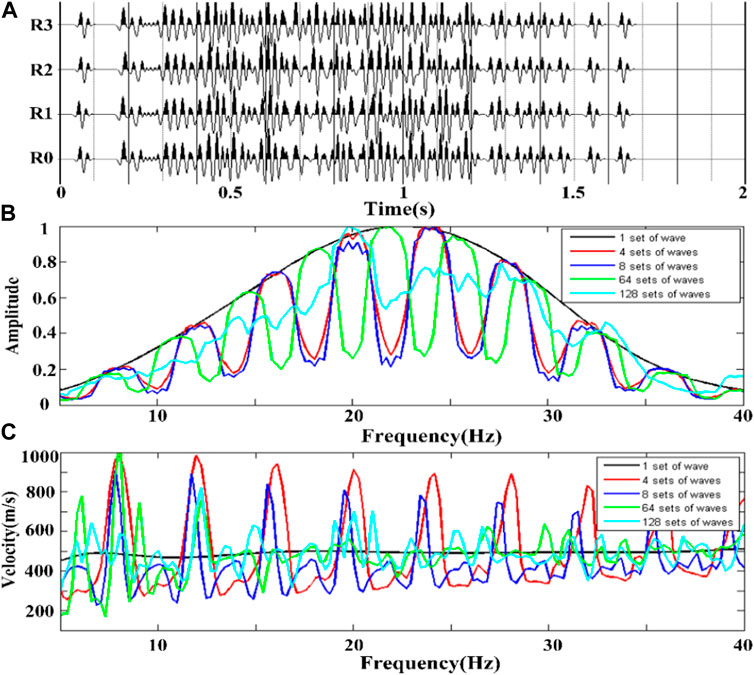
FIGURE 12. Multiple sets of Rayleigh surface waves with different time intervals and directions. (A) a single array vertical component seismic record with 4 groups of different Rayleigh wave intervals superimposed; (B) the spectrum diagram of five groups of seismic records; (C) the velocity dispersion curve of each group of seismic records.
Figure 12C presents the corresponding velocity dispersion curve. The velocity dispersion curve (black) corresponding to the non-stack seismic records is close to the theoretical Rayleigh wave velocity of 490 m/s. From the change trends of the four groups of dispersion curves (red, blue, green, and green), we can see that the fluctuation amplitude of the velocity dispersion curve gradually decreases with an increase in the number of waves and change in time. The velocity dispersion curve gradually approached the theoretical velocity value. This influence gradually increases from low to high frequencies as predicted. An accurate velocity dispersion curve can be obtained when the amount of data increases to a certain amount.
In summary, the superposition of Rayleigh surface waves in the same direction did not affect the extraction of the spatial autocorrelation velocity dispersion curve. Different propagation directions cause periodic fluctuations in the dispersion curve, and the degree of influence changes with changes in the Rayleigh surface wave propagation direction. The arrival time interval of Rayleigh surface waves also affects the dispersion curve. Increasing the number of Rayleigh waves with equal time intervals alone strengthened the coherent cancellation of a fixed frequency but did not eliminate the influence on the dispersion curve. Simultaneously, gradually increasing the number of Rayleigh surface waves in different directions and changing their arrival time interval of Rayleigh surface waves will gradually reduce the periodic fluctuation of the velocity dispersion curve caused by Rayleigh surface wave superposition.
5 Conclusion and discussion
This study focuses on the application of the spatial autocorrelation method to seismic wave exploration from two perspectives that include theory and numerical simulation. First, the spatial autocorrelation method was theoretically deduced based on cosine similarity theory. The results demonstrated that single-group or spatially and temporally stable Rayleigh surface waves can be accurately extracted from the velocity dispersion curve using this method. The spatial autocorrelation method was applied to extract the velocity dispersion curve of a single set of Rayleigh surface-wave seismic data from the homogeneous model. It was observed that the velocity profile of a single set of Rayleigh surface waves clearly reflected the homogeneous property of the half-space, and the calculated velocity was consistent with the theoretical Rayleigh wave velocity. This indicates that the spatial autocorrelation method can use a single set of Rayleigh waves to calculate the velocity dispersion curve. When mutually perpendicular Rayleigh surface waves are superimposed, the velocity distribution of the velocity dispersion profile is extremely chaotic, and it is unable to accurately distinguish the structural characteristics of the homogeneous half space. Thus, the non-stationary multiple sets of Rayleigh surface waves may not be applicable to the spatial autocorrelation method.
Based on the characteristics of spatial and temporal stationarity, the influence of the superposition of multiple Rayleigh surface waves on the extraction of the spatial autocorrelation velocity dispersion curve was also studied. The results reveal that the calculated velocity-dispersion curve is not affected by the spatial and temporal stationarity characteristics when the Rayleigh surface wave is superimposed in the same direction. When Rayleigh surface waves in different directions are superimposed, they are affected by the propagation direction and time interval of the waves. Increasing the number of Rayleigh surface waves in different directions or at different time intervals in one direction did not reduce their impact on the velocity dispersion curve. With an increase in the direction and different time intervals, the signal gradually satisfies the stationary characteristics, and the velocity dispersion curve returns to the theoretical value. This indicates that the non-stationary microtremor signal cannot be used to accurately calculate the velocity dispersion curve through the spatial autocorrelation method. A more stable microtremor signal results in a more accurate velocity dispersion curve. The conclusions of this study further broaden the application range of the spatial autocorrelation method and improve the accuracy of the velocity dispersion curve extraction method.
Data availability statement
The original contributions presented in the study are included in the article/Supplementary Material, further inquiries can be directed to the corresponding author.
Author contributions
QD: Conceptualization, Data curation, Formal Analysis, Investigation, Methodology, Project administration, Software, Writing–original draft, Writing–review and editing. YP: Data curation, Resources, Software, Investigation, Writing–review and editing. KZ: Funding acquisition, Resources, Visualization, Writing–review and editing. DG: Visualization, Writing–review and editing.
Funding
The author(s) declare financial support was received for the research, authorship, and/or publication of this article. This research is funded by National Natural Science Foundation of China (grant numbers 42207200) and the Science and Technology Project of Henan Province (Project Nos. 222102320451).
Conflict of interest
The authors declare that the research was conducted in the absence of any commercial or financial relationships that could be construed as a potential conflict of interest.
Publisher’s note
All claims expressed in this article are solely those of the authors and do not necessarily represent those of their affiliated organizations, or those of the publisher, the editors and the reviewers. Any product that may be evaluated in this article, or claim that may be made by its manufacturer, is not guaranteed or endorsed by the publisher.
References
1. Konno K, Ohmachi T. Ground-motion characteristics estimated from spectral ratio between horizontal and vertical components of microtremor. Bull Soc Am (1998) 88(1):228–41. doi:10.1785/bssa0880010228
2. Tokimatsu K, Arai H, Asaka Y. Deep shera-wave structure and earthquake ground motion characteristics in Sumiyoshi area, Kobe city, based on microtremor measurements. J Struct Constr Engng AIJ (1997) 491:37–45. doi:10.3130/aijs.62.37-1
3. Nakamura Y. On the H/V spectrum. In: The the 14th world conference on earthquake engineering; Beijing, china (2008).
4. Arai H, Tokimatsu K. Effects of Rayleigh and Love waves on microtremors H/V spectra. In: Proc. 12th World Conf. on Earthquake Engineering (2000). 2232. CD-ROM.
5. Thomson WT. Transmission of elastic waves through a stratified solid medium. J Appl physocs (1950) 21:89–93. doi:10.1063/1.1699629
6. Qingling D, Yanhui P, Youyang X. Research and application of Rayleigh wave extraction method based on microtremors signal analysis. Front Phys (2023) 11:11. doi:10.3389/fphy.2023.1158049
7. Sakaji K. Temporal variation of the power spectra of microtremors observed at soil and rock site. Graduation thesis. Sapporo, Japan: Hokkaido University (1998). (in Japanese).
8. Capon J. High-resolution frequency-wave number spectrum analysis. Proc IEEE (1969) 57(8):1408–18. doi:10.1109/proc.1969.7278
9. Aki K Space and time spectra of stationary stochastic waves, with special reference to microtremors. Bull Earthq Res Inst (1957) 35:415–56.
10. Boore DM, Toksöz MN. Rayleigh wave particle motion and crustal structure. Bull Seismol Soc Am (1969) 59(1):331–46.
11. Zhao H, Zhang Y. CWT-based method for extracting seismic velocity dispersion. IEEE Geosci remote sensing Lett (2022) 19:1–5. doi:10.1109/lgrs.2021.3056610
12. Giulia S, Silvia C. Detecting 1-D and 2-D ground resonances with a single-station approach. Geophys J Int (2020) 223(1):471–87. doi:10.1093/gji/ggaa325
13. Asten MW, Hayashi K. Application of the spatial auto-correlation method for shear-wave velocity studies using ambient noise. Surv Geophys (2018) 39(4):633–59. doi:10.1007/s10712-018-9474-2
14. Okada H, Sakajili N. Estimation of an S-wave velocity distribution using long-period microtremors. Geophys Bull (1983) 42:119–43. Hokkaido University.
15. Cho I, Tada and T, Shinozaki Y. Assessing the applicability of the spatial autocorrelation method: a theoretical approach. J Geophys Res (2008) 113:B06307. doi:10.1029/2007jb005245
16. Cox H. Spatial correlation in arbitrary noise fields with application to ambient sea noise. J Acoust Soc America (1973) 54(5):1289–301. doi:10.1121/1.1914426
17. Horike M. Inversion of phase velocity of long-period microtremors to the S-wave-velocity structure down to the basement in urbanized areas. J Phys Earth (1985) 33:59–96. doi:10.4294/jpe1952.33.59
18. Matsushima T, Okada H An exploration method using microtremors (2)- anpexperment to identify Love waves in long-period microtremors. In: Proc. The 82nd SEGF Conf (1990). p. 5–8. (in Japanese).
19. Tokimatsu K, Shinzawa K, Kuwayama S Use of short-period microtremors for vs profiling. J Geotechnical Eng (1992) 118(10):1544–58. doi:10.1061/(asce)0733-9410(1992)118:10(1544)
20. Zhang H, Kristine P High-resolution Bayesian spatial auto-correlation (SPAC) quasi-3D vs model of Utah FORGE site with a dense geophone array. Geophys J Int (2021) 225(3):1605–15.
21. Hayashi K, Asten MW, Stephenson WJ, Cornou C, Hobiger M, Pilz M, et al. Microtremor array method using spatial autocorrelation analysis of Rayleigh-wave data. J Seismol (2022) 26:601–27. doi:10.1007/s10950-021-10051-y
22. Cho I Compensating for the impact of incoherent noise in the spatial autocorrelation microtremor array method. Bull Seismological Soc America (2018) 109(1):199–211. doi:10.1785/0120180153
23. Okada H, Suto K The microtremor survey method. Tulsa, OK: Society of Exploration Geophysicists (2003). p. 1–53.
24. Asten MW, Dhu T, Lam N Optimized array design for microtremor array studies applied to site classification; comparison of results with SCPT logs. In: Proc. 13th Annual World Conf. Earthq. Engineering (2004). 2903.
25. Asten MW On bias and noise in passive seismic data from finite circular array data processed using SPAC methods. Geophysics (2006) 71(6):153–62. doi:10.1190/1.2345054
26. Luo S, Luo Y, Zhu L, Xu Y On the reliability and limitations of the SPAC method with a directional wavefield. J Appl Geophys (2016) 126:172–82. doi:10.1016/j.jappgeo.2016.01.023
27. Ling S, Okada H An extended use of the spatial autocorrelation method for the estimation of structure using microtremors. Soc Exploration Geophysicists Jpn (1993) 44:48.
28. Ohori M, Nobata A, Wakamatsu K A comparison of ESAC and FK methods of estimating phase velocity using arbitrarily shaped microtremor arrays. Bull.Seismol Soc Am (2002) 92(6):2323–32. doi:10.1785/0119980109
29. Parolai S, Richwalski SM, Milkereit C, Fäh D. S-Wave velocity profiles for earthquake engineering purposes for the cologne area (Germany). Bull Earthquake Eng (2006) 4:65–94. doi:10.1007/s10518-005-5758-2
30. Parolai S, Mucciarelli M, Gallipoli MR Comparison of empirical and numerical site responses at the tito test site. South. Italy Bull Seismol Soc Am (2007) 97(5):1413–31.
31. Uebayashi H, Cho I, Ohori M, Yoshida K, Arai H. The effect of body waves on phase-velocity determined by the spatial autocorrelation (SPAC) method, evaluated using full-wave modelling. Exploration Geophysics (2020) 51(4): 483–93. doi:10.1080/08123985.2020.1719825
32. Cho I. Two-sensor microtremor SPAC method: potential utility of imaginary spectrum components. Geophys J Int (2020) 220(3):1735–47. doi:10.1093/gji/ggz454
33. Ikeda T, Tsuji T, Konishi C, Saito H. Spatial autocorrelation method for reliable measurements of two-station dispersion curves in heterogeneous ambient noise wavefields. Geophys J Int (2021) 226(2):1130–47. doi:10.1093/gji/ggab150
34. Toksöz MN Microseisms and an attempted application to exploration. Geophysics (1964) 29(2):154–77. doi:10.1190/1.1439344
35. Chen L, Lian H, Natarajan S, Zhao W, Chen X, Bordas SPA. Multi-frequency acoustic topology optimization of sound-absorption materials with isogeometric boundary element methods accelerated by frequency-decoupling and model order reduction techniques. Comp Methods Appl Mech Eng (2022) 395:114997. doi:10.1016/j.cma.2022.114997
36. Chen L, Lian H, Liu Z, Gong Y, Zheng CJ, Bordas SPA. Bi-material topology optimization for fully coupled structural-acoustic systems with isogeometric fem–bem. Eng Anal Boundary Elem (2022) 135:182–95. doi:10.1016/j.enganabound.2021.11.005
37. Chen L, Wang Z, Lian H, Ma Y, Meng Z, Li P, et al. Reduced order isogeometric boundary element methods for CAD-integrated shape optimization in electromagnetic scattering. Comp Methods Appl Mech Eng (2024) 419:116654. doi:10.1016/j.cma.2023.116654
Keywords: microtremors, Rayleigh wave, numerical simulation, SPAC method, velocity dispersion
Citation: Du Q, Pan Y, Zhao K and Gao D (2024) Research examining a spatial autocorrelation imaging method based on stationary characteristics of microtremors. Front. Phys. 12:1351018. doi: 10.3389/fphy.2024.1351018
Received: 06 December 2023; Accepted: 25 January 2024;
Published: 07 February 2024.
Edited by:
Yilin Qu, Northwestern Polytechnical University, ChinaCopyright © 2024 Du, Pan, Zhao and Gao. This is an open-access article distributed under the terms of the Creative Commons Attribution License (CC BY). The use, distribution or reproduction in other forums is permitted, provided the original author(s) and the copyright owner(s) are credited and that the original publication in this journal is cited, in accordance with accepted academic practice. No use, distribution or reproduction is permitted which does not comply with these terms.
*Correspondence: Qingling Du, ZHVxaW5nbGluZ0BodWFuZ2h1YWkuZWR1LmNu
 Qingling Du
 Yanhui Pan
 Kuanyao Zhao1