- 1School of Physics and Astronomy, University of Birmingham, Birmingham, United Kingdom
- 2Queen Elizabeth Hospital Birmingham, University Hospitals Birmingham NHS Foundation Trust, Birmingham, United Kingdom
Boron Neutron Capture Therapy (BNCT) is a binary cancer therapy where a low energy neutron beam is incident upon a patient who has been administered a tumour-seeking 10B loaded compound. The neutron capture reaction on 10B results in the production of two short range particles, 7Li and 4He, that deposit all of their energies within the targeted cell. However, accurate, online dosimetry during BNCT is challenging as it requires knowledge of both the neutron fluence and 10B concentration in cells. An additional product in the neutron capture reaction on 10B is a 478 keV prompt gamma ray, and if the production vertices of these gamma rays could be imaged by an external camera, the density of the vertices could be used to infer the dose delivered to the patient. In this study, the feasibility of using an array of LaBr3 scintillators as a modified Compton camera for prompt gamma imaging during BNCT was investigated using Geant4 simulations. These simulations demonstrated that a phantom containing a 3 cm diameter region of 400 ppm 10B could be reconstructed using clinically relevant neutron fluences. This result opens up more possibilities for future research to improve dosimetry during BNCT.
1 Introduction
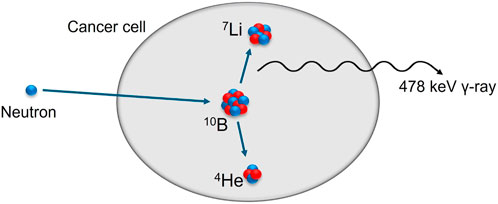
Boron neutron capture therapy (BNCT) is a binary cancer therapy that utilises a combination of biological and physical targeting of the tumour cells [1]. To target the cancer biologically, the patient is administered with a 10B loaded compound which is designed to have preferential uptake within cancer cells. The physical targeting comes from a low energy neutron beam that is directed at the site of the cancer. When a neutron is captured by a 10B nucleus it undergoes an alpha decay and yields 7Li and 4He nuclei which are both high linear energy transfer (LET) particles. The 7Li and 4He nuclei have a typical range in tissue equivalent to the size of a cell, and as such deposit all of their energies within the cancer cell [2]. As the cross section for thermal neutron capture on 10B is multiple orders of magnitude higher than the components of normal body tissue [1], an increased dose is absorbed by the cancer cells compared to healthy tissue. Figure 1 demonstrates the fundamental interaction utilised during BNCT, which can be described by Eq. 1.
The potential benefits of using BNCT for cancer treatments arise from the cellular targeting of the cancer, and the short range, high LET particles that are produced. This differs from conventional techniques that generally utilise low LET radiation such as x-rays or electrons [3]. This low LET radiation deposits energy much more sparsely across the tumour and healthy tissue and makes it challenging to produce high precision dose delivery focused at the tumour cells. Whereas during BNCT, if the 10B loaded compound successfully accumulates in the cancer cells at a higher rate than healthy tissue, the dose delivered to a patient can be highly concentrated at the location of the cancer. Due to this enhanced precision of the dose delivery, research into BNCT has mostly focused on sensitive regions of the body, such as the brain, head and neck [4]. For cancers in these sites, especially for the treatment of recurrent disease, conventional therapies can pose too much of a risk to healthy tissue.
However, obtaining accurate dosimetry during BNCT is challenging due to the various components of delivered dose and the complex radiation background. The dose delivered can be split into 4 main categories: boron dose, DB, from the neutron capture on 10B, nitrogen dose, DN, from neutron capture on 14N, hydrogen dose, DH, from hydrogen nuclei recoiling after interacting with fast neutrons, and photon dose, Dγ, from prompt gamma rays produced during other interactions [5]. The majority of the photon dose comes from 2.22 MeV photons produced after neutron capture on hydrogen. Due to the increased 10B concentration in the tumour cells, the boron dose dominates within this region [6], with the photon dose being the largest contributor to the background dose [7]. Existing methods for dose measurements rely on knowledge of both the 10B concentration in the cells, tumour and healthy tissue, and the neutron beam fluence and energy distribution [5,8]. These quantities are challenging to measure directly, so are generally estimated using simulation data in combination with some measured values. Therefore, dose measurements obtained in this way are carried out offline, rather than in real-time during a patient’s treatment. The development of techniques that could be used for online dosimetry during BNCT is an important area of ongoing research within the community.
As shown in Figure 1, during the neutron reaction with 10B, there is a high chance that a 478 keV prompt gamma ray will be produced. This gamma ray originates from the 7Li nucleus being produced in a very short-lived excited state after 93.9% of the neutron captures. If the production vertices of these photons could be located and imaged, the density of the vertices could be used to infer the rate of boron neutron capture reactions. This inferred reaction rate could then be used to obtain a measurement of the dose delivered to the patient, without needing knowledge of either the 10B concentration or neutron beam characteristics, as they should be accounted for by the reaction rate. Thus, prompt gamma imaging of the 478 keV gamma ray could be used to obtain the desired, real-time dose monitoring during a BNCT treatment [9]. Previously, research into methods for detecting these prompt gamma rays has primarily focused on single-photon emission computed tomography (SPECT) systems [7,8,10–15], which require collimation of the incident photons. Although some of these systems in development have shown very promising results, one disadvantage of all SPECT systems arises from the heavy mechanical collimation that is required. This collimation reduces the number of photons that can be used for dose measurements significantly and these reduced statistics could increase the uncertainties on the inferred dose. In addition to this, the introduction of large amounts of heavy material, such as lead or tungsten, enhances the rate of pair production around the detectors from the 2.22 MeV photons [6,7]. This leads to a large background of 511 keV photons being produced after positron annihilation. Due to the proximity of the energies of the 478 keV and 511 keV gamma rays, separating the prompt gamma signal from the background is non-trivial and increases the difficulty of obtaining accurate dosimetry.
A Compton camera provides an alternative method for prompt gamma imaging during BNCT and does not require the use of any physical collimators. There has been some previous research on the feasibility of using a Compton camera for prompt gamma imaging during BNCT [16–18], but it has been less explored than the SPECT systems mentioned previously. An overview of research into the use of Compton cameras for BNCT is presented in [19]. The focus of this study was to investigate the feasibility of using an array of LaBr3(Ce) scintillation detectors as a Compton camera for prompt gamma imaging during BNCT.
2 Materials and methods
2.1 Compton camera
The concept of using a Compton camera for medical imaging was first proposed in 1974 [20]. Following this, examples of physical systems being created and tested can be seen from the 1980s [21,22]. The basic principle of a Compton camera relies on a photon Compton scattering by some angle θ in one detector, before being detected via photoelectric absorption in a second detector. If the energy deposited by the photon in both of these interactions is measured, then the angle at which the photon scattered can be found by rearranging the Compton scattering equation into the form shown in Eq. 2 [23]. E1 is the energy deposited in the first detector when the photon is Compton scattered, and E2 is the energy deposited when the photon is absorbed in the second detector.
Once the scattering angle has been found, it is combined with the axis defined by the scattering and absorption vertices to obtain a conical surface from which the photon must have originated. This concept is displayed in Figure 2. If multiple photons starting from the same point are detected in this way, with varying scattering angles and interaction vertices, then a collection of cones can be found. The location of the source is then determined by finding the position where these cones overlap. This basic imaging mechanism relies on the photon only undergoing a single scatter in the first detector and being entirely absorbed in the second detector, however there has been research into multiple scatter Compton cameras which can make use of events with more than one initial Compton scatter [24,25].
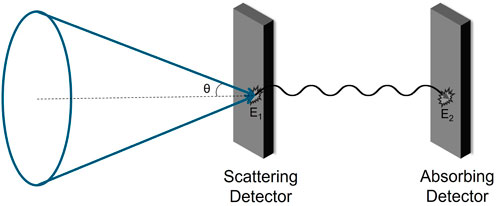
FIGURE 2. Principle of operation of a Compton camera. Angle θ can be calculated from energy deposits to find a cone on which the photon must have been produced.
2.2 Modified Compton camera using a LaBr3 array
Traditionally, a Compton camera would rely on two distinct sets of detectors, one set to act as the scattering detectors and the other set placed further from the source location to be the absorbing detectors. The differential cross section, and therefore the probability, of the photon Compton scattering at a particular angle can be calculated using the Klein-Nishina formula [26,27]. This probability is strongly dependent on the initial photon energy, so for a given photon energy that a Compton camera was being designed for, the geometry could be optimised to maximise the chances of photons interacting in a pair of detectors. Considering the 478 keV prompt gamma rays present during BNCT, the Klein-Nishina distribution at that energy is shown in Figure 3. At this photon energy the differential cross section is highest at low angles, drops off quickly to around half of the peak value at 45° and finally stays approximately constant for scatters greater than 90°.
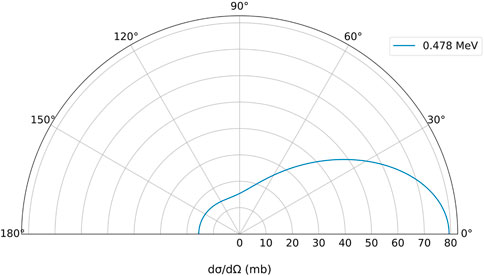
FIGURE 3. Klein-Nishina distribution showing the differential cross section in millibarns of a 478 keV photon scattering through angles 0°–180°.
In this study a variation on a typical Compton camera was investigated, where each detector in the array could act as both the scattering and absorbing detector, depending on whether an incident photon had interacted in another detector previously or not. The camera design was based on an array of 1.5 inch lanthanum bromide (LaBr3(Ce)) scintillator detectors at the University of Birmingham, with a hemispherical configuration. A visualisation of this array is shown in Figure 4. Specifically, Figure 4A displays the 10 detector array with the same dimensions and detector positions as the existing physical array, whereas Figure 4B is an 18 detector array that was created by using the symmetries of the real array to fill in the empty spaces. This 18 detector array was then used for the majority of the simulation tests with the detectors placed so the centre of every detector was 30 cm from the centre of the array. However, Figure 4B presents a visualisation of the 18 detector array with all of the detectors placed 10 cm from the centre of the array, to provide a simple picture of the overall structure of the camera, independent of any specific phantom or neutron beam. More details of the exact setup used in this study are covered in Section 2.3 and Figure 8.
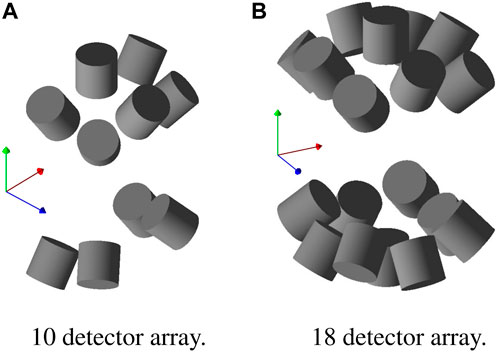
FIGURE 4. Visualisation of the simulated LaBr3 arrays. (A) Displays the original 10 detector geometry, with the same dimensions as the physical array at the University of Birmingham, (B) displays the extrapolated 18 detector array used in the simulations.
Due to the spherical configuration of the detectors in the array, for a photon to scatter from any one detector into another would require a Compton scatter of close to or greater than 90°. As Figure 3 demonstrated, these large angle scatters have a reduced probability of occurring in comparison to smaller angles, but there is an approximately equal probability for any angle past 90°. However, the effect of the reduced differential cross section for the large angle scatters is countered by a significant increase in the number of possible detection channels when each detector can act as both a scatterer and an absorber. In this context, a detection channel refers to a distinct pair of a scattering and absorbing detector, so each detection channel gives one possible cone axis for the Compton camera reconstruction.
For a traditional Compton camera with ntrad total detectors, the maximum number of detection channels is always given when the detectors are equally distributed between scatterers and absorbers. For even ntrad this means
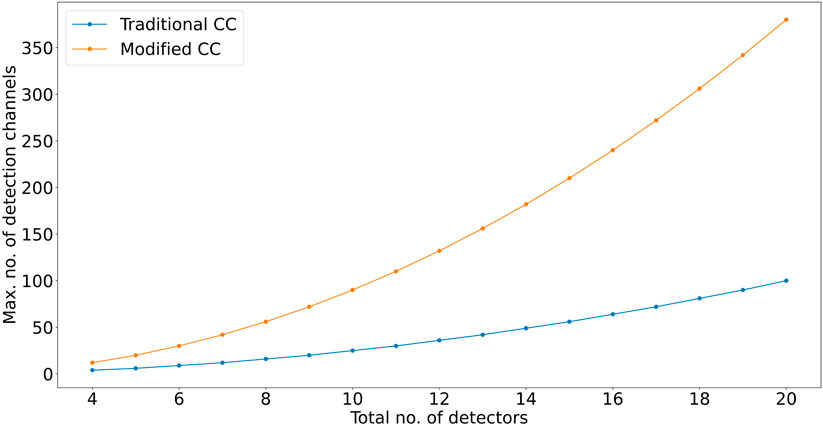
FIGURE 5. Comparison between the maximum number of detection channels that can be achieved when using a traditional Compton camera design and a modified camera design where each detector can act as both a scatterer and absorber.
For a total of 18 detectors, this corresponds to an increase in detection channels by a factor of 3.78 when using the modified design. This is approximately equal to the factor difference in differential cross section between a scattering angle of 30° and a scattering angle
The particular geometry of a detector array will impact the relative counts in each detection channel, although due to the approximately uniform scattering probability for angles
For the simulation data used to produce the final results displayed in Section 3.2, the distribution of scattering angles for every recorded 478 keV coincidence event was found and this is shown in Figure 6. As expected for this detector configuration, the most probable scattering angles were between 90° and 110°, which corresponds to the photon scattering from one detector into one of its nearest neighbours. However, there are also considerable contributions from scattering angles between 60° and 90°, predominantly originating from photons scattering from the front of one detector towards the back of a neighbouring detector, and from scattering angles
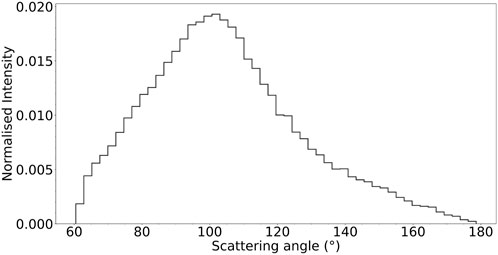
FIGURE 6. The normalised distribution of scattering angles for every coincidence event used for the reconstruction of the image presented in Figure 11B.
Although the initial inspiration for the camera design came from the physical LaBr3 array, the suitability of the LaBr3 scintillators to operate in a system as both scattering and absorbing detectors needed to be checked. Considering the 478 keV photons that would be imaged, for a
2.3 Simulation design
The simulations for this study have been carried out using the Monte Carlo simulation software Geant4 [29], with the physics list ‘QGSP_BERT_HP’. In the simulations, the energy deposited in the LaBr3 detectors was smeared according to experimental measurements of the energy resolution of the detector (5.1% at 662 keV). Initially, simulations were set up using a 478 keV point source, to test the detector characteristics and observed coincidence rates. Following this, an epithermal neutron beam and phantom were introduced into the simulations. The phantom was designed to replicate the one used in the work by Minsky et al. [8], which consisted of a water cylinder of 9 cm radius surrounding a tumour of 3 cm diameter, placed off-centre in the phantom. In that study, a concentration of 400 ppm 10B was used for the tumour, which was also replicated in this current study. The tomographic image of the tumour that was produced in that investigation is shown in Figure 7.
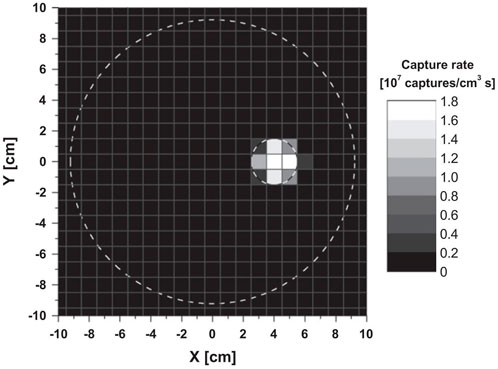
FIGURE 7. Tomographic image of boron neutron capture rate in the phantom from Minsky et al. [8]. The dashed lines show the outline of the tumour and the phantom.
The energy spectrum for the epithermal neutron beam that was used in this study was based on the Massachusetts Institute of Technology (MIT) epithermal neutron beam that has been used for previous BNCT studies [30]. During BNCT, a neutron fluence of
In addition to testing the performance of the camera and reconstruction algorithm to image the rate of boron neutron capture interactions, further simulations were also carried out to investigate the effect of different types of shielding on the gamma spectra observed by the detectors. As discussed previously, imaging the 478 keV photons can be made very challenging by the presence of a large background of 511 keV photons. These 511 keV photons are produced after the 2.22 MeV photons undergo pair production and a subsequent annihilation occurs. It is expected that the majority of the pair production would occur within the SPECT collimators and shielding made from heavy elements [7,28], most commonly lead or tungsten, rather than in the much lighter water or soft tissue material. Therefore, without the need for mechanical collimation, a Compton camera design has the potential to avoid the problem caused by the 511 keV photons. To investigate how significant this benefit could be, simulations were run with and without layers of lead shielding, and the gamma spectra in all of the detectors were scrutinised. For each detector in the array a hollow cylinder of lead was placed around the crystal, with an inner radius equal to the radius of the detector and a thickness of 2 cm on all sides. This cylinder was then extended by 10 cm from the front face of each detector towards the phantom, so each detector effectively had its own collimator with a relatively large aperture. The aperture was made as wide as the detector crystals to ensure a reasonable amount of photons could still reach the detectors, in a camera that otherwise was not optimised to be used in a SPECT system.
In any prompt gamma system for BNCT, some neutron shielding will also be required to prevent as much neutron activation in the detectors as possible. Compounds containing lithium-6 are often used for this purpose [10,14], due to the relatively high thermal neutron capture cross section of 6Li, and so the effect of adding in a layer of 6Li in front of the detectors was also explored in the simulations. The 6Li was introduced into the setup as a hollow sphere of thickness 2 cm placed between the phantom and the detectors in the array. The source of the neutron beam was placed within this sphere to avoid attenuating the beam before it reached the phantom. Figure 8 shows the geometry of the full setup, with both shielding components included, for a vertical slice taken through the centre of the array. Although both of the shielding elements are shown in this diagram, in the results presented in Section 3.1 only one type of shielding was used at a time.
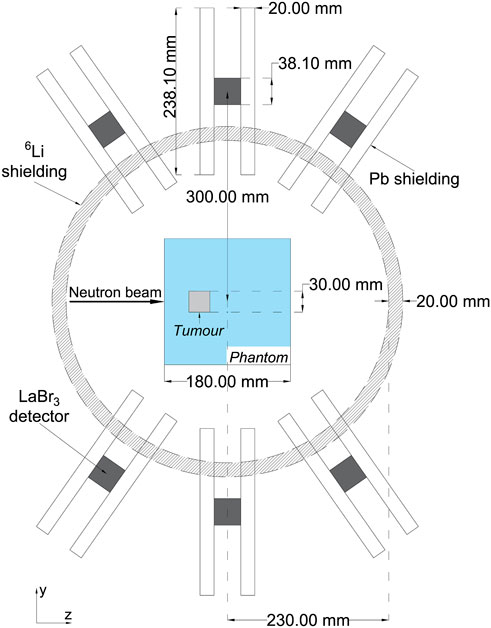
FIGURE 8. A schematic diagram of the simulated setup on a vertical slice taken through the centre of the array. Both the Pb gamma shielding and the 6Li neutron shielding have been included in the diagram, but were never tested in the simulation at the same time.
2.4 Reconstruction
A specialised reconstruction algorithm was created to process the simulation data obtained in this study, due to the novel design of the Compton camera used. Future studies could be carried out to adapt existing Compton camera reconstruction algorithms for use with this camera design, and to compare the performance of the different methods. The reconstruction algorithm in this study uses an analytical method, for which the basic principle is to voxelise the imaging domain and then inspect one voxel at a time to find the amount of recorded coincidence events that could have originated from that position.
The reconstruction algorithm starts by taking a list of coincidence events obtained from the simulation. Each of these events contains the names of two detectors and the energy deposited in each of those detectors. For each coincidence event, the sum of the two energies is compared to a pre-defined energy window set around the energy of the photons being imaged, in this case 478 keV. If the summed energy is within this window, the coincidence event is retained to be used for the reconstruction. Once the list of suitable coincidence events has been determined, the following steps are used to reconstruct the data:
1. Using the list of suitable coincidence events, the energy spectrum in the scatterer for every possible detection channel is generated and stored.
a. For the camera used in this study, where each of the 18 detectors can act as the scatterer, this process generates 17 spectra per detector, one for each possible absorber, resulting in a total of 306 spectra.
2. For every detection channel, the vector between the scatterer and absorber is found and stored.
a. As in the previous step, this will generate 306 vectors for the 306 detection channels possible with this camera design.
3. The imaging domain and the voxel size within the domain are set by user defined parameters, which are used to generate a 3D voxel grid.
4. Taking the first voxel in the grid, the vector connecting the centre of the voxel to each of the scattering detectors is found.
a. As all 18 detectors in the current camera design may function as a scattering detector, this step will find the vector between the voxel and all of the detectors in the array.
5. For each of the vectors obtained in step 4, the dot product is taken with all of the detection channel vectors (those stored in step 2) that have a matching scattering detector. Each dot product gives the angle at which a photon originating in the voxel must have been scattered by to be detected via the corresponding detection channel.
a. This step calculates a scattering angle for every detection channel, so similarly to steps 1 and 2, for the camera used in this study, 306 angles are found.
6. For each detection channel, the required scattering angle is substituted into the standard Compton scattering equation, along with the energy of the photon being imaged (478 keV for this study), to determine the energy that such a photon, originating from the voxel being analysed, would deposit in the scatterer of that detection channel.
7. Each of these energies is compared to the energy spectrum in the scattering detector (stored in step 1) of the corresponding detection channel, and the counts in the spectra at the specific energies are summed over all possible detection channels to give the intensity in the voxel being analysed.
8. Finally, steps 4 - 7 are repeated for every voxel in the generated grid to produce a full 3D reconstruction.
3 Results and discussion
3.1 Effect of shielding on gamma spectra
With the phantom, neutron beam and detector configuration fixed, different levels of shielding were introduced into the simulation and the gamma spectra were compared. Initially, it was observed that the detectors in the array that were closest to the neutron beam were exposed to significantly more neutron induced background in the gamma spectra. Although the spectrum from each individual detector had the same overall structure as the total gamma spectrum, to demonstrate the effect of shielding options as clearly as possible, in the following comparisons one of the detectors close to the neutron beam was used. The same effects were seen in all of the spectra, but less pronounced for those further from the neutron beam. Figure 9 shows the gamma spectra from the same detector, with either no additional shielding, a layer of 6Li neutron shielding and finally, Pb gamma collimators and shielding surrounding each of the detector heads.
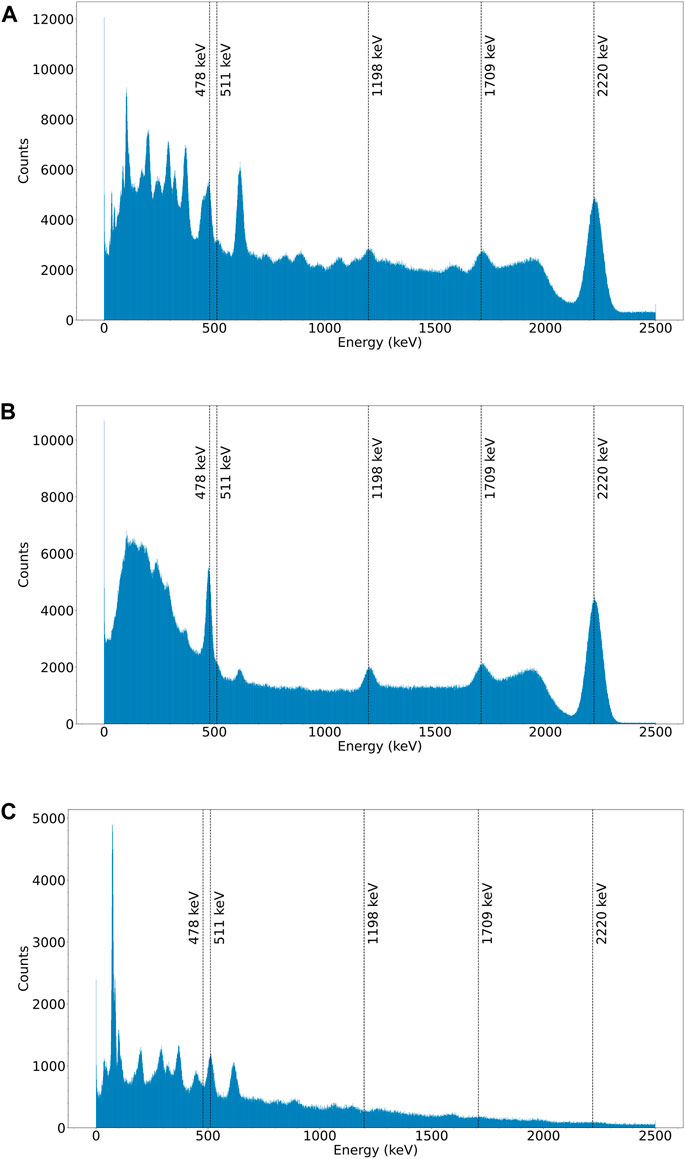
FIGURE 9. Gamma spectra from one of the detectors on the side of the array closest to the neutron beam, with varying levels of shielding included in each case: (A) No shielding, (B) with 6Li neutron shielding and (C) with Pb gamma collimators and shielding.
For the case with no shielding in the simulation, the only materials present are the water and 10B in the phantom, along with the LaBr3 of the detectors and a thin casing layer around each LaBr3 crystal. The gamma spectrum for the detector under observation is shown in Figure 9A. The labels were placed at the locations where it was expected the significant peaks would occur [8]. These peaks were the previously discussed 478 keV prompt gamma peak, the 2.22 MeV peak from neutron capture on hydrogen and the 511 keV annihilation peak. The other two labelled peaks at 1709 keV and 1198 keV are the single and double escape peaks from the 2.22 MeV photon respectively. However, with no collimator or other gamma shielding in the simulation, there is a notable absence of any significant 511 keV background. Although there is minimal impact from 511 keV photons, there is considerably more structure in the background than expected. This was vastly more prominent in the detectors closer to the neutron beam, and hence why one of these detectors was used for all of the spectra shown in Figure 9. This also strongly indicates that this increased structure in the background was caused by neutrons interacting with the detectors.
Due to the amount of individual peaks that can be seen in Figure 9A, each of these energies has not been connected to a particular neutron interaction, but it is possible that this could be done with further study into neutron interactions in LaBr3 and the casing around the crystals. However, it was observed in the simulation that most of these additional peaks were caused by gamma rays created following neutron capture interactions in the detectors. For example, in Figure 9A there is a peak centred at 447 keV, overlapping the 478 keV prompt gamma peak, which is a summed peak from a few low energy photons emitted by a de-exciting 80Br nucleus after a neutron capture on 79Br. In the simulation, the energy deposits are summed within each detector per primary neutron, so when a neutron capture occurs in the detector and is followed by a cascade of gamma rays from a de-exciting nucleus, all of the energy from the gamma rays that do not escape the detector will be summed to give a single value. This does not account for the lifetimes of the energy levels, or the time resolution of the detectors, so experimentally it is unlikely that some of the peaks caused by this energy summing, such as the peaks at 447 keV and 615 keV, will be observed. Instead, the lower energy peaks that correspond to the individual gamma energies would be expected to increase in intensity. Although some of the very short lived excited states may contribute to summed peaks, there is a metastable state of energy 85.8 keV in 80Br with a half life of 4.42 h that contributes to many of the prominent summed peaks in the simulation [32]. Therefore, these peaks would be reduced by at least this amount in an experimental measurement.
The first shielding element that was introduced into the simulations and tested, was the 2 cm layer of 6Li in front of all of the detectors, which should capture many of the thermal neutrons that have been scattered in the beam or by the phantom and stop them reaching the detectors. With this layer of neutron shielding added, the gamma spectrum for the same detector as used for Figure 9A is shown in Figure 9B. The effect of the layer of 6Li is very evident, most of the unexpected peaks in the spectrum have been reduced considerably or have disappeared completely. Most importantly, the 478 keV peak is now sitting on top of a reduced background, which should allow it to be reconstructed with greater clarity. So from a solely reconstruction point of view, the introduction of this neutron shielding should be greatly beneficial. In addition to this, the physical detectors would need protection from the thermal neutrons to prevent excess radiation damage, so using some neutron shielding is vital. For these simulations, the layer of 6Li was placed in a thin sphere in front of all the detectors to investigate its effect, but in future a more practical approach of introducing the shielding would need to be considered. For example, the material containing the 6Li, the structures used to hold it in front of the detectors and how much area it would cover all need to be considered and the effect a more practical setup has on the gamma spectra needs to be investigated.
To further emphasise the benefit the inclusion of the neutron shielding has on the reconstruction, the coincidence constraints used for the reconstruction can be applied and the spectra can be examined post-constraints. For each coincidence event, two detector names are stored, along with the energy deposited in each detector. Therefore, for each event, the two energies can be summed to give the gamma spectra seen by the full camera once coincidences have been found. Figure 10 shows a comparison for two of these spectra, before and after the inclusion of the neutron shielding. Similarly to Figure 9A, for the coincidence spectrum with no shielding, shown in Figure 10A, there is a lot of structure, unexpected peaks and a large background underneath the targeted energy of 478 keV. In contrast, Figure 10B shows the coincidence spectrum when the 2 cm layer of 6Li was introduced. This clearly highlights the effect of the 6Li tidying up the spectrum, with the peak at 478 keV becoming much more distinct. Reconstructing the events in a small energy window around 478 keV will evidently be improved with the enhanced signal to noise ratio displayed.
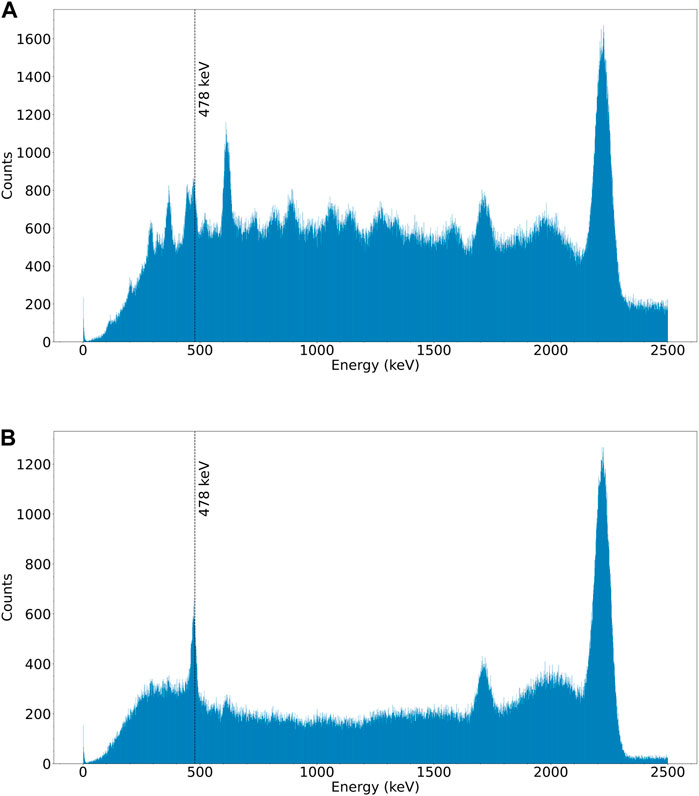
FIGURE 10. Spectra of summed energies from all coincidence events, (A) with no neutron shielding and (B) with 6Li neutron shielding.
Finally, to test the effect of any gamma shielding on the setup, lead collimators were added in front of each of the detectors in the array. For this test the neutron shielding was removed, so the effect of the added Pb could be investigated directly. The geometry of the lead shielding was described in Section 2.3. With the lead shielding introduced, the gamma spectrum for the same detector as used throughout is shown in Figure 9C.
With the layer of 6Li removed for this test, the spectrum clearly shows the re-emergence of the effect of the neutron interactions in and around the detectors. In addition to the neutron induced peaks, there is the very sharp peak around 70–80 keV caused by the Pb characteristic x-rays. The most important result to highlight from this test is the increase in significance of the 511 keV gamma peak. The 478 keV peak is now indistinguishable from the background, which is not far from what has been observed with other SPECT systems [8], but another factor leading to this will be the fact this array has not been designed to be used as a SPECT camera, so the collimators are not all oriented to point at the likely location of the 478 keV gamma production. However, independent of this lack of 478 keV photons, the comparison between Figures 9A,C confirms the hypothesis that any significant 511 keV background will be created within the heavy element shielding of SPECT systems, rather than throughout the volume of the phantom/body. Therefore, this demonstrates one of the advantages of using a Compton camera with vastly reduced shielding requirements, as the 511 keV peak can cause difficulties during reconstruction, especially when it is over an order of magnitude larger than the 478 keV peak.
3.2 Reconstructed images of testing phantom
With the simulation setup as described in Section 2.3, and the 2 cm layer of 6Li neutron shielding, the longest simulation that has been completed achieved a neutron fluence of 1.0 × 1011 cm−2. The data from this simulation were reconstructed using the method described in Section 2.4. Figure 11A shows the true distribution of where the 478 keV photons originated, which was obtained from the simulation, and Figure 11B shows the final reconstructed image. For both of these images, the intensities have been normalised to enable direct comparisons.
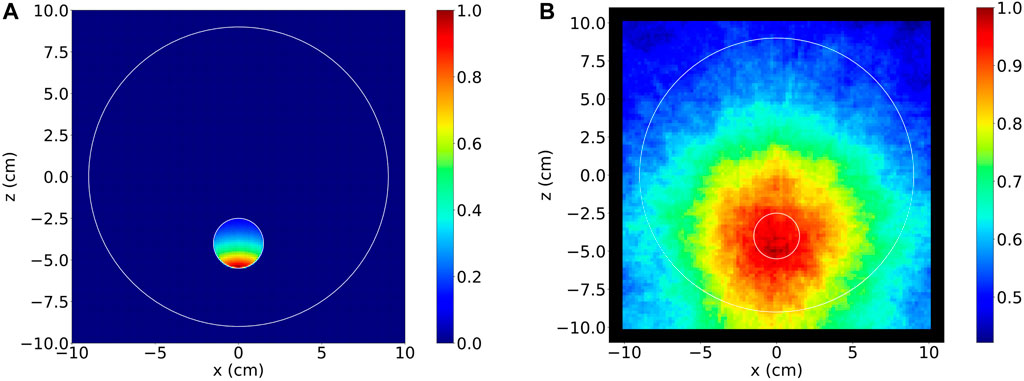
FIGURE 11. (A) True distribution of the origin of the 478 keV gamma rays with the setup described in Section 2.3. (B) Reconstructed image of the origin of the 478 keV gamma rays from the simulation.
Figure 11A demonstrates that for the setup geometry and neutron beam that were used, there were neutron capture reactions on 10B throughout the tumour, but the rate of these captures was higher at the edge of the tumour closest to the point where the neutron beam enters the phantom. Clinically this may be addressed by some modification of the neutron beam design to increase penetration, or more likely by the use of a multi-field irradiation approach.
The reconstruction algorithm requires the coordinates of the detectors in the array to identify the origin of any 478 keV photons that are detected in coincidence. In this detector array, for a photon to scatter from one detector to another, it is most probable that the photon will be scattered very close to the front face of the first detector, to minimise the detector material it travels through. Therefore, for the 18 detectors, the simplest approximation for the coordinates is to use the centre of the front face when the detector acts as the scattering detector, and the centre of the detector volume when the detector acts as the absorbing detector.
It was predicted that this Compton camera would not have a uniform sensitivity across its field of view, so to investigate this, a uniform 478 keV gamma source that covered the volume of the phantom was simulated and the reconstruction applied to the data. The results of this confirmed the prediction and demonstrated that the centre of the field of view had the greatest sensitivity and the intensity in the image drops when moving further from this point. To account for this when performing a reconstruction on a different dataset, a matrix was found that would produce a uniform image when multiplied by the results of the reconstruction. Figure 12 displays the contours of the correction factor values that are stored in this array across the same plane that is used for presenting the final reconstructed image. This array was saved and used to perform a sensitivity correction on the reconstructed image of the testing phantom, for which the result is shown in Figure 11B.
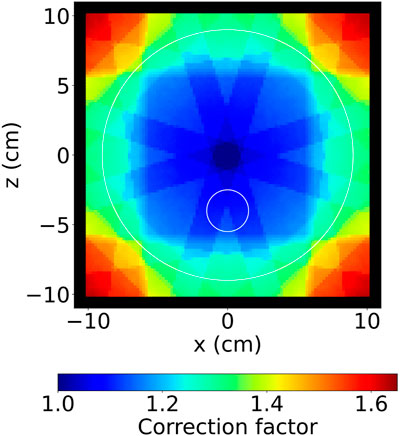
FIGURE 12. The contours of the correction factor values that were used to correct the final reconstructed image, to account for the variation in the sensitivity across the field of view of the detector array.
Figure 11B shows the capability of the camera design to locate the source of the 478 keV photons produced during the neutron capture reactions. For this reconstruction, all detected coincidence events with a summed energy between 468 keV and 488 keV were used, resulting in a total of 2.95 × 10⁵ usable photons. This value corresponds to approximately 0.004% of the total number of 478 keV photons that were produced during the simulation. A further study would be required to quantitatively assess the spatial resolution achieved by the detector array, however, it is clear that the tumour region has been highlighted as the main source of 478 keV photons with the region of highest intensity surrounding the true hotspot shown in Figure 11A, at the bottom edge of the tumour. Due to the nature of Compton camera reconstruction, it is expected that a background would also appear within the image. It is important to note that this image was produced with a total neutron fluence that was around 1 order of magnitude lower than similar investigations and there has been minimal work on any potential optimisation of the geometry. Therefore to show the capability to locate the source of the 478 keV photons, as it has, with these limitations is very promising. Although the initial results from this feasibility study are encouraging, the ultimate aim for using prompt gamma imaging for dosimetry requires a measurement of either the 10B distribution in the body or more directly, the rate of neutron capture reactions on 10B throughout the irradiated volume. Thus, further investigations must be carried out to find the best methods for converting these images, which are based on intensities of gamma counts, into more useful interaction rate information. One possible option for this could be applying machine learning techniques to develop a method for predicting the true 478 keV source distribution from the Compton camera image [18].
There are other limitations to this study that need to be addressed in future research. The design of the setup and the camera geometry needs to consider the increase in complexity that will be caused by using this camera in practice. Realistic shielding for the detectors needs to be designed and tested to ensure this will not impact the effectiveness of the camera. Then, requirements for using the setup clinically also need to be considered; what changes to the design would be needed for the camera to be used with a patient in the centre and how much freedom would be allowed to plan patient specific treatment plans within the field of view of the camera. Additionally, more physically accurate phantoms could be used in the simulations, with lower 10B concentrations that are more representative of clinical cases.
The current geometry of the detectors in the array was heavily influenced by the physical 10 detector array at the University of Birmingham. Therefore the positions of the detectors were given by this array and they have not been optimised for use within the Compton camera. By comparing the images produced and total number of useful coincidence events from simulations with different iterations of the array, an optimal arrangement could be found to further improve the performance of the camera. In the future, experiments could be run at the new high flux accelerator-driven neutron facility at the University of Birmingham to test the proposed camera design. This would also provide a better understanding of more of the physical constraints of the camera.
The reconstruction algorithm currently used for this camera should also be developed to enhance the images produced. A variety of Compton camera reconstruction methods could be tested on this camera and a comparison of images used to determine the optimal algorithm. Also linked to the advancement of the reconstruction methods is the requirement to extract the neutron capture rate from the images, which was discussed previously.
4 Conclusion
An investigation into the feasibility of using a modified Compton camera for prompt gamma imaging during BNCT was carried out. Using a simple water phantom containing a tumour region of 400 ppm 10B and an epithermal neutron beam achieving a neutron fluence of 1.0 × 1011 cm−2, the source of the 478 keV photons was successfully identified. As this fluence is an order of magnitude lower than what is expected clinically, further improvements to the accuracy of the image produced should be expected due to the associated order of magnitude increase of usable photons, from the current value of 2.95 × 10⁵. In addition to this, the benefit of the reduced shielding requirements of a Compton camera compared to a SPECT system, avoiding a significant background of 511 keV photons, was clearly demonstrated. The positive results from this feasibility study open up more possible directions for research into prompt gamma imaging for dosimetry during BNCT. The limitations of the study were covered in Section 3.2 and will be addressed in future research.
Data availability statement
The raw data supporting the conclusion of this article will be made available by the authors, without undue reservation.
Author contributions
KN: Conceptualization, Methodology, Software, Writing–original draft. TP: Conceptualization, Methodology, Supervision, Writing–review and editing. TzK: Methodology, Supervision, Writing–review and editing. SG: Conceptualization, Writing–review and editing. BP: Conceptualization, Writing–review and editing.
Funding
The author(s) declare financial support was received for the research, authorship, and/or publication of this article. This work was funded by the EPSRC Centre for Doctoral Training in Topological Design (grant EP/S02297X/1) and the University of Birmingham.
Conflict of interest
The authors declare that the research was conducted in the absence of any commercial or financial relationships that could be construed as a potential conflict of interest.
Publisher’s note
All claims expressed in this article are solely those of the authors and do not necessarily represent those of their affiliated organizations, or those of the publisher, the editors and the reviewers. Any product that may be evaluated in this article, or claim that may be made by its manufacturer, is not guaranteed or endorsed by the publisher.
References
1. Coderre JA, Turcotte JC, Riley KJ, Binns PJ, Harling OK, Kiger WS. Boron neutron capture therapy: cellular targeting of high linear energy transfer radiation. Tech Cancer Res Treat (2003) 2:355–75. doi:10.1177/153303460300200502
2. IAEA. Advances in boron neutron capture therapy. Vienna: INTERNATIONAL ATOMIC ENERGY AGENCY (2023). Chap. 1.
3. IAEA. Current status of neutron capture therapy. Vienna: INTERNATIONAL ATOMIC ENERGY AGENCY (2001).
4. IAEA. Advances in boron neutron capture therapy. Vienna: INTERNATIONAL ATOMIC ENERGY AGENCY (2023). Chap. 13.
5. IAEA. Advances in boron neutron capture therapy. Vienna: INTERNATIONAL ATOMIC ENERGY AGENCY (2023). Chap. 4.
6. Valda A, Minsky DM, Kreiner AJ, Burlon AA, Somacal H. Development of a tomographic system for online dose measurements in BNCT (Boron Neutron Capture Therapy). Braz J Phys (2005) 35:785–8. doi:10.1590/S0103-97332005000500017
7. Kobayashi T, Sakurai Y, Ishikawa M. A noninvasive dose estimation system for clinical BNCT based on PG-SPECT-Conceptual study and fundamental experiments using HPGe and CdTe semiconductor detectors. Med Phys (2000) 27:2124–32. doi:10.1118/1.1288243
8. Minsky D, Valda A, Kreiner A, Green S, Wojnecki C, Ghani Z. First tomographic image of neutron capture rate in a BNCT facility. Appl Radiat Isot (2011) 69:1858–61. doi:10.1016/j.apradiso.2011.01.030
9. Rosenschöld PMa., Minarik D, Östlund C, Ljungberg M, Ceberg C. Prompt gamma tomography during BNCT—a feasibility study. J Instrumentation (2006) 1:P05003. doi:10.1088/1748-0221/1/05/P05003
10. Minsky D, Valda A, Kreiner A, Green S, Wojnecki C, Ghani Z. Experimental feasibility studies on a SPECT tomograph for BNCT dosimetry. Appl Radiat Isot (2009) 67:S179–82. doi:10.1016/j.apradiso.2009.03.044
11. Hales B, Katabuchi T, Hayashizaki N, Terada K, Igashira M, Kobayashi T. Feasibility study of SPECT system for online dosimetry imaging in boron neutron capture therapy. Appl Radiat Isot (2014) 88:167–70. doi:10.1016/j.apradiso.2013.11.135
12. Hales B, Katabuchi T, Igashira M, Terada K, Hayashizaki N, Kobayashi T. Predicted performance of a PG-SPECT system using CZT primary detectors and secondary Compton-suppression anti-coincidence detectors under near-clinical settings for boron neutron capture therapy. Nucl Instr Methods Phys Res Section A: Acc Spectrometers, Detectors Associated Equipment (2017) 875:51–6. doi:10.1016/j.nima.2017.09.009
13. Manabe M, Nakamura S, Murata I. Study on measuring device arrangement of array-type CdTe detector for BNCT-SPECT. Rep Pract Oncol Radiother (2016) 21:102–7. doi:10.1016/j.rpor.2015.04.002
14. Murata I, Kusaka S, Minami K, Saraue N, Tamaki S, Kato I, et al. Design of SPECT for BNCT to measure local boron dose with GAGG scintillator. Appl Radiat Isot (2022) 181:110056. doi:10.1016/j.apradiso.2021.110056
15. Caracciolo A, Di Vita D, Buonanno L, Carminati M, Protti N, Altieri S, et al. Experimental validation of a spectroscopic gamma-ray detector based on a LaBr3 scintillator towards real-time dose monitoring in BNCT. Nucl Instr Methods Phys Res Section A: Acc Spectrometers, Detectors Associated Equipment (2022) 1041:167409. doi:10.1016/j.nima.2022.167409
16. Lee T, Lee H, Lee W. Monitoring the distribution of prompt gamma rays in boron neutron capture therapy using a multiple-scattering Compton camera: a Monte Carlo simulation study. Nucl Instr Methods Phys Res Section A: Acc Spectrometers, Detectors Associated Equipment (2015) 798:135–9. doi:10.1016/j.nima.2015.07.038
17. Gong C, Tang X, Shu D, Yu H, Geng C. Optimization of the Compton camera for measuring prompt gamma rays in boron neutron capture therapy. Appl Radiat Isot (2017) 124:62–7. doi:10.1016/j.apradiso.2017.03.014
18. Hou Z, Geng C, Tang X, Tian F, Zhao S, Qi J, et al. Boron concentration prediction from Compton camera image for boron neutron capture therapy based on generative adversarial network. Appl Radiat Isot (2022) 186:110302. doi:10.1016/j.apradiso.2022.110302
19. Tashima H, Yamaya T. Compton imaging for medical applications. Radiological Phys Tech (2022) 15:187–205. doi:10.1007/s12194-022-00666-2
20. Todd RW, Nightingale JM, Everett DB. A proposed γ camera. Nature (1974) 251:132–4. doi:10.1038/251132a0
21. Singh M. An electronically collimated gamma camera for single photon emission computed tomography. Part I: theoretical considerations and design criteria. Med Phys (1983) 10:421–7. doi:10.1118/1.595313
22. Singh M, Doria D. An electronically collimated gamma camera for single photon emission computed tomography. Part II: image reconstruction and preliminary experimental measurements. Med Phys (1983) 10:428–35. doi:10.1118/1.595314
23. Phillips GW. Gamma-ray imaging with Compton cameras. Nucl Instr Methods Phys Res Section B: Beam Interactions Mater Atoms (1995) 99:674–7. doi:10.1016/0168-583X(95)80085-9
24. Dogan N, Wehe D, Knoll G. Multiple Compton scattering gamma ray imaging camera. Nucl Instr Methods Phys Res Section A: Acc Spectrometers, Detectors Associated Equipment (1990) 299:501–6. doi:10.1016/0168-9002(90)90832-Q
25. Dogan N, Wehe D, Akcasu A. A source reconstruction method for multiple scatter Compton cameras. IEEE Trans Nucl Sci (1992) 39:1427–30. doi:10.1109/23.173219
26. Klein O, Nishina Y. Über die Streuung yon Strahlung durch freie Elektronen nach der neuen relativistischen Quantendynamik yon Dirac. Z für Physik (1929) 52:853–68. doi:10.1007/BF01366453
28. Berger MJ, Hubbell JH, Seltzer SM, Chang J, Coursey JS, Sukumar R, et al. Xcom: photon cross section database (2010). version 1.5. doi:10.18434/T48G6X
29. Agostinelli S, Allison J, Amako K, Apostolakis J, Araujo H, Arce P, et al. Geant4—a simulation toolkit. Nucl Instr Methods Phys Res Section A: Acc Spectrometers, Detectors Associated Equipment (2003) 506:250–303. doi:10.1016/S0168-9002(03)01368-8
30. Mirzaei D, Miri-Hakimabad H, Rafat-Motavalli L. Depth dose evaluation for prostate cancer treatment using boron neutron capture therapy. J Radioanal Nucl Chem (2014) 302:1095–101. doi:10.1007/s10967-014-3397-2
31. IAEA. Advances in boron neutron capture therapy. Vienna: INTERNATIONAL ATOMIC ENERGY AGENCY (2023). Chap. 7.
Keywords: BNCT, Compton camera, dosimetry, prompt gamma imaging, LaBr3
Citation: Nutter K, Price T, Kokalova T, Green S and Phoenix B (2024) A feasibility study using an array of LaBr3(Ce) scintillation detectors as a Compton camera for prompt gamma imaging during BNCT. Front. Phys. 12:1347929. doi: 10.3389/fphy.2024.1347929
Received: 01 December 2023; Accepted: 31 January 2024;
Published: 21 February 2024.
Edited by:
Paulo Magalhaes Martins, University of Lisbon, PortugalReviewed by:
Carlo Fiorini, Polytechnic University of Milan, ItalyHiroshi Watabe, Tohoku University, Japan
Shingo Tamaki, Osaka University, Japan
Copyright © 2024 Nutter, Price, Kokalova, Green and Phoenix. This is an open-access article distributed under the terms of the Creative Commons Attribution License (CC BY). The use, distribution or reproduction in other forums is permitted, provided the original author(s) and the copyright owner(s) are credited and that the original publication in this journal is cited, in accordance with accepted academic practice. No use, distribution or reproduction is permitted which does not comply with these terms.
*Correspondence: Kiran Nutter, a2puNzE4QGJoYW0uYWMudWs=
 Kiran Nutter
 Tony Price
 Tzany Kokalova
 Stuart Green1,2