 Nabila Masud
 Jaydeep Rade
 Md. Hasibul Hasan Hasib
 Adarsh Krishnamurthy
 Anwesha Sarkar
- 1Electrical and Computer Engineering, Iowa State University, Ames, IA, United States
- 2Mechanical Engineering, Iowa State University, Ames, IA, United States
Atomic force microscopy (AFM) is a part of the scanning probe microscopy family. It provides a platform for high-resolution topographical imaging, surface analysis as well as nanomechanical property mapping for stiff and soft samples (live cells, proteins, and other biomolecules). AFM is also crucial for measuring single-molecule interaction forces and important parameters of binding dynamics for receptor-ligand interactions or protein-protein interactions on live cells. However, performing AFM measurements and the associated data analytics are tedious, laborious experimental procedures requiring specific skill sets and continuous user supervision. Significant progress has been made recently in artificial intelligence (AI) and deep learning (DL), extending into microscopy. In this review, we summarize how researchers have implemented machine learning approaches so far to improve the performance of atomic force microscopy (AFM), make AFM data analytics faster, and make data measurement procedures high-throughput. We also shed some light on the different application areas of AFM that have significantly benefited from applications of machine learning frameworks and discuss the scope and future possibilities of these crucial approaches.
1 Introduction
Members of the scanning probe microscopy (SPM) family, such as atomic force microscopy (AFM) [1, 2], scanning tunneling microscopy (STM) [3] and scanning near-field optical microscopy (SNOM) [4] possess sharp probes to scan the surface of the substrate and measure physical quantities, i.e., tip-sample interaction force as a function of tip-sample separation distance and quantum tunneling current, respectively. Single-molecule techniques such as AFM [5, 6], optical tweezers [7, 8], and magnetic tweezers [9, 10] have established themselves as powerful experimental techniques to investigate single molecules at a time producing crucial information about the topographical features, and parameters of binding kinetics [11, 12]. AFM [2, 6, 13–19] has several advantages over other single-molecule techniques as it can perform high-resolution 2.5D imaging and nanomechanical property characterization of hard substrate (graphene) as well as soft substrates (soft biological samples, live cells, proteins, DNA, RNA) without using complicated sample preparation protocols such as freezing, drying, or metal coating. AFM produces 2.5D images by offering an “above-view” perspective that excludes the bottom surface of a 3D structure, as the sample is either immobilized or adhered to the substrate. It measures perpendicular forces to maintain a consistent tip-sample distance throughout the imaging process [20, 21]. It can also measure single molecule forces in the piconewton (pN) range on carbon nanotubes (CNTs), dry powders, and evaporated suspensions, as well as on biomolecules and live cells such as Lostao et al. [22] demonstrated how AFM can advance the inter-biomolecular interactions at nanoscale. Also, many ligand-receptor systems [12, 23–25] have been investigated using AFM to shed light on their single molecule interaction forces [26–28], binding probability, dissociation and association rates, affinity, and receptor density on live cells.
In AFM, a sample is scanned with a probe consisting of a cantilever and a sharp tip. As the tip scans the sample surface, the interaction force between the tip and the sample is measured by monitoring the cantilever’s deflection. A laser beam, directed onto the back of the cantilever, reflects onto a position-sensitive detector (PSD), and any deflection causes a deviation in the laser spot, inducing a voltage difference in the PSD. This voltage is used by a feedback system to generate a topographic image in imaging mode or to calculate the force acting on the cantilever in force spectroscopy mode. Typically, it maintains a constant force (in contact mode) or a constant amplitude (in tapping mode) by adjusting the height of the cantilever or the sample position relative to the cantilever (see Figure 1 middle panel mentioned “AFM”). Image contrast arises from the forces between the tip and sample, influenced by their separation and material properties [33].
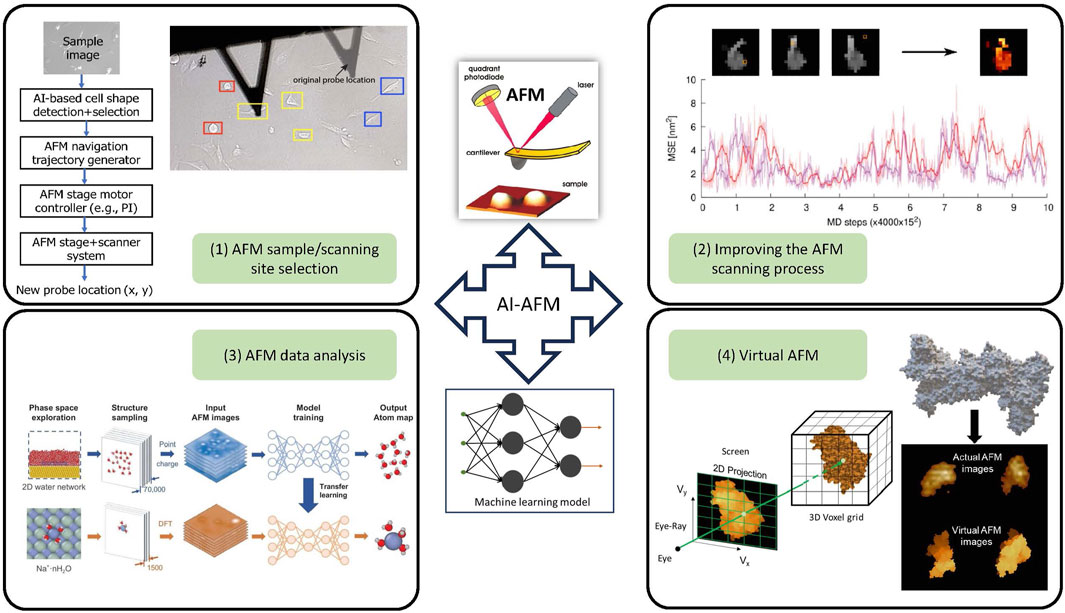
Figure 1. Overview of different steps of the AFM enhanced with the help of machine learning. Machine learning models can improve both the experimental and the data analytics steps of AFM by improving (1) sample or scanning site selection ([29] developed ML-guided cell shape detection framework for automatic AFM tip navigation), (2) AFM scanning process ([30] developed a particle smoother (PS) method for Bayesian data assimilation to integrate molecular dynamics simulations with asynchronous HS-AFM movie data), (3) AFM data analytics ([31] proposed using machine learning to identify atomic structures of interfacial water and ionic hydrates based on AFM images) and (4) creating virtual AFM ([32] proposed GPU-accelerated volume rendering technique to generate synthetic AFM images of protein samples).
AFM plays a major role in improving targeted drug delivery approaches [11, 19], helping to select a better binding partner by measuring the binding force and binding probability among different types of ligands and the targeted receptors. However, on both organic and inorganic samples, AFM results suffer from image artifacts due to the morphology of the cantilever tip. The rough, contaminated surface of the substrate can also cause misleading, corrupt data and damage to the cantilever tip. Also, high-resolution imaging and single molecule interaction force measurement with AFM and data analytics require special skill sets of the experimentalists and continuous human supervision, and these are also time-consuming. In state-of-the-art AFM, human experimentalists manually choose a region of interest on the substrate and assess the quality of obtained images based on their experiences, and trial and error. Over the last decade, astounding progress in machine learning, ML (especially deep learning, DL), has started a revolution in imaging of hard substrates, as well as bioimaging and image post-processing. These approaches have improved our structural understanding of biomolecules by enhancing the quality of data and the characterization of their nanomechanical properties. Implementing several machine-learning approaches can benefit all aspects of the AFM measurement process, including probe conditioning, imaging efficacy, manual operation, and selecting regions of interest. Some previous studies aimed to enhance imaging efficiency using inverse imaging of the cantilever tip through features of the sample, manipulation of the AFM probe, and analytical simulations [34, 35]. For example, Montelius et al. [36] introduced an in-situ method for directly observing the actual shape of the AFM tip through inverse AFM mode, significantly improving the accuracy and reliability of AFM imaging. Another way to reduce human operation is SPM automation. Huang et al. [37] have explored examples of automatic sample selection for AFM in specific applications using machine learning. Some research studies have explored examples of automatic sample selection for AFM in specific applications using machine learning. Instead of abiding by traditional rules, ML models extract decision strategies from training data sets. Results/predictions of ML models surpass humans, and these results are often dependent on neural networks (NNs) [38] or convolutional neural networks (CNNs) [39] that are popularly used for processing images.
Machine learning serves not only to assist human experimentalists in effectively selecting scanning locations but also to improve measurement quality, as evidenced by the findings of a recent investigation conducted by Rashidi and Wolkow [40]. This research illustrates how machine learning supports human operators in identifying and correcting specific probe defects within hydrogen-terminated silicon in the context of SPM. In this study, a trained CNN gauged the quality of the obtained SPM images and performed the SPM probe-conditioning protocol afterward. In a different study [41], machine learning approaches were implemented for determining the imaging quality from just a small number of the obtained scan lines, not complete images. Other than the ones referred to above, multiple pioneering research studies were performed to improve scanning probe microscopy using machine learning approaches. For example, Gordon and Moriarty [42] integrated machine learning algorithms into scanning probe microscopy, particularly STM, offering the transformative potential for mapping and manipulating matter at the atomic and molecular levels. Kelley et al. [43] presented a method to enhance SPM acquisition speed using spiral scanning combined with image reconstruction, demonstrating that Gaussian process regression achieves higher accuracy than compressed sensing despite higher computational costs. Ziatdinov et al. [44] investigated the general framework for applying Bayesian active learning methods in scanning probe microscopy (SPM), with a specific focus on piezoresponse force microscopy (PFM) as an illustrative example. Krull et al. [45] utilized the deepSPM machine learning for autonomous SPM operation, integrating sample selection and image assessment via neural networks. However, achieving a fully autonomous and generalized operation of AFM, including handling variations in probe defects and probe conditioning protocols, remains a challenge. AFM represents a more complex and diverse subset of SPM with specific operational demands. Optimal probe selection and conditioning are crucial for achieving high performance in AFM. These processes depend on various physical characteristics, including the tip radius [46], spring constant [47], and cantilever material [48]. These factors must be customized to match the specific requirements of the sample being analyzed. For instance, the tip radius impacts the resolution of imaging, while the spring constant affects force measurements, and the cantilever material determines compatibility with different sample types. Understanding these parameters is essential for selecting the appropriate probe and optimizing its performance. Besides supervised models such as a CNN, machine learning algorithms can also learn via trial and error if a large labeled data set is unavailable. This class of models, known as deep reinforcement learning (RL), has successfully improved SPM measurements by selecting appropriate SPM probe conditioning actions [49].
Machine learning and artificial intelligence (AI) have transformed our way of living and multiple application areas, for example, diagnosing cancer from medical images [50] and recognizing our voices from our phones [51]. AI has not only helped medical science but also propelled the discovery of new compounds. It has also improved image analysis, especially for images obtained from different types of microscopy and spectroscopy, where it supersedes the performance of human experimentalists in pattern recognition. Many of these AI-enabled image analyses are concentrated on data post-processing. In some cases, it is essential to generate a response to the images or data obtained on the fly, for example, by obtaining extra data in important regions of interfaces of materials [52, 53]. The discussions above are critical as they substantially improve the efficiency and throughput of atomic force microscopy (AFM), facilitating more rapid and accurate analyses. Since ML in AFM research and application is still in its early stages, according to our understanding, improving data acquisition and interpretation can significantly accelerate research in materials science, biology, and nanotechnology. This work will provide a foundation for researchers to advance ML-AFM applications further. In this article, we will summarize some of the leading and trailblazing research studies executed so far that implemented machine-learning approaches in atomic force microscopy (see Figure 1) to make it efficient and high-throughput. We will also shed some light on the areas that still need improvement and the open questions and opportunities.
2 Autonomous, effective, and high-throughput AFM using machine learning approaches
We have organized this review in primarily four categories of research studies (as seen in Figure 1) that focus on the use of AI and ML tools in (1) efficient sample or scanning site selection for AFM measurements, (2) improving the AFM scanning process, (3) accelerating AFM data analysis, and (4) building virtual AFM for performing in silico experiments. This section summarizes some pioneering works in these four research directions to articulate how researchers have combined machine learning approaches with AFM to enhance its performance, reduce human effort, and generate novel insights from data.
2.1 AFM sample or scanning site (important feature) selection
In one of the early works for using ML to select important AFM scanning sites, Huang et al. [37] developed an artificial intelligence-based AFM (AI-AFM) that integrates Support Vector Machine (SVM) algorithms with AFM control recognize patterns and identify features (see Figure 2). This AI-AFM also responds to adaptive testing by adding extra probing at key spots, all in real-time and without the involvement of a human, saving human users the hassle. In this vision, an AFM feeds real-time scanning data to a machine learning algorithm. This real-time data was used to pre-train the algorithm for feature recognition and material classification. This study specifically demonstrated how machine learning and artificial intelligence-powered AFM could improve the study of ferroelectric materials and electrochemical systems by implementing feature identification and pattern recognition and retorting to classification using adaptive experimentation. In real-time, this was achieved using additional probing at grain boundaries and critical domain walls (DW) locations. They implemented a ‘support vector machine (SVM)’ based machine learning approach with the ability to perform high-fidelity pixel-by-pixel recognition. Dynamic strain-based scanning probe microscopy was employed to investigate electromechanical coupling at the nm range. Both electrochemical strain microscopy (ESM) and piezoresponse force microscopy (PFM) probed different substrates using a charged conductive probe to measure the local deformation. This study aimed to determine if a trained machine learning algorithm can distinguish between non-ferroelectric and ferroelectric mappings and respond accordingly to perform required extra probing at particular critical locations for future analysis. Following identifying GBs in electrochemical materials and domain walls (DWs) in ferroelectrics using machine learning strategies, additional probing spots were decided at important material interfaces. While CNN relies on full mapping for recognition, SVM can adaptively alter experimental parameters during scanning. This study created an AI-AFM platform that instantly categorizes ferroelectric materials and uses on-the-fly adaptive experimentation to test the specific properties. The proposed system of Huang et al. [37] is capable of autonomously classifying ferroelectric materials with 180° domain walls in real time, recognizing patterns, and identifying features. Figure 2 illustrates this capability, showing amplitude and phase mappings of ferroelectric PMN-Pt single crystals (left panel of Figure 2C) and electrochemical ceria ceramics (right panel of Figure 2C). The system effectively identified domain walls (left panel of Figure 2D) and grain boundaries (right panel of Figure 2D) based on these mappings. The autonomous prediction methods outlined above are not limited to AFM images; they can also be extended to scanning electron microscopy (SEM) images [54] and combinational methods like hybrid approaches that integrate both AFM and SEM images. Li et al. [55] and Crouzier et al. [56] showcased nanoscale mechanical property analysis of coal and nanoparticle dimensional metrology analysis using a hybrid approach combining AFM and SEM images respectively. Zhang and Zhou [54] applied a fully convolutional network (FCN) that replaces the fully connected layer in CNN with extra convolutional layers and classifies every image pixel post-learning, retaining the spatial information of the original image.
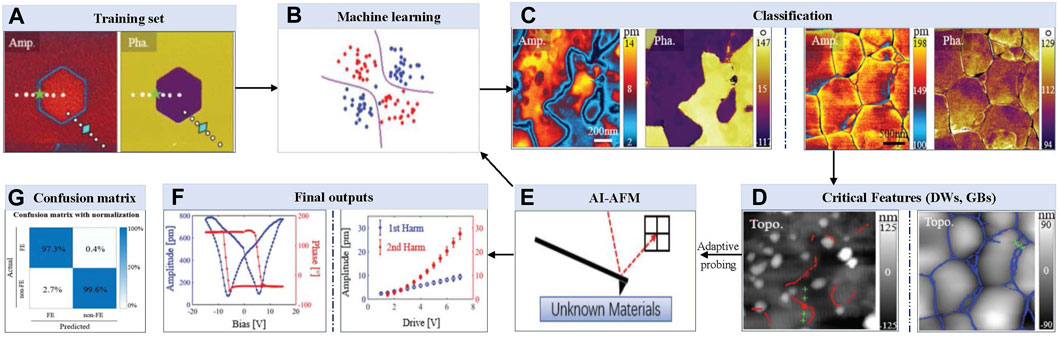
Figure 2. A complete framework to identify domain walls (DWs) and grain boundaries (GBs) of ferroelectric materials and electrochemical systems from unknown samples by training real-time data in machine learning: (A, B) Visual representation of feeding amplitude and phase mapping data set to a machine learning algorithm; (C, D) Identify DWs or GBs based on pre-trained data for classifying materials and recognizing features; (E) Additional experiments are performed on the fly close to critical features; (F) Measurements of ferroelectric hysteresis, butterfly loops, and first and second-harmonic piezo responses on DWs and GBs, respectively; (G) Confusion matrix shows how well the classifier performed on a set of 7,174 different dynamic strain-based scanning probe microscopy (ds-SPM) maps of different materials [37].
More recently, Arias et al. [57] proposed that AI-guided automation is used to overcome the challenges posed during the imaging by high-resolution atomic force microscopy (HR-AFM) that are both time-consuming and specialized knowledge-intensive. HR-AFM experiments can be extremely time-consuming, often requiring days to months to gather enough data. This is due to the need for individual imaging of molecules and optimizing this imaging to capture detailed information. Even under ideal conditions, imaging a single molecule can take hours, especially when working to find the best imaging conditions for complex molecules. For a dataset to be statistically relevant, particularly in complex molecular mixtures, it’s necessary to image at least 50 molecules. This article proposed an automated approach using a Python script named Auto-HR-AFM that combines machine learning (ML), artificial intelligence (AI), and HR-AFM. Using ML approaches, the program independently takes HR-AFM images and modifies the imaging environment. A ResNet + feature pyramid network (FPN) architecture, initially trained on the COCO database, forms the basis of the main model. It uses an instance segmentation neural network to identify the features in HR-AFM images and categorizes them into three classes based on the proximity of the probe to the molecule; these classes are too close, too far, or at an ideal distance for imaging the molecules. The instance segmentation model can locate the unique instances of molecules in an image and assign them an appropriate class label. For the segmentation model, they used a Detectron2 [58] architecture that uses feature-pyramid network (FPN) [59] as the backbone to extract feature maps from the input image. Further, a region proposal network (RPN) [60] processed these feature maps to detect the region of interest, which are then fed into the region of interest (ROI) [61] heads to predict the location and the class label of the instances in an image. They generated and labeled 599 HR-AFM images representing 160 different petroleum chemical compounds (divided into 60 images for training and 539 for testing) and achieved
Specifically, in the context of biological samples, in a recent study [29], our group has addressed one of the yet-to-be-addressed categories: autonavigation of AFM probe towards samples, specifically live cells of desired shapes. Selecting the samples manually and navigating the AFM probe toward the samples is tedious and time-consuming, especially in soft biological samples such as live cells. Biological samples are tedious due to their significantly softer and more fragile nature compared to most non-biological materials. Hence, rough handling during sample selection and probe positioning can easily damage these samples and make them difficult for AFM imaging [62]. Furthermore, the viscoelastic nature of live cells introduces additional challenges. Cells display both viscous and elastic characteristics, allowing them to deform under applied force and gradually return to their original shape, which complicates the positioning of the AFM probe and the imaging process [63, 64]. Additionally, dynamic cellular activities such as blebbing and cell division can swiftly change the cell’s structure and mechanical properties, making it difficult to achieve consistent and precise measurements. These continuous changes necessitate frequent adjustments, further increasing the complexity and duration of AFM imaging [65, 66]. Also, AFM experiments on biomolecules or live cells are time-consuming and low-throughput due to the absence of appropriate tools to select and detect samples automatically and AFM auto-navigation [28]. For measurement of nanomechanical properties [67] of live cells, the usual steps are manual engaging of the AFM cantilever tip [68] on a live cell followed by retraction of the AFM probe and manual re-engaging on a new cell. Our study addressed these limitations by proposing a machine learning-enabled AFM operational framework to make the measurement process fast and save the effort and time of the experts. We proposed an AI-guided AFM navigation framework [29] that includes detection of different cell shapes (round, spindle, polygonal) and AFM stage motor controls for automated navigation of AFM cantilever tip during the AFM measurement (see Figure 3). Cell shape detection was performed using a deep learning model called YOLOv3 [69], yielding the coordinates of cell shapes of interest in the phase contrast images captured via the AFM stage camera. Those coordinates were used for intelligent navigation to the desired cell shape by regulating the AFM stage motors with navigation speed enhancement by 60
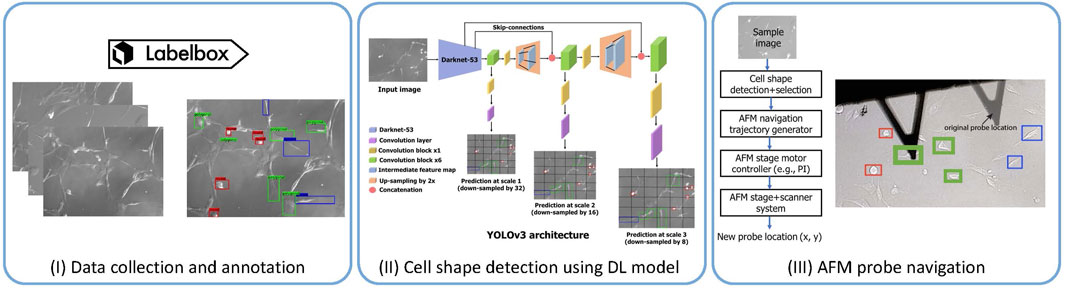
Figure 3. AFM probe navigation accelerated using deep learning model-based cell shape identification and localization [29]. (I) We collected 221 images using the camera system available in the AFM. We used the Labelbox platform to annotate 3 cell shapes: round (red boxes), spindle (blue boxes), and polygonal (green boxes). (II) We then fine-tune the widely used DL mode YOLOv3 [69] on the annotated data for cell shape detection. (III) The coordinates detected by the deep learning model are then fed into the AFM navigation control program to guide it to the target cell shape location.
2.2 Improving AFM scanning process
In addition to selecting important scanning sites for AFM, ML can be used to improve the scanning process itself. For example, the work proposed by Vekinis and Constantoudis [70] explains how an artificial neural network (ANN) can determine the impact of an improper geometrical design of the AFM tip on AFM measurements on a rough substrate. To predict the impact, they considered the parameters of the rough sample and the geometry of the AFM tip as input to the ANN. They trained a multi-layer perceptron (MLP), a fully connected style neural network. They compared the impact in terms of a “certainty map” that compared the height values of the simulated AFM image with the original images of the rough substrate. Input to the ANN was a 10-dimensional vector passed through 6 MLP layers with 10, 50, 100, 200, 100, and 50 neurons (number of units in each layer), respectively. The output was a scalar, which was predicted as a certainty metric. The ANN was trained using the ADAM optimizer with a learning rate 0.001 with a weight decay value of 0.001 to prevent the overfitting problem. The model was then trained for 1000 epochs using around 4.3K training samples, and testing was performed on 1.4K samples with the mean absolute percentage error as a loss function. It approximately converged to
Dynamic AFM [71] generates spatially detailed maps of the sample’s mechanical, chemical, and biological properties by indirectly assessing the tip-sample contact force. Analytical and experimental techniques are the two basic categories that correspond to reconstruction techniques in dynamic AFM. Even though they are flexible, analytical techniques can only measure the averaged interaction force, not the instantaneous variations that occur during oscillations. In contrast, experimental techniques either need to measure the experimental transfer function or use specialized harmonic probes. Chandrashekar et al. [72] utilized current data science and machine learning developments to create a unique technique for forecasting the tip-sample interaction forces of dynamic AFM. This technique can measure the elasticity of distinct components in the sample and focus on how much energy is lost during contact (see Figure 4). They demonstrated that their data-driven algorithm could estimate the tip-sample interaction forces on numerically generated data with 90% accuracy. The authors executed multiple experiments on stiffer polystyrene (PS) polymeric samples and softer low-density polyethylene (LDPE) samples with successful prediction of the nanoscale interaction forces with high resolution.
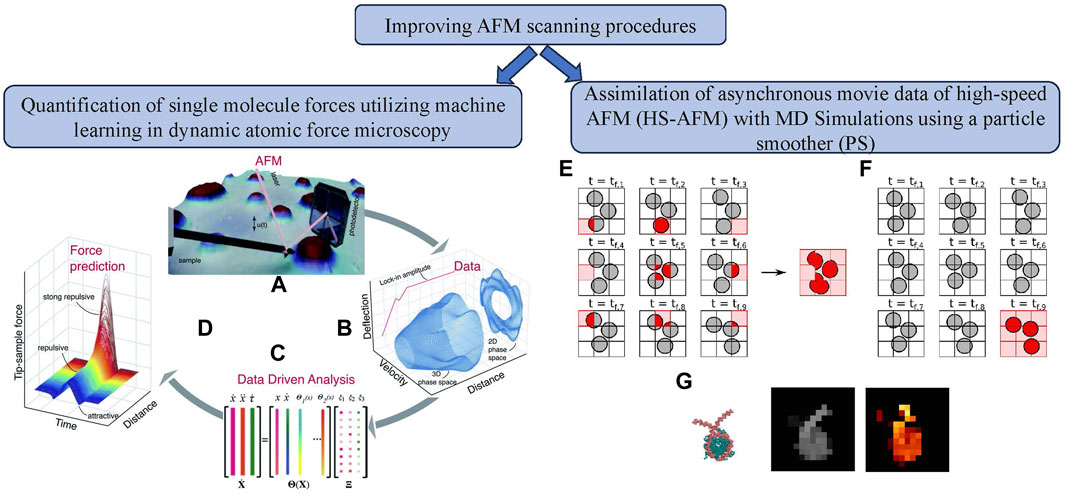
Figure 4. Improvement of AFM scanning process using machine learning approaches. (left) Quantification of single molecule forces utilizing machine learning in dynamic AFM: (A) Experimental data obtained directly from the AFM photodetector. (B) Data was processed via FPGA to create state vector channels. (C) State vectors were used in a sparse identification algorithm to model the system. (D) The model estimated the tip-sample interaction force [72]; (right) Assimilation of asynchronous movie data of high-speed AFM (HS-AFM) with MD simulations using a particle smoother (PS): (E) Asynchronous AFM data acquisition for moving objects on a 3
With a resolution of roughly 1 nm, high-speed atomic force microscopy (HS-AFM) [5, 73–75] is a helpful instrument for analyzing biomolecular structures and motions at close to their physiological settings. Its drawbacks include the difficulty of clearly seeing three-dimensional structures and the fuzziness of soft biomolecule pictures. To solve these difficulties, computational techniques like Bayesian data assimilation and particle filter simulations combined HS-AFM data with molecular dynamics simulations, addressing problems with molecular motion and data asynchronicity. Kato et al. [30] described the development of a particle smoother (PS) simulation approach (see Figure 4) that took time differences in HS-AFM movie data using the pixel-by-pixel (PBP) method into account. It was compared to a technique that ignored time differences (PS-AAO simulation). In locations with flexible linker DNAs, the PS-PBP approach reduced errors by handling data asynchronicity in HS-AFM measurements. The research found difficulties duplicating dynamic behavior, particularly when a significant molecular motion occurred during the probe scanning time. The study also examined the effect of re-sampling frequency on PS-PBP simulation performance, finding that higher frequencies, especially the 1F re-sampling frequency, produced better outcomes. The authors executed CG-MD simulations of a nucleosome. The simulations worked well with the genuine HS-AFM experimental data, especially for bigger biomolecular complexes.
The inherent components of AFM, including the probe, scanner, electronic circuits, and possible electromagnetic or mechanical noise or improper scanning parameters, can lead to distortion and artifacts in the AFM output. While post-processing filters are available to correct these distortions, it’s essential to comprehend the specific nature of the distortion or artifact to apply the necessary corrections effectively. Kocur et al. [76] presented the CNN-based approach, where the CNN learns from pairs of distorted images and the ground truth image to either remove or suppress the artifacts and produce the filtered image autonomously (without any prerequisite information about the distortions or any other human knowledge). Kocur et al. [76] used ResU-Net [77] architecture for the CNN and trained on the synthetic data. The AFM, LiteScope, was used to analyze the materials. It was designed to work with Scanning Electron Microscopy (SEM) because of its distinctive probe detection method, which combines self-actuating and self-sensing probes. Furthermore, the Akiyama probe [78] was used to obtain topographical information. Synthetic data was utilized for the network to overcome the difficulties associated with acquiring actual AFM training data. A novel dataset was also introduced, and the code has been made openly available to strengthen the method’s reliability in preserving topographical details while mitigating distortions and noise.
2.3 Improving AFM data analysis
There is a significant body of work in leveraging different ML techniques to improve AFM data analysis in terms of both analysis of AFM images as well as AFM force curves. Here, we review some of the major studies in this regard.
2.3.1 Improving AFM image analysis
We have summarized the articles referenced in this section in Table 1 for efficient and easy understanding.
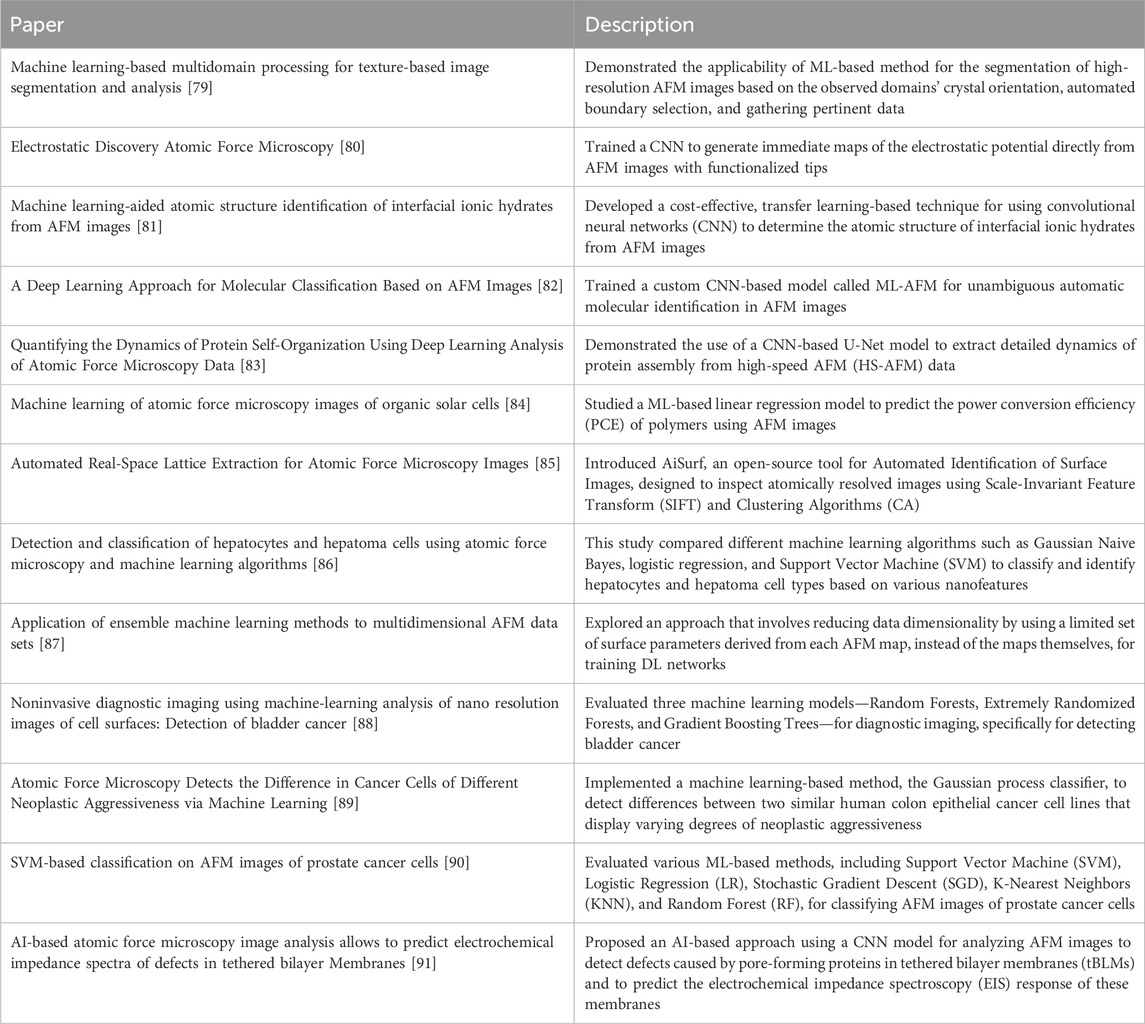
Table 1. Overview of different papers on improving AFM image analysis.
We begin with the study presented in Borodinov et al. [79], where the authors introduced a multidomain processing technique based on machine learning and applied it to segment atomically and molecularly resolved atomic force microscopy (AFM) images. This study used tapping mode for AFM imaging of melem on boron nitride and ionic liquid layers constructed on top of graphite as benchmarks for the algorithm. The authors developed a supervised three-step method that was easily adaptable to the characteristics of various images or data sets, even with high noise levels. The steps were to extract structural descriptors from a picture, use dimensionality reduction algorithms, assign pixels to an image, and compute pertinent statistics. This work proposed a robust and scalable method for segmenting AFM images based on pre-selected classification criteria. This study demonstrated the applicability of this method for the segmentation of high-resolution AFM images based on the observed domains’ crystal orientation, automated boundary selection, and gathering pertinent data.
In another study by Oinonen et al. [80], a machine-learning method was developed to accurately forecast electrostatic fields from a collection of typical experimental AFM images. Numerous processes, including catalysis, chemical reactions, and biological activities, heavily rely on the electrostatic characteristics of nanoparticles. Understanding the relationship between molecular functionality and electrostatics provides significant tools for controlling and precisely designing functionality at the nanoscale. High-resolution local potential maps of molecules adsorbed on surfaces were generated using Kelvin probe force microscopy (KPFM). A convolutional neural network (CNN) was used as the foundation for the ED-AFM (Electrostatic Discovery-Atomic Force Microscopy) approach (see Figure 5). This network was trained to connect input from a collection of constant-height AFM images. This approach used only simulated data to evaluate three molecular systems. ED-AFM is an effective instrument for comprehending the characteristics of molecules. The electrostatic (ES) Map descriptor, the vertical component of the electrostatic field over the sample molecule, was translated by the neural network using two sets of AFM pictures as input. For the model’s training, they used a database of tens of thousands of molecular geometries to construct simulated sets of input-output pairings. The trained model can then estimate the sample electric field using experimental AFM images. The CNN architecture used in this work was called Attention-U-Net, which utilized an attention-gate (AG) block in the skip connections. The input to the network was
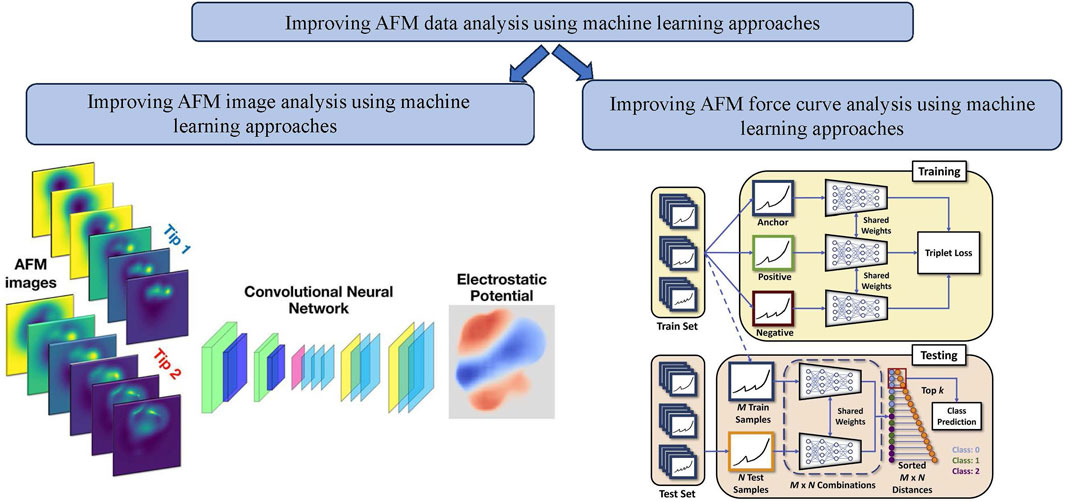
Figure 5. Improvement of AFM data analysis using machine learning approaches: (left) example of improvement of AFM image analysis using machine learning approaches example: a machine learning based method that yields immediate maps of the electrostatic potential directly from atomic force microscopy images with functionalized tips [80]; (right) example of improvement of AFM force curve analysis using machine learning approaches example: Schematic of the few-shot learning algorithm using triplet loss for training AFM force curves [92].
Understanding the different exceptional physical and chemical characteristics of the ionic/solid interface depends on identifying the structural details of ionic hydrates at the atomic level. Identifying hydrogens from AFM images is difficult since they are scarcely discernible. Tang et al. [81] described a transfer learning-based cost-effective technique for determining the atomic structure of interfacial ionic hydrates from AFM images. The neural network (NN) was trained to extract the H-bond network structure information from AFM height images. After that, it was retrained using transfer learning on a modest amount of expensive interfacial Na + hydrates data to achieve effective structural identification. The retrained NN prediction was with an accuracy of 95% for sodium and oxygen and 85% for hydrogen. The authors implemented the 3D U-Net architecture of CNN, popularly used for biomedical image segmentation and various computer vision tasks. It consists of an encoder-decoder part with skip connections going from encoder to decoder for better output representation quality. The network input was a stack of 10 AFM images at different tip-sample distances with the resolution of
Molecular identification based on only AFM images is a challenging problem because of ambiguity of AFM images for different molecules with similar shapes but with different atoms. Carracedo-Cosme et al. [82] proposed to use deep learning-based approach for automatic molecular classification of AFM images. This study used SPMTH-60 datatset (consists of a lot of theoretical constant-height AFM images built from 60 selected flat organic molecules), adding more variability for different molecular orientations. In total, they simulated 483,840 images. With this big dataset, authors initially experimented with two of the prominent DL-based image classification architectures: MobileNetV2 [94] and VGG16 [95]. They observed that these standard models did not perform well and led to overfitting problem. To tackle this challenge, they introduced the ML-AFM model, consisting of convolutional, pooling, dropout, flattening, and fully connected layers. They employed various strategies, including optimizing the number of convolutional layers and filters using concatenation to create alternative paths between input and output layers, integrating dropout layers, and applying regularization within convolutional layers. These strategies collectively enhanced the model’s performance and flexibility on theoretical dataset but does not perform well on the experimental AFM images. For this, they proposed to use the variational autoencoder (VAE) to augment the training dataset to include the images with the similar features as experimental images. With this augmented data, the accuracy on experimental images improved significantly.
The work by Ziatdinov et al. [83] highlights the effectiveness of a deep learning-based workflow in converting high-speed atomic force microscopy (HS-AFM) data into a comprehensive map of time-dependent particle positions and orientations. This, in turn, facilitated the reconstruction of classical two-point correlation-based descriptors like 2D fast Fourier transforms (FFT), correlation functions, and pair distribution functions. Leveraging principal component analysis and non-negative matrix factorization (NMF), this study further explored the dynamic evolution from metastable states toward equilibrium. Additionally, machine learning-based feature extraction was crucial in defining particle neighborhoods and trajectories without imposing physics constraints. This approach enabled the separation of various particle behavior classes and the identification of associated transition probabilities, slow modes, and configurations. As a result, it promoted systematic exploration and predictive modeling of the temporal dynamics of the system. These findings had significant implications for both the analysis of HS-AFM data related to protein self-assembly and the development of a quantitative understanding of the underlying energy landscapes governing this process. Notably, abundant proteins within a single frame offered a robust dataset for training neural networks. Extracted particle descriptors provided insights into individual and collective properties, including positional and angular trajectories, configuration distributions, and transitions between metastable and stable orientations.
Kobayashi et al. [84] highlighted a notable gap in the application of machine learning to enhance the performance of organic photovoltaics (OPVs) related to bulk heterojunction structures. The study investigated the potential of atomic force microscopy (AFM) images as a key input for an ML model for predicting power conversion efficiency (PCE) in polymer: non-fullerene molecular acceptor OPVs. The authors collected AFM images, conducted data preprocessing, and executed a range of image analyses and ML linear regression techniques. Surprisingly, the study revealed that augmenting the model with AFM data alongside chemical structure fingerprints, material properties, and process parameters did not significantly improve accuracy. Furthermore, the application of gray-level co-occurrence matrix (GLCM) and histogram analysis (HA) methods, encompassing parameters like homogeneity, correlation, and skewness, demonstrated the potential for expanding the horizons of image analysis and artificial intelligence within the realm of materials science research. This study demonstrated the importance of addressing bulk heterojunction structures with the ML-driven optimization of OPVs and suggested promising avenues for AI-based approaches in materials science.
More recently, Corrias et al. [85] introduced an open-source tool, AiSurf, developed for automated analysis of atomically resolved images in atomic force microscopy (AFM). The tool extracted unit cells, structural distortions, and primitive lattice vectors from the images utilizing scale-invariant feature transform (SIFT) and algorithms for clustering with minimal to no user interaction. As a filter, a difference of Gaussians was used to preprocess the images before applying SIFT, which acted as a Fourier domain bandpass filter to avoid lower frequency background variations and higher frequency noise. The AiSurf tool was tested on different substrates with atomically resolved AFM images, including oxygen-deficient rutile
There has also been significant progress in the context of Bio-AFM image analysis and enhancement using machine learning. For example, Zeng et al. [86] proposed a novel approach using multidimensional cell parameters extracted by AFM and machine learning to identify human hepatocytes and hepatoma cells simultaneously. This study used Atomic Force Microscopy (AFM) to analyze the nanofeatures of three different cell lines: normal human hepatic cells (HL-7702), hepatocellular carcinoma cells (SMMC-7721), and Hep G2 cells. The AFM height images revealed that cancer cells were shorter compared to normal human cells, with distinct pseudopodia on the edges. The elastic modulus at the center of cancer cells was smaller than at the edges. However, the differences in these features were not significant, making it challenging to distinguish between cell types based on a single nanoscale parameter. Statistical analysis of the nanofeatures showed overlapping parameter distributions, making it challenging to classify cells accurately using traditional statistical methods. So, this study employed machine learning algorithms, including Gaussian Naive Bayes [96], logistic regression [97], and Support Vector Machine (SVM) [98], to classify and identify cell types based on multiple nanofeatures to overcome these traditional limitations. Among these algorithms, Gaussian Naive Bayes achieved the highest accuracy of
Multiple physical channels, for example, height, adhesion, viscoelastic losses, stiffness, deformation, etc., can be captured simultaneously during AFM measurements. However, collecting such multidimensional AFM data sets of soft biomolecules, live cells, or tissues could be challenging. Dokukin and Dokukina [87] suggested an innovative, generalized method for reducing the number of dimensions in AFM data when only a few parameters were derived from each AFM map during quantitative nanomechanical mapping [99]. In this study, various types of data were gathered from live cells, and there were a few options for handling training set size. The first option involved rotating and flipping a single-tagged sample image to increase the number of effective samples. The second option involved the usage of the transfer learning technique in reusing models that have already been trained for a base function. However, both approaches could have been more helpful in analyzing AFM data. The dimensionality of data space was significantly decreased by implementing multiple parameters calculated for every AFM map, preventing issues related to applying deep learning techniques. They reduced the dimensionality of AFM data by maintaining a fixed set of parameters with the lowest inter-parameter correlation and the highest segregation power. Machine learning algorithms like Random Forest, which is robust for overfitting, were then utilized, and these algorithms were almost independent of data splitting as a training and testing set. The authors successfully evaluated the performance of this algorithm to detect bladder cancer by using the cells from urine samples. This study achieved the highest accuracy, up to 94%, using 5-cell samples per patient.
Similarly, Sokolov et al. [88] also explored detecting bladder cancer using AFM and ML. Bladder cancer is among the most common cancers and one of the main reasons for cancer-related fatalities. Cystoscopy, tumor excision, and biopsy are the gold standard for diagnosis. Patients’ participation in screening and early detection evaluation programs will increase significantly with the development of low-cost, accurate, effective, and noninvasive tests. A strategy for finding cancer via imaging of bodily fluids—in this case, urine—was described by Sokolov et al. [88]. They used sub-resonant tapping AFM methods for imaging cell surfaces (Peak Force and Ringing mode [100]). The AFM Ringing imaging mode is substantially faster (P
In another similar work, Prasad et al. [89] demonstrated the detection of bladder cancer cells extracted from urine samples using AFM adhesion maps. AFM allows visualizing these cell surfaces at the nanoscale level, and AFM imaging of fixed cells can be used to detect all stages of progression toward cancer. This study distinguished between 2 cell lines by analyzing cellular mechanics. It recovered all three physical metrics, such as equilibrium length of the pericellular coat, effective grafting density, and Young’s modulus of the pericellular coat molecules, by indenting cells with an AFM probe. Combining all these physical parameters, the authors could differentiate between HT29 and Csk cells with 94% accuracy. Ringing mode (RM) [100] of AFM allowed physical property mapping of sample surfaces with higher resolution and speed, leveraging advanced processing of the dynamic response of the cantilever post AFM-probe withdrawal. In this investigation, three unique RM channels were measured in addition to the standard height and adhesion channels: RM adhesion, RM restored adhesion, and RM viscoelastic adhesion. They used the Gaussian process classifier for the classification task using RBF kernel [101] and Laplace approximation, and the maximum number of iterations was set to 500. To overcome the issue of acquiring a large number of AFM images and the dimensionality of data space, they reduced each channel of AFM data to 35 surface parameters. They further reduced the number of surface parameters based on the Gini index [102] ranking. The dataset was divided into training and verification (testing) subsets to measure classification accuracy. The addition of RM channels in the classifier improves the accuracy to 94%.
In another cancer detection application, Yu et al. [90] demonstrated a method that combined atomic force microscopy (AFM) imaging with machine learning to identify prostate cancer cells with higher accuracy. The authors used a support vector machine (SVM) [98] for classification and compared it with other classifiers such as stochastic gradient descent (SGD) [103], random forest (RF) [104], and logistic regression (LR) [97], as well as K-nearest neighbors (KNN) [105]. They used an open-source software known as Gwyddion for image processing and the BorutaShap algorithm for feature selection of the final 18 datasets to reduce the dimensionality of data and improve the classification performance of most classifiers. A comparison of four classifiers on the prostate cancer dataset showed that SVM provided the highest accuracy of
Another recent study performed by Raila et al. [91] explored AI-based AFM image analysis for defect detection caused by pore-forming proteins in tethered bilayer membranes (tBLMs) and predicted the electrochemical impedance spectroscopy (EIS) response of such membranes. For defect detection, the authors used convolutional neural network (CNN) architecture called SSD FPN [106], popularly used for object detection tasks. To use this CNN model for defect detection in AFM images, the authors re-trained the model with 15 AFM images consisting of 510 annotated defects. Although the model was trained using a minimal number of images, it was observed that the AI-based prediction of EIS curves matched with manually derived EIS curves. Furthermore, this study demonstrated that employing an automated AI-based algorithm for AFM image analysis enables the generation of EIS spectra predictions. These predictions can serve as valuable tools for evaluating critical physical parameters of tBLMs, including submembrane-specific resistance.
2.3.2 Improving AFM force curve analysis
Compared to ML-enabled analysis of AFM images, the use of ML in analyzing AFM force measurements is a lesser-explored area. However, many opportunities remain, as evidenced by the studies reviewed here. For example, Müller et al. [107] presented a machine learning approach (Python package - nanite) that provided a fully controlled evaluation of biological force-distance (FD) data. In this work, AFM is used to evaluate the mechanical characteristics of individual cells from spinal cord sections of zebrafish. In this regard, preprocessing and fitting force-distance (FD) curves are tedious tasks and require specialists to go through large data sets. This study used ML (specifically, neural networks) to reduce human effort in such tasks. In addition, artifacts seen in nano-indentation studies are typically removed from the analysis manually. However, this process is also tedious for densely sampled FD maps of cell segments. This research presented an innovative approach for automating AFM FD data quality assessment. To assess the quality of AFM FD data, they proposed to use supervised learning that used quality-dependent features, three of which were binary features used for preprocessing and an additional twelve features used for training. They fitted the experimental FD curves with an appropriate model function to generate the data to train the regressor model. They manually rated them, generating around 1132 FD curves from zebrafish spinal cord sections. They extensively compared by training regression models such as the Decision Tree regressor, the linear Support Vector-machine regressor (SVR), AdaBoost, Random Forest, Gradient Tree Boosting, and Extra Trees. They used MSE to compare the performance and observed that the Extra Trees regressor [108] gave the best MSE value, below 1.0, and obtained an accuracy of 87.4%.
One of the critical issues in deploying (advanced) ML tools for AFM FD data is the lack of large data sets for specific problems. In one of our recent works [92], we addressed this problem by building a few-shot learning-based framework for AFM force curve characterization in single-molecule interactions. In measuring single molecule interaction forces and binding kinetics for protein-protein interactions or ligand-receptor interactions, ligand and receptor are attached to the AFM cantilever tip and substrate, respectively, or vice versa. Usually, in AFM force measurement studies, a ligand-functionalized cantilever is brought near the live cells with complementary receptors or functionalized substrates so that the ligand can bind to the receptor. The minimum force needed to break the bond is measured as the unbinding or rupture force. Currently, experimentalists analyze thousands of force curves manually to identify four different types of rupture events: single, double, multiple, and no rupture events (see Figure 6, which is time-consuming. However, building an extensive, annotated data set to train supervised DL models can be difficult. So, we explored sample-efficient deep learning (DL) approaches. It is suitable to do baseline corrections on AFM force curves to highlight the spikes in the data, making the learning of the DL model easier. We introduced a few-shot DL approach for the classification of these force curves (see Figure 6) automatically to prevent the wastage of significant expert effort and time.
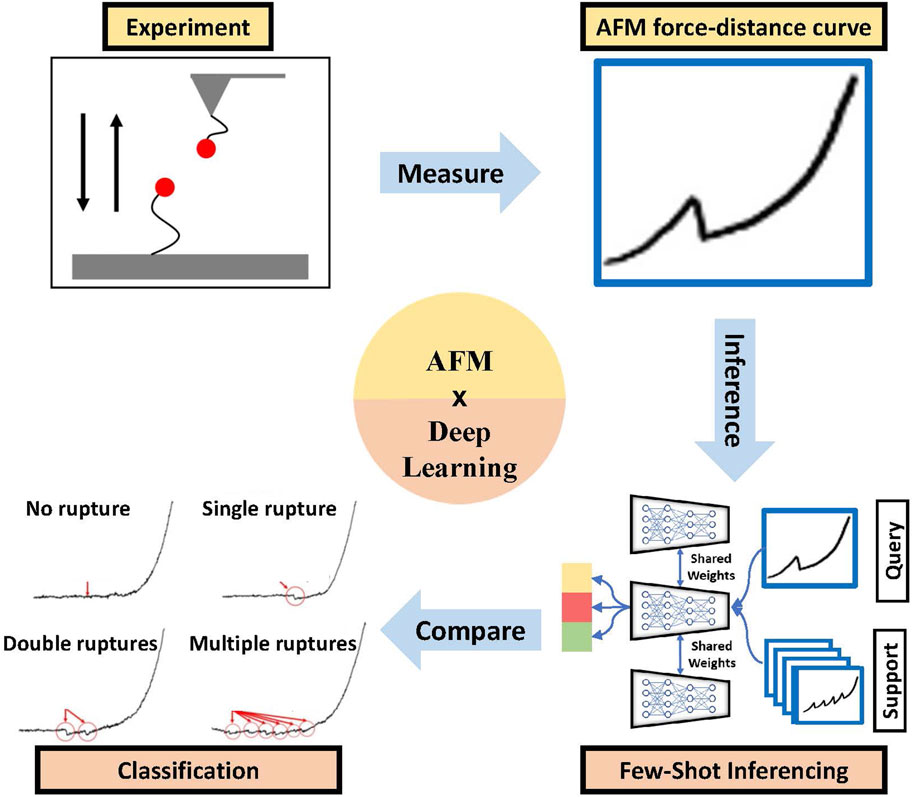
Figure 6. Efficient AFM force curve characterization (red arrows and circles show the no rupture, single rupture, two ruptures, and multiple ruptures in the curve) using the few-shot deep learning method [92].
Similar to the studies for bladder cancer detection using AFM imaging discussed earlier, Zhu et al. [109] introduced the idea of using AFM to measure cellular mechanical properties (CMPs) as potential indicators, intending to improve the accuracy of detecting malignant cells in bladder cancer cases. The study mainly aimed to group urothelial tumor cells into four distinct grades of bladder carcinoma cells (G1, G2, G3, and G4) based on their CMPs using machine learning classification algorithms. The AFM indentation technique was used to generate FD curves, from which various CMPs such as elastic modulus, work of adhesion (WoA), cellular membrane tension (CMT), and adhesiveness were extracted. Only FD curves closely matching a theoretical model with a coefficient of determination (R2) exceeding 0.85 were considered for analysis. Laser scanning confocal microscopy (LSCM) and immunofluorescence were employed to visualize and study cellular components like F-actin and cellular nuclei. This research utilized a Genetic Algorithm-Back Propagation Neural Network (GA-BPNN) model to classify bladder carcinoma cells into four grades based on their CMPs. The model was trained using
Finally, we discuss another ML-based AFM force curve analysis work where Weber et al. [110] proposed an unsupervised artificial neural network using self-organizing maps (SOMs) to analyze the mechanical properties of breast cancer cells obtained using AFM. Various substances that impact estrogen receptor signaling were used in the measurement. The overall methodology involved estimating stress relaxation (from force vs distance and force vs time curves) by AFM to calculate the mechanical characteristics of the cells and then fitting a five-element Maxwell model to the stress relaxation curves. The input data for the system consisted of nine properties determined by the stress relaxation fitting sections, which were
2.4 Virtual AFM
Finally, in this section, we review how researchers have begun to combine ML approaches with AFM to build virtual AFM simulations. Virtual AFM (Atomic Force Microscopy) refers to simulation or computational models that mimic the operation and results of an actual atomic force microscope. This technology allows researchers and students to understand and predict how an AFM would interact with various samples without physically conducting the experiments. Virtual AFM tools are used for educational purposes, to train users on the intricacies of AFM operations, and for experimental planning, allowing scientists to simulate outcomes before actual laboratory testing. This can save significant time and resources and enhance the understanding of potential results and experimental errors. Additionally, virtual AFM can generate extensive data sets useful for training ML and DL algorithms. Such platforms can help alleviate various scale-up issues related to AFM, as it is typically a slow and low-throughput platform.
We begin our discussion with Alldritt et al. [111], where the authors developed a deep learning framework to predict molecular structures and automated structure discovery. This ML infrastructure matched a set of AFM images using a unique descriptor to characterize the molecular configuration. AFM is an outstanding platform to probe the atomic structure of organic substrates at a single molecule level. However, many previous studies were restricted to mostly planar aromatic molecular structures due to several obstacles in interpreting distorted AFM images of nonplanar molecules. Multiple adsorption configurations of 1S-camphor on Cu (111) dependent on AFM measurements at low temperatures were resolved using this method. The variation of resonant frequency was the measured signal in CO-AFM. This signal was caused by all significant tip-sample interactions and determined by the interaction of the nearest atom of the substrate to the AFM cantilever tip and oxygen of the CO molecule. This study described a method to invert the imaging process and directly produce coordinates of specific atoms from a collection of AFM height images (see Figure 7). A CO molecule linked to a metal tip was used in low-temperature ultrahigh vacuum AFM to capture high-resolution images of molecules on surfaces. Bond order, charge distributions, and the different stages of on-surface chemical reactions can all be studied using this method. In this study, the virtual synthesis of 3D AFM data from 134,000 isolated molecules was performed to identify the molecular geometry of any experimental image. This study proposed a CNN architecture implemented as an encoder-decoder style framework to solve the inverse imaging problem. The input to the CNN was the 3D stack of 10
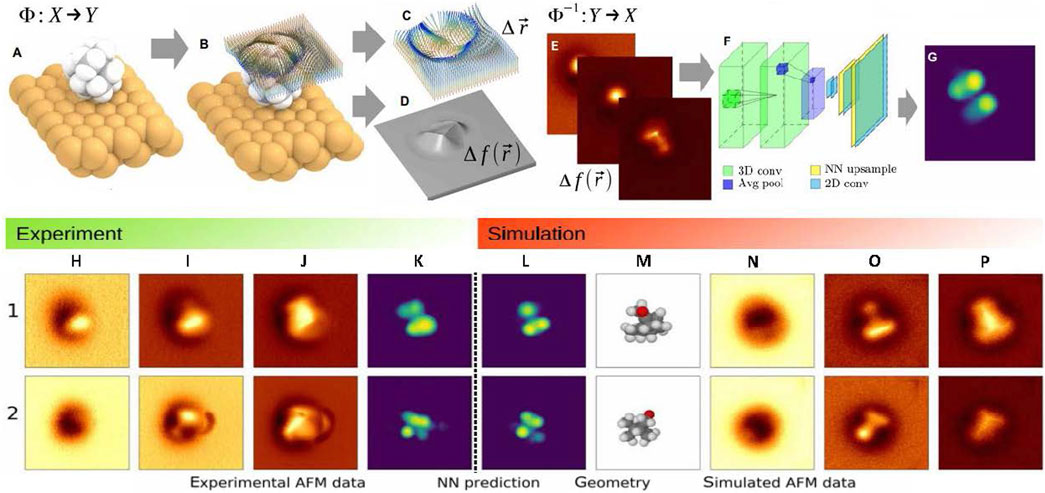
Figure 7. Simplified demonstration of CO-tip AFM imaging process and inverse imaging process from [111]: (A) molecular geometry X; (B) Displacement of a probe particle (PP) because of the interactions with sample atoms; (C) Relaxed PP integrates forces along its path, which leads to shifts in the measured oscillation frequency, shown in (D). (E) Approximation to a molecular geometry: vdW-spheres, from sample atomic structures and in accord with 3D AFM height images, shown in (G) at various vertical positions; (F) NN as an effective fitting scheme. (H–K) Experiment: The CNN model receives the 3D experimental image set ((H) far, (I) middle, (J) close tip-sample distances) and predicts (K) 2D image (vdW-Spheres) using this information. (L–P) Simulation: The complete molecular structure (M) produced by the best match to the experiment corresponds to the vdW-Spheres representation rendering (L). Inverse image processing predicts AFM images ((N) far, (O) middle, (P) close) of 1S-camphor adsorption on Cu(111).
As discussed, AFM imaging captures the surface topography of the sample under consideration, such as bio-molecules. It outputs the image of the sample’s height map lying on the AFM bed. Molecules of the sample adhere to the AFM bed in random orientation, capturing the height map of the sample in different orientations and giving different views of the sample. This information can be crucial in the problem of determining the 3D structure of bio-molecules such as proteins by combining these multi-view height maps. Although reconstructing the 3D structure of a protein from multi-view AFM images is a non-trivial task, in Rade et al. [32], we proposed to leverage the deep learning methods for this 3D reconstruction task. Training a DL model demands a large data set of AFM images of different proteins, and capturing AFM images for a large number of proteins is a non-pragmatic task. To overcome this, we developed the concept of virtual AFM, a GPU-accelerated volume rendering technique [112] to generate virtual AFM images for the proteins, illustrated in Figure 8. Similar to actual AFM images, these virtual images give the height map of the proteins. With this, the dataset of virtual AFM images for a large number of proteins can be constructed, which can further be used to train the DL models for predicting the 3D structure of proteins.
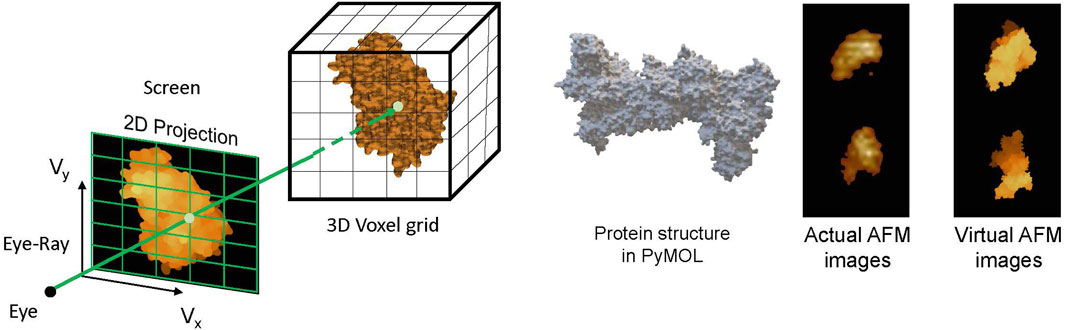
Figure 8. (left) Volume rendering of 3D voxelized protein structure to obtain AFM-like 2D images. (right) Comparing the virtual and actual AFM images [32].
AFM is well-known for its remarkable atomic-level resolution. However, its operation demands meticulous parameter configuration and operator proficiency, posing a significant challenge. Traditional simulation platforms fail to comprehensively visualize and analyze AFM operations. In response to this challenge, Yang et al. [113] introduced an innovative approach that combines machine learning and virtual reality to replicate the predictive imaging process of AFM in contact mode using the Unity3D platform. This involved utilizing a standard grating as the experimental sample and creating a virtual representation of the AFM probe and optical system. The imaging prediction process revolved around adjusting optical spot positions to account for probe undulations, thereby enabling the prediction of sample topography. Furthermore, the research encompassed data collection, calibration, and correlation tests strengthening the connection between RGB components and the scan data from the virtual system. A range of machine learning algorithms, including XgBoost, Random Forest, AdaBoost, GBDT, CatBoost, and KNN, were employed to construct these predictive models. Among these, XgBoost is the most promising choice due to its optimal balance between accuracy and computational efficiency. The evaluation of the predictive models employed the Structural Similarity Index (SSIM) to gauge the likeness between predicted and actual topographical maps. Notably, CatBoost exhibits superior performance compared to other models in this context.
3 Discussion
This paper presents an overview of ML and AI applications in advancing AFM. We articulate how AI can enhance the performance of AFM in imaging and manipulating various samples, such as biological molecules, material interfaces, and nanoscale structures. We also highlight recent studies implementing machine-learning approaches in AFM for data post-processing and on-the-fly feedback. For example, we review how AI can help segment and classify AFM images, optimize the scanning parameters and tip-sample interactions, reconstruct and correct AFM images, and extract and analyze relevant features and properties from AFM data. The paper also discusses the challenges and opportunities of using AI/ML in AFM, such as improving the accuracy, speed, and reliability of AFM measurements, overcoming the limitations of human operators, and enabling new functionalities and capabilities of AFM. For instance, we review how AI can assist in performing high-resolution and high-speed AFM imaging, control and manipulate single molecules and atoms with AFM, perform multimodal and multifunctional AFM measurements, and discover new phenomena and insights with AFM.
The results from the previous studies summarized in this paper indicate that incorporating ML/AI approaches before, during, and after AFM operation has been extremely helpful in making AFM comparatively high-throughput and efficient. Although significant improvements have been demonstrated in all these studies, there are still opportunities to improve in multiple categories. Machine learning enhanced AFM can become substantially high-throughput if more exploration can be done in the following areas: a) AFM sample or scanning site (important features or region of interest) selection and improving the AFM scanning process in a closed-loop manner with feedback from human experimentalists, b) application of auto-navigation of AFM on soft biological samples especially live cells as well as optimization of sample-specific loading forces, protecting both cantilever tip and samples, (c) high-fidelity 3D reconstruction from AFM images, and (d) fusion of multimodal AFM measurements (height sensor images, peak force error images, nanomechanical property maps, and force curves). Finally, the recent success of virtual AFM frameworks shows the promise of building a comprehensive AI-based digital twin framework for AFM by accurately modeling and characterizing the interactions of the AFM probe with the surface. If successful, such digital twins can be used for various applications, including providing decision support to experimentalists, accelerated data analysis, enhancement and characterization, large-scale synthetic AFM data generation, and designing effective AFM controllers for ultra-precision, high-quality measurements.
Author contributions
NM: Investigation, Writing–original draft, Writing–review and editing. JR: Investigation, Writing–original draft, Writing–review and editing. MH: Investigation, Writing–original draft. AK: Funding acquisition, Supervision, Writing–review and editing. AS: Conceptualization, Funding acquisition, Investigation, Supervision, Visualization, Writing–original draft, Writing–review and editing.
Funding
The author(s) declare that financial support was received for the research, authorship, and/or publication of this article. This work was supported by the National Science Foundation (NSF) under grants DMREF-2323715/2323716 (AK) and CPS-2409359 (AS, AK), the ISU College of Engineering Exploratory Research Program (AS, AK) grant, and Translational AI center, ISU SEED grant (AS, AK).
Acknowledgments
We would like to acknowledge Prof. Soumik Sarkar (Department of Mechanical Engineering, Iowa State University) for providing his guidance and valuable feedback on this review article.
Conflict of interest
The authors declare that the research was conducted in the absence of any commercial or financial relationships that could be construed as a potential conflict of interest.
Publisher’s note
All claims expressed in this article are solely those of the authors and do not necessarily represent those of their affiliated organizations, or those of the publisher, the editors and the reviewers. Any product that may be evaluated in this article, or claim that may be made by its manufacturer, is not guaranteed or endorsed by the publisher.
References
1. Gaczynska M, Osmulski PA. Afm of biological complexes: what can we learn? Curr Opin Colloid and Interf Sci (2008) 13:351–67. doi:10.1016/j.cocis.2008.01.004
2. Muller DJ. Afm: a nanotool in membrane biology. Biochemistry (2008) 47:7986–98. doi:10.1021/bi800753x
3. Binnig G, Rohrer H. Scanning tunneling microscopy. Surf Sci (1983) 126:236–44. doi:10.1016/0039-6028(83)90716-1
4. Chen X, Hu D, Mescall R, You G, Basov D, Dai Q, et al. Modern scattering-type scanning near-field optical microscopy for advanced material research. Adv Mater (2019) 31:1804774. doi:10.1002/adma.201804774
5. Ando T, Uchihashi T, Kodera N, Yamamoto D, Miyagi A, Taniguchi M, et al. High-speed afm and nano-visualization of biomolecular processes. Pflügers Archiv-European J Physiol (2008) 456:211–25. doi:10.1007/s00424-007-0406-0
6. Goldsbury CS, Scheuring S, Kreplak L. Introduction to atomic force microscopy (afm) in biology. Curr Protoc Protein Sci (2009) 58:1–19. doi:10.1002/0471140864.ps1707s58
7. Jones PH, Maragò OM, Volpe G. Optical tweezers: principles and applications. Cambridge University Press (2015).
8. Moffitt JR, Chemla YR, Smith SB, Bustamante C. Recent advances in optical tweezers. Annu Rev Biochem (2008) 77:205–28. doi:10.1146/annurev.biochem.77.043007.090225
9. De Vlaminck I, Dekker C. Recent advances in magnetic tweezers. Annu Rev Biophys (2012) 41:453–72. doi:10.1146/annurev-biophys-122311-100544
10. Tanase M, Biais N, Sheetz M. Magnetic tweezers in cell biology. Methods Cel Biol (2007) 83:473–93. doi:10.1016/S0091-679X(07)83020-2
11. Jones SK, Sarkar A, Feldmann DP, Hoffmann P, Merkel OM. Revisiting the value of competition assays in folate receptor-mediated drug delivery. Biomaterials (2017) 138:35–45. doi:10.1016/j.biomaterials.2017.05.034
12. Mayyas E, Bernardo M, Runyan L, Sohail A, Subba-Rao V, Pantea M, et al. Dissociation kinetics of an enzyme-inhibitor system using single-molecule force measurements. Biomacromolecules (2010) 11:3352–8. doi:10.1021/bm100844x
13. Burnham NA, Colton RJ. Measuring the nanomechanical properties and surface forces of materials using an atomic force microscope. J Vacuum Sci and Technology A: Vacuum, Surf Films (1989) 7:2906–13. doi:10.1116/1.576168
14. Kurland NE, Drira Z, Yadavalli VK. Measurement of nanomechanical properties of biomolecules using atomic force microscopy. Micron (2012) 43:116–28. doi:10.1016/j.micron.2011.07.017
15. Dufrêne YF. Atomic force microscopy, a powerful tool in microbiology. J Bacteriol (2002) 184:5205–13. doi:10.1128/jb.184.19.5205-5213.2002
17. Giessibl FJ. Advances in atomic force microscopy. Rev Mod Phys (2003) 75:949–83. doi:10.1103/revmodphys.75.949
18. Meyer E. Atomic force microscopy. Prog Surf Sci (1992) 41:3–49. doi:10.1016/0079-6816(92)90009-7
19. Biosensing. Characterization of biosensors, and improved drug delivery approaches using atomic force microscopy: a review. Front Nanotechnology (2022) 3:798928. doi:10.3389/fnano.2021.798928
20. Krohs F, Haenssler OC, Bartenwerfer M, Fatikow S. Atomic force microscopy for high resolution sidewall scans. In: 2014 international conference on manipulation, manufacturing and measurement on the nanoscale (3M-NANO). IEEE (2014). p. 276–9.
21. Pellegrino P, Farella I, Cascione M, De Matteis V, Bramanti AP, Della Torre A, et al. Investigation of the effects of pulse-atomic force nanolithography parameters on 2.5 d nanostructures’ morphology. Nanomaterials (2022) 12:4421. doi:10.3390/nano12244421
22. Lostao A, Lim K, Pallarés MC, Ptak A, Marcuello C. Recent advances in sensing the inter-biomolecular interactions at the nanoscale–a comprehensive review of afm-based force spectroscopy. Int J Biol macromolecules (2023) 238:124089. doi:10.1016/j.ijbiomac.2023.124089
23. Jobst MA, Schoeler C, Malinowska K, Nash MA. Investigating receptor-ligand systems of the cellulosome with afm-based single-molecule force spectroscopy. JoVE (Journal of Visualized Experiments) (2013):e50950. doi:10.3791/50950
24. Merkel R, Nassoy P, Leung A, Ritchie K, Evans E. Energy landscapes of receptor–ligand bonds explored with dynamic force spectroscopy. Nature (1999) 397:50–3. doi:10.1038/16219
25. Rajan VS, Laurent VM, Verdier C, Duperray A. Unraveling the receptor-ligand interactions between bladder cancer cells and the endothelium using afm. Biophysical J (2017) 112:1246–57. doi:10.1016/j.bpj.2017.01.033
26. Kada G, Kienberger F, Hinterdorfer P. Atomic force microscopy in bionanotechnology. Nano Today (2008) 3:12–9. doi:10.1016/s1748-0132(08)70011-2
27. Cappella B, Dietler G. Force-distance curves by atomic force microscopy. Surf Sci Rep (1999) 34:1–104. doi:10.1016/s0167-5729(99)00003-5
28. Sarkar A, Sohail A, Dong J, Prunotto M, Shinki K, Fridman R, et al. Live cell measurements of interaction forces and binding kinetics between discoidin domain receptor 1 (ddr1) and collagen i with atomic force microscopy. Biochim Biophys Acta (BBA)-General Subjects (2019) 1863:129402. doi:10.1016/j.bbagen.2019.07.011
29. Rade J, Zhang J, Sarkar S, Krishnamurthy A, Ren J, Sarkar A. Deep learning for live cell shape detection and automated afm navigation. Bioengineering (2022) 9:522. doi:10.3390/bioengineering9100522
30. Kato S, Takada S, Fuchigami S. Particle smoother to assimilate asynchronous movie data of high-speed afm with md simulations. J Chem Theor Comput (2023) 19:4678–88. doi:10.1021/acs.jctc.2c01268
31. Tang B, Song Y, Qin M, Tian Y, Wu ZW, Jiang Y, et al. Machine learning-aided atomic structure identification of interfacial ionic hydrates from afm images. Natl Sci Rev (2023) 10:nwac282. doi:10.1093/nsr/nwac282
32. Rade J, Sarkar S, Sarkar A, Krishnamurthy A. 3d reconstruction of protein complex structures using synthesized multi-view afm images. arXiv preprint arXiv:2211.14662 (2022). doi:10.48550/arXiv.2211.14662
33. Butt HJ, Cappella B, Kappl M. Force measurements with the atomic force microscope: technique, interpretation and applications. Surf Sci Rep (2005) 59:1–152. doi:10.1016/j.surfrep.2005.08.003
34. Rubio-Sierra FJ, Heckl WM, Stark RW. Nanomanipulation by atomic force microscopy. Adv Eng Mater (2005) 7:193–6. doi:10.1002/adem.200400174
35. Sitti M, Hashimoto H. Controlled pushing of nanoparticles: modeling and experiments. IEEE/ASME Trans mechatronics (2000) 5:199–211. doi:10.1109/3516.847093
36. Montelius L, Tegenfeldt J, Van Heeren P. Direct observation of the atomic force microscopy tip using inverse atomic force microscopy imaging. J Vacuum Sci and Technology B: Microelectronics Nanometer Structures Process Meas Phenomena (1994) 12:2222–6. doi:10.1116/1.587746
37. Huang B, Li Z, Li J. An artificial intelligence atomic force microscope enabled by machine learning. Nanoscale (2018) 10:21320–6. doi:10.1039/c8nr06734a
38. Abiodun OI, Jantan A, Omolara AE, Dada KV, Mohamed NA, Arshad H. State-of-the-art in artificial neural network applications: a survey. Heliyon (2018) 4:e00938. doi:10.1016/j.heliyon.2018.e00938
39. Albawi S, Mohammed TA, Al-Zawi S. Understanding of a convolutional neural network. In: 2017 international conference on engineering and technology (ICET) (Ieee) (2017). p. 1–6.
40. Rashidi M, Wolkow RA. Autonomous scanning probe microscopy in situ tip conditioning through machine learning. Acs Nano (2018) 12:5185–9. doi:10.1021/acsnano.8b02208
41. Sotres J, Boyd H, Gonzalez-Martinez JF. Enabling autonomous scanning probe microscopy imaging of single molecules with deep learning. Nanoscale (2021) 13:9193–203. doi:10.1039/d1nr01109j
42. Gordon OM, Moriarty PJ. Machine learning at the (sub) atomic scale: next generation scanning probe microscopy. Machine Learn Sci Technology (2020) 1:023001. doi:10.1088/2632-2153/ab7d2f
43. Kelley KP, Ziatdinov M, Collins L, Susner MA, Vasudevan RK, Balke N, et al. Fast scanning probe microscopy via machine learning: non-rectangular scans with compressed sensing and Gaussian process optimization. Small (2020) 16:2002878. doi:10.1002/smll.202002878
44. Ziatdinov M, Liu Y, Kelley K, Vasudevan R, Kalinin SV. Bayesian active learning for scanning probe microscopy: from Gaussian processes to hypothesis learning. ACS nano (2022) 16:13492–512. doi:10.1021/acsnano.2c05303
45. Krull A, Hirsch P, Rother C, Schiffrin A, Krull C. Artificial-intelligence-driven scanning probe microscopy. Commun Phys (2020) 3:54–8. doi:10.1038/s42005-020-0317-3
46. Sedin DL, Rowlen KL. Influence of tip size on afm roughness measurements. Appl Surf Sci (2001) 182:40–8. doi:10.1016/s0169-4332(01)00432-9
47. Jalili N, Laxminarayana K. A review of atomic force microscopy imaging systems: application to molecular metrology and biological sciences. Mechatronics (2004) 14:907–45. doi:10.1016/j.mechatronics.2004.04.005
48. Finot E, Passian A, Thundat T. Measurement of mechanical properties of cantilever shaped materials. Sensors (2008) 8:3497–541. doi:10.3390/s8053497
49. Kalinin SV, Ziatdinov M, Hinkle J, Jesse S, Ghosh A, Kelley KP, et al. Automated and autonomous experiments in electron and scanning probe microscopy. ACS nano (2021) 15:12604–27. doi:10.1021/acsnano.1c02104
50. Hunter B, Hindocha S, Lee RW. The role of artificial intelligence in early cancer diagnosis. Cancers (2022) 14:1524. doi:10.3390/cancers14061524
51. Nassif AB, Shahin I, Attili I, Azzeh M, Shaalan K. Speech recognition using deep neural networks: a systematic review. IEEE access (2019) 7:19143–65. doi:10.1109/access.2019.2896880
52. Tang X. The role of artificial intelligence in medical imaging research. BJR— Open (2019) 2:20190031. doi:10.1259/bjro.20190031
53. Lee JG, Jun S, Cho YW, Lee H, Kim GB, Seo JB, et al. Deep learning in medical imaging: general overview. Korean J Radiol (2017) 18:570–84. doi:10.3348/kjr.2017.18.4.570
54. Zhang Y, Zhou Y. Machine vision for interpreting perovskite grain characteristics. Acc Mater Res (2023) 4:209–11. doi:10.1021/accountsmr.2c00256
55. Li Y, Yang J, Pan Z, Tong W. Nanoscale pore structure and mechanical property analysis of coal: an insight combining afm and sem images. Fuel (2020) 260:116352. doi:10.1016/j.fuel.2019.116352
56. Crouzier L, Delvallée A, Ducourtieux S, Devoille L, Noircler G, Ulysse C, et al. Development of a new hybrid approach combining afm and sem for the nanoparticle dimensional metrology. Beilstein J Nanotechnology (2019) 10:1523–36. doi:10.3762/bjnano.10.150
57. Arias S, Zhang Y, Zahl P, Hollen S. Autonomous molecular structure imaging with high-resolution atomic force microscopy for molecular mixture discovery. The J Phys Chem A (2023) 127:6116–22. doi:10.1021/acs.jpca.3c01685
58. [ Dataset] Wu Y, Kirillov A, Massa F, Lo WY, Girshick R. Detectron2 (2019). Available from: https://github.com/facebookresearch/detectron2 (Accessed July 15, 2024).
59. Lin TY, Dollár P, Girshick R, He K, Hariharan B, Belongie S. Feature pyramid networks for object detection. In: 2017 IEEE conference on computer vision and pattern recognition (CVPR) (2017). p. 936–44. doi:10.1109/CVPR.2017.106
60. Ren S, He K, Girshick R, Sun J. Faster R-CNN: towards real-time object detection with region proposal networks. IEEE Trans. Pattern Anal. Mach. Intell. (2016) 39(6):1137–49.
61. He K, Gkioxari G, Dollár P, Girshick R. Mask r-cnn. IEEE International Conference on Computer Vision ICCV (2017). p. 2980–8. doi:10.1109/ICCV.2017.322
62. Shibata M, Watanabe H, Uchihashi T, Ando T, Yasuda R. High-speed atomic force microscopy imaging of live mammalian cells. Biophys physicobiology (2017) 14:127–35. doi:10.2142/biophysico.14.0_127
63. Hecht FM, Rheinlaender J, Schierbaum N, Goldmann WH, Fabry B, Schäffer TE. Imaging viscoelastic properties of live cells by afm: power-law rheology on the nanoscale. Soft matter (2015) 11:4584–91. doi:10.1039/c4sm02718c
64. Li M, Liu L, Xu X, Xing X, Dang D, Xi N, et al. Nanoscale characterization of dynamic cellular viscoelasticity by atomic force microscopy with varying measurement parameters. J Mech Behav Biomed Mater (2018) 82:193–201. doi:10.1016/j.jmbbm.2018.03.036
65. Kuznetsov YG, Malkin AJ, McPherson A. Atomic force microscopy studies of living cells: visualization of motility, division, aggregation, transformation, and apoptosis. J Struct Biol (1997) 120:180–91. doi:10.1006/jsbi.1997.3936
66. Hessler JA, Budor A, Putchakayala K, Mecke A, Rieger D, Banaszak Holl MM, et al. Atomic force microscopy study of early morphological changes during apoptosis. Langmuir (2005) 21:9280–6. doi:10.1021/la051837g
67. Nahar S, Schmets A, Schitter G, Scarpas A. Quantitative nanomechanical property mapping of bitumen micro-phases by peak-force atomic force microscopy. ISAP Conf (2014) 30:1–12. doi:10.1201/b17219-169
68. Hu J, Chen S, Huang D, Zhang Y, Lü S, Long M. Global mapping of live cell mechanical features using peakforce qnm afm. Biophys Rep (2020) 6:9–18. doi:10.1007/s41048-019-00103-9
69. Redmon J, Farhadi A. Yolov3: an incremental improvement. ArXiv abs/1804.02767z (2018). doi:10.48550/arXiv.1804.02767
70. Vekinis AA, Constantoudis V. Neural network evaluation of geometric tip-sample effects in afm measurements. Micro Nano Eng (2020) 8:100057. doi:10.1016/j.mne.2020.100057
71. Garcıa R, Perez R. Dynamic atomic force microscopy methods. Surf Sci Rep (2002) 47:197–301. doi:10.1016/s0167-5729(02)00077-8
72. Chandrashekar A, Belardinelli P, Bessa MA, Staufer U, Alijani F. Quantifying nanoscale forces using machine learning in dynamic atomic force microscopy. Nanoscale Adv (2022) 4:2134–43. doi:10.1039/d2na00011c
73. Ando T. High-speed atomic force microscopy coming of age. Nanotechnology (2012) 23:062001. doi:10.1088/0957-4484/23/6/062001
74. Ando T, Uchihashi T, Kodera N. High-speed atomic force microscopy. Curr Opin Chem Biol (2019) 51:08KA02–112. doi:10.1143/jjap.51.08ka02
75. Hansma PK, Schitter G, Fantner GE, Prater C. High-speed atomic force microscopy. Science (2006) 314:601–2. doi:10.1126/science.1133497
76. Kocur V, Hegrová V, Patočka M, Neuman J, Herout A. Correction of afm data artifacts using a convolutional neural network trained with synthetically generated data. Ultramicroscopy (2023) 246:113666. doi:10.1016/j.ultramic.2022.113666
77. Zhang Z, Liu Q, Wang Y. Road extraction by deep residual u-net. IEEE Geosci Remote Sensing Lett (2017) 15:749–53. doi:10.1109/lgrs.2018.2802944
78. Stucklin S, Gullo MR, Akiyama T, Scheidiger M. Atomic force microscopy for industry with the akiyama-probe sensor. In: 2008 international conference on nanoscience and nanotechnology. IEEE (2008). p. 79–82.
79. Borodinov N, Tsai WY, Korolkov VV, Balke N, Kalinin SV, Ovchinnikova OS. Machine learning-based multidomain processing for texture-based image segmentation and analysis. Appl Phys Lett (2020) 116:044103. doi:10.1063/1.5135328
80. Oinonen N, Xu C, Alldritt B, Canova FF, Urtev F, Cai S, et al. Electrostatic discovery atomic force microscopy. ACS nano (2021) 16:89–97. doi:10.1021/acsnano.1c06840
81. Tang B, Song Y, Qin M, Tian Y, Wu ZW, Jiang Y, et al. Machine learning-aided atomic structure identification of interfacial ionic hydrates from AFM images. Natl Sci Rev (2022) 10:nwac282. doi:10.1093/nsr/nwac282
82. Carracedo-Cosme J, Romero-Muñiz C, Pérez R. A deep learning approach for molecular classification based on afm images. Nanomaterials (2021) 11:1658. doi:10.3390/nano11071658
83. Ziatdinov M, Zhang S, Dollar O, Pfaendtner J, Mundy CJ, Li X, et al. Quantifying the dynamics of protein self-organization using deep learning analysis of atomic force microscopy data. Nano Lett (2021) 21:158–65. PMID: 33306401. doi:10.1021/acs.nanolett.0c03447
84. Kobayashi Y, Miyake Y, Ishiwari F, Ishiwata S, Saeki A. Machine learning of atomic force microscopy images of organic solar cells. RSC Adv (2023) 13:15107–13. doi:10.1039/d3ra02492j
85. Corrias M, Papa L, Sokolović I, Birschitzky V, Gorfer A, Setvin M, et al. Automated real-space lattice extraction for atomic force microscopy images. Machine Learn Sci Technology (2023) 4:015015. doi:10.1088/2632-2153/acb5e0
86. Zeng Y, Liu X, Wang Z, Gao W, Li L, Zhang S. Detection and classification of hepatocytes and hepatoma cells using atomic force microscopy and machine learning algorithms. Microsc Res Tech (2023) 86:1047–56. doi:10.1002/jemt.24384
87. Dokukin M, Dokukina I. Application of ensemble machine learning methods to multidimensional afm data sets. Proced Computer Sci (2020) 169:763–6. doi:10.1016/j.procs.2020.02.168
88. Sokolov I, Dokukin M, Kalaparthi V, Miljkovic M, Wang A, Seigne J, et al. Noninvasive diagnostic imaging using machine-learning analysis of nanoresolution images of cell surfaces: detection of bladder cancer. Proc Natl Acad Sci (2018) 115:12920–5. doi:10.1073/pnas.1816459115
89. Prasad S, Rankine A, Prasad T, Song P, Dokukin ME, Makarova N, et al. Atomic force microscopy detects the difference in cancer cells of different neoplastic aggressiveness via machine learning. Adv NanoBiomed Res (2021) 1:2000116. doi:10.1002/anbr.202000116
90. Yu J, Gao H, Si X, Yang H, Wang Y. Svm-based classification on afm images of prostate cancer cells. SPIE-CLP Conf Adv Photon 2022 (Spie) (2023) 12601:23–8. doi:10.1117/12.2667179
91. Raila T, Penkauskas T, Ambrulevičius F, Jankunec M, Meškauskas T, Valinčius G. Ai-based atomic force microscopy image analysis allows to predict electrochemical impedance spectra of defects in tethered bilayer membranes. Scientific Rep (2022) 12:1127. doi:10.1038/s41598-022-04853-4
92. Waite JR, Tan SY, Saha H, Sarkar S, Sarkar A. Few-shot deep learning for afm force curve characterization of single-molecule interactions. Patterns (2023) 4:100672. doi:10.1016/j.patter.2022.100672
93. Zhang Z. Improved adam optimizer for deep neural networks. In: 2018 IEEE/ACM 26th international symposium on quality of service (IWQoS) (Ieee) (2018). p. 1–2.
94. Sandler M, Howard A, Zhu M, Zhmoginov A, Chen LC. Mobilenetv2: inverted residuals and linear bottlenecks. In: Proceedings of the IEEE conference on computer vision and pattern recognition (2018). p. 4510–20.
95. Simonyan K, Zisserman A. Very deep convolutional networks for large-scale image recognition. CoRR abs/1409 (2014) 1556. doi:10.48550/arXiv.1409.1556
96. Ontivero-Ortega M, Lage-Castellanos A, Valente G, Goebel R, Valdes-Sosa M. Fast Gaussian naïve bayes for searchlight classification analysis. Neuroimage (2017) 163:471–9. doi:10.1016/j.neuroimage.2017.09.001
97. LaValley MP. Logistic regression. Circulation (2008) 117:2395–9. doi:10.1161/circulationaha.106.682658
98. Suthaharan S, Suthaharan S. Support vector machine. Machine learning models and algorithms for big data classification: thinking with examples for effective learning (2016). p. 207–35.
99. Pittenger B, Erina N, Su C. Quantitative mechanical property mapping at the nanoscale with peakforce qnm. Bruker Application Note An128, Rev (2010) A. doi:10.13140/RG.2.1.4463.8246
100. Xu K, Sun W, Shao Y, Wei F, Zhang X, Wang W, et al. Recent development of peakforce tapping mode atomic force microscopy and its applications on nanoscience. Nanotechnology Rev (2018) 7:605–21. doi:10.1515/ntrev-2018-0086
101. Han S, Qubo C, Meng H. Parameter selection in svm with rbf kernel function. In: World automation congress 2012 (IEEE) (2012). p. 1–4.
102. Gastwirth JL. The estimation of the lorenz curve and gini index. The Rev Econ Stat (1972) 54:306–16. doi:10.2307/1937992
103. Ketkar N, Ketkar N. Stochastic gradient descent. In: Deep learning with Python: a hands-on introduction (2017). p. 113–32.
105. Zhang ML, Zhou ZH. Ml-knn: a lazy learning approach to multi-label learning. Pattern recognition (2007) 40:2038–48. doi:10.1016/j.patcog.2006.12.019
106. Lin TY, Goyal P, Girshick R, He K, Dollár P. Focal loss for dense object detection. In: 2017 IEEE international conference on computer vision (ICCV) (2017). p. 2999–3007. doi:10.1109/ICCV.2017.324
107. Müller P, Abuhattum S, Möllmert S, Ulbricht E, Taubenberger AV, Guck J. nanite: using machine learning to assess the quality of atomic force microscopy-enabled nano-indentation data. BMC bioinformatics (2019) 20:465–9. doi:10.1186/s12859-019-3010-3
108. Ahmad MW, Reynolds J, Rezgui Y. Predictive modelling for solar thermal energy systems: a comparison of support vector regression, random forest, extra trees and regression trees. J Clean Prod (2018) 203:810–21. doi:10.1016/j.jclepro.2018.08.207
109. Zhu X, Qin R, Qu K, Wang Z, Zhao X, Xu W. Atomic force microscopy–based assessment of multimechanical cellular properties for classification of graded bladder cancer cells and cancer early diagnosis using machine learning analysis. Acta Biomater (2023) 158:358–73. doi:10.1016/j.actbio.2022.12.035
110. Weber A, Vivanco M, Toca-Herrera JL. Application of self-organizing maps to afm-based viscoelastic characterization of breast cancer cell mechanics. Scientific Rep (2023) 13:3087. doi:10.1038/s41598-023-30156-3
111. Alldritt B, Hapala P, Oinonen N, Urtev F, Krejci O, Federici Canova F, et al. Automated structure discovery in atomic force microscopy. Sci Adv (2020) 6:eaay6913. doi:10.1126/sciadv.aay6913
112. Young G, Krishnamurthy A. GPU-accelerated generation and rendering of multi-level voxel representations of solid models. Comput and Graphics (2018) 75:11–24. doi:10.1016/j.cag.2018.07.003
Keywords: atomic force microscopy, nanomechanical properties, artificial intelligence, machine learning, deep learning
Citation: Masud N, Rade J, Hasib MHH, Krishnamurthy A and Sarkar A (2024) Machine learning approaches for improving atomic force microscopy instrumentation and data analytics. Front. Phys. 12:1347648. doi: 10.3389/fphy.2024.1347648
Received: 01 December 2023; Accepted: 11 September 2024;
Published: 24 September 2024.
Edited by:
Marco Capitanio, University of Florence, ItalyReviewed by:
Carlos Marcuello, Instituto de Nanociencia y Materiales de Aragón (INMA), SpainLuciana Magalhães Rebelo Alencar, Federal University of Maranhão, Brazil
Umberto Celano, Arizona State University, United States
Copyright © 2024 Masud, Rade, Hasib, Krishnamurthy and Sarkar. This is an open-access article distributed under the terms of the Creative Commons Attribution License (CC BY). The use, distribution or reproduction in other forums is permitted, provided the original author(s) and the copyright owner(s) are credited and that the original publication in this journal is cited, in accordance with accepted academic practice. No use, distribution or reproduction is permitted which does not comply with these terms.
*Correspondence: Anwesha Sarkar, YW53ZXNoYXNAaWFzdGF0ZS5lZHU=
†These authors have contributed equally to this work