- 1School of Education, Yunnan Normal University, Kunming, Yunnan, China
- 2School of Finance, Yunnan University of Finance and Economics, Kunming, Yunnan, China
- 3Kunming No.1 High School Xuezhi School, Kunming, China
Introduction: With the advancement of society and technology, the importance of professional competency has been increasingly emphasized. This study aims to provide an in-depth analysis of the Baidu search index for “professional competency” from July 3, 2017, to October 6, 2023, across 34 provincial-level administrative regions in China.
Methods: The study begins with a literature review to establish a theoretical framework. Subsequently, it delves into the fundamental concepts of complex networks, their parameters, and the principles of visible network graph algorithms. The application of system clustering and community detection algorithms is explored within this framework.
Results: The empirical analysis starts with a provincial-level examination, involving the construction of visible network graphs, the exploration of scale-free networks, and discussions on regional system clustering. Following this, a nationwide analysis is conducted, focusing on the construction of visible network graphs to visualize the awareness of professional competency and studying community structures.
Discussion: The findings provide insights into the awareness of professional competency across different regions. These insights are valuable for informing policy formulation and corporate decision-making, contributing to a deeper understanding of professional competency awareness and its implications.
1 Introduction
With the advancement of globalization and rapid economic development, technology plays an increasingly crucial role in various fields, leading to profound changes in the job market and work environments. In this context, people’s expectations and focus on their own career development and personal growth have significantly increased. They are now more concerned about how to enhance their professional skills to adapt to this fast-changing world.
In this trend, “professional competency” has emerged as a core concept, seen as a key indicator for measuring an individual’s professional capabilities and overall qualities. Professional competency encompasses not only an individual’s skills or knowledge but also a comprehensive reflection of various aspects, including attitude, values, communication abilities, and teamwork spirit. This competency directly impacts an individual’s performance in the workplace and determines whether they can successfully plan and develop their careers.
More importantly, the improvement of professional competency is closely linked to national human resource development strategies, corporate talent selection criteria, and training mechanisms, as well as the overall harmony and stability of society. When an individual’s professional competency improves, they can not only create more value for the company but also contribute to the progress and prosperity of society.
Therefore, research on the awareness of “professional competency” is of significant theoretical and practical importance. However, traditional research methods often rely on qualitative descriptions and analysis, lacking in-depth exploration and analysis of extensive data. To address this, this paper employs a method based on visible network graphs to conduct an in-depth study of the awareness of “professional competency” in the Baidu Consultation search index. This approach provides a more intuitive and accurate way to reveal changes in the awareness of professional competency in different regions and time periods, offering strong data support for relevant policy-making and corporate decision-making.
The research methodology in this paper combines complex network theory and big data analysis techniques, enabling effective processing and analysis of large search data and revealing patterns and trends.
The visibility graph network method, compared to existing traditional analytical methods, demonstrates unique advantages and significant differences in analyzing attention towards professional competencies. This method, by converting time-series data into network structures, offers researchers a novel perspective, allowing them to intuitively reveal the complex relationships and dynamic changes among the data, which are often difficult to achieve with traditional linear analysis methods [1–3]. The visibility graph network can uncover the scale-free and fractal properties of the data, aiding in a deeper understanding of the nonlinear characteristics of the temporal and spatial distribution of attention towards professional competencies, aspects frequently overlooked by traditional methods. Additionally, by leveraging complex network analysis tools such as systematic clustering and community partitioning, key periods of attention and regional disparities can be identified, providing more precise and personalized guidance for professional competency research and policy formulation.
2 Literature review
In recent years, the visibility graph network method has been widely applied in various fields of research. Sen Jiang employed visibility network methods to analyze heart rate variability signals in his study [4], providing a novel perspective for the processing of time series data. Similarly, Lian Zhou utilized methods based on visibility and evidence theory to study prediction algorithms for time series, achieving certain effectiveness in practical applications [5]. Both studies indicate that visibility graph network methods have high practical value in the analysis of time series data. Zhihui Zhou et al., using “vocational education” as a keyword, selected Baidu search index data from 2013 to 2022 for 29 provinces in China. They transformed time series data into complex networks using the visibility graph method and explored the network characteristics and regional differences in the attention to vocational education through methods such as network parameters, degree distribution, and hierarchical clustering [6]. Regarding the application of systematic clustering methods, Xinyu Yu selected 645 literature samples on research on the data literacy of Chinese university students from the China National Knowledge Infrastructure (CNKI) database for the years 2003–2022. The COOC 9.94 software was used to analyze the publication years, journals, research institutions, core authors, and keywords of the sample literature, investigating the current status and research hotspots of university students’ data literacy [7].
Closely related to the theme of this study is the research conducted by Mengyue Zhang et al., where visibility graph networks were used to analyze the attention to Chinese patent applications. This not only demonstrated the application of complex network analysis in the field of intellectual property but also highlighted the role of community partitioning in determining key areas and hot issues. They used systematic clustering and community partitioning to identify key factors influencing the visibility of papers on social media [8], providing an intuitive example that demonstrates the potential application of visibility graph network methods in attention analysis. Additionally, Hailin Li and Liping Zhang conducted a review on clustering in time series data mining [9], presenting various methods and approaches for processing time series data.
In the study of vocational literacy, Siyin Gao and Nana Jia explored strategies and paths for cultivating vocational core literacy in higher vocational students from the perspectives of production-education integration and higher vocational colleges [10, 11]. This provides multiple perspectives and methods for the cultivation of vocational literacy. Gang Li et al. Conducted predictive research on the social media visibility of academic papers, offering a new research direction on how to increase social media attention in vocational literacy studies. In Li Gang’s study on the prediction of social media visibility of academic papers, complex network parameters such as node influence and network modularity might be used to understand and predict the dissemination patterns of papers on social media [12].
Furthermore, Rui Li et al. explored the hotspots and trends in the research of early special education in China through knowledge graph analysis [13], representing an application example of knowledge graphs in educational research. Meanwhile, Jianping Zheng and Yongshi Hu studied the temporal simultaneous lag effects based on a time series network similarity model [14], demonstrating the application of time series networks in other fields.
In summary, existing research has provided rich theoretical foundations and empirical cases for this study. Methods based on visibility graph networks show tremendous potential in the analysis of time series data, attention analysis, and vocational literacy research. This study will build upon these research achievements to further explore the practical progress and value of “Occupational Literacy Attention Analysis Based on Visibility Graph Networks.”
The visibility graph network method effectively transforms time-series data into network structures, uncovering the temporal characteristics of attention towards professional competencies and providing a novel perspective for data comprehension. By constructing complex networks, this study reveals the variations in attention towards professional competencies across different regions and time periods, thus offering robust data support for relevant policy-making and corporate decision-making. Additionally, leveraging the visibility graph network, the research discovers that search data for “professional competencies” in various provinces exhibit scale-free and fractal characteristics, providing theoretical support for further investigation. Through systematic clustering, significant differences in attention towards “professional competencies” among different provinces are identified.
3 Concepts
3.1 Basic concepts of complex networks
Complex networks constitute a multidisciplinary field focused on exploring the network structures within various complex systems, their internal dynamic behaviors, and the interactions and connections among their components. Complex systems are pervasive in both our daily lives and the natural world, spanning various domains such as technology, society, and biology [15]. Examples of complex networks include the Internet, social networks, ecosystems, and neural networks. These networks share the common characteristic of being composed of numerous nodes and edges, where the interactions and connections between these nodes and edges form the fundamental structure of the network. These structures often follow specific patterns and rules, rather than being random [16–18]. Research on complex networks not only examines the topology of these networks but also delves into dynamic processes within the network, such as information propagation, disease spreading, and collective behavior [19–21].
The primary goal of complex network research is to unveil statistical properties of these networks, such as degree distributions, clustering coefficients, and average path lengths, and to explore the universal principles and rules underlying these properties [22, 23]. By studying these statistical properties, one can gain a better understanding of the mechanisms, stability, and resilience of networks, as well as various dynamic processes within them. Additionally, research on complex networks provides a range of tools and methods for analyzing, predicting, and controlling the behavior of various complex systems, thereby finding practical applications across multiple domains, including technology, economics, and society [24].
3.2 Parameters of complex networks
3.2.1 Average path length
The average path length refers to the average length of the shortest paths between all pairs of nodes in the network [25]. It reflects the overall connectivity of the network, i.e., the average number of steps required for information or any other entity to propagate through the network. Mathematically, given an adjacency matrix A for a network, the average path length L can be defined as:
Where N is the number of nodes in the network, and d (i, j) is the length of the shortest path between nodes i and j [5].
3.2.2 Clustering coefficient
The clustering coefficient describes the density of connections among a node’s neighbors in the network [26]. For a given node, its clustering coefficient is the ratio of actual edges between its neighbors to the potential edges that could exist among them. For node i, its clustering coefficient Ci is defined as:
Where ei is the number of edges among the neighbors of node i, and ki is the degree of node i [5].
3.2.3 Degree distribution
Degree distribution describes the proportion of nodes in the network that have a specific degree k [27]. It reflects the network’s connectivity pattern and structure. In many real networks, the degree distribution often follows a power-law distribution, where the majority of nodes have low degrees, and a few nodes have very high degrees. Mathematically, a power-law degree distribution can be expressed as:
Where α is a constant, typically ranging between 2 and 3 [5].
3.3 Principles of visible network graph algorithms
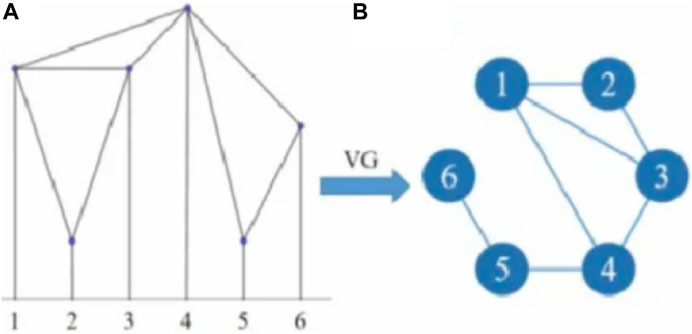
The visible network graph algorithm is a method that transforms time series data into a network structure. The fundamental idea behind this algorithm is to treat each data point in the time series as a node and determine whether there is an edge between nodes based on certain “visibility” criteria [28]. Specifically, if the line between two data points is not obstructed by other data points, there is an edge between those two data points. This approach allows the transformation of nonlinear time series data into a graph structure, enabling the use of graph theory methods for analysis [29, 30].
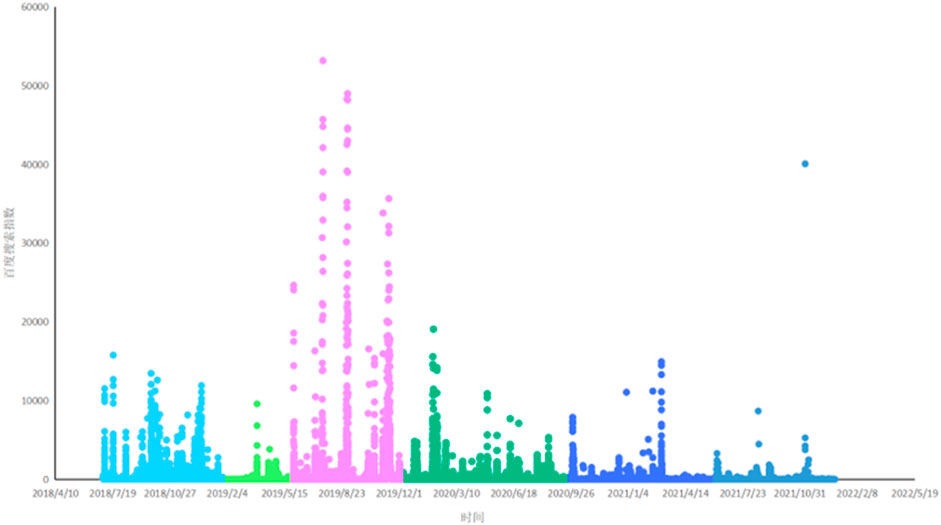
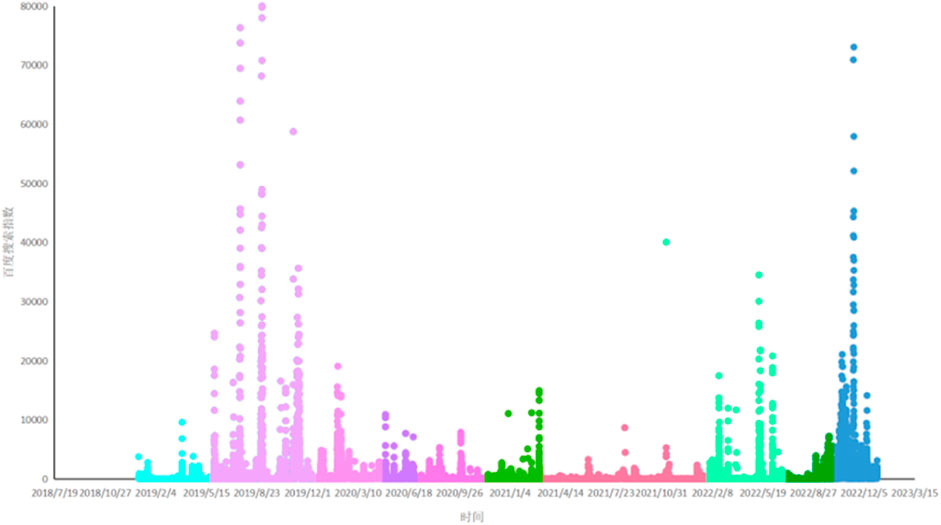
In this study, the visible network graph algorithm was employed to analyze the awareness of “professional competency.” Specifically, data for the Baidu Consultation search index related to “professional competency” was collected from 3 July 2017, to 6 October 2023, and denoted as a time series S(t), where t represents the time point.
In Figure 1, using the visibility graph algorithm, the time series S(t) has been transformed into a network structure G (V, E), where V is the set of nodes representing the search index at various time points, and E is the set of edges determined based on the visibility criteria. Specifically, if the line between two time points ti and tj, with search indices S (ti) and S (tj), is not obstructed by the search indices of other time points, then there exists an edge eij connecting ti and tj in the network G (V, E) [31–33].
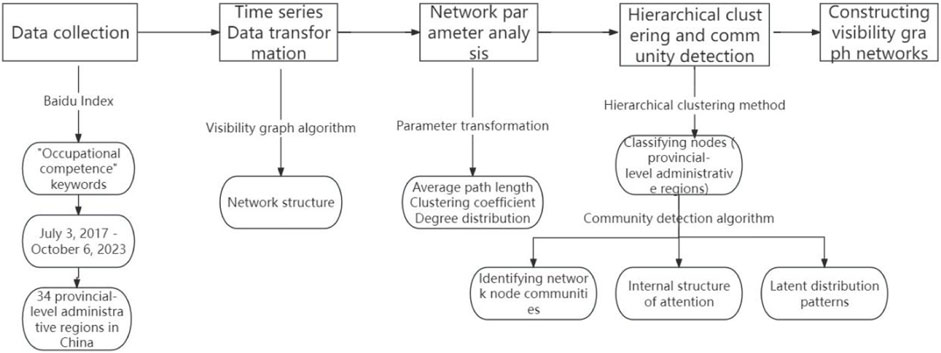
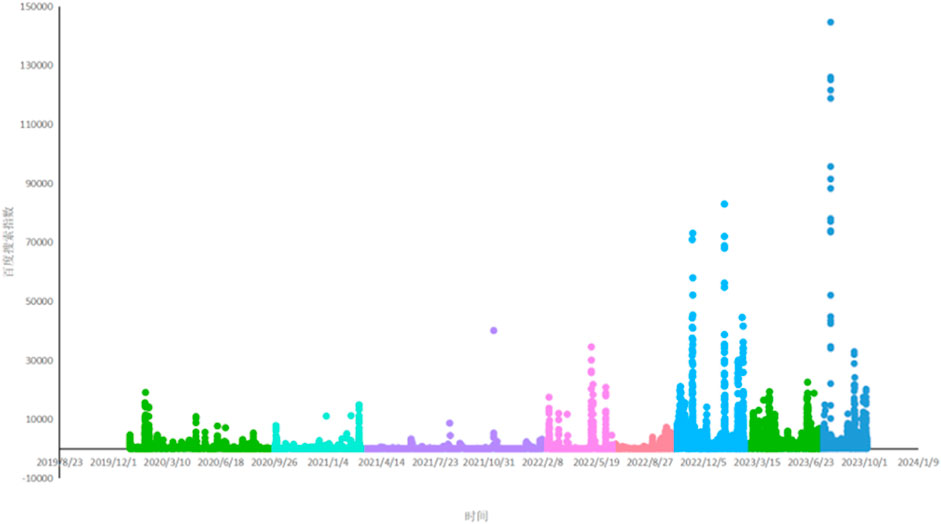
In Figure 2, by constructing this network G (V, E), a complex network structure describing the changes in the awareness of “professional competency” over time has been obtained. This network not only reveals the time series characteristics of “professional competency” awareness but also provides a new perspective for analyzing the underlying dynamic mechanisms. For example, by analyzing the network’s topological structure, such as degree distribution P(k), clustering coefficient C, and average path length L, one can identify key periods of awareness and potential driving factors [34].
3.4 System clustering
System clustering is a method that groups nodes within a network based on their topological structure and attributes. In this research, considering the regional characteristics of “professional competency” awareness, a system clustering method was used to classify various provincial-level administrative regions. Specifically, given a network G (V, E), where V represents the node set, indicating various provincial-level administrative regions, and E represents the edge set, indicating the similarity in awareness between regions, the research objective is to find a node partition P = {C1, C2, C3, … , Ck}, where each Ci is a node subset representing a cluster [35].
To achieve this goal, a clustering algorithm based on modularity optimization was employed. Modularity Q is a metric that measures the quality of network clustering and is defined as:
Where |E (Ci, Ci)| is the number of edges within the subset Ci, and |E (Ci, V)| is the number of edges between the subset Ci and the entire network V [9].
3.5 Community detection algorithm
Community detection is a core problem in the study of complex networks, aiming to identify tightly connected groups of nodes within a network. In this study, a community detection algorithm was employed to further refine the structural characteristics of “professional competency” awareness. Specifically, given the aforementioned network G (V, E), the goal was to find a community partition S = {D1, D2, … , Dm}, where each Di is a node subset representing a community [9].
To achieve this goal, the Louvain algorithm was used, which is an efficient community detection method based on modularity optimization. The algorithm gradually improves the modularity Q through iterative processes of local optimization and community merging, ultimately obtaining the final community partition.
4 Data
This paper selected Baidu Consultation search index as the data source, covering search data related to “professional competency” from 3 July 2017, to 6 October 2023. The data was further disaggregated for all 34 provincial-level administrative regions in China (excluding data for Hong Kong, Macau, and Taiwan, which were all zero).
Choosing Baidu Consultation search index as the data source is grounded in several reasons. Firstly, as the largest search engine in China, Baidu’s search data can effectively mirror the interests and concerns of a vast number of internet users, rendering it highly representative [36, 37]. Secondly, the search index transcends being a mere numerical value; it encapsulates a trove of social, economic, and cultural information [38, 39], providing both macro and micro perspectives on the awareness of “professional competency.” Additionally, delving into data from various provincial-level administrative regions facilitates insights into the divergences and nuances of “professional competency” awareness across different regions and cultural backgrounds.
This paper initially employed the visibility graph algorithm to convert time series data into a complex network, illustrating the fluctuations in awareness of “professional competency” over time. Following this, through the application of system clustering and community detection algorithms, the network underwent a comprehensive structural analysis to pinpoint key nodes, tightly connected groups of nodes, and potential community structures. The specific research framework for visibility network analysis can be seen in Figure 3.
5 Empirical analysis of provincial data
5.1 Construction of visibility graph networks for Chinese provinces
With the progression of the economy and the advancements in information technology, there has been a steady rise in people’s awareness of professional competency. To comprehensively comprehend this trend, this section delves into the analysis of search data for “professional competency” across 31 provincial-level administrative regions in China, utilizing the Baidu Consultation search index. The utilization of the visibility graph algorithm facilitates the transformation of time series data into a complex network, offering a detailed portrayal of the shifts in awareness of “professional competency” over time. This transformative approach enables observations and analyses at both macro and micro levels of the data.
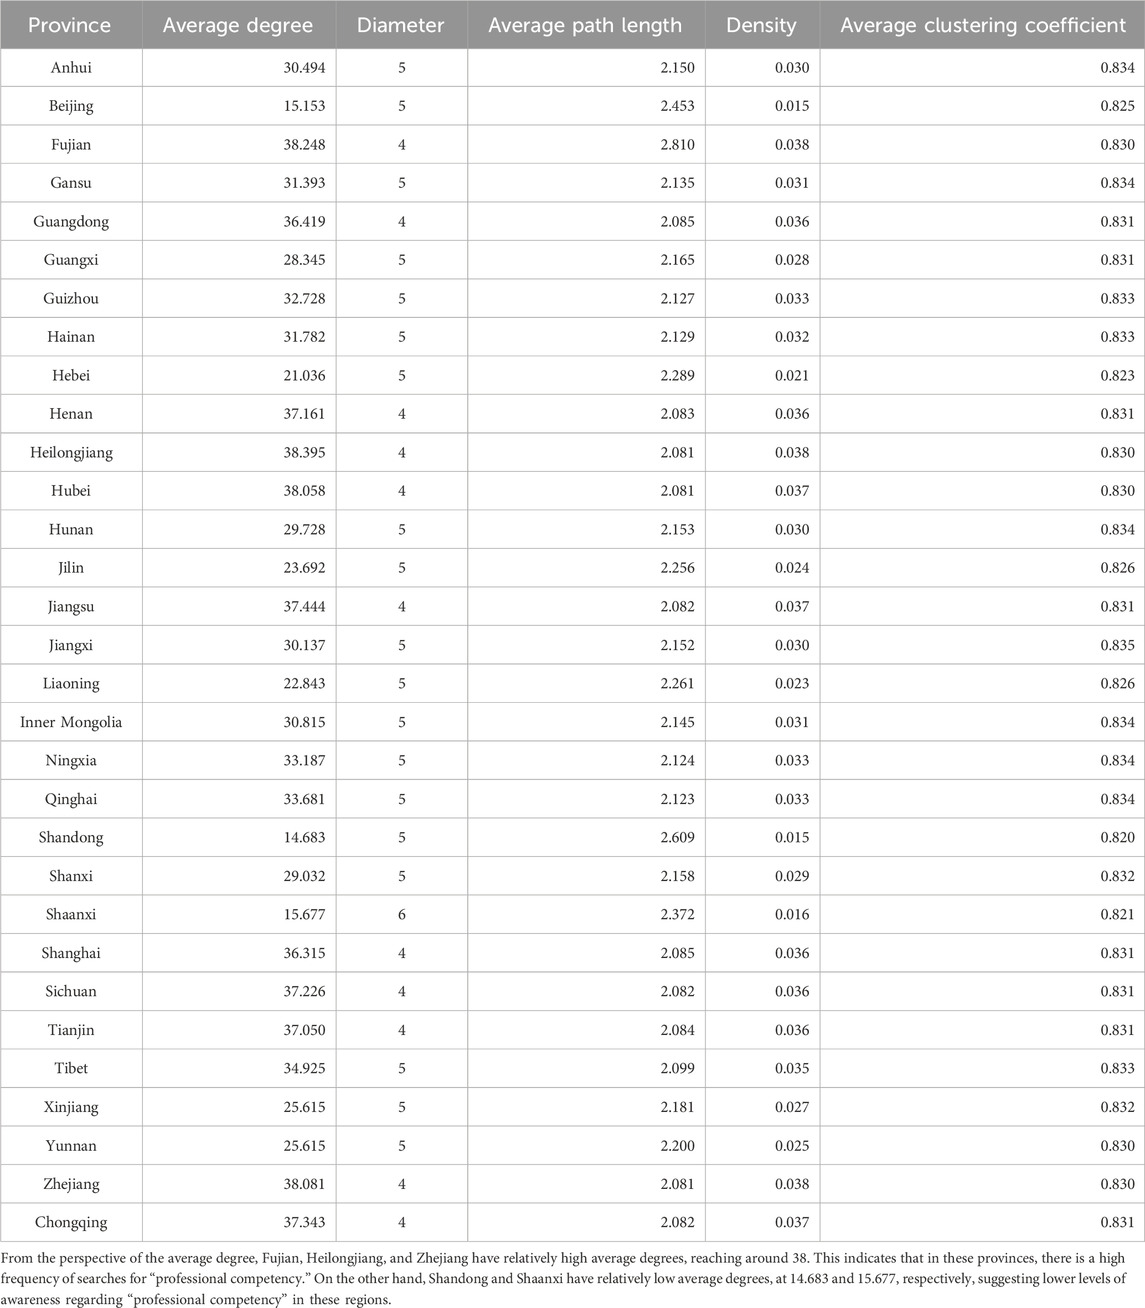
Table 1 outlines the visibility graph network parameters for each province, encompassing average degree, diameter, average path length, density, and average clustering coefficient. These parameters collectively furnish a holistic perspective, aiding in the understanding of the level of awareness of “professional competency” in each province.
Next, the diameter parameter reveals that most provinces have a diameter of 4 or 5, indicating relatively high levels of association between any two time points in these provinces. The average path length for most provinces falls between 2.0 and 2.6, indicating a relatively fast rate of information propagation within the network.
The density parameter shows that most provinces have densities ranging from 0.02 to 0.04, implying highly interconnected nodes within the network and good continuity and stability in information propagation.
Finally, looking at the average clustering coefficient, it's evident that the average clustering coefficients for all provinces are above 0.8. This indicates a high level of closeness in the connections between nodes and their neighbors in the network, reflecting the widespread awareness to the topic of “professional competency” in these provinces.
In summary, Table 1 reflects the network structural characteristics of awareness regarding “professional competency” in various provinces. These parameters provide a deeper understanding of the characteristics of awareness in each province, offering robust data support for further research.
5.2 Scale-free networks: fractal time series
A scale-free network is one where the majority of nodes have very few connections, while a small number of nodes have a large number of connections. The degree distribution in such networks follows a power-law distribution, meaning the relationship between the node degree and its frequency can be described using a power-law. Fractal time series, on the other hand, are time series with self-similarity, meaning they exhibit similar statistical characteristics at different time scales [40, 41].
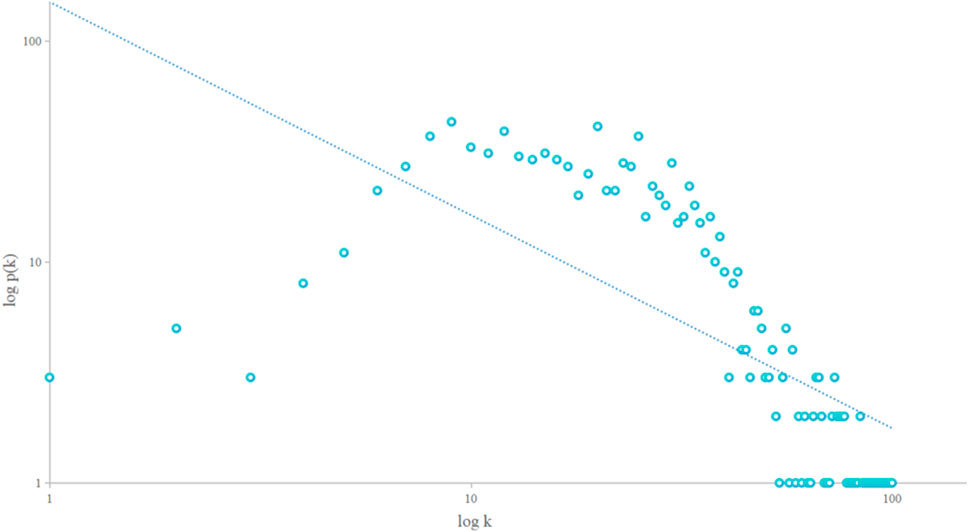
In this section, we will explore whether the “professional competency” search data for each province exhibits scale-free and fractal characteristics. To do this, we first construct visibility graph networks for each province and calculate their degree distributions. Figure 4 shows the power-law distribution of the visibility graph network in Anhui province. From the figure, it can be observed that the degree distribution in Anhui province roughly follows a power-law distribution, indicating that the search data for “professional competency” in Anhui province possesses scale-free characteristics.
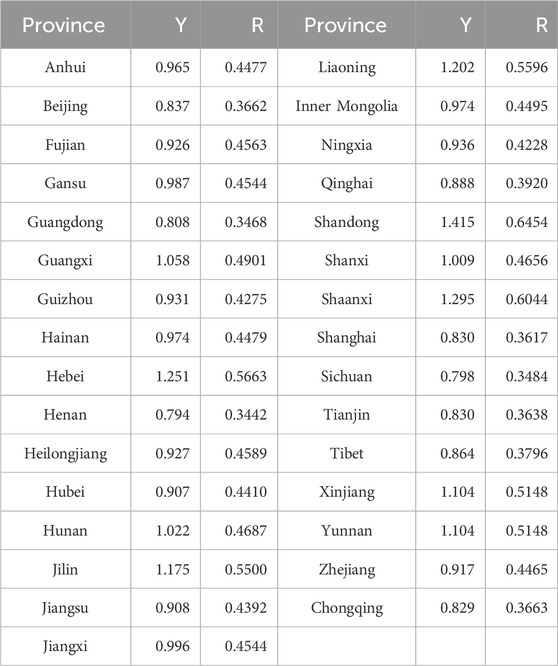
Table 2 presents the power-law distributions and fitting quality for the visibility graph networks in various provinces. Here, Y represents the power-law exponent, and R represents the fitting quality. The power-law exponent Y reflects the steepness of the degree distribution, while the fitting quality R indicates the degree of fit between the actual data and the power-law distribution.
From the table, it can be observed that the power-law exponent Y values for various provinces range from 0.8 to 1.4, indicating that the degree distributions in these provinces follow a power-law distribution. The values of fitting quality R range from 0.3 to 0.6, suggesting a relatively good fit between the actual data and the power-law distribution. Notably, Shandong province stands out with a power-law exponent of 1.415, significantly higher than other provinces, indicating a more pronounced scale-free characteristic in the “professional competency” search data for Shandong province. In contrast, Sichuan province has a lower power-law exponent of 0.798, indicating a lower degree of fit between the data and the power-law distribution.
In summary, the construction and analysis of visibility graph networks for “professional competency” search data in various provinces have revealed scale-free and fractal characteristics in these datasets. This provides strong theoretical support for further research on the awareness to “professional competency.”
5.3 Regional system clustering
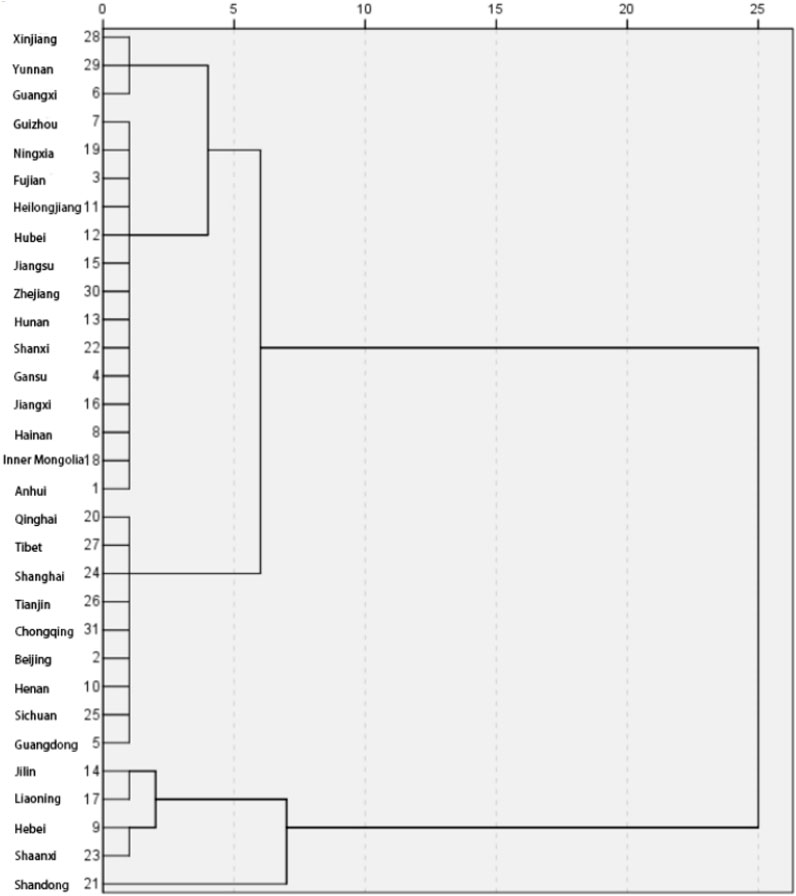
This study utilizes the parameters of the visibility graph networks for clustering and employs hierarchical clustering to categorize the 31 provinces and regions (excluding Hong Kong, Macau, and Taiwan). Figure 5 displays the clustering results, where each node represents a pair of clusters, the vertical axis length between two nodes indicates the distance between the merged clusters, and the provinces or regions under each category exhibit similar changes in professional competency awareness.
From Figure 5, it can be observed that categorizing the 31 provinces and regions (excluding Hong Kong, Macau, and Taiwan) into 4 groups is optimal. Xinjiang, Yunnan, and Guangxi are grouped together, referred to as the first group; Guizhou, Ningxia, Fujian, Heilongjiang, Hubei, Jiangsu, Zhejiang, Hunan, Shanxi, Gansu, Jiangxi, Hainan, Inner Mongolia, and Anhui form the second group; Qinghai, Tibet, Shanghai, Tianjin, Chongqing, Beijing, Henan, Sichuan, and Guangdong make up the third group; Jilin, Liaoning, Hebei, Shanxi, and Shandong constitute the fourth group.
The Baidu search index for professional competence can to some extent reflect the characteristics of changes in the awareness to professional competence in that province or region. The first and fourth groups have larger network diameters, fewer edges, lower average degrees, clustering coefficients, and densities, indicating weaker relationships among nodes and relatively less emphasis on professional competency education. The second group of provinces and regions falls in between, showing intermediate values for network diameter, edges, average degree, clustering coefficient, and density, suggesting a moderate level of interconnectedness among the nodes. The third group, which includes regions like Shanghai, Chongqing, and Beijing, exhibits higher values for network edges, average degree, clustering coefficient, and density, signifying strong relationships among nodes and high levels of interest in professional competency.
6 Empirical analysis of national data
6.1 Construction of visibility graph networks for professional competency awareness
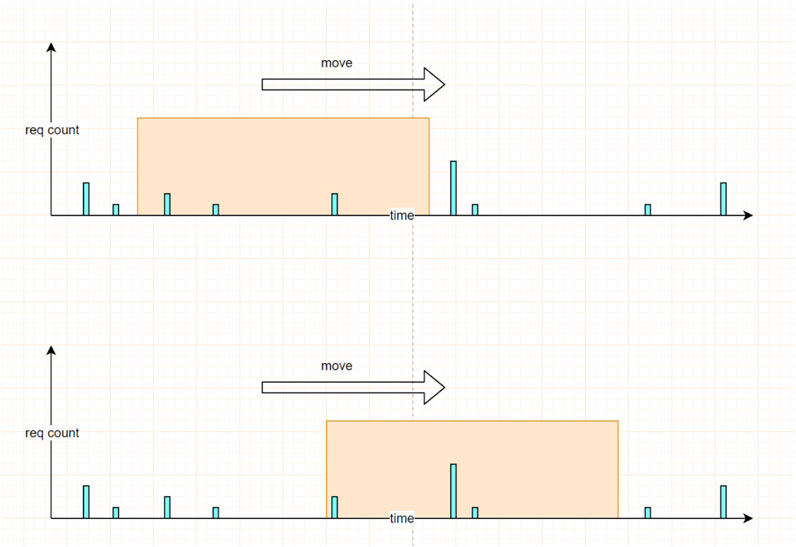
In order to comprehensively analyze the characteristics of the time series of professional competency awareness, this section uses the principle of visibility graph algorithms to construct visibility graph networks for the nationwide and local Baidu search index time series data for “professional competency” from 2018 to 2023 (as there were no data for 2017). The time series data are divided into 4-year windows, each containing 1,207 nodes, to build local visibility graph networks. These windows are moved forward by 1 year at a time, as shown in Figure 6.
The moving time window principle is a commonly used method in time series analysis, particularly when trying to capture short-term dynamic changes within long time series. This method aids in gaining a better understanding of the characteristics and trends of data during different time periods [40]. By selecting a 4-year time window, at any given time point, the window encompasses data from the past 4 years. Since there are 365 days in a year (ignoring leap years), each window contains 1,207 nodes. When the window is moved, it shifts back by 1 year. This means that the first window includes data from 2018 to 2021, the second window includes data from 2019 to 2022, and so on.
This approach allows for the analysis of each 4-year time period to capture the changes and trends in the Baidu search index for “professional competency” during these intervals. As shown in Table 3, Furthermore, because the windows move continuously, it enables the observation of transitional effects and changes between years. The moving time window principle permits local analysis within a long time series, facilitating a better understanding of both short-term and long-term data trends [42].
6.2 Community structure
In each time window, this study used the Girvan-Newman algorithm to detect the community structure within the visibility graph network [43, 44]. The results of community detection are shown in Table 4; Figures 7–9. Different colors in the figures represent different communities to which nodes belong. As observed in Table 4, the number of communities in the first and third windows is relatively close, indicating that the factors affecting the awareness to patent applications in these two time periods are similar. The second window has 10 communities, suggesting that a stronger influencing factor appeared during the second time window, causing other factors to have less influence and resulting in more data being grouped into one community.
7 Conclusion
This study has conducted an in-depth analysis of the Baidu Index consultation search index to explore the interest levels in “professional competence” across various provinces in China, along with their time series characteristics. The data, sourced from Baidu, spans nearly 6 years, offering both macro and micro perspectives to observe the interest in “professional competence.”
By applying the visibility graph algorithm, we have transformed time series data into a complex network that describes the fluctuations in interest in professional competence over time. This transformation method has provided us with a novel angle to understand the data and has aided us in capturing both the short-term and long-term trends in interest. Additionally, we have explored whether the search data on professional competence in various provinces exhibit scale-free and fractal characteristics, providing robust theoretical support for further research.
Through systematic clustering of the data from each province, we have discovered significant disparities in interest levels in professional competence among different provinces. These variations may be related to the economic development, cultural backgrounds, and educational resources of each province. Moreover, we have identified the time window shift principle in interest in professional competence, which offers us an effective tool for capturing dynamic changes in the data.
Based on these insights, we propose three strategic recommendations for educators and policymakers:
Developing Unique and Tailored Educational Programs. Tailoring educational initiatives to align with the specific needs and interests of each province, taking into account their unique economic, cultural, and educational contexts, will enhance the relevance and impact of these programs.
Data-Driven Dynamic Curriculum Development. Utilizing real-time data analytics, such as those employed in this study, can assist in continuously updating and adjusting educational curricula and policies to meet both current and future competency needs.
Balancing Short-term and Long-term Educational Strategies. It is imperative to design educational and policy strategies that not only address immediate skill gaps but also foresee and prepare for future trends in professional competency.
In summary, this study offers a novel and comprehensive perspective on the interest in professional competence across China. The insights gained are intended to guide educators and policymakers in developing more effective and responsive educational strategies, thereby fostering a workforce well-equipped to meet the demands of the modern professional landscape.
This study also has certain limitations. The data source is limited to Baidu Index, which restricts the breadth and depth of the analysis. Additionally, there are limitations in the visibility graph network in accurately identifying and interpreting the complex dynamics behind these network structures. Although the study identified differences among different provinces, there is a lack of in-depth analysis regarding the specific reasons behind these differences and their concrete impacts on the attention to professional competencies. Future recommendations include strengthening the diversity and richness of data sources by incorporating more social, economic, and educational background data to enhance the accuracy and comprehensiveness of the research. Furthermore, it is suggested to develop more advanced analytical tools and methods to better understand and interpret the dynamic changes behind complex network structures and the specific impacts of these changes on the attention to professional competencies. Additionally, further research is needed to explore the specific reasons for differences in the attention to professional competencies among different regions and to investigate how policy interventions and educational resource allocation can improve the level of professional competencies in areas with low attention, thus providing strategic recommendations for achieving balanced development in vocational education.
Data availability statement
The original contributions presented in the study are included in the article/Supplementary material, further inquiries can be directed to the corresponding author.
Ethics statement
The studies involving humans were approved by the Yunnan Provincial Department of Education. The studies were conducted in accordance with the local legislation and institutional requirements. The participants provided their written informed consent to participate in this study.
Author contributions
SM: Writing–original draft. LH: Writing–review and editing. PM: Writing–review and editing.
Funding
The author(s) declare that financial support was received for the research, authorship, and/or publication of this article. This research was supported by the Yunnan Provincial Department of Education Scientific Research Fund Project (Grant No. 2022J0465) and the Research Project of Yunnan University of Finance and Economics (Grant No. 2016C07).
Acknowledgments
We would like to express our sincere gratitude for their financial support, which enabled the completion of this study.
Conflict of interest
The authors declare that the research was conducted in the absence of any commercial or financial relationships that could be construed as a potential conflict of interest.
Publisher’s note
All claims expressed in this article are solely those of the authors and do not necessarily represent those of their affiliated organizations, or those of the publisher, the editors and the reviewers. Any product that may be evaluated in this article, or claim that may be made by its manufacturer, is not guaranteed or endorsed by the publisher.
References
1. Hershberger J. An optimal visibility graph algorithm for triangulated simple polygons[J]. Algorithmica (1989) 4(1):141–155.
2. Majeed A, Lee S, Zaballos A, Corral G. Prototyping a web-of-energy architecture for smart integration of sensor networks in smart grids domain. Sensors (2018) 18(2):400. doi:10.3390/s18020400
3. Zhu G, Li Y, Wen P. Analysing epileptic EEGs with a visibility graph algorithm. Physica A: Stat Mech its Appl (2012) 391(3):946–54. doi:10.1109/bmei.2012.6513212
4. Jiang S. Analysis of heart rate variability signals based on visibility network methods. Nanjing: Nanjing University (2016).
5. Zhou L. Time series prediction algorithm and application based on visual graph and evidence theory. Chongqing: Southwest University (2022).
6. Zhou ZH. Analysis of vocational education network attention based on visual graph. Hunan Ind Vocational Tech Coll J (2023) 23(4):85–9. doi:10.13787/j.cnki.43-1374/z.2023.04.017
7. Yu X, Zhang JL, Liu JS. Current status and hotspot analysis of college students' data literacy. Xueyuan (2023) 16(36):43–5.
8. Zhang MY, Hu J, Yan G. Analysis of attention on China’s patent applications based on visibility graph networks. Comput Sci (2020) 47(8):189–94. doi:10.11896/jsjkx.200300001
9. Li HL, Zhang LP. A review of clustering research in time series data mining. J Univ Electron Sci Technol China (2022) 51(3):416–24.
10. Gao SY. Research on the cultivation strategy of vocational core competencies of higher vocational students from the perspective of integration of production and education. Guangzhou: Guangdong Technical Normal University (2023).
11. Jia N. Study on the cultivation path of vocational college students’ occupational literacy. Hangzhou: Zhejiang Normal University (2021).
12. Li G, Guan WD, Ma YX. Research on the social media visibility prediction of academic papers. Data Anal Knowledge Discov (2020) 4(08):63–74.
13. Li R, Fu WQ, Zhang YL. Research on preschool special education in China: hotspots, trends, and prospects—knowledge graph analysis based on core journal literature and master's and doctoral theses. J Suihua Univ (2023) 43(10):127–31.
14. Zheng JP, Hu YS. Study on the concomitant lag effect of port city based on time series network similarity model. Logistics Technol (2021) 44(10):12–8. doi:10.13714/j.cnki.1002-3100.2021.10.012
15. Shao KC, Liu YJ. Identification of key nodes in crisis rumor management based on social network analysis. Cybersecurity (2023) 14(03):20–5.
16. Chen KL, Song XH, Liu XQ. Spatio-temporal characteristics and influencing factors of camping activities network attention in China [J/OL]. Tourism Sci (2023) 26:1–15. doi:10.16323/j.cnki.lykx.20230923.001
17. Wan TH, Duan XF, Zhou YY. Research on the spatio-temporal characteristics and influencing factors of Jiangxi residents' Gan cuisine consumption demand based on network attention. J Sichuan Tourism Coll (2023) 2023(05):17–23.
18. Hua YL, Xu Y, Li GS. Spatio-temporal characteristics and influencing factors of China's ice and snow tourism network attention. Resource Develop Market (2023) 39(09):1209–17.
19. Shao Q, An L. Research on the mechanism of secondary disasters' impact on public emotions from the perspective of disaster chain. J Intelligence (2023) 42(09):91–7.
20. Zhou H, Zhang PY, Huang XY. Research on network public opinion perception from the perspective of event system [J/OL]. J Intelligence (2023) 1–9.
21. Liu XM, Chen P. Research on the impact of the COVID-19 pandemic on the stock price index of listed companies in China's sports industry: based on the perspective of network search data. J Zhejiang Sports Sci (2022) 44(06):26–32.
22. Xu JW, Wang W, Du J. Spatio-temporal differentiation of network attention pattern and influencing factors of red tourism in six provinces in the central region. J Chongqing Univ (Social Sci Edition) (2023) 29(02):82–96.
23. Liu JS, Qiu ZP, Yu CR. Spatio-temporal differences and influencing factors of attention on medical disputes between doctors and patients in China [J/OL]. Chin J Manage Sci (2023) 26:1–13.
24. Ren NN, Tong YR. Research on the development of du-ku highway tourism based on network text analysis. Border Economy Cult (2023)(09) 56–63.
25. Zhang Y, Wang ZW, Ye PQ. Research on the social effects of major ice and snow events on ice and snow sports based on Baidu Index analysis of Beijing Winter Olympics [J/OL]. Data Anal Knowledge Discov (2023) 26:1–20.
26. Lai JN. Development path of red tourism classic scenic spots—based on the evolution of network attention over time and space. Social Scientist (2022)(08) 44–51.
27. Zhao JY, Wu J, Li JY. Research on the spatio-temporal evolution characteristics of wine culture tourism network attention—taking zhangyu international wine city as an example. J Taishan Coll (2022) 44(05):62–73.
28. Liang L, Fu HY, Li JQ. Study on spatio-temporal dynamic evolution and influencing factors of network attention of internet celebrities cities—taking xi’an city as an example. Scientia Geographica Sinica (2022) 42(09):1566–76. doi:10.13249/j.cnki.sgs.2022.09.006
29. Wang C, Lu CB, Ba DX, Ma BB, Qin Z. Spatio-temporal evolution and influencing factors of network attention of representative ski resorts in China. J Nat Resour (2022) 37(09):2367–86. doi:10.31497/zrzyxb.20220912
30. Ding ZW, Ma FF, Zhang GS. Spatial differences and influencing factors of network attention of Chinese cities based on the number of douyin fans. Geographical Res (2022) 41(09):2548–67.
31. Li H, Cao H, Feng Y, Li X, Pei J. Optimization of graph clustering inspired by dynamic belief systems. IEEE Trans Knowledge Data Eng (2023) 1–14. doi:10.1109/tkde.2023.3274547
32. Hu J, Chu C, Criado R, Chen J, Hao S, Wang M. Visibility graph and graph convolution networks-based segmentation of carbon emission in China. Ann Operations Res (2023) 1–22. doi:10.1007/s10479-023-05623-9
33. Hu J, Chu C, Zhu P, Yuan M. Visibility graph-based segmentation of multivariate time series data and its application. Chaos: Interdiscip J Nonlinear Sci (2023) 33(9):093123. doi:10.1063/5.0152881
34. Li HJ, Feng Y, Xia C, Cao J. Overlapping graph clustering in attributed networks via generalized cluster potential game. ACM Trans Knowledge Discov Data (2023) 18(1):1–26. doi:10.1145/3597436
35. Ma J, Li M, Li HJ. Robustness of the international wheat trade network. IEEE Trans Netw Sci Eng (2023) 11:14–23. doi:10.1109/tnse.2023.3283251
36. Wang Y, Zhou HT, Yue TY. Study on the prediction model of pulmonary tuberculosis based on Baidu Index [J/OL]. Dis Monit (2023) 26:1–10.
37. Li Y, Qiao J, Han X, Zhao Z, Kou J, Zhang W, et al. Needs, challenges and countermeasures of SARS-CoV-2 surveillance in cold-chain foods and packaging to prevent possible COVID-19 resurgence: a perspective from advanced detections. China Market (2022) 15(26):120–2. doi:10.3390/v15010120
38. Wang J, Du WJ, Xue T. Analysis of the prevalence characteristics of allergic rhinitis and related allergic diseases in China using Baidu Index [J/OL]. J Otolaryngol Head Neck Surg Shandong Univ (2023) 26:1–16.
39. Zhang YF, Ren YL, Liang LM. Spatio-temporal differences and influencing factors of attention on ice and snow tourism network in China: empirical data based on Baidu Index 2011-2020 [J/OL]. World Geogr Res (2023) 1–15.
40. Hu J, Chu C, Zhu P, Yuan M. Visibility graph-based segmentation of multivariate time series data and its application. Chaos: Interdiscip J Nonlinear Sci (2023) 33(9):093123. doi:10.1063/5.0152881
41. Cheng L, Zhu P, Sun W. Time series classification by Euclidean distance-based visibility graph. Physica, A Stat Mech its Appl (2023) 625:129010.
42. Zhu P, Wang B, Tang K, Zhang H, Cui X, Wang Z. A knowledge-guided graph attention network for emotion-cause pair extraction. Knowledge-Based Syst (2024) 286:111342. doi:10.1016/j.knosys.2023.111342
43. Cheng L, Zhu P, Tang K, Gao C, Wang ZG. Source detection in graphs with incomplete nodes via positional encoding and attentive fusion. Arxiv preprint arxiv 2403.00014 (2024).
Keywords: visible network graphs, professional competency, awareness, Baidu search index, complex networks
Citation: Meng S, Han L and Mou P (2024) Analysis of professional competency awareness based on visible network graphs. Front. Phys. 12:1341725. doi: 10.3389/fphy.2024.1341725
Received: 20 November 2023; Accepted: 11 April 2024;
Published: 07 May 2024.
Edited by:
Xiaoke Xu, Dalian Nationalities University, ChinaReviewed by:
Peican Zhu, Northwestern Polytechnical University, ChinaHui-Jia Li, Beijing University of Posts and Telecommunications (BUPT), China
Copyright © 2024 Meng, Han and Mou. This is an open-access article distributed under the terms of the Creative Commons Attribution License (CC BY). The use, distribution or reproduction in other forums is permitted, provided the original author(s) and the copyright owner(s) are credited and that the original publication in this journal is cited, in accordance with accepted academic practice. No use, distribution or reproduction is permitted which does not comply with these terms.
*Correspondence: Lidan Han, bGlkYW5oYW4xOUAxNjMuY29t
 Shilin Meng
 Lidan Han3*