 Xun Yang
 Shanchuan Yu1,2*
- 1China Merchants Chongqing Communications Research and Design Institute Co., Ltd., Chongqing, China
- 2Research and Development Center of Transport Industry of Self-driving Technology, Chongqing, China
- 3Gansu Provincial Highway Aviation Tourism Investment Group Co., Ltd., Gansu, China
- 4Shandong Hi-speed Company Limited, Shandong, China
- 5Guangxi Computing Center Co., Ltd., Guangxi, China
Due to the harsh environment of highway tunnels and frequent breakdowns of various detection sensors and surveillance devices, the operational management of highway tunnels lacks effective data support. This paper analyzes the characteristics of operational surveillance data in highway tunnels. It proposes a multimodal information fusion method based on CNN–LSTM–attention and designs and develops a digital twin for highway tunnel operations. The system addresses issues such as insufficient development and coordination of the technical architecture of operation control systems, weak information service capabilities, and insufficient data application capabilities. The system also lacks intelligent decision-making and control capabilities. The developed system achieves closed-loop management of “accurate perception–risk assessment–decision warning–emergency management” for highway tunnel operations based on data-driven approaches. The engineering demonstration application underscores the system’s capacity to enhance tunnel traffic safety, diminish tunnel management costs, and elevate tunnel driving comfort.
1 Introduction
Tunnels are vital infrastructures on national highway networks. As of the end of 2021, there were 23,268 road tunnels in China, with a total length of 24,698.9 km, an increase of 1,952 tunnels and 2,699.6 km, of which there were 1,599 special long tunnels with a length of 7,170.8 km and 6,211 long tunnels with a length of 10,844.3 km [1]. To supervise the operation of highway tunnels, tunnels are equipped with electromechanical systems which consist of communication and monitoring facilities. During the construction and operation of highway tunnel electromechanical systems, a large amount of experience has been accumulated and complete engineering technical specifications and related product standards have been formed, laying a good foundation for realizing intelligent management and control of highway tunnel operations. With the large-scale construction and operation of Chinese tunnels, especially the increasingly mature digital tunnel monitoring technology, most highway tunnels currently use area control and switch ring network control transmission technology, which has realized equipment control and data monitoring management inside the tunnel, and the technology is mature and stable [2].
As early as the 1960s, countries such as the United States, Germany, and Japan began researching about the mechanical and electrical control systems of highway tunnels. In the mid-1970s, Japan’s OMRON Corporation studied a controller link network control technology that could form a redundant token ring network with autonomous control capabilities. In the mid-1980s, Germany’s Phoenix Contact Corporation researched an INTERBUS fieldbus technology that is suitable for network technology in the automatic control field. Based on the INTERBUS technology, a highway tunnel operation control system can perform distributed monitoring of the mechanical and electrical equipment in single-tube two-way highways or dual-tube one-way highways. Each tunnel can have an independent centralized monitoring center. In the mid-1990s, the United States' Echelon Corporation introduced a LonWorks distributed highway tunnel monitoring system, which was developed based on Echelon’s OpenLNS Server software platform and possessed characteristics such as distribution, openness, interoperability, and adaptability. These research results have been widely recognized by the industry and have become mainstream standards for control networks, widely applied in the mechanical and electrical control of highways and tunnels worldwide [3–5].
Since the beginning of the 21st century, countries have gradually improved the theoretical and technical aspects of highway tunnel operation safety monitoring. The United States, Germany, and other countries have formulated technical standards and traffic control regulations for highway tunnel operation management systems, while continuously researching and developing updated highway monitoring facilities and software systems with the application of new technologies [6–9]. Research on tunnel operation management technology in China began in the 1980s. Researchers gradually conducted research on tunnel structural design, safety construction monitoring, and operational safety management. The Shanghai Yan’an East Road Tunnel and the Shenzhen Wutongshan Tunnel were the earliest to introduce foreign tunnel monitoring systems for application. The Zhongliangshan Tunnel and the Jinyunshan Tunnel of the Chongqing–Guizhou Highway also successively introduced advanced equipment from abroad. With the accumulation of experience in the construction and operation of highway electromechanical systems, a series of national standards and industry specifications related to highway tunnel traffic engineering design were formed. A number of successful cases have been established, such as the Hong Kong–Zhuhai–Macao Bridge long-span immersed tunnel monitoring and management platform, the Qinling–Zhongnanshan Mountain long tunnel monitoring and management platform, the Shandong Province Jilai Highway tunnel monitoring and management platform, and the CMCT’s new generation of intelligent highway tunnel management platform, which has laid a good foundation for achieving intelligent management and control of highway network traffic operation. In recent years, with the continuous advancement of China’s construction of a transportation power, provinces such as Shandong, Zhejiang, Jiangsu, Gansu, Henan, and Yunnan have successively issued local smart highway construction guidelines [10–15]. Industry software and hardware leaders such as Hikvision, Huawei, and Wanji also successively released smart highway overall solutions [16, 17]. As tunnels are key nodes of highways, higher requirements have been put forward for intelligent tunnel operation management systems [18–21].
The data in highway tunnels exhibit characteristics such as multiple sources and heterogeneity. Various pieces of electromechanical equipment inside the tunnel constantly generate a massive amount of data, including real-time monitoring data such as video, environmental conditions, and traffic data collected by vehicle detectors (e.g., traffic flow, speed, and occupancy). The equipment control parameters include ventilation-, lighting- and traffic-related ones. Due to the harsh operating environment in the tunnel, the operational data detection equipment, such as CO/VI detectors, wind speed and direction detectors, brightness detectors, and vehicle detectors, experiences frequent failures, leading to distorted monitoring data. This hampers the provision of data-based guidance for the precise control of ventilation, lighting, traffic, and guidance. Currently, research and application of data mining in highway tunnel monitoring systems are almost nonexistent, with few relevant research achievements. The road condition perception system on the Yanqing to Chongli highway employs LiDAR-vision fusion for road information acquisition [22]. However, this approach is hampered by the absence of an integrated data fusion process, leading to asynchronous radar and video data collection. This limitation results in a restricted range of data on individual vehicle operations. In contrast, the Jinghu Jilai Highway tunnels employ a more advanced traffic data collection system, integrating technologies such as laser radar, millimeter-wave radar, and panoramic cameras. The practical outcomes of this system reveal that traffic data collection, when based on a multi-sensor fusion approach, significantly surpasses the accuracy of target recognition achievable with a single sensor. Furthermore, the implementation of a bidirectional optimal estimation algorithm, built upon the fused data, enhances the reliability of traffic flow data collection.
In its role as a facilitator of intelligent highway tunnel operation, the current mechanical and electrical system still has the following problems in technology architecture, functional design, and operation management: the development of the system’s technical architecture is not enough, the coordination is insufficient, and it is difficult to adapt to the edge-cloud architecture; the system’s functions have relatively single information exchange modes and weak precision and timely information service functions, and the data intelligent aggregation, analysis, and application capabilities need to be improved urgently. Furthermore, the establishment of intelligent decision control capability remains a pending endeavor. This article initiates its exploration from the feature analysis of monitoring data pertinent to highway tunnel operations in Section 2. Aiming to significantly elevate the accuracy of highway tunnel operational status assessments, this is achieved through the implementation of a multimodal information fusion method grounded in CNN–LSTM–attention in Section 3. It designs and develops a digital twin system for highway tunnel operations in Section 4, realizing a closed-loop management of “precise perception–risk judgment–decision warning–emergency control” for highway tunnel based on data-driven approaches.
2 Acquisition and feature analysis of operational monitoring data for highway tunnels
2.1 Operational data collection of highway tunnels
The discrimination and control of the operating status of highway tunnels mainly rely on the monitoring facilities on site. Monitoring facilities generally include monitoring, control, and induction facilities. Monitoring facilities typically consist of vehicle detection facilities, environmental detection facilities, road anomaly detection facilities, video surveillance facilities, and alarm facilities [23–25]. Control and induction facilities include emergency call facilities, information release and control facilities, and local control facilities. The monitoring settings related to highway tunnel operation data collection mainly include vehicle detection sensors, light intensity detection sensors, carbon monoxide/visibility detection sensors, wind speed and direction detection sensors, and video image sensors, and the collection content, methods, and installation requirements are shown in Table 1.
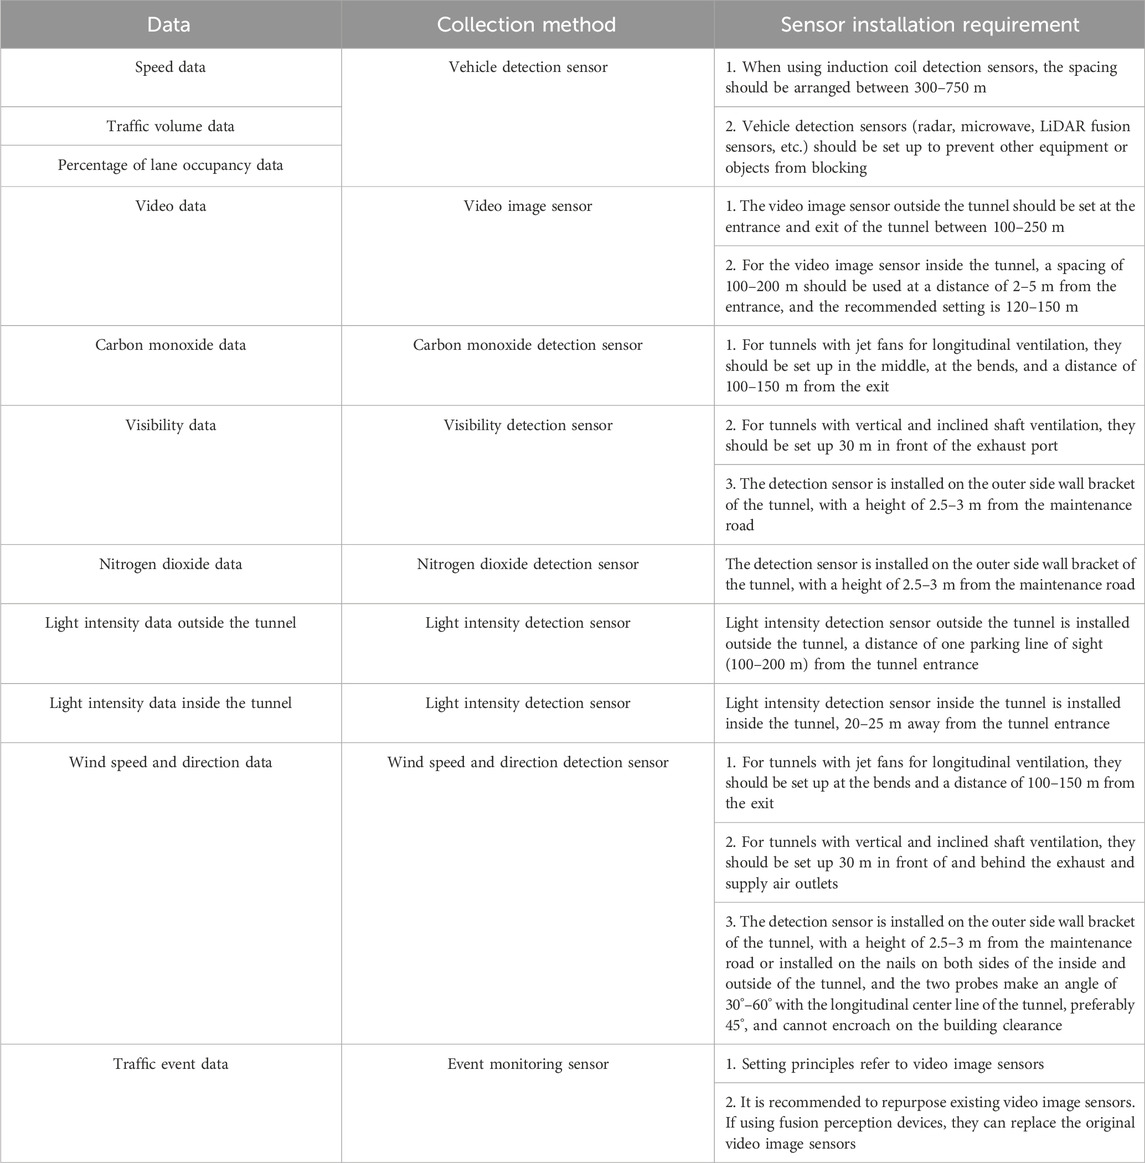
TABLE 1. Collection methods and requirements of highway tunnel operation data.
2.2 Characteristic analysis of highway tunnel operation data
In the process of managing the operation of highway tunnels, traffic and environmental conditions are the focus of attention for managers. The spatiotemporal variation of traffic volume and composition, as well as vehicle speed, can determine whether there are traffic safety hazards in the tunnel and whether the luminaires meet the requirements of traffic safety [26–28]. This paper selects data from ventilation, lighting, and traffic detection sensors for analysis. The data characteristics are shown in Table 2, and the data correlations are shown in Eqs 1–4. The data collected by the vehicle detection sensors and visibility detection sensors can be calibrated through video images [29–33], as shown in Figure 1.
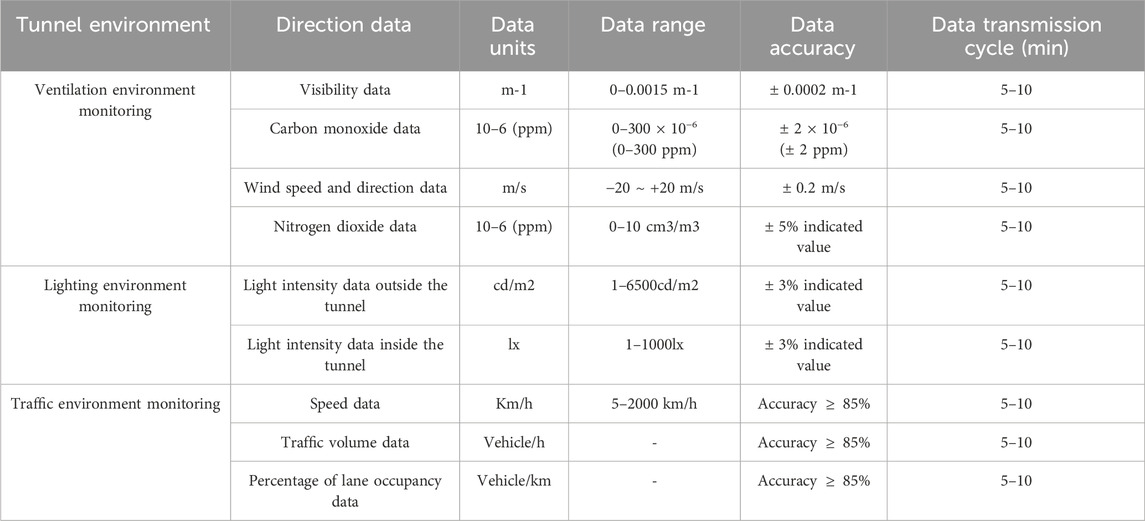
TABLE 2. Characteristics of highway tunnel operation data.
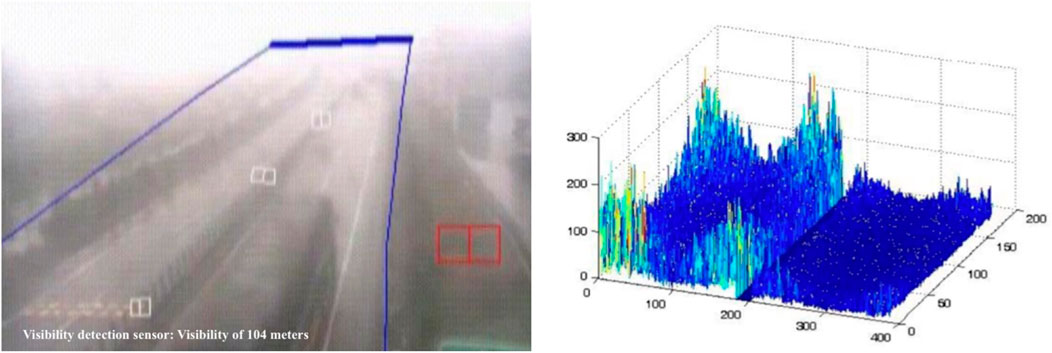
FIGURE 1. Image-based visibility detection and recognition.
This equation includes the following variables:
This equation describes the calculation of carbon monoxide (CO) emissions in a highway tunnel.
This equation includes the following variables:
In the field of tunnel vehicle operation data collection and processing, the integration of LiDAR-vision machines and edge processors can be utilized to sequentially accomplish the collection, recognition, and fusion of radar and video data. The steps are as follows: 1) The LiDAR-vision machine conducts real-time data collection of vehicles in the target area, acquiring both radar and video detection data. 2) The edge processor extracts radar and video detection data separately. It utilizes the YOLOv5 algorithm to extract vehicle type information from the video, and the 3DSSD radar target detection algorithm to extract vehicle position information. 3) The extracted target data undergo spatiotemporal synchronization. Through time registration, ineffective radar and video frames are eliminated. Spatial calibration is then applied to transform valid radar data into pixel space. 4) The region of interest (ROI) method is used to merge radar- and video-detected vehicle targets. Vehicle target information from both LiDAR and vision sources is fused based on detection distance, thereby achieving holographic perception of vehicles passing through highway tunnels.
However, the current operating environment in highway tunnels is harsh, with frequent malfunctions of operational data detection equipment such as carbon monoxide/visibility detection sensors, wind speed/direction detection sensors, brightness detection sensors, and vehicle detection sensors, making long-term stable operation impossible. While video imaging can be used to detect traffic flow, visibility, and other data, it is still difficult to accurately predict the overall operating status of the tunnel, and operational management decisions lack effective data support. Due to most tunnel data detection sensors currently being integrated into the tunnel monitoring system via PLC controllers, the data are first converted from digital to analog form and then back to digital form before being transmitted to the monitoring system. If the PLC devices lack effective maintenance, the precision of the data will not meet the requirements for tunnel operation management [34, 35]. In response to these issues, this article proposes a method based on multi-sensor fusion to discriminate the operating state of highway tunnels.
3 Prediction method of highway tunnel operation status based on multimodal data fusion
3.1 Highway tunnel operation status prediction model based on multimodal data fusion
The operational status of highway tunnels encompasses various aspects such as traffic operation status, the adaptability of traffic engineering and auxiliary facilities, the environmental adaptability of tunnel operations, and operational risk. These aspects can be quantitatively assessed through the status of tunnel infrastructure and data collected by sensors. The traffic operation status of tunnels can be determined using data from vehicle sensors. The adaptability of traffic engineering and auxiliary facilities can be assessed through the status data of tunnel electromechanical facilities. The environmental adaptability of tunnel operations can be evaluated using data collected by environmental sensors in the tunnel. Operational risks can be identified through event detection sensors. A comprehensive evaluation standard for the operational status of highway tunnels can be computed using multimodal data processing methods, which analyze the connections between various types of data.
This article combines the CNN–LSTM deep learning model with the self-attention mechanism to apply it to the judgment of tunnel operation status. The CNN–LSTM model is used to extract features from nonintrusive multimodal time series data, and the self-attention mechanism is used to integrate traffic flow, carbon monoxide, and visibility detection data, to effectively judge the tunnel operation service level by weighing the features of different modes [36]. The multimodal fusion architecture mainly includes four steps: preprocessing, feature extraction, feature fusion, and classification, as shown in Figure 2.
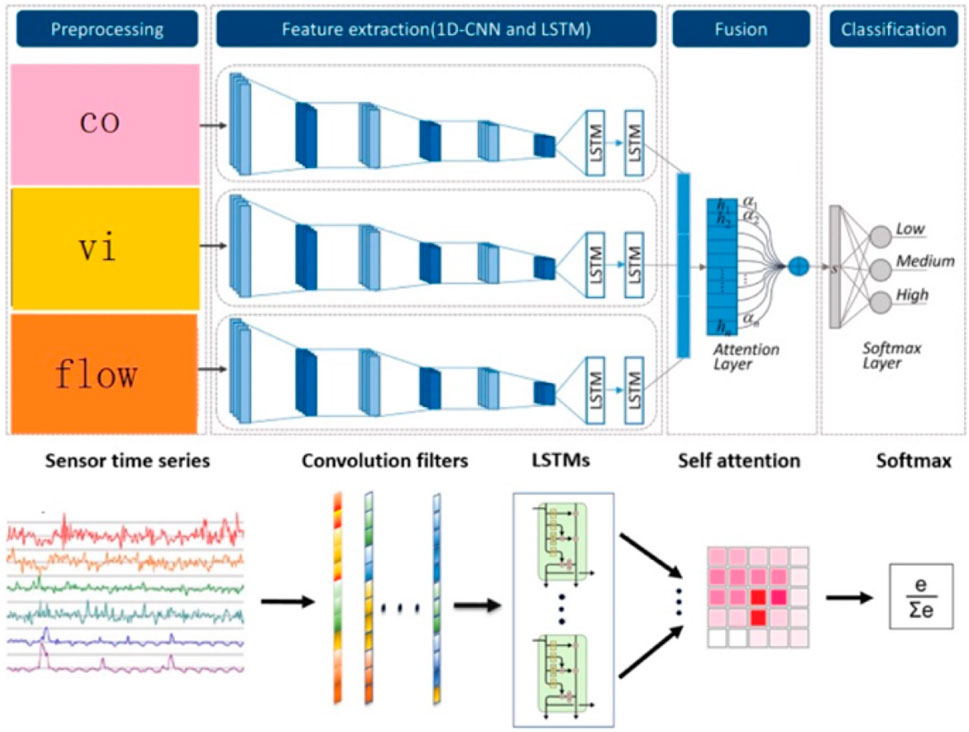
FIGURE 2. Multimodal fusion network architecture of tunnel operation monitoring data.
3.1.1 1D-CNN
The CNN model usually consists of three main components: the convolutional layer, pooling layer, and fully connected layer.
The role of the convolutional layer is to perform convolutional operation between the local region of the input data and the convolution kernel and slide the convolution kernel window to traverse the entire input data through local receptive fields. The convolution calculation equation is as follows:
In the equation,
The role of the pooling layer is to combine spatially, reducing the dimensionality of the feature map while maintaining the most important information. There are many types of it, and the maximum pooling is generally used, and its expression is
This sentence describes the max pooling operation in a CNN model.
3.1.2 LSTM
LSTM is an upgraded variant of RNN that adds gate structures internally, including input gates, forget gates, and output gates, which can adjust the values of input and hidden layers. The calculation process is as follows:
In the equation,
3.1.3 Attention mechanism
By using the attention mechanism, efficient allocation of information processing resources can be achieved. Due to the difference in the importance of features in short subsequences of long time series, significant features often contain more information and have a greater impact on the trend of actual demand. If CNN is given the ability to focus more on high-importance features, it can better extract short-term patterns and optimize LSTM input information [37]. Therefore, this paper uses the attention mechanism to extract significant features of short sequences.
The attention mechanism can be categorized into hard attention and soft attention. Hard attention selects the ROI as input and is effective in focusing on the target object by removing meaningless background data in image research. However, the direct restriction of input content processing method used in hard attention is not entirely suitable for time series prediction. Even if there are differences in the importance of input sequences, since each input subsequence contains certain information at different positions in the sequence, it cannot be identified and removed. Additionally, hard attention requires reinforcement learning optimization, which makes training difficult and less universal. In contrast, soft attention uses weights trained by neural networks to globally weight input features in space or channel, achieving the goal of focusing on specific spatial regions or channels. Moreover, this method is differentiable in backpropagation, allowing end-to-end learning and direct learning of attention networks. Based on these principles, this paper introduces soft attention into one-dimensional CNN, weighting all input features one by one, focusing on specific spatial regions and channels to achieve the significant and fine-grained feature extraction of time series.
3.1.3.1 SE attention mechanism
The purpose of the SE (squeeze-and-excitation) module is to apply a weight matrix from the channel domain perspective, assigning different weights to various positions in an image, thereby extracting more significant feature information.
To obtain channel-wise attention, the feature map is first globally average pooled based on its width and height, reducing spatial dimensions to 1 × 1. Then, two fully connected layers and nonlinear activation functions are used to establish connections between channels. The SE module first performs a “squeeze” operation on the convolutional feature map to obtain global channel-wise features and then performs an “excitation” operation to learn the relationships between channels and obtain weights for each channel. Finally, the original feature map is multiplied by the channel-wise weights to obtain the final feature. Essentially, the SE module performs attention operation on the channel dimension, allowing the model to focus more on the most informative channel features while suppressing those that are not important.
3.1.3.2 ECA attention mechanism
The SE attention mechanism first compresses the input feature map along the channel dimension, but this compression can have a negative impact on learning dependencies between channels. Based on this idea, the ECA attention mechanism avoids dimensionality reduction and efficiently implements local cross-channel interactions using a 1D convolution to extract inter-channel dependencies. The specific steps are as follows:
Step 1. Global average pooling is performed on the input feature map.
Step 2. A 1D convolution operation is performed with a kernel size of k, and the sigmoid activation function is applied to obtain the weight w for each channel, as shown in the following equation:
Step 3. The weights are multiplied with the corresponding elements of the original input feature map to obtain the final output feature map. The idea and operation of the ECA attention mechanism are extremely simple and have minimal impact on network processing speed. However, ECA attention only uses channel attention, and its accuracy still needs to be verified for specific application scenarios.
3.1.3.3 Convolutional block attention module
The convolutional block attention module (CBAM) combines the two-dimensional attention mechanism of feature channel and feature space, and the structure diagram is shown in Figure 3.
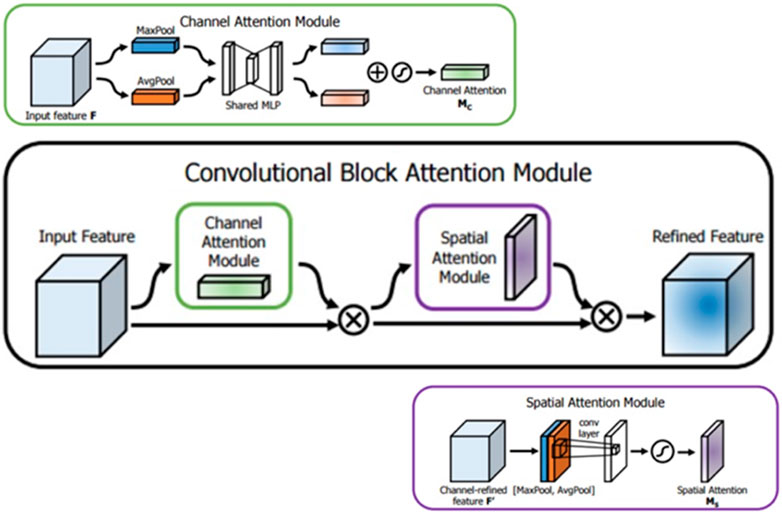
FIGURE 3. CBAM attention mechanism structure diagram.
The CBAM, like SE-Net, automatically learns the importance of each feature channel. Additionally, it learns the importance of each feature space in a similar manner. By utilizing the importance levels obtained, the CBAM enhances relevant features and suppresses those less important for the current task.
The CBAM extracts channel attention in a manner largely similar to SE-Net, as demonstrated in the code for channel attention. Building upon the foundation of SE-Net, the CBAM introduces an additional feature extraction method using max pooling, while the remaining steps are identical. The features extracted from channel attention serve as inputs for the spatial attention module.
In the CBAM, the method for extracting feature space attention involves processing the feature maps through channel attention to prioritize channels based on their importance. These feature maps are then fed into the spatial attention module. Similar to the channel attention module, spatial attention involves processing the channels through both maximum and average pooling. The results of these two processes are concatenated, followed by a convolutional operation to reduce them into a 1WH feature map, representing spatial weights. These weights are then applied to the input features through a point-wise multiplication, thereby implementing the spatial attention mechanism.
3.1.3.4 Temporal pattern attention mechanism
Temporal pattern attention (TPA) is used for multivariate time series forecasting. First, a large number of time series are fed into LSTM to obtain a hidden state matrix H. For each row (ith row) of the hidden state matrix H, k CNN filters are used to extract features, resulting in an
For
Each row is weighted and summed to obtain
When predicting
The first step is to synchronize the dynamic traffic detection data and environmental detection data. Abnormal data in the detection data are identified and replaced or removed intelligently. To reduce the data differences between different monitoring points, all data are normalized. Then, the sliding window method is used to divide each feature of each mode into time windows with a fixed window size and overlap. A new training dataset is composed of the generated time windows, with each label corresponding to the original dataset.
Next, the new training datasets for each mode are input into the 1D-CNN and LSTM framework to extract features. Segment time windows from the training dataset are first fed into the 1D-CNN to automatically learn features. Since the time window is a time series, a one-dimensional convolution layer is used. The feature extraction framework consists of three one-dimensional convolution layers, three max pooling layers, and two LSTM layers, with detailed parameter settings shown in Table 3. The convolution layer uses a sliding filter to extract effective features. The activation function of the convolution layer is chosen as the exponential linear unit (ELU), which can accelerate convergence and improve the robustness of the model. After each convolution layer, a max pooling layer is used to reduce the amount of data to half the original size. A dropout layer is used after the pooling layer to avoid overfitting. In each training epoch, a random subset of the neurons in the dropout layer is selected and not allowed to participate in weight optimization. After three layers of convolution and pooling, the input data are transformed into a high-dimensional feature map. Since the feature map is extracted from the time window, and the convolution and pooling operations do not change their time sequence, the feature map is directly input into two LSTM layers. The LSTM network handles time series through gate mechanisms, including forget gates, input gates, and output gates. They can control the discard or addition of information to achieve forgetting and memory. The LSTM network converts the feature map into the corresponding hidden state.
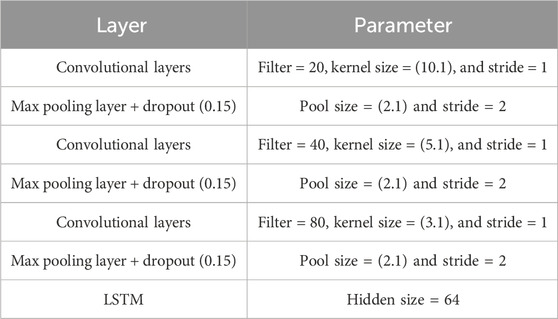
TABLE 3. 1D CNN–LSTM model parameters.
During the fusion step, the hidden states generated from the detection data are integrated to create a new feature map. This feature map contains hidden states and is denoted as H:
Due to the varying degrees of impact of different hidden states on tunnel operation monitoring, this paper introduces a self-attention mechanism to measure all hidden states. These hidden states are aggregated into a vector s through an attention layer, which is calculated using the following equation:
The hidden state
3.2 Example analysis
This article focuses on predicting the air quality level in tunnel operation using environmental detection data (carbon monoxide, visibility) and traffic detection data (vehicle flow) as the research object. The dataset consists of 10,500 sets of data collected automatically every 5 min from carbon monoxide/visibility sensors and integrated detection sensors, at the same location and time in the tunnel. Among them, 10,000 sets of data are used as training samples, and the remaining 500 sets are used as test samples. The sample data are combined into a feature vector using a CNN–LSTM–attention model, and this feature vector is set as the air quality level of tunnel operation to compare the predicted and actual states to test the accuracy of the proposed multimodal fusion algorithm for evaluating tunnel operation status.
3.2.1 Prediction process
The feature extraction framework for traffic detection data and environmental detection data mainly includes three steps: preprocessing, feature extraction, feature fusion, and classification. First, all data are normalized using min–max normalization. After preprocessing (missing and abnormal values), three types of environmental features (carbon monoxide, visibility, and vehicle flow) and traffic features are extracted. Finally, all traffic and environmental features are combined into a feature vector, which is then input into the classifier. A CNN–LSTM–attention network is used as the classifier for handcrafted traffic and environmental features.
The handcrafted multimodal data fusion method combines features from traffic detection data and environmental detection data into a feature vector, which is set as the air quality level of tunnel operation. Based on the corresponding historical air quality level of tunnel operation for traffic and environmental detection data at the same location and time in the tunnel, this feature vector is defined as a value between 0 and 1, where 0–0.4 is low, 0.4–0.8 is medium, and 0.8–1.0 is high. This vector is input into the CNN–LSTM–attention network, and the predicted air quality level of tunnel operation is compared with the actual state.
3.2.2 Prediction results
The CNN–LSTM–attention network effectively fuses data from different modalities by allocating different weights to different features through the self-attention mechanism. The prediction results of different attention mechanisms, including CNN–LSTM–BASE, CNN–LSTM–ECA, CNN–LSTM–SE, CNN–LSTM–CBAM, and CNN–LSTM–TPA, without adding the self-attention mechanism are compared, and the samples between 200 and 500 are selected. The accuracy of the evaluation algorithm under different attention mechanisms is different. The prediction results of each model are shown in Figure 4.
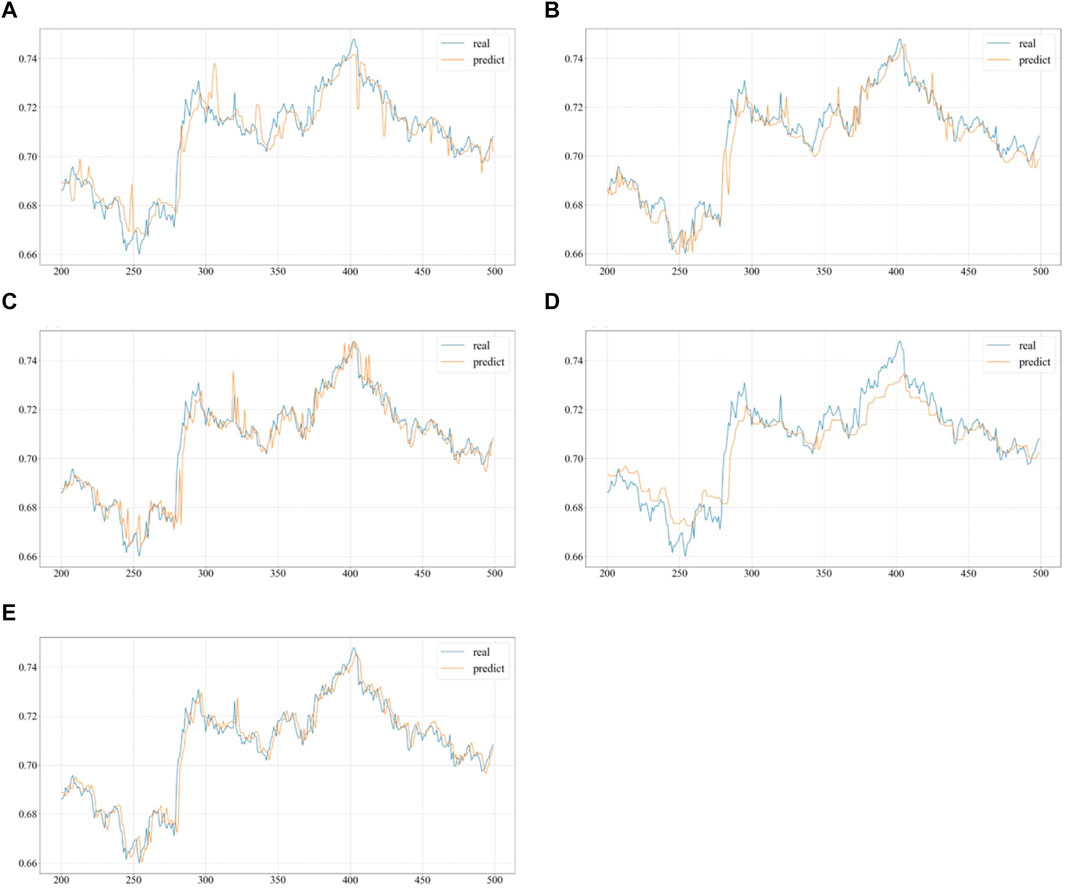
FIGURE 4. CNN–LSTM test results. (A) CNN-LSTM-base test results. (B) CNN-LSTM-ECA test results. (C) CNN-LSTM-SE test results. (D) CNN-LSTM-CBAM test results. (E) CNN-LSTM-TPA test results.
3.2.3 Evaluation metrics
The root mean square error (RMSE) is used as the measure of accuracy, which is the square root of the sum of the squared differences between the predicted values and the actual values, divided by the number of observations m.
3.2.4 Evaluation results
The evaluation results of each model on the test set are shown in Table 4, and the confusion matrix is shown in Figure 5.
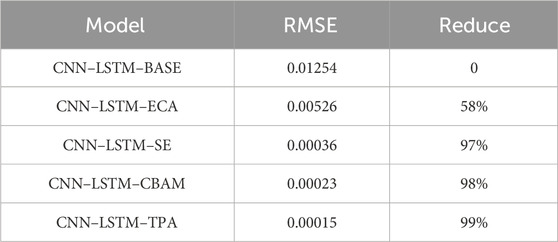
TABLE 4. Test results.
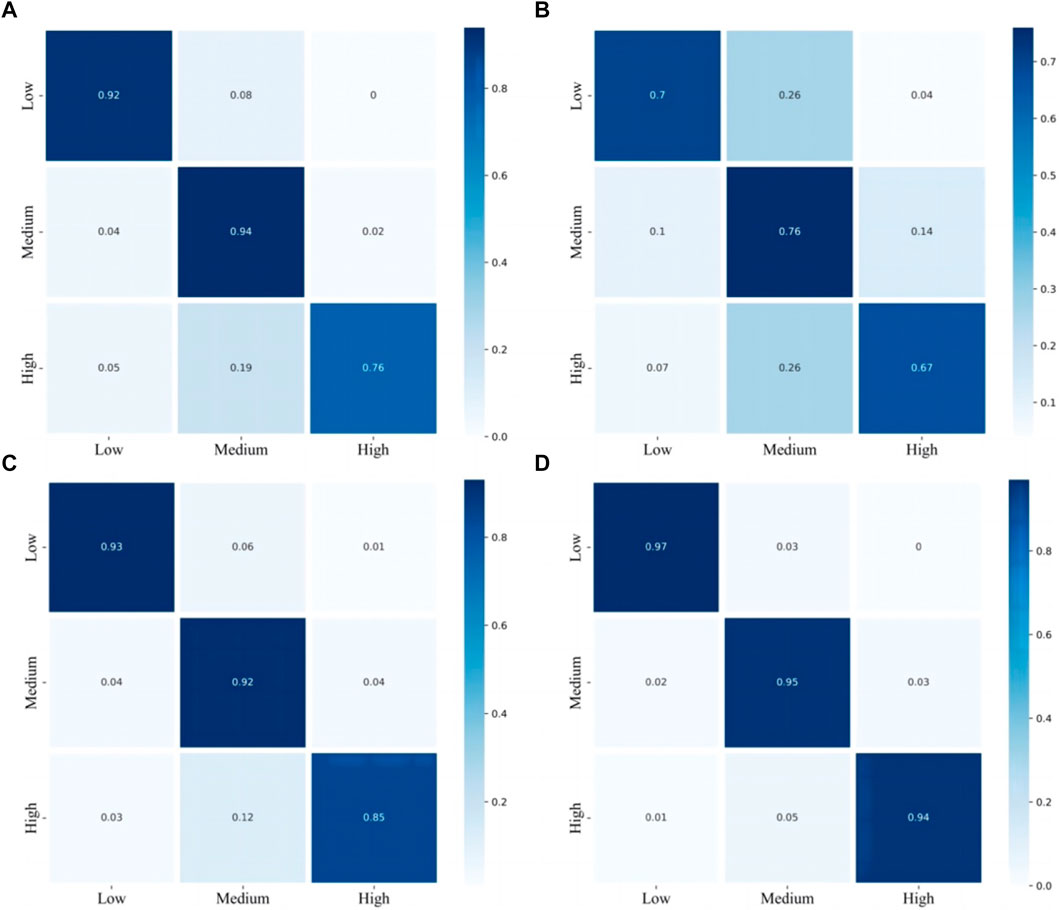
FIGURE 5. Confusion matrix. (A) CNN-LSTM-SE test results. (B) CNN-LSTM-ECA test results. (C) CNN-LSTM-CBAM test results. (D) CNN-LSTM-TPA test results.
Based on the test results shown in Figure 5, the predictions of the CNN–LSTM–attention model for tunnel operation air quality levels are very close to the true values. According to the RMSE test results in Table 4, the CNN–LSTM–ECA, CNN–LSTM–SE, CNN–LSTM–CBAM, and CNN–LSTM–TPA models reduced RMSE by 58%, 97%, 98%, and 99%, respectively, compared to the CNN–LSTM–BASE model without the self-attention mechanism.
The confusion matrix shown in Figure 5 indicates that the CNN–LSTM–SE model achieved prediction accuracy rates of 0.76, 0.93, and 0.92 for high, medium, and low levels of tunnel operation air quality, respectively. This suggests that the SE attention mechanism can effectively predict the low and medium levels of tunnel operation air quality. The CNN–LSTM–ECA model achieved prediction accuracy rates of 0.76, 0.70, and 0.63 for high, medium, and low levels of tunnel operation air quality, respectively, indicating that the ECA attention mechanism had moderate performance in predicting the high, medium, and low levels of tunnel operation air quality. The CNN–LSTM–CBAM model achieved prediction accuracy rates of 0.85, 0.92, and 0.93 for high, medium, and low levels of tunnel operation air quality, respectively, indicating that the CBAM attention mechanism can effectively predict the low and medium levels of tunnel operation air quality. The CNN–LSTM–TPA model achieved prediction accuracy rates of 0.94, 0.95, and 0.97 for high, medium, and low levels of tunnel operation air quality, respectively, indicating that the TPA attention mechanism can effectively predict the high, medium, and low levels of tunnel operation air quality.
From the test results and confusion matrix, it can be concluded that the CNN–LSTM–attention model has high prediction accuracy for tunnel operation air quality levels, with an average NMSE of 0.0015 and an average reduction of 70%. The multimodal fusion algorithm using the TPA attention mechanism achieved the best analysis and prediction performance.
4 Design and development of the digital twin system for highway tunnel operation
4.1 System architecture design
4.1.1 Overall structure
The digital twin system for highway tunnel operation is based on the current situation of the highway tunnel operation management system and monitoring system. It fully utilizes existing resources and constructs a highway tunnel operation data system with data homogeneity and business collaboration. The system is not only suitable for the current distributed architecture model of regional controllers and services but also adaptable to the future smart highway’s edge-cloud architecture [38–40], as shown in Figure 6. On the basis of ensuring the unity of data and business, the system can be efficiently iterated and updated to support the practical implementation of various innovative services for the future smart highway.
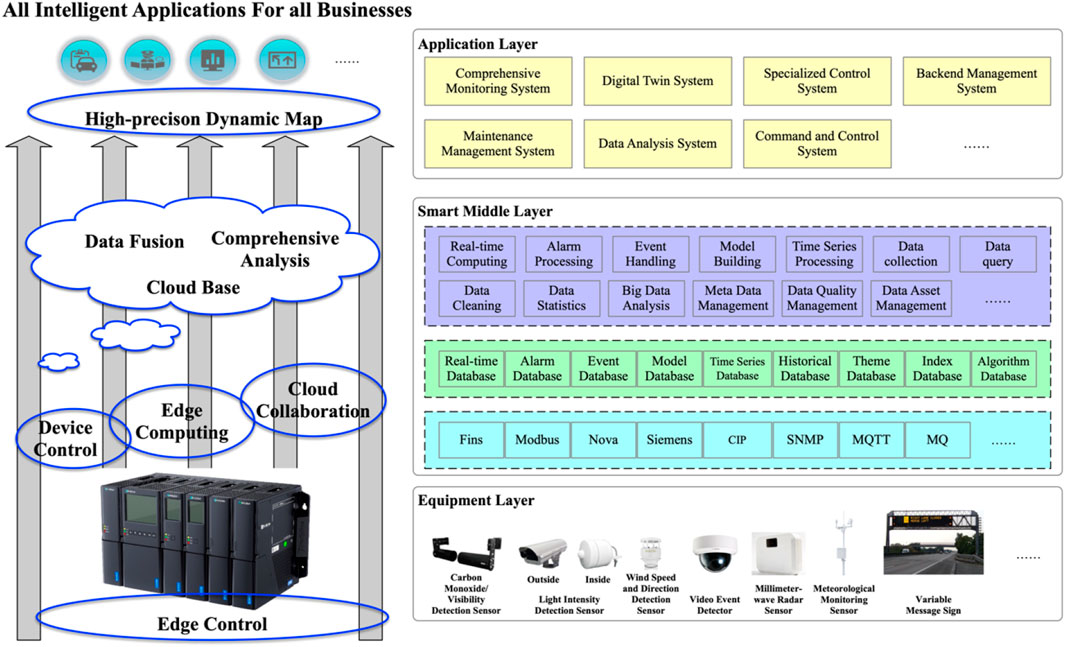
FIGURE 6. Schematic diagram of the overall system architecture.
4.1.2 Technical architecture
The digital twin system for highway tunnels adopts a middleware architecture for design and development, which extracts reusable capabilities from the business, data, technology, algorithms, and other aspects of highway tunnel operations management to form a middleware platform, as shown in Figure 7.
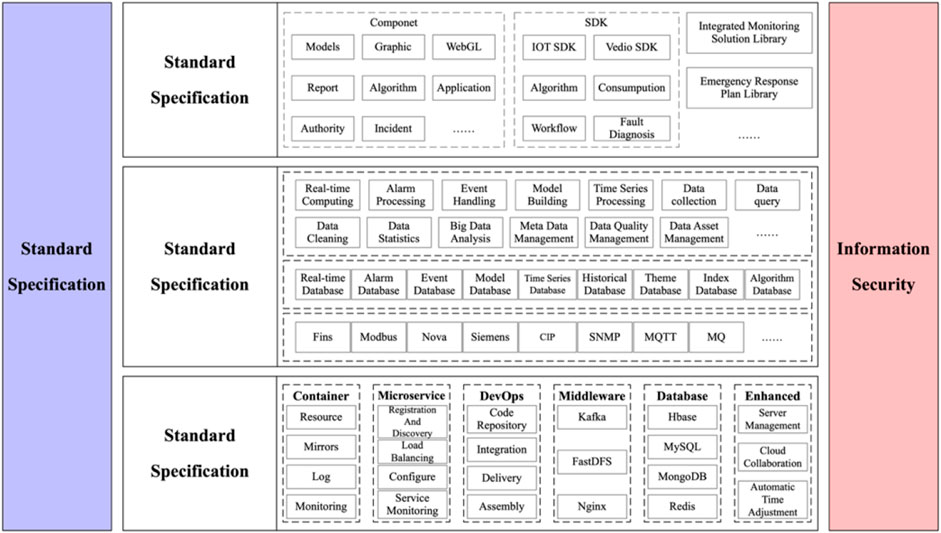
FIGURE 7. Schematic diagram of system technical architecture.
(1) Basic backend
The basic backend fully considers various equipment interfaces and communication methods. By incorporating Internet of Things (IoT) access modules with built-in multi-brand and multi-type device communication methods and protocols (such as TCP, WebSocket, UDP, and HTTP), it ensures reliable and stable communication and fast integration of tunnel electromechanical equipment. After unifying coding standards, it forms the highway tunnel basic database, business database, theme database, and shared database.
(2) Capability middleware
Business middleware: Precious business capabilities are precipitated into the business middleware to achieve business capability reuse and linkage and coordination between various business modules, ensuring stable and efficient critical business links and enhancing business innovation efficiency.
Data middleware: Highway operating data are uniformly managed to provide complete and accurate data services for various business applications, including data storage, processing, and management.
Technology middleware: Common facilities, development technology components, and services are integrated and packaged to provide simple, consistent, and easy-to-use basic infrastructure capability interfaces, which help the rapid development of upper-layer services.
(3) Application frontend
The application frontend is built around the core business of tunnel operation management and includes various function systems such as the tunnel basic information digital twin, field electromechanical equipment digital twin, comprehensive environmental information digital twin, real-time traffic operation digital twin, abnormal traffic event digital twin, daily operation management digital twin, and emergency linkage control digital twin, achieving the digitalization, three-dimensionalization, and precision monitoring and management of tunnel operation.
4.1.3 Business architecture
In daily management, the comprehensive monitoring system is the business core, which collects real-time detection data of highway tunnel, monitors the operation status, and completes daily monitoring management of traffic control, ventilation, lighting, etc. In abnormal events, it realizes zoning and intelligent linkage control based on the location of the event, emergency plan, and precise implementation of special plans, as shown in Figure 8.
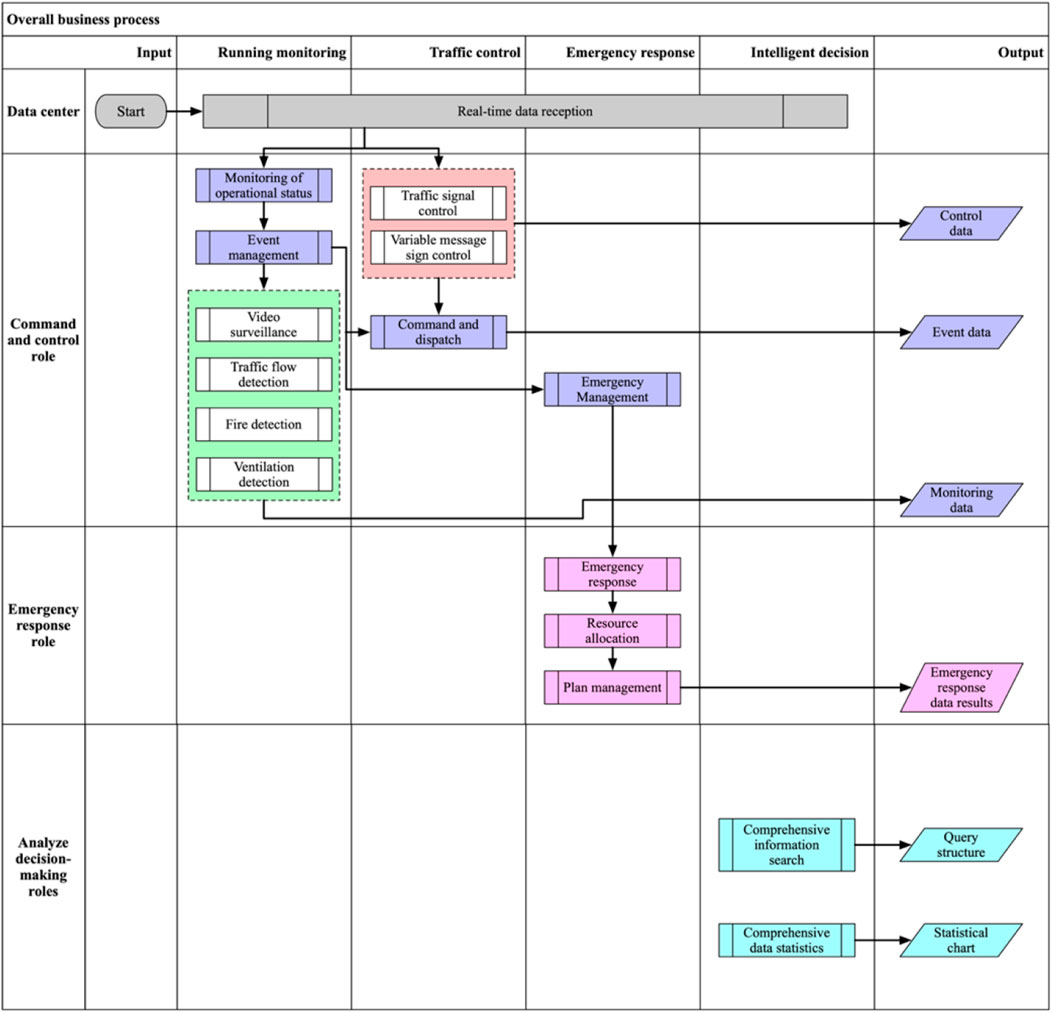
FIGURE 8. Schematic diagram of system business architecture.
4.2 Digital twin model
The digital twin system for highway tunnels divides the multidimensional data of highway tunnel operation and management into basic parameter data, electromechanical facility operation and functional data, civil engineering structure facility condition data, event data, and maintenance inspection data. According to the actual needs of the information project, a digital twin model can be established for the relevant data. For the convenience of data interconnection, the data of the existing highway tunnel can be converted and coded according to the coding format, and the data of the new highway tunnel can be coded according to the coding format requirements. The data categories of the highway tunnel digital twin model should include tunnel basic information, electromechanical facility status and operation function data, event data, and maintenance inspection data. The operation data should be coded according to a unified standard, with complete and accurate parameter information and following the “one source, one number” principle to avoid duplicate collection. Data should be managed and classified in a centralized manner, and the application types can include equipment and facility operation monitoring, traffic safety control, abnormal event handling, and public travel services. The digital twin system for highway tunnels should achieve information interconnection, integration, sharing, and exchange. The code of highway tunnel information model is shown in Table 5.
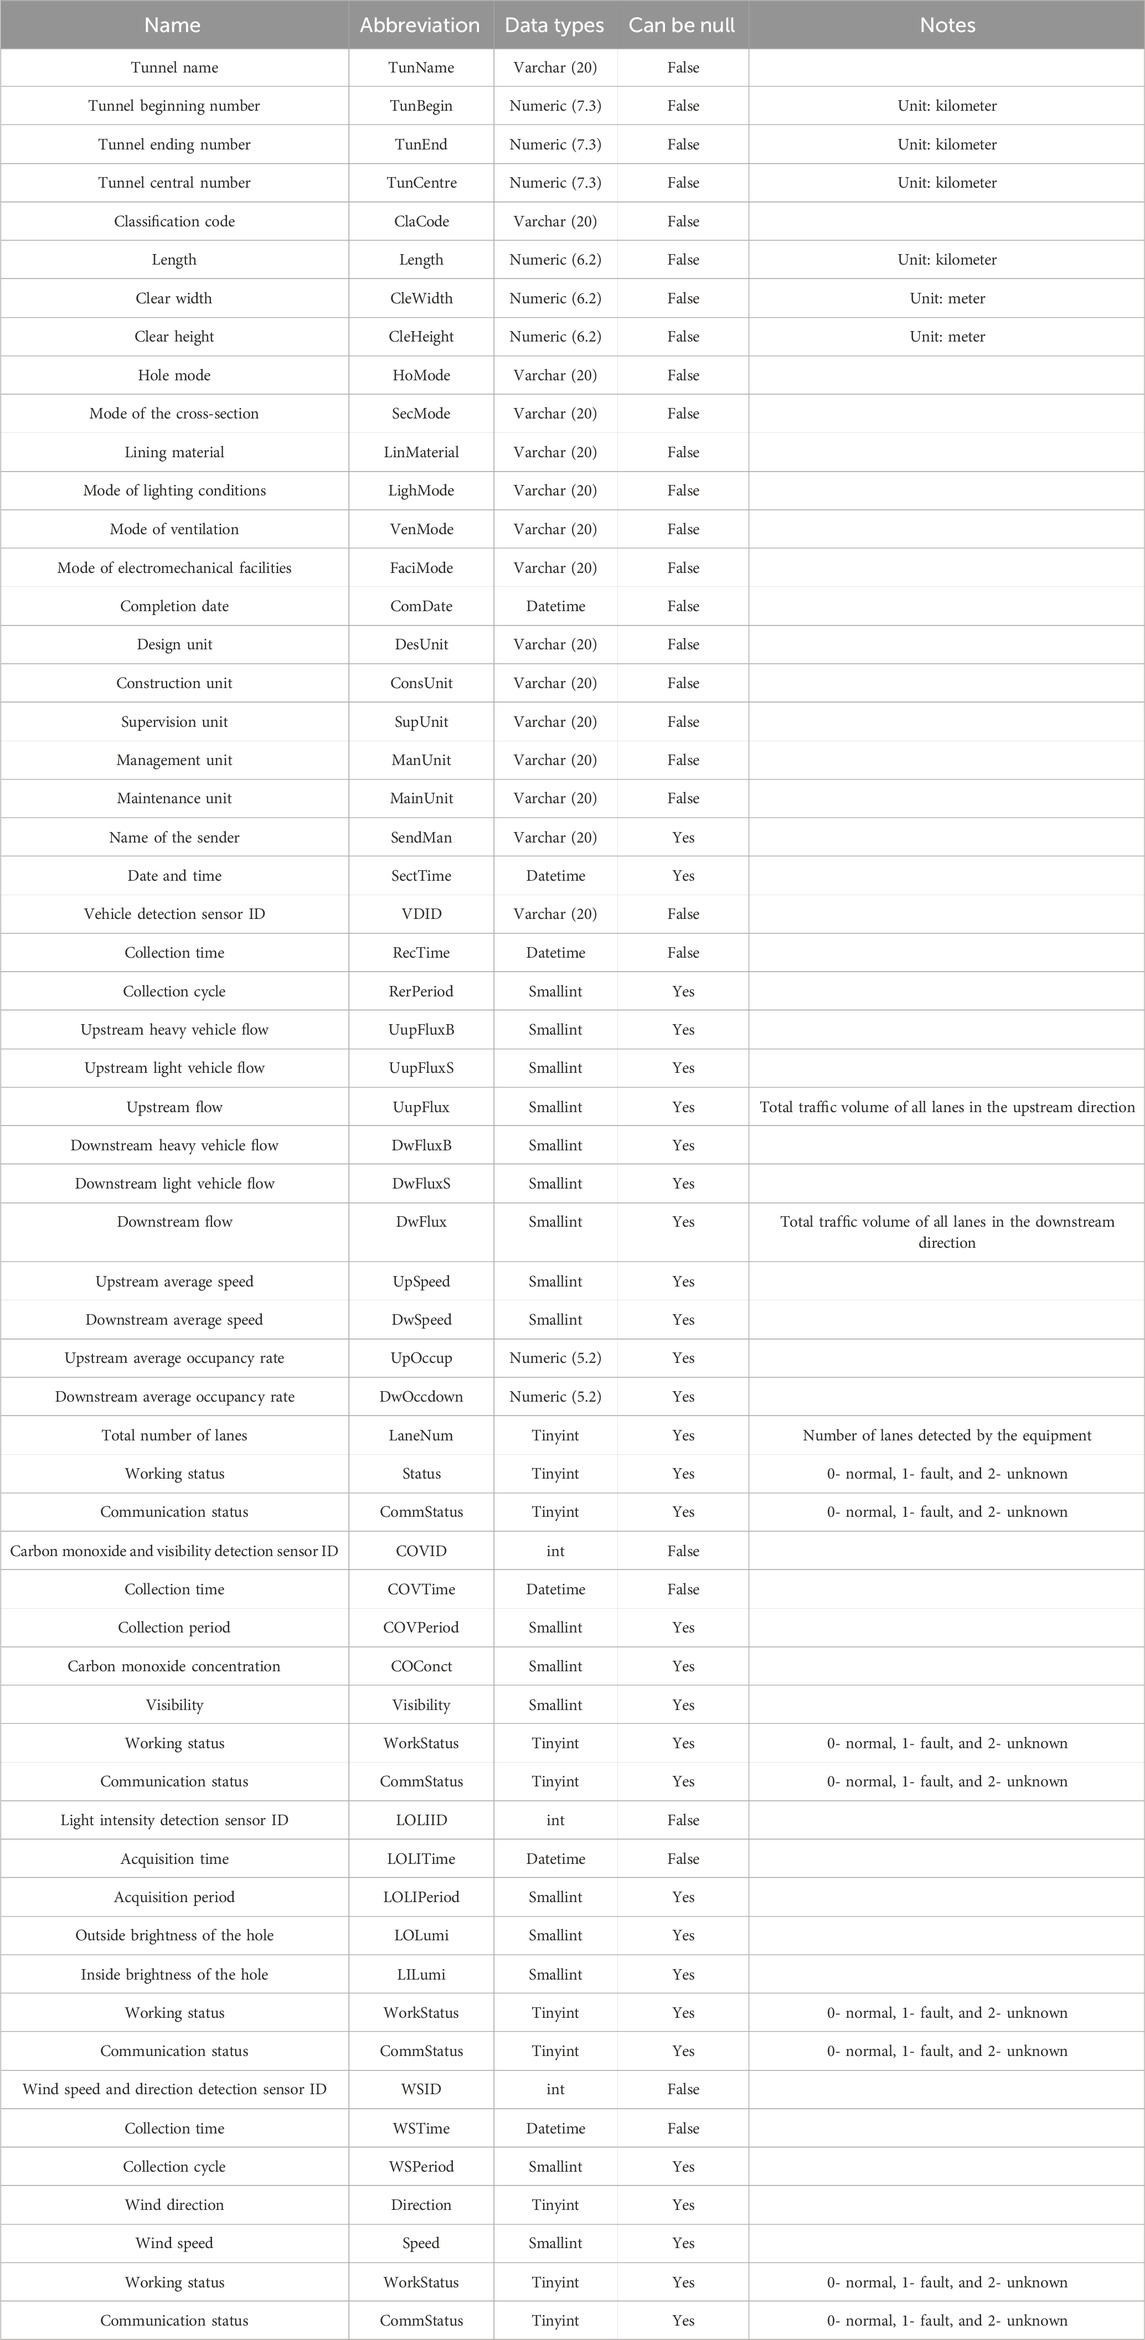
TABLE 5. Code of basic tunnel parameters.
In this article, 3D visualization modeling is conducted for the basic information, mechanical and electrical facilities, and operational environment detection data of the highway tunnel. The following are partial 3D visualization model prototype diagrams for some mechanical and electrical facilities.
4.3 System function research and development
The digital twin system for highway tunnels includes seven functional subsystems: comprehensive monitoring, digital twin, specialized control, maintenance management, command and dispatch, data analysis, and backend management. The subsystems share data and coordinate their operations to achieve unified control over 14 types of electromechanical equipment, such as ventilation, lighting, traffic control, and guidance. The system enables fine-tuned, modular, and intelligent control over ventilation and lighting dimming, as well as standardized and integrated classification control over the entire route guidance system. It also includes intelligent and linked control based on event types and rapid, standardized, and traceable command and dispatch based on eight types of frequently occurring event plans, as well as one-stop configuration management of basic data information.
The digital twin system for highway tunnel operations is a tangible representation of sensor data. Taking the precise perception of traffic volume data (such as cross-sectional traffic flow, regional traffic flow, vehicle violation information, and traffic event information) as an example, a holographic, visual, and digital model of vehicles passing through tunnels is established using vehicle positioning and trajectory fusion technologies. This model allows for the identification of vehicle violations such as wrong-way driving and illegal lane changes based on high-precision trajectory data and determines speeding or slow-moving vehicles based on their speed. Additionally, traffic event types are detected and classified using feature matching and deep learning techniques.
The multimodal information fusion algorithm plays a crucial role, especially when one or more sensors fail or provide erroneous detection data. By utilizing the spatiotemporal correlation between data, the algorithm calibrates and supplements problematic data, thereby deriving a comprehensive operational status evaluation indicator.
4.4 Engineering application verification
Multiple sensor fusion perception, multimodal data fusion, and digital twinning technologies have been applied to the highway tunnel operation control system. The system has been successfully implemented in more than 2,000 km of long tunnels in nine provinces, achieving the standardization of basic data, visualization of daily management, and process-based emergency control of tunnel operation management. The system collects highway tunnel operation monitoring data through multiple sensors and applies a multimodal information fusion method based on CNN–LSTM–attention to predict the highway tunnel operation status. The system supports the calculation of tunnel ventilation and lighting requirements under various operating conditions and improves the reliability and accuracy of tunnel operation intelligent control under normal conditions and can enable tunnel ventilation and luminaires to autonomously adjust based on external environmental changes. This adaptive regulation significantly reduces the energy consumption costs associated with tunnel operations. In tunnel lighting, lamps are the primary consumers of electrical energy. In practical applications, the system employs a smart lighting control method based on multi-parameter control. This approach effectively enhances the overall visual environment of the tunnel, reducing the adverse effects of tunnel black hole and white hole phenomena on driving safety. The lighting fixtures and other electromechanical facilities adaptively adjust according to external environmental changes, significantly reducing the energy consumption costs of tunnel operations. As a result, there is an approximate 20% reduction in the energy consumption costs of tunnel operation. By accurately monitoring tunnel environmental data and setting up fan interlocking control programs, it is possible to achieve a 100% qualification rate for air quality during the regular operation of the tunnel. In abnormal conditions, by proactively defining the control scope for tunnel emergencies, traffic management and electromechanical equipment interlock control plans are automatically generated based on real-time monitoring data (location and type of the event) for early warning. Once the monitor confirms the situation, they can simply click a confirmation button within the system to deploy the prearranged plan with a single click. This significantly enhances the capability for traffic accident prevention and control, as well as the emergency response to sudden incidents, ensuring that the emergency response time for exceptional events is less than 2 min. The number of tunnel traffic accidents has been reduced by over 25% for two consecutive years, effectively guaranteeing the “safe, smooth, and orderly” operation of the highway tunnel. Description of the digital twin system for highway tunnel operation is given in Table 6, and function pages of the system are shown in Figure 9.
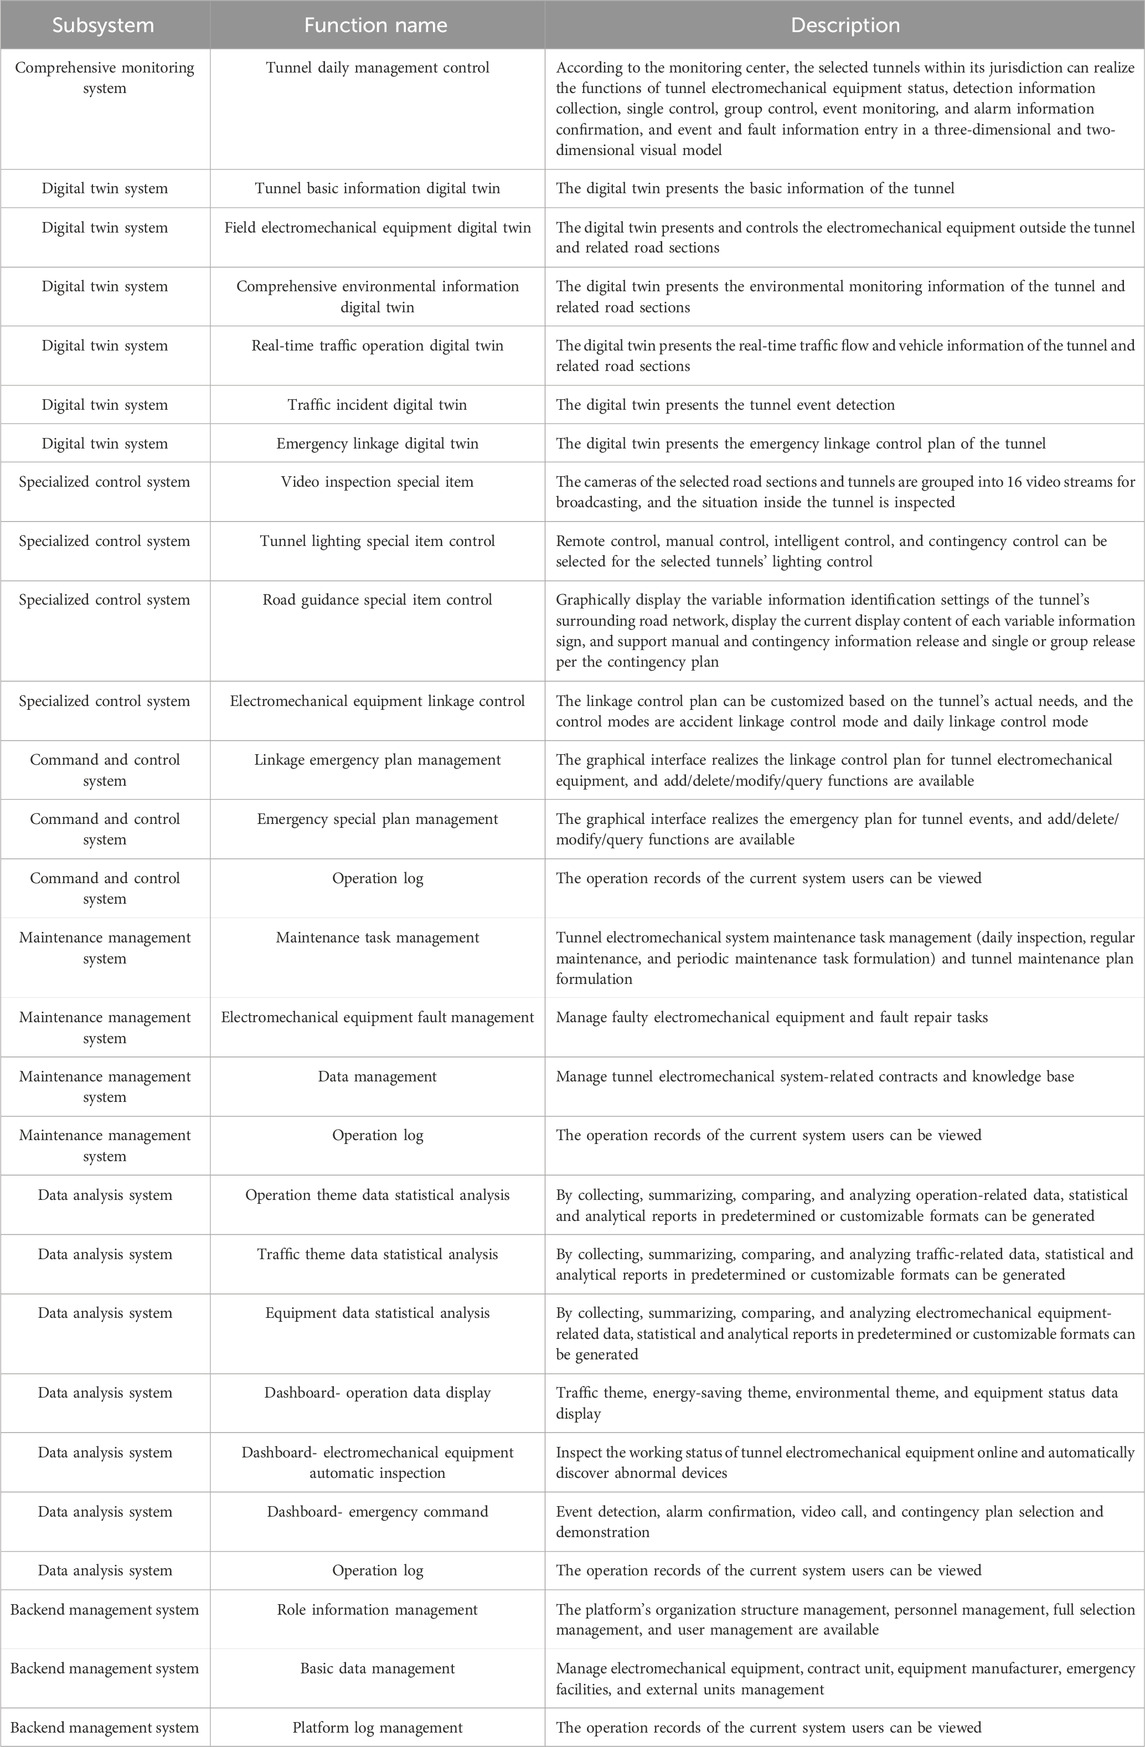
TABLE 6. Description of the digital twin system for highway tunnel operation.
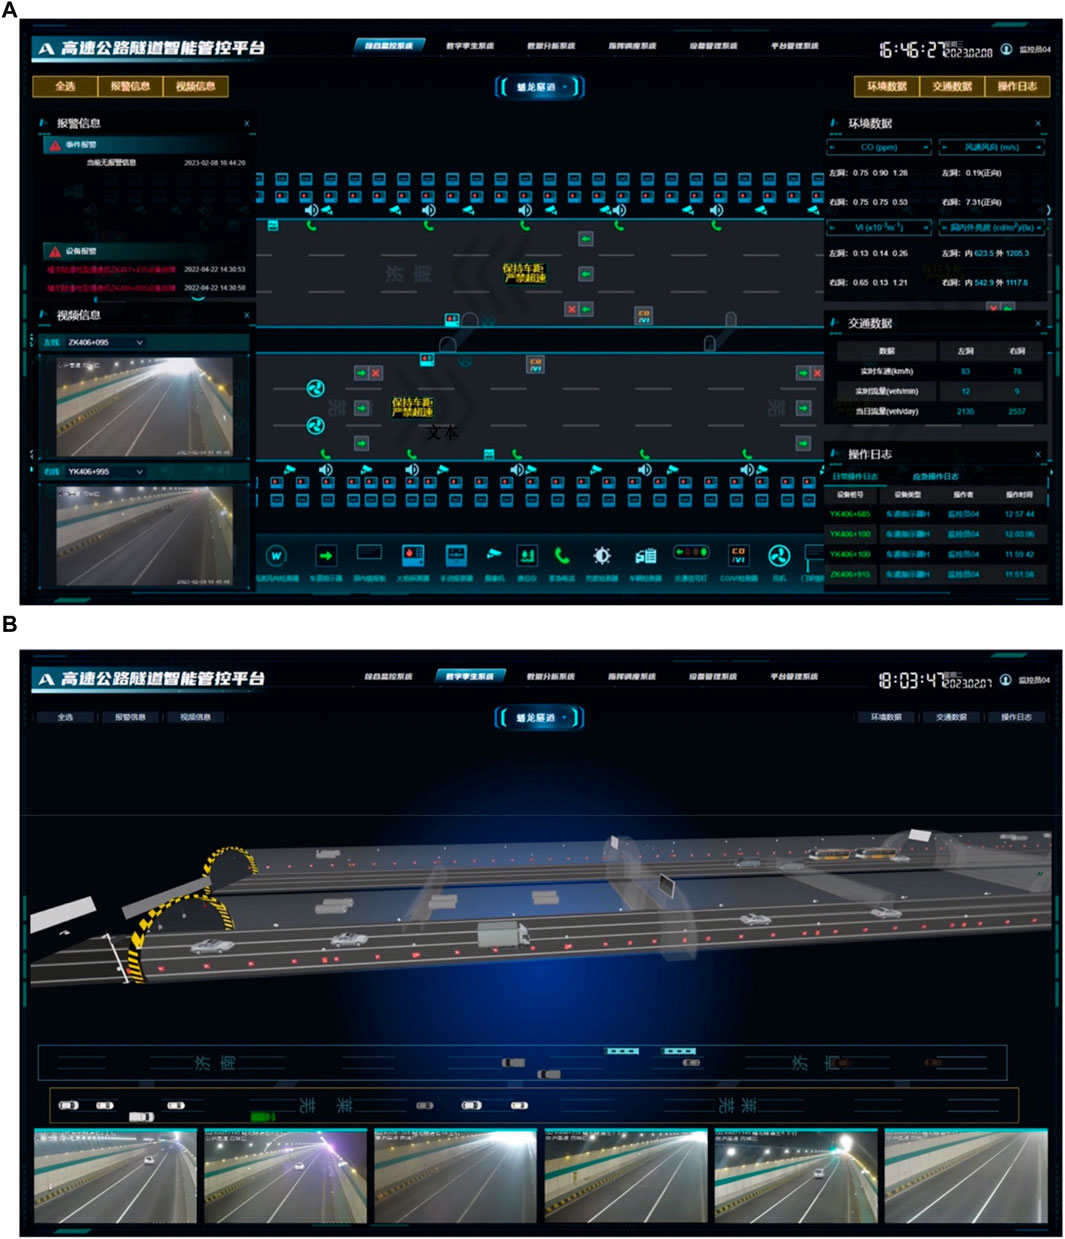
FIGURE 9. Digital twin system for highway tunnel operation. (A) Integrated monitoring system function page. (B) Traffic operation digital twin page.
5 Conclusion
This article tackles the challenge of frequent failures in operational data detection equipment within highway tunnels, including sensors for carbon monoxide/visibility, wind speed and direction, brightness, and vehicle detection. The harsh internal environment of tunnels makes accurate prediction of their operational state difficult, resulting in a lack of effective data support for management. To address these issues, this article advocates for the adoption of multi-sensor fusion perception and digital twin technology in the information infrastructure of highway tunnels. By creating a unified digital twin information model tailored to the tunnel’s operational characteristics, and applying a multimodal information fusion method based on CNN–LSTM–attention, the accuracy of highway tunnel operational status assessments has been markedly improved. This approach significantly enhances the stability and reliability of target recognition, reduces the likelihood of target omission, and, through data-driven methods, greatly improves the efficiency of tunnel ventilation and lighting control. The developed digital twin system for highway tunnels addresses centralized management, linkage control, data sharing, and business coordination challenges. Practical engineering results demonstrate that the system has bolstered tunnel traffic safety, reduced management costs, and improved the comfort of tunnel passage, thereby ensuring the “safety, smoothness, and orderliness” of highway tunnel operations.
Data availability statement
The raw data supporting the conclusion of this article will be made available by the authors, without undue reservation.
Author contributions
XY: conceptualization, methodology, and writing–original draft. SY: investigation and writing–original draft. JW: resources and writing–review and editing. HC: funding acquisition, resources, and writing–review and editing. YH: software and writing–review and editing. ZL: data curation and writing–review and editing. LF: funding acquisition and writing–review and editing.
Funding
The authors declare that financial support was received for the research, authorship, and/or publication of this article. This work was supported by the Key Technology Projects in the transportation industry of China for 2021 (No. 2021-MS6-145) and the Key Research and Development Program of Guangxi, China (Grant No. AB21196034).
Acknowledgments
The authors would like to thank the support of their colleagues in the Research and Development Center of Transport Industry of Self-driving Technology.
Conflict of interest
Authors XY, SY, ZL, and LF were employed by China Merchants Chongqing Communications Research and Design Institute Co., Ltd. Author JW was employed by Gansu Provincial Highway Aviation Tourism Investment Group Co., Ltd. Author HC was employed by Shandong Hi-speed Company Limited. Author YH was employed by Guangxi Computing Center Co., Ltd.
Publisher’s note
All claims expressed in this article are solely those of the authors and do not necessarily represent those of their affiliated organizations, or those of the publisher, the editors, and the reviewers. Any product that may be evaluated in this article, or claim that may be made by its manufacturer, is not guaranteed or endorsed by the publisher.
Supplementary material
The Supplementary Material for this article can be found online at: https://www.frontiersin.org/articles/10.3389/fphy.2024.1335494/full#supplementary-material
References
1. China Journal of Highway And Transport Editorial Department. Review of academic research on China's traffic tunnel engineering, 2022. China J Highw Transport (2022) 35(4):1–14. doi:10.19721/j.cnki.1001-7372.2022.04.001
2. Tu Y, Wang S, Wang X, Shi L, Li M, Zhou G, et al. F L. Discussion on Quality Upgrading of Highway Tunnels. Tunnel Construction (2019) 39(S1):1–9. doi:10.3973/j.issn.2096-4498.2019.S1.001
3. Han Z, Guan F. Study on collaborative management of intelligent highway tunnels. Tunnel Construction (2018) 38(04):533–7.
4. Amundsen FH, Ranes G. Studies on traffic accidents in Norwegian road tunnels. Tunnelling Underground Space Tech (2000) 15(1):3–11. doi:10.1016/S0886-7798(00)00024-9
5. Geva V, Shinar D, Blum Y. In-vehicle information systems to improve traffic safety in road tunnels. Transportation Res F Traffic Psychol Behav (2007) 11(1):61–74. doi:10.1016/j.trf.2007.07.001
6. Pachamanova A, Dessislava P. Optimization of the light distribution of luminaries for tunnel and street lighting. Eng Optimization (2008) 40(1):47–65. doi:10.1080/03052150701591160
7. Mashimo H. State of the road tunnel safety technology in Japan. Tunneling Underground Space Tech (2002) 17(2):145–52. doi:10.1016/s0886-7798(02)00017-2
8. Auboyer A, Andersen V, Wybo J-L. State-of-the-art road tunnel safety. Int J Emerg Manage (2007) 4(4):610–29. doi:10.1504/ijem.2007.015733
9. Wang S. The experience and enlightenment of the development of smart highways in the UK. Auto Saf (2020) 276(12):104–109. doi:10.3969/j.issn.1006-6713.2020.12.029
10. Wu J. Yanqing to Chongli Highway radar road condition sensing system. China ITS J (2021) 1(9):105–7. doi:10.13439/j.cnki.itsc.2021.01.009
11. Zhang J, Li B, Wang X. Design of architecture and development path of intelligent highway. J Highw Transportation Res Develop (2018) 35(1):88–94. doi:10.3969/j.issn.1002-0268.2018.01.012
12. Xia Y, Yan C, Wang X, Song X. Intelligent transportation information physical fusion cloud control system. Acta Automatica Sinica (2019) 45(1):132–42. doi:10.16383/j.aas.c180370
13. Cen Y, Song X, Wang D, Sun L, Liu N. Construction of smart highways technology system. J Highw Transportation Res Develop (2020) 37(7):111–21. doi:10.3969/j.issn.1002-0268.2020.07.015
14. Wang S, Zu H, Fu J, Ruan Z, Li M. Exploring the smart highway. China ITS J (2017) S1:10–7. doi:10.13439/j.cnki.itsc.2017.S1.001
15. Fu L, Xie S, Fan Z. The application of fuzzy matter-element model in the safety evaluation of highway tunnels operation. Technology Highw Transport (2015) 117(2):122–6. doi:10.13607/j.cnki.gljt.2015.02.027
16. Yuan Y, Cao B. Analysis on information infrastructure in the intelligent high-speed + Internet environment. China ITS J (2019) 11(237):139–41. doi:10.13439/j.cnki.itsc.2019.11.019
17. Du Y, Liu C, Wu D, Zhao C. Next-generation intelligent highway system architecture design. China J Highw Transport (2022) 35(04):203–14. doi:10.19721/j.cnki.1001-7372.2022.04.017
18. Li Y, Liu C, Yue G, Gao Q, Du Y. Deep learning-based pavement subsurface distress detection via ground penetrating radar data. Automation in Construction (2022) 142:104516. doi:10.1016/j.autcon.2022.104516
19. Li Y, Liu C, Gao Q, Wu D, Li F, Du Y. ConTrack distress dataset: a continuous observation for pavement deterioration spatio-temporal analysis. IEEE Trans Intell Transportation Syst (2022) 23(12):25004–17. doi:10.1109/tits.2022.3201968
20. Huval B, Wang T, Tandon S, Kiske J, Song W, Pazhayampallil J, et al. An empirical evaluation of deep learning on highway driving. Computer Sci V3 (2015) 1–3. doi:10.48550/arXiv.1504.01716
21. Iwasaki Y, Misumi M, Nakamiya T Robust vehicle detection under various environmental conditions using an infrared thermal camera and its application to road traffic flow monitoring. Sensors (2013) 13(6) 7756–73. doi:10.3390/s130607756
22. Wang M, Wang R. Application prospects of digital twin technology in the field of intelligent highways. China ITS J (2019) S1:34–5. doi:10.13439/j.cnki.itsc.2022.S1.008
23. Gongsong D, Wang L, Wang S. Energy consumption monitoring index system for highway tunnel operation period. Chin J Underground Space Eng (2020) 16(S1):407–12.
24. Wu X, Deng T, Chen B, Zeng T, Chen H, Zhang K. Research on compressed sensing of big data for structural health monitoring system of operating tunnel. Tunnel Construction (2021) 41(4):674–83. doi:10.3973/j.issn.2096-4498.2021.04.019
25. Xiao H. Research on the long-term operation structure health monitoring system of Shanghai dalian Road tunnel. China Municipal Eng (2016) 183(1):75–77. doi:10.3969/j.issn.1004-4655.2016.01.024
26. Yu S, Chen Y, Song L, Xuan Z, Li Y. Modelling and mitigating secondary crash risk for serial tunnels on freeway via lighting-related microscopic traffic model with inter-lane dependency. Int J En-vironmental Res Public Health (2023) 20:3066. doi:10.3390/ijerph20043066
27. Yu S, Shi L, Zhang L, Liu Z, Tu Y. A solar optical reflection lighting system for threshold zone of short tunnels: theory and practice. Tunnelling Underground Space Tech (2023) 131:104839. doi:10.1016/j.tust.2022.104839
28. Yu S, Zhao C, Song L, Li Y, Du Y. Understanding traffic bottlenecks of long freeway tunnels based on a novel location-dependent lighting-related car-following model. Tunnelling and Underground Space Technol-ogy (2023) 136:105098. doi:10.1016/j.tust.2023.105098
29. Sun J, Qi G, Mazur N, Zhu Z. Structural scheduling of transient control under energy storage systems by sparse-promoting reinforcement learning. IEEE Trans Ind Inform (2022) 18(2):744–56. doi:10.1109/TII.2021.3084139
30. Zhu Z, He X, Qi G, Li Y, Cong B, Liu Y. Brain tumor segmentation based on the fusion of deep semantics and edge information in multimodal MRI. Inf Fusion (2023) 91:376–87. doi:10.1016/j.inffus.2022.10.022
31. Zhu Z, Lei Y, Qi G, Chai Y, Mazur N, An Y, et al. A review of the application of deep learning in intelligent fault diagnosis of rotating machinery. Measurement (2023) 206:112346. doi:10.1016/j.measurement.2022.112346
32. Liu Y, Zhang Y, Liu G, Zhang H, Jin L, Fan Z, et al. Design of a traffic flow data collection system based on LiDAR-Vision Integrated Machine. Comp Meas Control (2021) 1–9. doi:10.16526/j.cnki.11-4762/tp.2022.03.027
33. Lu X. Real-time and spatial traffic perception system based on LiDAR. China ITS J (2021) 253(2):122–5. doi:10.13439/j.cnki.itsc.2021.02.015
34. Wang S, Zhang J, Zhao C, Wang W. Discussion on the application of big data technology in highway tunnel engineering. Highway (2017) 62(8):166–73.
35. Hong K. Development and thinking of tunnels and underground engineering in China in Recent 2 Years (From 2017 to 2018). Tunnel Construction (2019) 39(5):710–23.
36. Yang C, Nie Q. Time series decomposition and machine learning fusion model for PM2.5 prediction. J Saf Environ (2023) 1–11. doi:10.13637/j.issn.1009-6094.2022.1616
37. Li M, Ning D, Guo J. Attention-based CNN-LSTM model and its application. Comp Eng Appl (2019) 55(13):29–27.
38. Wang S, Qiao Z, Fu J, Li M. The connotation and architecture of smart highways. Highway (2017) 62(12):170–175.
39. Zeng L, Wang S, He X, Ruan Z. The concept, architecture, and key technologies of intelligent highway tunnels. Mod Tunnelling Tech (2016) 53(04):1–8. doi:10.13807/j.cnki.mtt.2016.04.001
Keywords: highway tunnel, operational surveillance, information fusion, deep learning, digital twin
Citation: Yang X, Yu S, Wang J, Chen H, Huang Y, Luo Z and Fu L (2024) Application of a digital twin for highway tunnels based on multi-sensor and information fusion. Front. Phys. 12:1335494. doi: 10.3389/fphy.2024.1335494
Received: 09 November 2023; Accepted: 02 January 2024;
Published: 24 January 2024.
Edited by:
Guanqiu Qi, Buffalo State College, United StatesReviewed by:
Xin Huang, Chongqing University of Posts and Telecommunications, ChinaYi Li, Shanghai Maritime University, China
Yishun Li, Tongji University, China
Rencan Nie, Yunnan University, China
Copyright © 2024 Yang, Yu, Wang, Chen, Huang, Luo and Fu. This is an open-access article distributed under the terms of the Creative Commons Attribution License (CC BY). The use, distribution or reproduction in other forums is permitted, provided the original author(s) and the copyright owner(s) are credited and that the original publication in this journal is cited, in accordance with accepted academic practice. No use, distribution or reproduction is permitted which does not comply with these terms.
*Correspondence: Shanchuan Yu, eXVzaGFuY2h1YW5AY21oay5jb20=; Jun Wang, Mjc3NjgxNzg1QHFxLmNvbQ==; Lijia Fu, ZnVsaWppYUBjbWhrLmNvbQ==