- Postgraduate Programme in Metrology, Pontifical Catholic University of Rio de Janeiro, Rio de Janeiro, Brazil
A portable magnetic mapping system was designed to determine the three-dimensional location of non-ferromagnetic metallic foreign bodies to ensure fast and successful surgical procedures for their removal. The system is based on the induction of eddy currents in the foreign body by an excitation stage and the measurement of the magnetic field generated by these currents employing a commercially available high-resolution magnetometer based on the Giant Magneto-Impedance effect. The instrument topology is based on decoupling the excitation and measurement stages with a configuration that produces a high primary magnetic field in the foreign body region and a weak one in the GMI sensor region. This feature allows increasing the primary excitation magnetic field without saturating the GMI magnetometer, making it feasible to overcome relevant limitations evidenced in a previously developed instrument proposal. Computational simulations were built considering four possible configurations, with two models of excitation and two options for the magnetometer GMI sensitivity axis orientations. International guidelines for exposure limits to non-ionizing radiation and the principles of biometrology, besides constructive and electrical aspects, were also considered in the system design. The performance analysis of the most promising settings confirmed the viability of the proposed measuring instrument, optimizing the linear operation of the magnetometer during the measurement procedure and contributing to the construction of a complete measurement system prototype, with performance and safety characteristics ensured for the intended biomedical application.
1 Introduction
Metallic foreign bodies accidentally inserted into the human body are commonly observed in clinical practice. Conventional approaches for locating them for surgical removal involve X-ray imaging methods, which can not provide an accurate location and also expose patients and staff to radiation [1, 2]. Ultrasound-guided removal may be an option in some conditions [3], while magnetic resonance imaging (MRI) should be avoided, considering it poses potential risks of displacing foreign bodies and causing damage [4]. A successful alternative technique has been developed based on the mapping of the magnetic flux density, using a Superconducting Quantum Interference Device (SQUID) [1, 5], the most sensitive magnetometer available [6]. The technique was applied in seven clinical cases, resulting in rapid and successful surgical removal of foreign bodies such as hypodermic and sewing needles [1].
However, despite the high accuracy achieved, drawbacks associated with the high cost and the need of cryogenic temperatures related to the SQUID sensor prevented the technique from complying with Biometrological Principles [7, 8], which require aspects such as low cost and low complexity of manufacturing and operation, portability, noninvasiveness, innocuousness, high accuracy, among others. These cost and operating complexity factors hampered the dissemination of the technique in the medical environment [8]. More recently, research has been conducted into the giant magnetoimpedance (GMI) effect [9–14], which is a phenomenon that causes a significant variation in impedance when a ferromagnetic amorphous material is exposed to an external magnetic field and an alternating current is applied [14–16]. It has led to the development of low-cost, high-sensitivity magnetic transducers operating at room temperature [10, 13, 17], in particular for biomedical applications [18–22]. Using the GMI phenomenon opened the possibility of developing measuring systems operating at room temperature and implementing a noninvasive and innocuous technique for locating foreign bodies with high accuracy [8, 20, 21].
However, metallic foreign bodies are not always being made of materials possessing remanent magnetic field. For instance, a metallic foreign body frequently encountered in medical practice consists of firearm projectiles [23], typically composed of lead, a diamagnetic material lacking a remanent magnetic field. In this case, locating these objects via magnetic mapping will require the induction of eddy currents using an alternating magnetic field [17], which can be detected by a magnetometer with adequate sensitivity and resolution [24].
The medical literature contains numerous case reports of patients who have ingested metal or have been wounded by gunshots [23–26], in which commercial metal detectors have been used to confirm the presence of metal in the patient’s body. This approach was implemented either in addition to radiological examination or when the latter was not sufficient to identify the presence of the metal object inside the body. Guidance tools based on inductive proximity sensors have also been developed in small dimensions to be used within the surgical field during the removal procedures [27].
Despite detecting the presence or reporting the proximity of the object during the surgical procedure, these initiatives do not provide the exact location of the foreign body using noninvasive mapping at a clinical stage prior to the surgical moment, capable of providing reliable information to devise adequate planning of the procedure and successful removal in a short surgical time, since they do not have the sensitivity and spatial resolution to indicate the exact position of the foreign body along a measurement plane projected onto the patient’s skin [8].
The literature describes several methods for locating metallic structures in non-clinical applications, such as a transient electromagnetic radar system developed to detect underground conduits [28]. However, further requirements must be considered for biomedical applications, such as tissue exposure limits to the emitted energy, sensor sensitivity, and sensor size (meeting the spatial resolution demands and anatomical restrictions) [8].
A preliminary system using a solenoid for excitation and two high-sensitivity GMI sensors in a gradiometric configuration for magnetic field noninvasive mapping was developed by our team from the Biometrology Laboratory at the Pontifical Catholic University of Rio de Janeiro (LaBioMet/PUC-Rio) for locating non-ferromagnetic metallic foreign bodies’ position and its exact projection onto the skin at the pre-surgery stage [20, 21]. However, this measuring system configuration has shown limitations resulting from the excitation and measurement stages coupling, producing a significant excitation magnetic field in the sensors’ region, compromising their linear operation and, consequently, their detection capability depending on the volume and depth of the metallic foreign body [20, 21]. As a result, further improvements are necessary to overcome these limitations and fully meet biomedical application requirements [8, 21, 24].
To address the mentioned detection limitations associated with the preliminary approach [20, 21], the present work herein proposes novel configurations of the measuring system that decouple the excitation and GMI measuring stages, generating a spatial distribution of the field characterized by adequate magnetic flux density levels in the region of the foreign body and nearly not-perceptible levels at the sensor site. The proposed strategy aims to allow for the detection of projectile shrapnel with smaller fragment dimensions, which can be located deeper at greater distances from the skin. The design and performance evaluation of the proposed measuring system are determined considering the safety limits for exposure to the primary magnetic field levels according to the recommendations from the International Commission on Non-Ionizing Radiation Protection (ICNIRP) [29].
The distinct proposed configurations of excitation and positioning of the GMI sensing element investigated for developing the magnetic measuring system for locating non-ferromagnetic metallic foreign bodies are presented in the next section. Section 2 also describes the computational modeling implemented to simulate the primary magnetic field generated by the different coil configurations and explains the theoretical modeling and computational implementation of the secondary magnetic field generated by eddy currents induced in non-magnetic metallic foreign bodies by the alternating primary magnetic field. Then, Section 3 presents the simulated secondary magnetic field maps associated with the different excitation system topologies and the two orientations of the GMI sensor, evaluating the system’s performance in its various configuration alternatives regarding its location accuracy in terms of foreign body diameter and detection distance. Finally, Section 4 discusses the results.
2 Materials and methods
2.1 System concept
The proposed system is intended to detect non-magnetic foreign objects, such as firearm bullets, by inducing eddy currents in the target and measuring the secondary magnetic field generated by these induced currents. Figure 1 shows the four setup designs proposed and investigated. The system comprises two parts: an excitation stage and a measurement stage. Two primary magnetic field generators wound in opposing directions excite the foreign body by creating a quasi-circular magnetic flux passing almost horizontally through the target area.
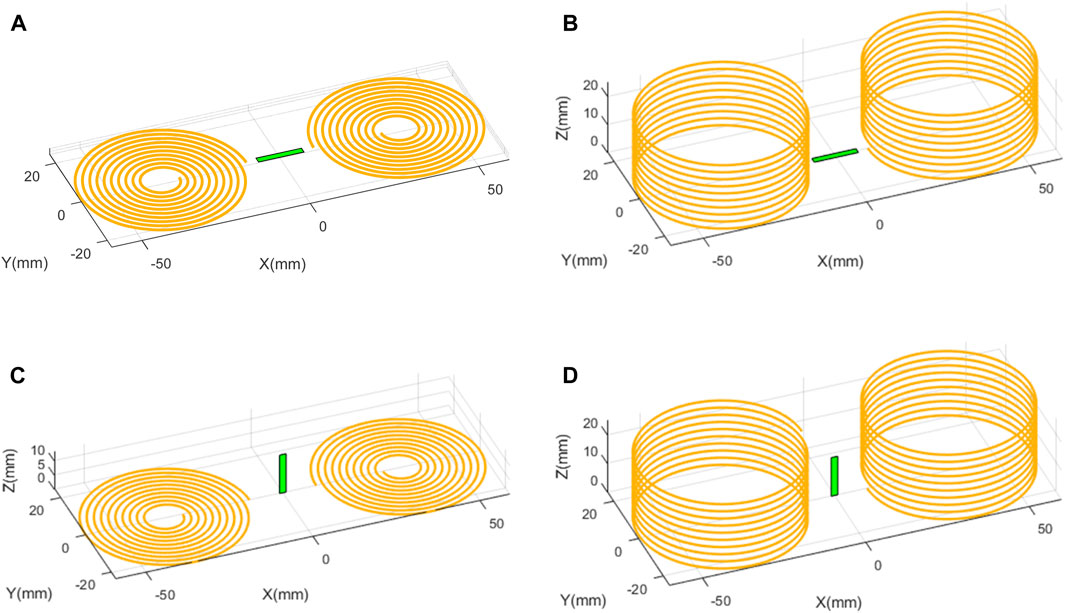
Figure 1. Schematic diagram of the four investigated setups for the foreign body location system, with planar coils [left, in (A,C)] and solenoids [right, in (B,D)]; and with the GMI sensor oriented horizontally [top, in (A,B)] and vertically [bottom, in (C,D)].
The excitation stage was designed in two possible configurations, as shown in Figure 1. Configuration 1 is composed of a pair of planar spiral coils with inner radii of 5 mm and outer radii of 20 mm (Figures 1A, C), and Configuration 2 consists of a couple of vertical solenoids with radii and lengths of 20 mm (Figures 1B, D). A GMI sensor is located between the planar coils or solenoids in two possible positions to perform the measurements: horizontal (Figures 1A, B) and vertical (Figures 1C, D). The entire setup is placed as close as possible to the foreign object (as limited by the patient’s skin). The four arrangements investigated consist of the four possible combinations of excitation and measurement stages, as shown in Figure 1. These geometric parameters were chosen because they are consistent with the biometrological guidelines of portability and low cost considered in the instrument proposal and were inspired in the typical dimensions of cell phones and of the coils used for inductive charging. Both excitation stage configurations consist of ten coils each, with a horizontal spacing of 20 mm. This distance is sufficient to accommodate the Aichi GMI sensor, which has 1.2 mm × 13.5 mm dimensions [30]. To create a nearly horizontal magnetic field in the foreign body region, the winding directions of the two coils/solenoids are opposite in both scenarios [31]. The similar geometric parameters allow the magnetic flux densities generated by the two excitation configurations to be easily compared. Assuming that the loops are made of conventional conductive materials like copper, a maximum amplitude of 100 mA for the excitation current is suitable for the coils’ dimensions.
2.2 GMI magnetometer
The proposed designs for the system utilize the MI-CB-1DJ-M-B GMI sensor produced by Aichi Micro Intelligent Corporation. It has compact dimensions of 1.2 mm × 13.5 mm and can function at room temperature, measuring the magnetic flux density parallel to its length. The sensor has a sensitivity of 5 V/μT and a saturation field of ±1 μT, operating within a frequency range of 0.1 Hz–10 kHz, with a noise figure of 10 pT/√Hz at 1 Hz [30].
In previous works implemented by our team from the Biometrology Laboratory of PUC-Rio [20, 21, 32], we used this commercial magnetometer in preliminary studies aiming to develop a system for detecting non-ferromagnetic metallic foreign bodies. In these works, considering that 10 kHz is the −3 dB frequency of the GMI sensor, we adopted an operating frequency of 8 kHz, and, to optimize the signal-to-noise ratio, we employed a fourth-order Butterworth analog bandpass filter based on the topology of two cascaded Sallen-Key filters centered on the operating frequency of the instrument. The simulations and experimental tests of this system indicated a considerable improvement in the resolution of the measurement system, for the value of 25 pT [32], this being the value considered as the lowest magnetic flux density measurable by this GMI sensor model operating at the specific frequency of 8 kHz.
2.3 Primary magnetic field generation
This study employs numerical integration of the Biot-Savart Law to simulate the primary magnetic field generated by the solenoids, using a current dipole over the wire path discretized at a resolution of 1 mm. Since the frequency is low, the sinusoidal magnetic field can be calculated based solely on the current amplitude without the need to account for dynamic effects.
For initial analysis of the primary magnetic field generated in the region of the foreign body, a diamagnetic metal sphere with a radius of 2.5 mm was positioned 50 mm deep in the longitudinal central axis of the measuring instrument (Z-axis), the region where the excitation magnetic field lines are supposed to reach the measurand horizontally. Figure 2 shows the magnitude of this flux density considering the components in the XZ plane. For symmetry reasons, the Y component of the primary magnetic flux density was discarded.
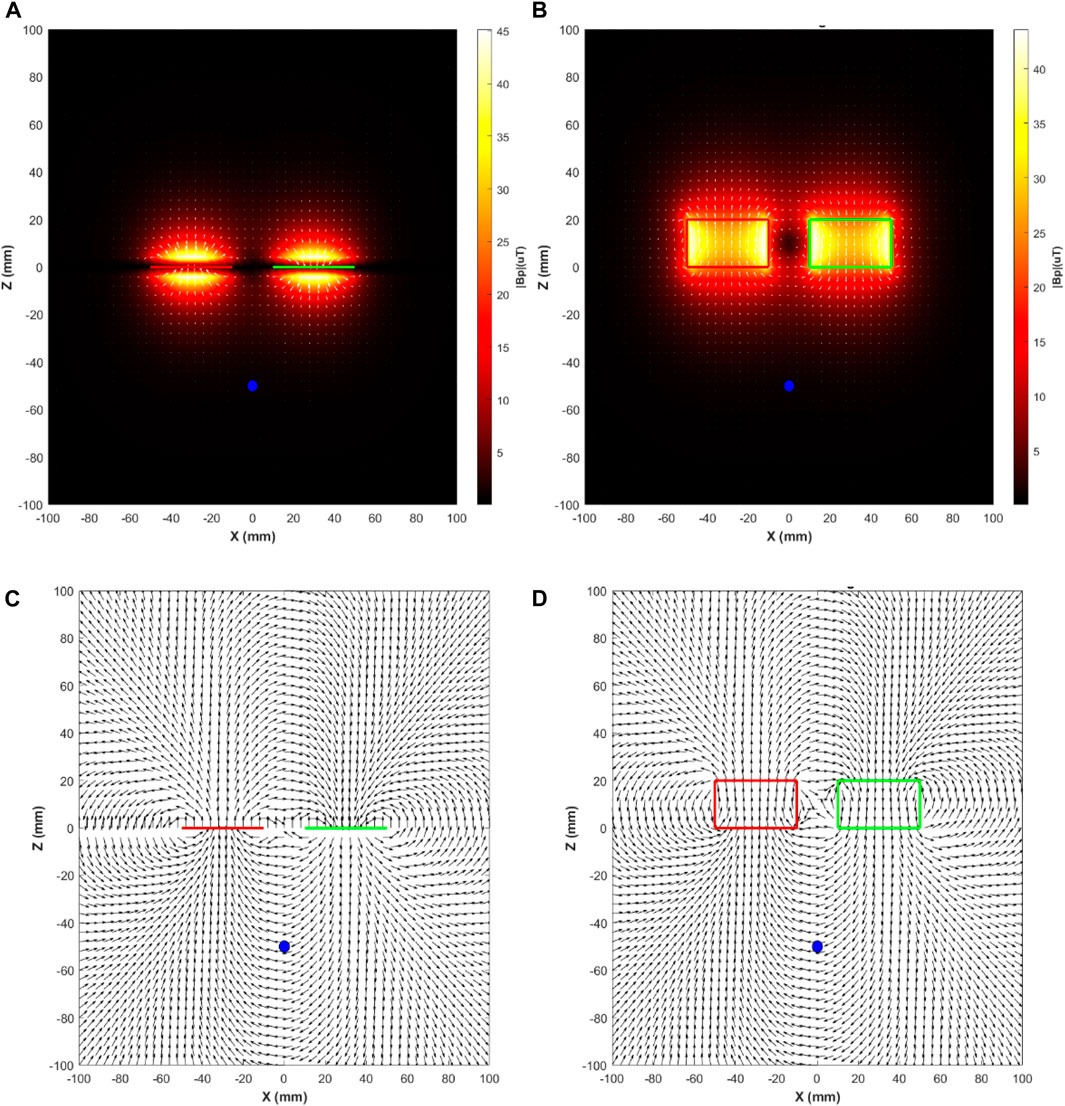
Figure 2. Magnetic flux density vector field generated by the excitation stages and profiles of the actuation elements and the foreign body (blue sphere). In (A), the field distribution generated by the excitation stage using planar coils (Configuration 1), is presented, while in (B), it is shown the distribution associated with excitation using long coils (Configuration 2). Plots (C,D) shows the normalized magnetic flux density vector fields corresponding to (A,B).
The maps displayed in Figures 2A, B depict the magnitude of the primary magnetic flux density in the XZ plane. It is evident that the magnetic quantity is not uniform throughout the measurement space, with a much higher intensity observed near the excitation coils. The green and red colors on the coils indicate the opposite direction of the current. The vector field was also normalized concerning its intensity to facilitate its visualization and, therefore, allow better distinguishing the behavior of the magnetic flux lines in regions far from the actuators, as shown in Figures 2C, D.
The intensity of the primary magnetic flux density attenuates as the distance between the measurement region of interest and the one occupied by the excitation coils increases (Figure 2). The intensity of the primary magnetic field decreases less rapidly with depth in Configuration 2 (Figures 2B, D) than in Configuration 1 (Figures 2A, C). Both configurations can generate magnetic flux densities with an intensity higher than 40 μT in the vicinity or interior of the coils; however, for the foreign body placement conditions employed, this value is reduced to value ranges smaller than 5 μT.
Figures 2C, D show that the magnetic flux lines are primarily horizontal in the instrument’s longitudinal central axis (X = 0) region. Concerning the region occupied by the GMI magnetometer, for Configuration 1, the magnetic flux lines virtually cancel in the horizontal region between the excitation coils for both X and Z components. For Configuration 2, the Z component of the primary magnetic flux density (
2.4 Secondary magnetic field detection
This section presents the theoretical modeling and computational calculation of the secondary magnetic field generated by eddy currents induced in non-magnetic metallic foreign bodies by the alternating primary magnetic field. Thus, the modeling of the eddy currents induced in a spherically shaped non-magnetic metallic foreign body is presented, considering the primary magnetic fields described in the previous Section 2.3 and the secondary magnetic field generated by such eddy currents.
The mathematical model of the secondary magnetic flux density (Bs) produced by the eddy currents induced in a body with spherical symmetry was developed in previous works [20, 21, 24]. These works have shown that this magnitude is dependent on the geometrical characteristics of the foreign body undergoing the induction of the eddy currents, such as radius (a) and spatial position, and also on the electromagnetic properties of the component material of the foreign body (typically, lead), such as magnetic permeability (μ) and electrical conductivity (σ). The intensity of the eddy currents, and therefore of the secondary magnetic field, is also dependent on the intensity (|B0 |) and frequency (f0) of the excitation (primary) magnetic flux density incident on the foreign body. Therefore, one can write the following expressions for the two components of interest of the secondary magnetic flux density:
μr = μ/μ0 is the relative permeability and
Finally, δ is the skin depth, given by
From the mathematical description of the Cartesian coordinates of the components of interest of the secondary magnetic flux density according to the orientations considered for the sensitivity axis of the sensor (Eqs 1, 2), the computer simulation of the measurement process was implemented in the Matlab® development platform. For simplicity, only the horizontal component (
3 Results
3.1 Primary magnetic field
As described in Section 2.4, only the X component of the primary magnetic field was considered to calculate the secondary magnetic field generated by the eddy currents induced in the foreign body. Thus, the analyses presented here also consider only this component.
3.1.1 Primary magnetic field in the foreign body region
To better analyze the intensity of the primary magnetic flux density in the foreign body region, one-dimensional scans were made in straight lines parallel to the X-axis and Y = 0 for various depths relative to the base of the excitation coils. Three (3) different depths were analyzed: 20 mm, 30 mm, and 60 mm. Figure 3 presents these three depths’
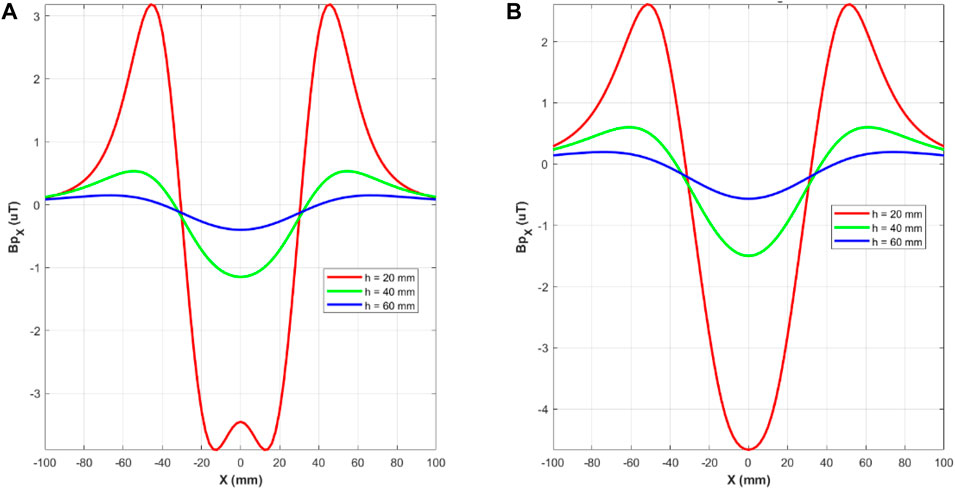
Figure 3. Primary magnetic flux density along the X-axis for three different depths: h = 20 mm (red curve), h = 40 mm (green curve), and h = 60 mm (blue curve). In (A), the presented results are relative to the excitation stage employing planar coils, while in (B), they are relative to the excitation stage operating with solenoids.
A three-polar behavior of the primary magnetic flux density is perceived for almost all of the measurement scenarios discussed in Figure 3, with symmetry regarding the origin of the X-axis. The magnetic flux direction alternates along the X-axis, with two symmetrical positive peaks and a sharper negative region in the longitudinal center axis of the instrument. This field distribution occurs for both the excitation stage configurations, employing planar coils (3a) or solenoids (3b).
Particularly for Configuration 1 (as shown in Figure 3A), at a depth of 20 mm, the sharp negative peak is not at its maximum in the central region, as observed for all the other conditions. Instead, it has symmetrical maximum values in nearby areas, but its center position value in modulus is similar to those in the vicinity.
For the same depth of the metallic object localization, one can see that the values of the primary magnetic field generated by excitation stages composed of long coils are higher than the values of the field produced by excitation stages involving planar coils. Table 1 presents the magnetic flux density values at the center point, considering the measurement scenarios shown in Figure 3.

Table 1. Primary magnetic flux density
As observed in Figure 3, it is evident from Table 1 that, when trying to locate a metallic object at the same depth, the primary magnetic field generated by excitation stages with solenoids has higher values than those with planar coils. With a current amplitude of 100 mA, which is the maximum excitation current appropriate for the coils’ dimensions, the magnitude of the primary magnetic flux density at 20 mm depth can achieve a value greater than 4.5 μT when using Configuration 2 (vertical solenoids) and close to 3.5 μT with Configuration 1. Figure 4 shows the behavior of the maximum value of the primary magnetic flux density as a function of depth (Z-axis) for the two excitation configurations investigated.
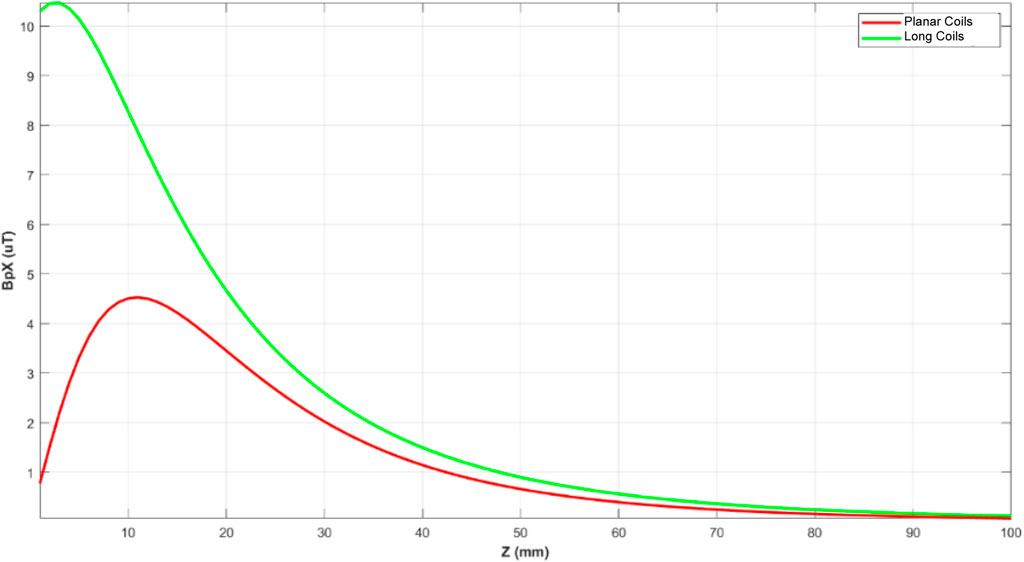
Figure 4. Behavior of the maximum value of the primary magnetic flux density along the Z-axis. The green curve is relative to the excitation stage employing long coils, while the red one is relative to the excitation stage based on planar coils.
For Configuration 1 (planar coils), Figure 4 indicates that there is a significant reduction in the maximum primary magnetic flux density values for depths less than 10 mm due to the behavior of the magnetic flux lines in the region near the planar coils, particularly between them (where the field cancels out). This reduction is not observed for Configuration 2, using vertical solenoids, which generates more uniform flux lines. For depths up to 40 mm, both configurations exhibit values greater than 1 μT, which attenuates to the order of tenths of a microtesla for depths between 50 mm and 100 mm.
To better characterize the spatial distribution of the primary magnetic flux density, a simulation of the behavior of this magnitude over the horizontal XY plane was performed for three depths of the foreign body: 20 mm, 40 mm, and 60 mm, for both excitation configurations. The results are presented in Figures 5, 6 in three different views: three-dimensional, side view, and top view. Figures 5, 6 show, respectively, for Configurations 1 and 2, the two-dimensional maps of the primary magnetic flux density
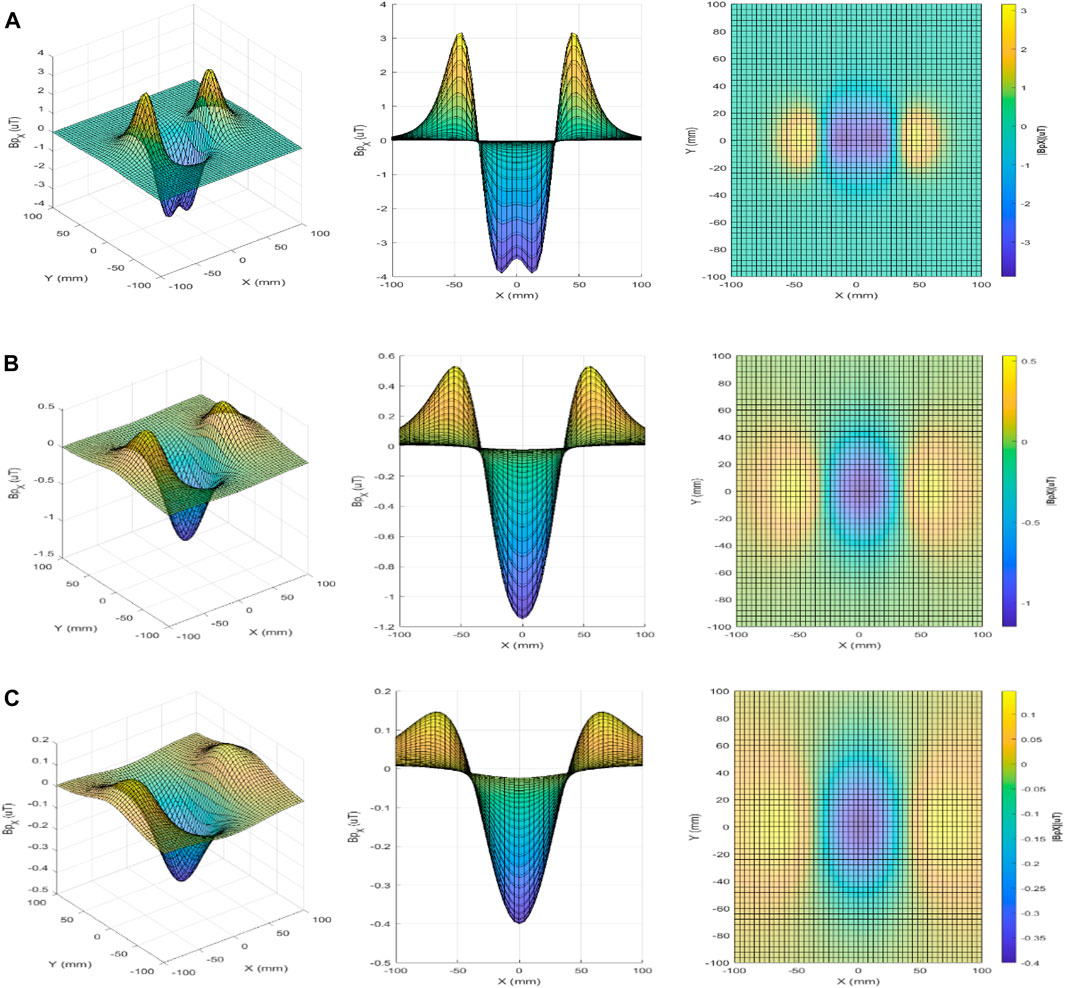
Figure 5. Primary magnetic flux density
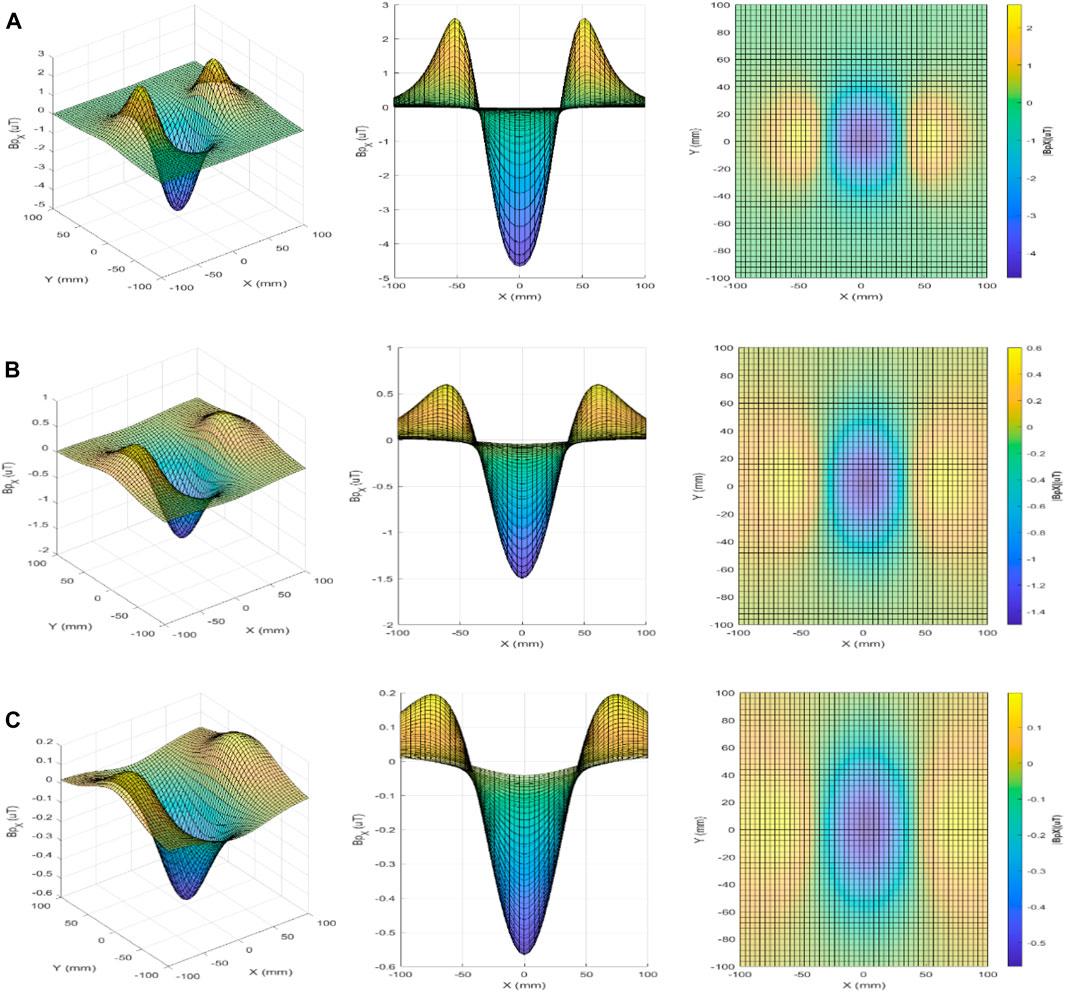
Figure 6. Primary magnetic flux density
3.1.2 Primary magnetic field in the GMI magnetometer region
In addition to evaluating the field in the foreign body region (presented in Section 3.1.1), it is also necessary to evaluate the behavior of the primary magnetic flux density in the vicinity of the sensor, also considering the two possible orientations for the sensitivity axis of the GMI sensor: aligned to the X-axis (sensor in the horizontal position, in the XY plane) and aligned to the Z-axis (sensor in the vertical position, in the XZ plane).
Considering the scenario where the sensor is aligned horizontally with the X-axis, the magnetometer is sensitive to the X component of the primary magnetic field (
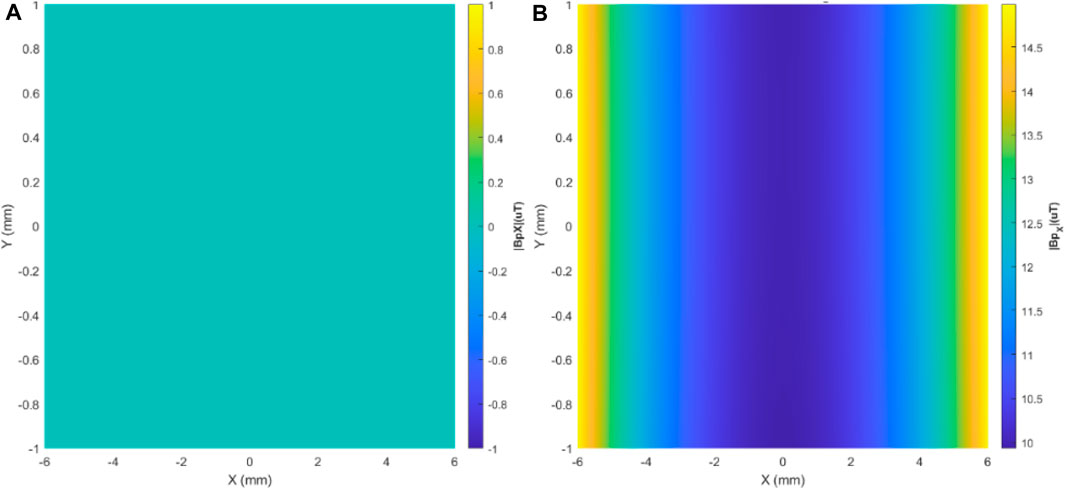
Figure 7. Spatial distribution of the primary magnetic flux density in the GMI sensor region, in the horizontal position and aligned with the X-axis, for Configurations 1, in (A), and 2, in (B).
Figure 7A shows that, for scenarios with a supply current of 100 mA, the system based on Configuration 1 can keep the GMI sensor in its linear operating range since the magnetic flux density over the entire length of the sensor element region is zero, due to the symmetry of the configuration.
In the case of Configuration 2 (vertical solenoids), there is a residual value of this component (
In Figure 8, the GMI sensor assumes a vertical position, therefore sensitive to the Z component of the primary magnetic field (
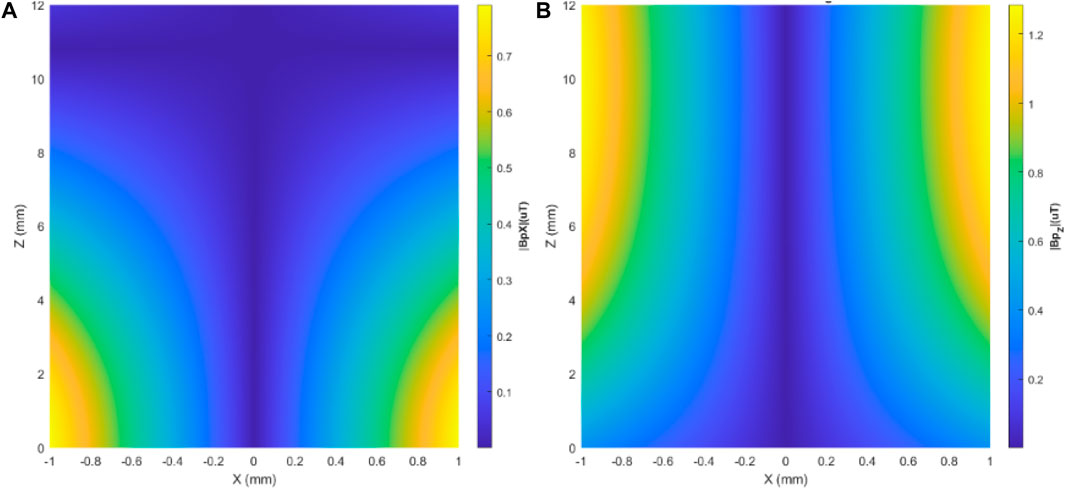
Figure 8. Spatial distribution of the primary magnetic flux density in the sensor location, with the sensor in the vertical position and aligned with the Z-axis in the excitation Configurations 1, in (A), and 2, in (B).
Analyzing the behavior of the primary magnetic flux density along the XZ plane shown in Figure 8, it can be seen that, for the conditions of supply current (100 mA), the system based on Configuration 1 can keep the GMI sensor in its linear operating range, since the magnetic flux density over the entire length is always within the sensor’s linear operating range (±1 μT).
Concerning Configuration 2 (vertical solenoids), the maximum value of the primary magnetic flux density slightly exceeds the limits of the linear operating range of the GMI sensor discussed. In this case, keeping the geometric and spatial configuration of the actuators, it is necessary to decrease the supply current level for the measurement instrument to operate linearly.
The maximum magnetic flux density values in the sensor element region for the four measurement scenarios analyzed are shown in Table 2.

Table 2. Maximum primary magnetic flux density
Thus, to keep the measuring device in the linear operating region when employing Configuration 2 and preserving the same geometric parameters and spatial arrangement, the supply current needs to be attenuated according to the orientation of the GMI sensor, whether horizontal or vertical.
The electric current of 100 mA needs to be reduced to 6.7 mA (a 15 times attenuation) for the GMI sensor in horizontal orientation (along which the primary magnetic flux density component has greater intensity); on the other hand, for the vertical GMI sensor orientation, the current should be reduced by only 30%, to 70 mA. After adjusting the excitation currents, a new scenario is presented in Table 3 for the maximum magnetic flux density values for the four measuring system designs.

Table 3. Maximum primary magnetic flux density
However, although the current attenuation for Configuration 2 ensures that the GMI sensor works in the linear region, the primary magnetic flux density incident on the foreign body is also attenuated, reducing the secondary magnetic field to be measured by the magnetometers.
Similar to Figures 4, 9 shows the behavior of the maximum value of the primary magnetic flux density as a function of depth for the two excitation configurations and, for Configuration 2, considering the two possible orientations of the GMI sensor.
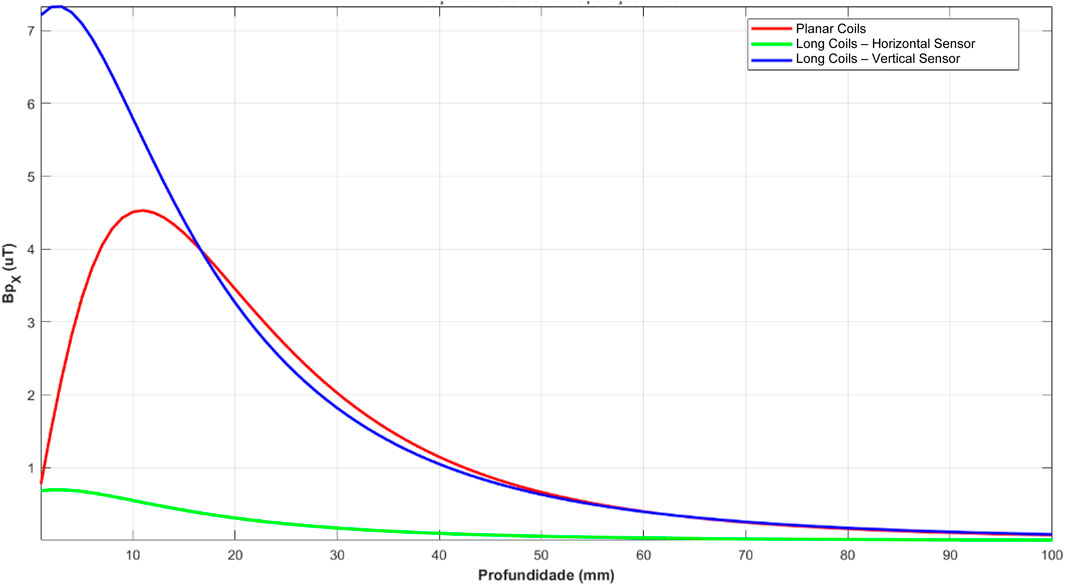
Figure 9. Behavior of the maximum value of the primary magnetic flux density along the z-axis. The red curve corresponds to Configuration 1 (100 mA current); the blue curve corresponds to Configuration 2 with the vertical GMI sensor (70 mA current); the green curve corresponds to Configuration 2 with the horizontal GMI sensor (6.7 mA current).
It can be seen that the reduction in the primary magnetic flux density in the foreign body region is proportional to the attenuation of the electric current for the case of Configuration 2. That is, due to the lower attenuation (30%, 70 mA current), the situation with the sensor aligned with the Z-axis provides greater measurement capability than the situation with the sensor aligned with the X-axis (6.7 mA current) because the intensity of the secondary magnetic field generated by eddy currents is directly proportional to the intensity of the primary magnetic field, and this is directly proportional to the intensity of the excitation current. In the case of Configuration 1, although the current is 100 mA, the primary excitation field is smaller than Configuration 2, with a current of 70 mA due to field cancellation in the region near the planar coils. Still, both Configurations have a similar primary field for depths above approximately 20 mm.
For depths smaller than approximately 20 mm, Configuration 2 (long solenoids) with the vertical sensor is the better alternative to implementing higher excitation levels for the foreign body. From this depth on, Configuration 1 (planar coils) can apply the highest excitation to the foreign body, with slightly greater intensities than the previous one. This trend lasts until a depth of about 70 mm. From this depth up to the maximum depth analyzed for the foreign body (100 mm), Configuration 2 with a vertical sensor has a more remarkable ability to produce primary magnetic flux densities in the region of the foreign body. Still, the difference to Configuration 1 is in the order of hundredths of microteslas. This difference can be considered irrelevant given the magnetic field model generated by inducing eddy currents in the foreign body. So, because of the relationship between excitation capacity and the sensor’s ability to operate linearly, Configuration 1 (planar coils) is the most suitable as the excitation stage for metallic foreign bodies.
One can also notice the supplanting of the limitation related to the measurement concept previously developed by the team from the LaBioMet/PUC-Rio [21]. In that previous project, the excitation and measurement stages were coupled due to the instrument configuration. Therefore, the highest magnitude of magnetic flux density for excitation of the foreign body was limited by the limit of the linear operating region of the GMI sensor (1 μT). In this regard, Configuration 1, with planar coils, for any orientation of the GMI sensor, produces values of the excitation of the metallic object greater than 1 μT for all depths less than approximately 40 mm, while the primary magnetic flux density in the GMI sensor region remains within the linear measurement range. This fact characterizes the feasibility of the new measurement concept presented, obtaining higher levels of eddy currents in the foreign body, which consequently tend to produce higher secondary magnetic field levels for any depth of the foreign body relative to the excitation coils than those obtained by the previously developed measurement architecture based on GMI sensors.
According to the analysis of the primary magnetic flux density, it was possible to conclude that, concerning the GMI magnetometer (sensitivity and resolution characteristics), the excitation stage that best matches the satisfactory operation of the measurement instrument is the one whose primary elements consist of planar solenoids (Configuration 1). This stage can generate high excitation in the foreign body region while keeping low excitation in the sensor region. This feature ensures the linear operation of the sensor while preserving the innocuousness of the measuring instrument. Additionally, the inductance of the solenoids remains low, resulting in minimal self-induced voltage on the actuators. These attributes lead to simple, safe, and cost-effective power supply systems.
3.1.3 Optimization of excitation Configuration 1 with GMI sensor horizontally oriented
When using Configuration 1 (planar coils) and placing the GMI sensor horizontally, there was no limit to the electric current intensity. This effect results from the configuration’s symmetry, which causes the primary magnetic flux density
The limits of this excitation configuration depend on the diameter of the solenoid wires, on the power supply capacity of the solenoid power supply circuit (to be composed of a voltage or current source connected in series with a resistor), on the current capacity of the conductor, depending on its diameter according to the AWG (American Wire Gauge) table, and on the non-ionizing magnetic radiation exposure limits defined by ICNIRP [29].
The magnetic transducer is intended to be used by the clinical staff to map a horizontal plane at a distance of about 10 mm from the patient’s skin. Therefore, the exposure level must be under the safety limits ICNIRP defines.
According to the ICNIRP guidelines, the occupational exposure limit for the alternating magnetic flux density magnitude in the excitation frequency range of the system (8 kHz) is 100 μT RMS, corresponding to an approximate amplitude of 140 μT. When adopting a safety margin of 50% concerning this value, the maximum amplitude of the primary magnetic flux density will be taken as 70 μT.
Based on the primary magnetic flux density field vector depicted in Figure 2, the strength of the field increases near the solenoids. It reaches its peak along the longitudinal axis of each coil. In this region, the absolute value of the primary magnetic flux density is almost entirely concentrated in the
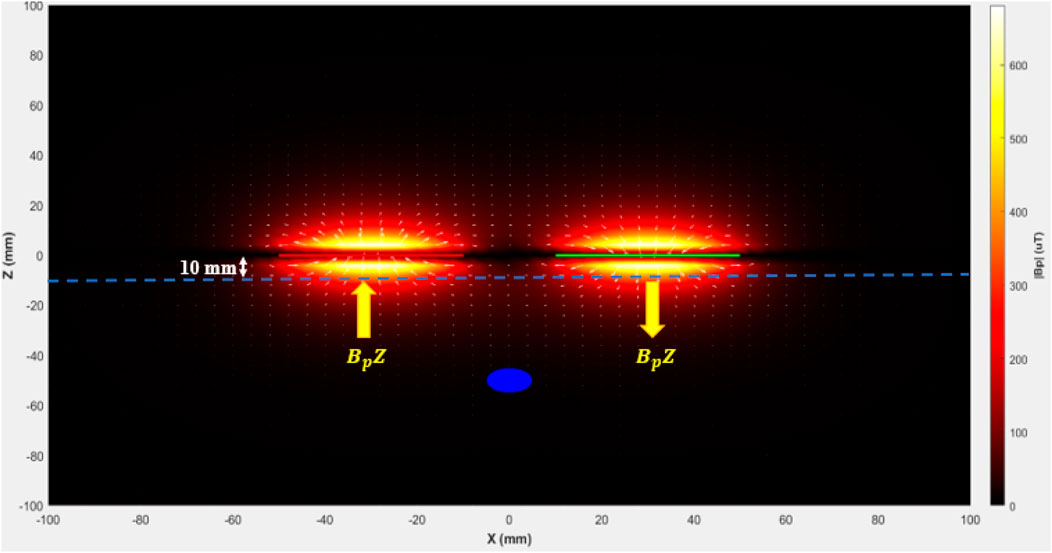
Figure 10. Quantities that must meet the ICNIRP guidelines regarding human exposure to non-ionizing magnetic radiation. The arrows denote the components of interest
Thus, the primary magnetic flux density was calculated at positions P1 and P2,
It should also be noted that the primary magnetic flux density varies linearly with the product N × I. For a given combination (N, I), one can recalculate the value of the maximum primary magnetic flux density (
Thus, the maximum value for the product N × I = 3.21 A. It indicates that increasing the primary magnetic field by 3.21 times is possible before exceeding the ICNIRP exposure limit [29]. The primary magnetic flux density incident on the foreign body (
Considering the geometrical aspects of the planar coils, with an internal radius of 5 mm and an external radius of 20 mm, one can determine the maximum number of turns
Finally, regarding the electrical aspects of the excitation coils, each geometric configuration (defined by the internal and external radii and the number of turns) will have its associated inductance L. This inductance can be approximately calculated as described in [33] and, considering the frequency and amplitude of the excitation current, the amplitude of the induced voltage at the terminals of the power supply can be calculated by
Based on the AWG (American Wire Gauge) table, which relates the diameter of copper conductors to the maximum electric current capacity [34], we calculated, for each AWG, the maximum current bearable, the maximum number of turns for the planar coil geometry considered, the maximum current that allows meeting the exposure restrictions established by the ICNIRP guidelines (considering the N × I limit = 3.21 A), the inductance of each planar coil, and the total voltage induced by the two loops.
Thus, adopting the maximum number of turns for the planar coil, all configurations make it possible to reach the exposure limit
Thus, one can select the conductor diameter based on aspects of construction practicality. For example, the AWG 21 conductor allows the use of 21 turns in each planar coil, which is a reasonable amount to build the excitation stage for the considered compact dimensions of the transducer (inner radius 5 mm and outer radius 20 mm), while the excitation current remains low (around 150 mA, ten times smaller than the maximum safe current supported by this conductor). Such coils have an inductance of approximately 6.5 μH and a self-induced voltage of only 50.7 mV. These specifications simplify the power supply electrical circuit, reducing the design cost and increasing the electrical safety and portability of the instrument.
Figure 11 presents a simulation of the primary excitation magnetic flux density magnitudes along the longitudinal axis of the transducer as a function of the distance of the instrument from the skin surface plane. This simulation is based on the GMI sensor horizontally positioned in instrument Configuration 1, which includes planar coils for the excitation stage.
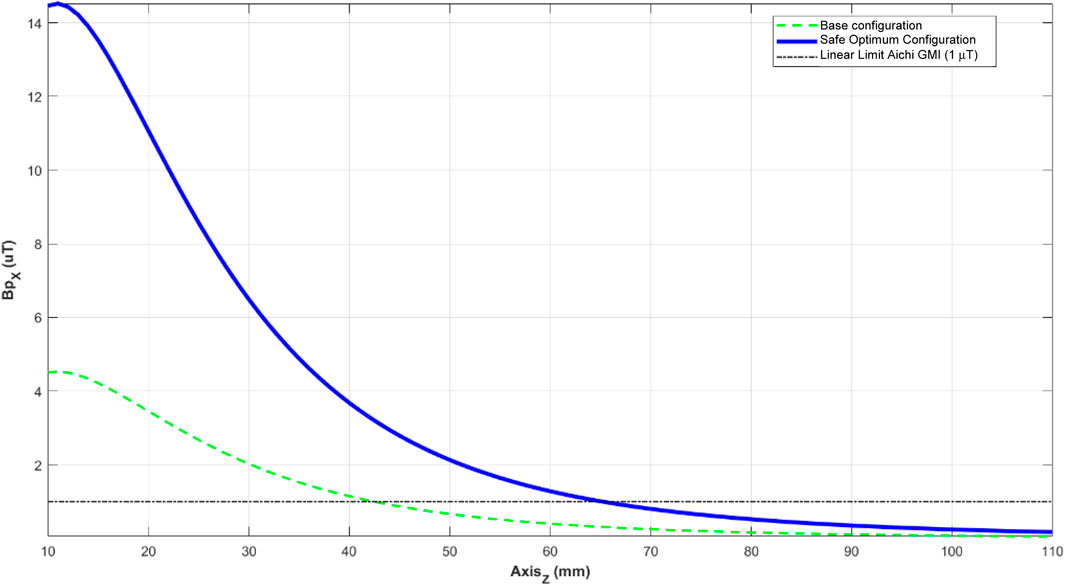
Figure 11. Primary horizontal magnetic flux density in the foreign body in Configuration 1 (planar coils and sensor in horizontal position) for different depths. The green dashed line is relative to the base configuration shown in Figure 1 (10 coils and 100 mA electric current), while the solid blue line is relative to the optimized design. The black dashed line represents the limit of the linear measurement module of the addressed Aichi GMI sensor, which is 1 μT.
From the analysis of Figure 11, it can be seen that this excitation configuration generates a larger primary field in the foreign body than the configuration described in Section 2.2. At 10 mm depth, the instrument can produce excitation in the foreign body greater than 14 μT and maintains excitation levels greater than 1 μT (limitation of the previously implemented configuration [20, 21]) for depths up to about 65 mm relative to the base of the coils, i.e., the excitation for a projectile located at about 55 mm depth close to the patient’s skin is maintained above 1 μT.
Table 4 summarizes, for Configuration 1 and both orientations of the GMI sensor, the primary magnetic flux densities in the sensor region (which should always be below 1 μT) and in the foreign body, considering a depth of 20 mm from the base of the excitation coils. The optimal excitation configurations for each sensor orientation (horizontal and vertical) are now named Configuration 1A and Configuration 1B, respectively.

Table 4. Maximum primary magnetic flux densities
Both configurations of Table 4 meet the requirements for the saturation limit of the GMI sensor and the exposure limit set by ICNIRP guidelines [29]. In the next section, these two configurations are examined regarding the secondary magnetic field generated by eddy currents. This analysis will help us determine which design (horizontal or vertical GMI sensor) has better measurement performance when locating metallic foreign bodies. Given that the maximum product of N × I is 3.21 A (Eq. 6), the primary magnetic field can be increased by up to 3.21 times without exceeding the ICNIRP exposure limit [29].
The primary magnetic flux density incident on the foreign body (
The scenario in which the sensor is placed horizontally is explored, corresponding to the Excitation Configuration 1A, presented in Table 4 (N = 21 and I = 150 mA). Table 4 displays the maximum value of
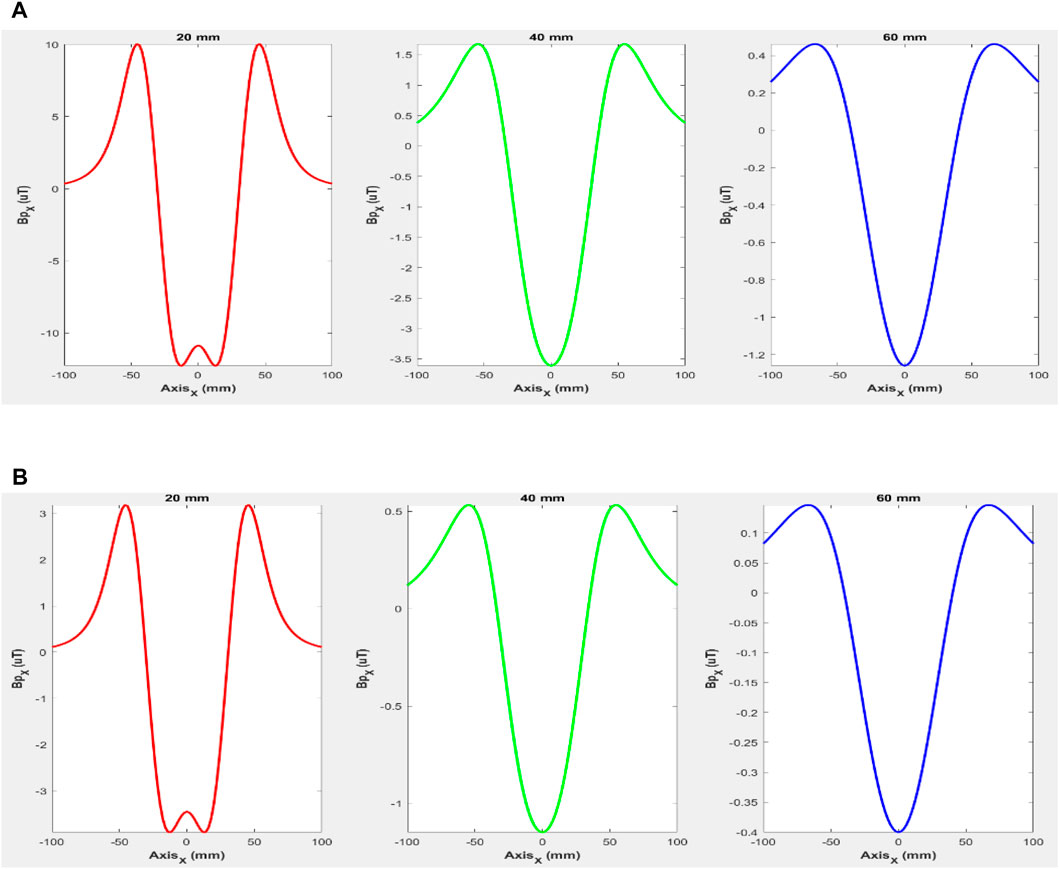
Figure 12. One-dimensional distribution of the primary magnetic flux density
Figure 12 allows examining the expected curve details of the primary magnetic flux density, such as three-pole behavior and symmetry with the longitudinal axis, for both measuring system designs, consisting of planar coils with a horizontally oriented sensor (Configuration 1A in Figure 12A) and planar coils with a vertically oriented sensor (Configuration 1B in Figure 12B).
3.2 Secondary magnetic field
This subsection presents the one- and two-dimensional analyses of the secondary magnetic flux densities generated by the eddy currents induced by the primary magnetic flux density excitation. The analysis explores different depths and radii of the foreign body, in which a single spatial coordinate is varied while the others are maintained at a fixed value.
Thus, for each orientation of the GMI sensor, scans are presented along the X (horizontal) axis, with the Y coordinate remaining zero, for three Z depth values (20 mm, 40 mm, and 60 mm) relative to the horizontal plane containing the excitation stage. This scenario analyzes the spatial distribution of the measurand perceived by the sensor when scanned one-dimensionally and horizontally relative to the plane in which the foreign body is located.
Next, scans along the vertical (z) axis are presented for different radii of the foreign body to observe the decay of the secondary magnetic field with depth.
As discussed in Section 3.1.3, the analysis will focus on the selected configurations named 1A (excitation with planar coils + horizontal GMI sensor) and 1B (excitation with planar coils + vertical GMI sensor).
3.2.1 GMI sensor positioned horizontally
Considering the three excitation scenarios presented in Figure 12 and foreign body radii ranging between 0.5 mm and 5 mm, we applied the formulation for the secondary magnetic field described in Section 2.4, simulating the secondary magnetic flux density perceived by the sensor
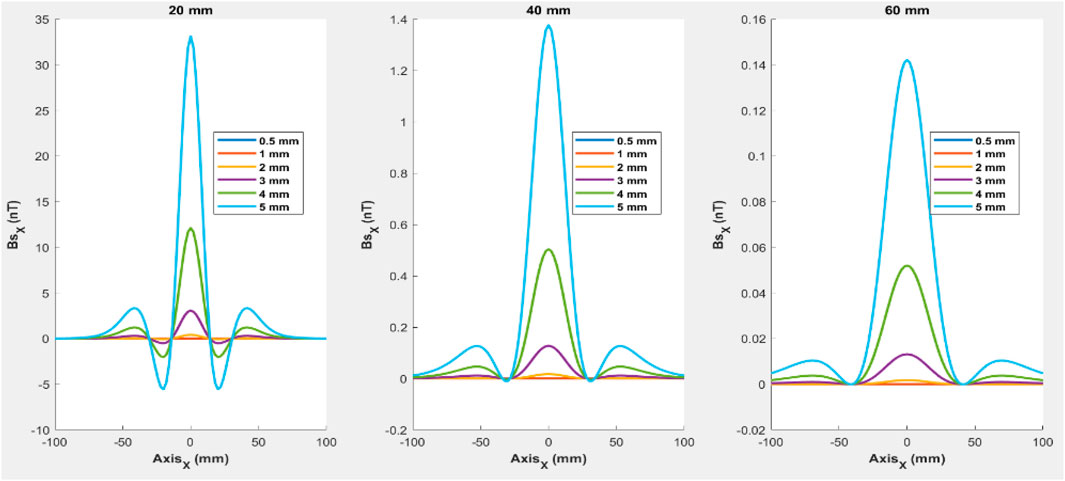
Figure 13. One-dimensional distribution of the secondary magnetic flux density in the region of the foreign body location according to the
The spatial distribution of the secondary magnetic flux density concerning the one-dimensional variation of the X coordinate (horizontal position of the sensor regarding the foreign body), shown in Figure 13, presents a three-pole behavior, symmetrical with the longitudinal axis, having its maximum value on the location of the foreign body (X = 0 mm).
It can be seen in Figure 13 that, for small depths (20 mm), the symmetrical amplitudes adjacent to the longitudinal axis display negative values, providing a five-pole configuration. These adjacent negative poles, however, become positive as the distance from the sensing element increases, presenting a three-pole behavior. As the distance between the sensing element and the foreign object decreases, the peak width of the secondary magnetic flux density reduces, clustering their amplitudes in the vicinity of the longitudinal axis.
For the same foreign body, i.e., equal radii, depth significantly impacts the magnitude of the secondary field. For instance, if a foreign body has a diameter of 5 mm, the value of the Bsx can decrease up to twenty times when the depth changes from 20 mm to 40 mm. Similarly, the value can drop ten times when the depth changes from 40 mm to 60 mm.
In the same measurement scenario, the larger the radius of the metallic object is, the greater the moduli amplitudes and variations of the secondary magnetic flux density. For every 5 mm decrease in radius, the value of these magnitudes decreases by approximately three to four times in magnitude.
3.2.2 GMI sensor positioned vertically
Considering the three excitation scenarios presented in Figure 12, with foreign body radii ranging from 0.5 mm to 5 mm, the formulation for the secondary magnetic field described in Section 2.4 was applied, simulating the
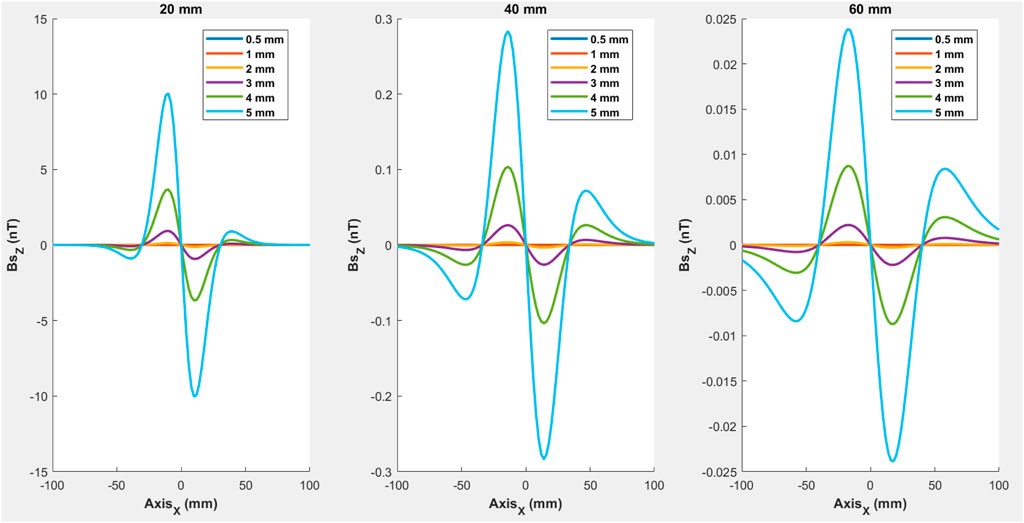
Figure 14. One-dimensional distribution of the secondary magnetic flux density in the foreign body region resulting from the excitations outlined by Figure 12, using the measurement system in its Configuration 1B.
Analysis of Figure 14 indicates that using the vertical orientation of the GMI sensor, which measures the vertical component of the secondary magnetic flux density, one has a quadrupole and antisymmetric configuration concerning the longitudinal axis of the measurement instrument. This configuration can be approximated as quasi-dipolar, as a superposition of two dipoles, especially for small depths relative to the bottom base of the measuring device because, in this case, the smaller, antisymmetric amplitudes farther from the instrument’s origin have low intensity relative to the higher intensity dipole located in the vicinity of the longitudinal axis.
Due to the dipole behavior of the vertical component of the secondary magnetic flux density, its maximum value is not on the central axis but in its vicinity. In this case, it is observed that in addition to the decrease in amplitude of these dipoles, as the depth of the foreign body increases, there is also a move away from the maximum peak concerning the system’s origin (X = 0). This behavior is due to the lower intensity and intensity variation in regions of the foreign body farther from the actuators.
Regarding the variation of the foreign body radius, similar behavior of this component
Regarding the impact of the depth variation, the same behavior is observed for the vertical component
3.2.3 Comparative analysis of GMI sensor orientation
Considering a foreign body with a certain radius located at a certain depth, it can be seen that the maximum amplitude of the horizontal component of the measurand
Therefore, concerning the intensity of the measurand, Configuration 1A best suits the project’s purpose in that the GMI magnetometer operates linearly while the measurand is intensified by increasing excitation magnitude.
Therefore, the one-dimensional analysis of the secondary magnetic flux density can be summarized as follows:
• The horizontal component of the secondary magnetic flux density has an approximately unipolar and symmetric behavior concerning the origin of the measuring instrument;
• The vertical component of the secondary magnetic flux density has an approximately dipolar and antisymmetric behavior regarding the X-axis origin (center of the measuring instrument);
• The intensity of the measurand decays as the metallic object depth relative to the plane of the excitation coils increases; and
• The amplitude of the measurand increases as the radius of the foreign body increases.
Due to the higher excitation intensity, the component of the magnetic flux density measured by Configuration 1A (planar coils and sensor in horizontal position) is considerably higher than the component measured by Configuration 1B. Thus, configuration 1A is the most suitable to meet the target attributes of the instrument, i.e., to increase the modulus of the magnetic flux density produced by the eddy currents induced in the metallic object by increasing the intensity of the excitation field, preserving the sensor operation in the linear region, with satisfactory constructive and electrical characteristics, and in a manner entirely innocuous to both healthcare personnel and patients.
3.3 Analysis of the measurement capability of the proposed instrument
This section compares the spatial distribution of secondary magnetic flux density created by eddy currents in a non-ferromagnetic metallic object with a spherical shape. The performance in detecting the location of the foreign body is evaluated for the two configurations considered the most effective (Configuration 1A, using a GMI sensor positioned horizontally, and Configuration 1B, using a GMI sensor positioned vertically).
Concerning Configuration 1A, whose magnetic field component measured by the magnetometer is horizontal and parallel to the excitation, the spatial distribution of the measurand presents a monopolar and symmetrical characteristic. In this way, its amplitude axis is symmetrical to the central longitudinal axis of the measuring instrument.
As for Configuration 1B, whose magnetic field component measured by the magnetometer is vertical and, therefore, perpendicular to the excitation, the spatial distribution of the measurand presents a dipolar and antisymmetric characteristic. Hence, in this configuration, there are two peaks with identical amplitudes aligned with the central longitudinal axis of the coils of the excitation stage.
Therefore, considering foreign bodies positioned in the vertical plane that passes through the center of the excitation coils, one can determine the maximum absolute value of the secondary magnetic flux density and, comparing it with the magnetometer resolution, identify the measurement capability of the instrument, verifying which of the configurations is considered optimal for determining the location of foreign bodies. To this end, two lines of investigation are considered for each of the two designs:
• What is the greatest depth at which the measuring instrument can detect a foreign body with a given radius?
• What is the smallest dimension of a foreign body detectable by the measuring instrument at a given depth?
As described above, a resolution of 25 pT is considered for detectability purposes by the Aichi GMI sensor. That is, secondary magnetic fields above 25 pT are considered measurable. This threshold value was used for the two analyses described below in Section 3.3.1; Section 3.3.2.
3.3.1 Maximum depths for foreign bodies detection
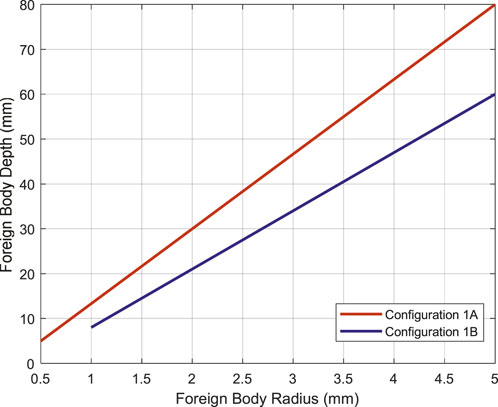
Considering a foreign body with a particular radius r positioned in the symmetry plane of the measuring instrument, it is possible, from the smallest possible distance between the measuring system and the foreign body (interface between the surface of the measuring device and the external radius of the foreign body), to increase the depth of the foreign body until the measurement system no longer perceives it. This depth would then be considered the greatest distance the measurement system can detect this foreign body of radius r. Given the threshold resolution of 25 pT, it is possible to apply this analysis systematically for foreign bodies of various radii. This analytical sequence makes it possible to characterize the proposed measurement system concerning foreign body radius and maximum detection depth. Figure 15 shows the relationship between the foreign body radius and its maximum detection depth for both selected configurations (Configuration 1A and 1B). This simulation was implemented according to a systematic variation of the foreign body radius.
As observed in Figure 15, the smaller the foreign body radius, the smaller the maximum depth at which the measurement instrument can detect it. Configuration 1A of the measurement system (component of the magnetic field measured by the magnetometer parallel to the excitation) presents the ability to detect spherical foreign bodies with 0.5 mm radius at a depth of up to 5 mm; foreign bodies with 2.0 mm radius at a depth of up to approximately 30 mm; foreign bodies with 4.0 mm radius at a depth of more than 60 mm; and foreign bodies with 5.0 mm radius at a distance of approximately up to 80 mm.
The proposed instrument with Configuration 1B (magnetic field component measured by the magnetometer orthogonal to the excitation) exhibits the ability to detect spherical foreign bodies of 1.0 mm radius at a depth of up to 8 mm; foreign bodies with more than 2.0 mm radius at a depth of approximately 25 mm; foreign bodies with 4 mm radius at an approximate maximum depth of 45 mm; and foreign bodies with 5 mm radius at a depth of approximately 60 mm.
According to the results presented in Figure 15, for both proposed instrument configurations, it can be seen that the maximum depth of foreign body detection has a strongly linear behavior with the variation of its radius. The measurement system with Configuration 1A can locate foreign bodies with an up to 0.5 mm radius. In comparison, the smallest foreign body that the system with Configuration 1B can detect has a diameter of 1 mm, twice the smallest foreign body detected by the measurement system proposed with Configuration 1A.
Figure 15 also shows that for a foreign body of a certain radius, the system with Configuration 1A can detect it at a greater depth than the system with Configuration 1B. For example, for the largest radius foreign body considered in the simulation, 5 mm, Configuration 1A can detect it at a depth 20 mm greater than the maximum detection depth of the instrument with Configuration 1B.
Therefore, Configuration 1A has greater measurement capability than Configuration 1B and is the most recommended when working with measurement scenarios involving small foreign bodies (radii less than 1 mm) or where there is a significant distance between the measurement instrument and the foreign body.
3.3.2 Minimum detectable radius
The previously developed instrument using a single solenoid for excitation [20, 21, 32] could detect foreign bodies with a radius of 1.25 mm at a depth of 10 mm, foreign bodies with a radius of 3.25 mm at depths up to 40 mm, or a radius of 4.75 mm at a depth of 50 mm, and successively. From a depth of 70 mm, this previously proposed configuration could only detect foreign bodies with radii greater than 20 mm.
Regarding the instrument proposed here, Configuration 1A has demonstrated to possess relevant features, being able to perceive a foreign body with a 0.8 mm radius at a depth of 10 mm; foreign bodies with a 2.2 mm radius at a depth of 40 mm; foreign bodies of approximately 2.8 mm radius at a depth of 50 mm; and so on, up to a foreign body of 7.2 mm radius at a depth of 100 mm.
Configuration 1B, on the other hand, is only able to detect a foreign body of 1.1 mm radius at a depth of 10 mm, a foreign body of 3 mm radius at a depth of 40 mm, and so on up to a foreign body of 8.3 mm radius at a depth of 80 mm. From a depth of 80 mm, this setup can only detect foreign objects with radii larger than 10 mm.
Both configurations selected for the proposed instrument can detect smaller foreign bodies at greater depths than the previously developed device, enabling the detection of tiny fragments at much deeper locations. This result demonstrates that the proposed configurations overcome the relevant drawback of the previously developed system version, whose excitation system configuration and the sensor are strongly coupled [20]. This feature made the magnetometer intensely affected by the excitation, which, for the proper operation of the instrument, required the primary field at the sensing element region to be restricted to the linear measurement range of the GMI sensor [30].
For the configuration proposed here, the excitation and measurement elements are decoupled. Therefore, the primary magnetic flux density perceived by the magnetometer is of low intensity, as demonstrated by the distribution of its magnetic field in the measurement space. Thus, in the proposed design, the excitation field is not restricted by the operation of the magnetometer, allowing a higher intensity of the magnetic flux density generated by eddy currents induction in the foreign body.
The comparative analysis of the proposed configurations revealed a higher measurement capability of Configuration 1A than Configuration 1B. This outcome is partly due to the higher intensity of the excitation field that Configuration 1A allows, limited only by its constructive characteristics and the ICNIRP safety guidelines.
Hence, considering the requirement of dealing with measurement scenarios that involve localizing tiny foreign bodies or objects far away from the GMI sensing element, Configuration 1A is the most recommended system to be applied.
4 Discussion and conclusion
This research develops layout design proposals and their computational validation to provide a novel measurement system configuration for localizing non-magnetic metallic foreign objects in the human body based on eddy current generation and secondary magnetic field mapping performed by a GMI sensor.
The here-developed approach dissociates the excitation and measurement phases to enhance the magnetic transducer’s measurement capacity by overcoming limitations evidenced in a configuration previously developed at LaBioMet/PUC-Rio [20, 21, 30], associated with the interference of the primary excitation magnetic field on the operation of the sensor elements [20, 21]. In that previous arrangement, the excitation and measurement stages were coupled, restricting the foreign body’s maximum value for the excitation magnetic flux density to the limiting value of the linear operating range of the GMI sensor [30].
The alternative configurations for the measurement system proposed in the present work employ a new concept for the layout of the excitation system, consisting of pairs of planar spiral coils (Configuration 1) or long and vertical solenoids (Configuration 2), both with windings in opposite directions; the direction of the sensitivity axis of the GMI sensor was also varied by placing it horizontally (Configuration A) or vertically (Configuration B).
The implemented analysis for performance evaluation associated with the relationship between the ability to excite the foreign body with higher field values and the requirement of the sensor to remain within the linear measurement range revealed that Configuration 1 of the excitation system yielded better outcomes for any orientation of the GMI sensor (1A or 1B) than Configuration 2.
For these two configurations (1A and 1B), the secondary magnetic field generated by eddy currents induced in non-magnetic metallic foreign bodies was evaluated utilizing their theoretical modeling and computational implementation. The secondary magnetic field maps for different depths of the foreign body showed a monopolar behavior for the GMI sensor in the horizontal position (Configuration 1A) and dipolar for the sensor positioned vertically (Configuration 1B).
Evaluating the instrument’s measurement capability for these two configurations (1A and 1B) by analyzing the absolute highest value of the secondary magnetic flux density compared to the magnetometer’s resolution, it was observed that, for both configurations, the maximum depth of detection of foreign bodies as a function of the variation of their radius has a strongly linear behavior.
Both configurations (1A and 1B) of the proposed instrument were able to detect smaller foreign bodies (for a particular depth) than the instrument previously developed at LaBioMet/PUC-Rio [20, 21].
These successful results of the proposed configuration stem from decoupling the excitation and measurement elements, avoiding limitations to the excitation field by the magnetometer’s requirements. The low intensity of the primary magnetic flux density perceived by the magnetometer allows for increased secondary magnetic flux density levels generated by the eddy currents induced in the foreign body.
Configuration 1A, in turn, was characterized by a higher measurement capacity than Configuration 1B, making it possible to amplify further the secondary magnetic field produced by the eddy currents induced in the metallic object with a more significant increase in the excitation intensity while still preserving the harmlessness of the system based on ICNIRP exposure limits [29], and maintaining the operation of the sensor in the linear region. Thus, this configuration, which consists of an excitation system using planar solenoids and a horizontally positioned GMI sensor, is better suited for more critical measurement scenarios involving tiny foreign bodies positioned at greater depths.
The proposed system overcomes the limitations of previous approaches by adopting the planar solenoids as the alternative configuration of the excitation stage and horizontally positioned GMI sensors in the measurement stage. This strategy enhances the secondary magnetic flux density generated by eddy currents induced in foreign bodies, allowing for the noninvasive and harmless detection of small missile fragments deep within the skin.
These optimized detection characteristics, coupled with a relatively low-cost measurement system that pursues compliance with biometrological principles [7, 8, 21], would enable large-scale clinical adoption of this portable device for the noninvasive and innocuous localization of non-ferromagnetic metallic foreign bodies in patients, contributing to ensuring rapid, safe and successful surgical procedures for their removal.
Data availability statement
The raw data supporting the conclusion of this article will be made available by the authors, without undue reservation.
Author contributions
VS: Conceptualization, Data curation, Formal Analysis, Investigation, Methodology, Software, Validation, Writing–original draft, Visualization. CB: Conceptualization, Formal Analysis, Investigation, Methodology, Supervision, Validation, Writing–original draft, Writing–review and editing, Data curation, Funding acquisition, Project administration, Resources, Software. EC: Conceptualization, Formal Analysis, Investigation, Methodology, Validation, Writing–original draft, Supervision, Writing–review and editing.
Funding
The author(s) declare financial support was received for the research, authorship, and/or publication of this article. This study was financed in part by the Coordenação de Aperfeiçoamento de Pessoal de Nível Superior (Capes)—Finance Code 001.
Acknowledgments
The authors thank for the financial support provided by the Brazilian funding agencies CNPq, FINEP, and FAPERJ.
Conflict of interest
The authors declare that the research was conducted in the absence of any commercial or financial relationships that could be construed as a potential conflict of interest.
Publisher’s note
All claims expressed in this article are solely those of the authors and do not necessarily represent those of their affiliated organizations, or those of the publisher, the editors and the reviewers. Any product that may be evaluated in this article, or claim that may be made by its manufacturer, is not guaranteed or endorsed by the publisher.
References
1. Costa Monteiro E, Barbosa C, Lima E, Costa Ribeiro P, Boechat P Locating steel needles in the human body using a SQUID magnetometer. Phys Med Bio (2000) 45(8):2389–402. doi:10.1088/0031-9155/45/8/323
2. Aras MH, Miloglu O, Barutcugil C, Kantarci M, Ozcan E, Harorli A Comparison of the sensitivity for detecting foreign bodies among conventional plain radiography, computed tomography and ultrasonography. Dentomaxillofacial Radiol (2010) 39(2):72–8. doi:10.1259/dmfr/68589458
3. Del Cura JL, Aza I, Zbala RM, Srabia M, Korta I US-Guided localization and removal of soft-tissue foreign bodies. RadioGraphics (2020) 40:1188–95. doi:10.1148/rg.2020200001
4. Maralakunte M, Debi U, Singh L, Pruthi H, Bhatia V, Devi G, et al. Foreign body imaging-experience with 6 cases of retained foreign bodies in the emergency radiology unit. Arch Clin Med Case Rep (2020) 4(5):952–68. doi:10.26502/acmcr.96550285
5. Barbosa CRH, Costa Monteiro E, Lima EA, Santos S, Cavalcanti E, Costa Ribeiro P Improvement of a technique for localization of steel needles in humans using a SQUID magnetometer. IEEE Trans App Sup (2001) 11(1):677–80. doi:10.1109/77.919435
6. Andrä W, Nowak H, Magnetism H In medicine: a handbook. 2. Weinheim: WILEY-VCH Verlag GmbH and Co. KGaA (2007).
7. Costa Monteiro E, Leon L Metrological reliability of medical devices. J Phys Conf Ser (2015) 588:012032. doi:10.1088/1742-6596/588/1/012032
8. Costa Monteiro E, Summers R Metrological requirements for biomedical device assessment and their ethical implications. Meas Sensors (2022) 24:100574. doi:10.1016/j.measen.2022.100574
9. Robbes D Highly sensitive magnetometers - a review. Sens Actuator A-phys (2006) 129:86–93. 1–2 Special Issue. doi:10.1016/j.sna.2005.11.023
11. Phan MH, Peng HX. Giant magnetoimpedance materials: fundamentals and applications. Prog Mater Sci (2008) 53:323–420. doi:10.1016/j.pmatsci.2007.05.003
12. Zheng GT, Liu ZH, Jiang DG. GMI effect of FeCoSiB amorphous ribbon. Adv Mater Res (2010) 148–149:644–8. doi:10.4028/www.scientific.net/amr.148-149.644
13. Ripka P, Janošek M Advances in magnetic field sensors. IEEE Sens J (2010) 10(6):1108–16. doi:10.1109/jsen.2010.2043429
14. Machado FLA, Silva Blda, Rezende SM, Martins CS. Giant ac magnetoresistance in the soft ferromagnet Co70.4Fe 4.6Si15B10. J Appl Phys (2018) 75(10):6563–5. doi:10.1063/1.356919
15. Hauser H, Kraus L, Ripka P Giant magnetoimpedance sensors. IEEE Instrum Meas Mag (2001) 4(2):28–32. doi:10.1109/5289.930983
16. Knobel V, Pirota KR Giant magnetoimpedance concepts and recent progress. J Magn Magn Mater (2002) 242:33–40. doi:10.1016/s0304-8853(01)01180-5
17. Ripka P, Mirzaei M, Blažek J Magnetic position sensors. Meas Sci Technol V (2022) 33:022002. doi:10.1088/1361-6501/ac32eb
18. Pompéia F, Gusmão LAP, Barbosa CRH, Costa Monteiro E, Gonçalves L, Machado F Ring shaped magnetic field transducer based on the GMI effect. Meas Sci Technol (2008) 19:025801. doi:10.1088/0957-0233/19/2/025801
19. Silva EC, Gusmão LAP, Barbosa CRH, Costa Monteiro E, Machado F High sensitivity giant magneto-impedance (GMI) magnetic transducer: magnitude versus phase sensing. Meas Sci Technol (2011) 29:035106. doi:10.1088/1361-6501/aaa27f
20. Fortaleza LGS, Barbosa C, Costa Monteiro E, Silva E, Gusmão L Detecting non-magnetic metallic foreign bodies by GMR sensors through the use of eddy currents. XI Int Congress Electr Metrology (Semetro) (2015) 1–4.
21. Fortaleza LGS, Costa Monteiro E, Barbosa CRH, Silva EC, Gusmão LAP Biomedical comparison of magneto-meters for non-ferromagnetic metallic foreign body detection. J Phys Conf. Ser (2018) 1044:012013. doi:10.1088/1742-6596/1044/1/012013
22. Benavides LS, Silva EC, Costa Monteiro E Pressure transducer based on the phase characteristics of GMI effect for measuring the arterial pulse wave. J Phys Conf. Ser (2018) 1065:072039. doi:10.1088/1742-6596/1065/7/072039
23. Dienstknecht T, Horst K, Sellei RM, Berner A, Nerlich M, Hardcastle TC “Indications for bullet removal: overview of the literature, and clinical practice guidelines for European trauma surgeons”. Eur J Trauma Emerg Surg (2012) 38(38):89–93. doi:10.1007/s00068-011-0170-x
24. Barbosa CRH. Localization of firearm projectiles in the human body using a superconducting quantum interference device magnetometer: a theoretical study. Rev Scientific Instr (2004) 75(6):2098–106. doi:10.1063/1.1753679
25. Sacchetti A, Carraccio C, Lichenstein R Hand-held metal detector identification of ingested foreign bodies. Pediatr Emerg Care (1994) 10(4):204–7. doi:10.1097/00006565-199408000-00005
26. Muensterer OJ, Joppich I Identification and topographic localization of metallic foreign bodies by metal detector. J Pediatr Surg (2004) 39(8):1245–8. doi:10.1016/j.jpedsurg.2004.04.011
27. Sakthivel M, George B, Sivaprakasam M A new inductive proximity sensor based guiding tool to locate metal shrapnel during surgery. IEEE Trans Instrumentation Meas (2014) 63:2940–9. doi:10.1109/tim.2014.2326767
28. Ye Z, Zhang C, Ye Y Principle of a low-frequency transient electromagnetic radar system and its application in the detection of underground pipelines and voids. Tunnelling Underground Space Tech (2022) 122:104392. doi:10.1016/j.tust.2022.104392
29. International Commission on Non-Ionizing Radiation Protection. Guidelines for limiting exposure to time-varying electric and magnetic fields (1 Hz to 100 kHz). Health Phys (2010) 99(6):818–36. doi:10.1097/HP.0b013e3181f06c86
30. Micro Inteligent Corporation. Datasheet multi-type nano-tesla sensor (MI-CB-1DJM) Aichi Micro inteligent corporation (2022).
31. Palatnik de Sousa I, Barbosa CRH, Costa Monteiro E Safe exposure distances for transcranial magnetic stimulation based on computer simulations. PeerJ (2018) 6:e5034. doi:10.7717/peerj.5034
32. Fortaleza LGC Non-ferromagnetic metallic foreign body detection by eddy currents. Rio de Janeiro: Pontifical Catholic University of Rio de Janeiro (2016). MSc Thesis Metrology Department.
33. Pichorim S Review, study, and research of coils for sensors and telemetry (2011). doi:10.13140/2.1.3265.9200
Keywords: GMI magnetometer, foreign body localization, eddy currents, magnetic transducer, non-ferromagnetic, biomedical application
Citation: Seixas VT, Barbosa CRH and Costa Monteiro E (2024) Design of a system for detection of non-ferromagnetic metallic foreign bodies based in eddy currents and GMI magnetometer. Front. Phys. 12:1330887. doi: 10.3389/fphy.2024.1330887
Received: 31 October 2023; Accepted: 15 April 2024;
Published: 06 May 2024.
Edited by:
Subhankar Bedanta, National Institute of Science Education and Research (NISER), IndiaReviewed by:
Dryver R. Huston, University of Vermont, United StatesBo Feng, Huazhong University of Science and Technology, China
Copyright © 2024 Seixas, Barbosa and Costa Monteiro. This is an open-access article distributed under the terms of the Creative Commons Attribution License (CC BY). The use, distribution or reproduction in other forums is permitted, provided the original author(s) and the copyright owner(s) are credited and that the original publication in this journal is cited, in accordance with accepted academic practice. No use, distribution or reproduction is permitted which does not comply with these terms.
*Correspondence: Carlos Roberto Hall Barbosa, aGFsbEBwdWMtcmlvLmJy
 Vinícius Tostes Seixas