ORIGINAL RESEARCH article

Front. Phys., 06 March 2024
Sec. Fluid Dynamics
This article is part of the Research Topic Fluid-Structure Dynamics in Wind Engineering View all 3 articles

Study of the effect of wind angles on the aerodynamic characteristics of high-speed trains subjected to a translating simulated tornado

Mu Li,
Mu Li1,2*Jiankun Gan,Jiankun Gan1,2Yuanzhao Zhang,Yuanzhao Zhang1,2Yecheng Wu,Yecheng Wu1,2Bo Chai,Bo Chai1,2
  • 1School of Civil Engineering, Beijing Jiaotong University, Beijing, China
  • 2Beijing’s Key Laboratory of Structural Wind Engineering and Urban Wind Environment, School of Civil Engineering, Beijing Jiaotong University, Beijing, China

The probability of high-speed trains being hit by tornadoes is increasing. Therefore, this paper studies the effect of wind angles on the aerodynamic characteristics of a high-speed train subjected to a translating simulated tornado. A small six-dimensional force/torque sensor was used to measure the aerodynamic force and moment of a high-speed train model at a reduced scale of 1:150. The models, consisting of high-speed train heads and cars with different aerodynamic shapes, displayed non-stationary characteristics in their respective aerodynamic force and moment coefficient time histories. The variation trends of the ensemble time-varying mean of the pitching moment coefficient of a high-speed train car and head, for wind angles smaller than 60° and 45°, respectively, are different from those for other wind angles. The lift force coefficient ensemble time-varying mean of the high-speed train head is asymmetrical along the longitudinal axis when the wind angle is smaller than 60°, which is different from that of the high-speed train car. The maximum values of the ensemble time-varying mean of the force and moment coefficient of the high-speed train are almost equal under different movement directions of the tornado simulator at each wind angle, which is also true for the minimum value of the force and moment coefficient of the high-speed train. The ensemble time-varying variance of the force and moment coefficient of the high-speed train model in the region of −200 mm–200 mm is greater than that in other regions. This study can contribute to a more comprehensive and accurate understanding of the interaction between tornadoes and high-speed trains.

1 Introduction

In recent decades, China’s network has rapidly expanded and become increasingly, densely distributed. Several tornadoes have occurred in the vicinity of China’s high-speed rail network [1]. Tornadoes, known for their destructive nature [2, 3], pose a significant threat to the safe operation of high-speed trains. In 2005, a high-speed train operating on the Uetsu line was overturned by a tornado. Tornadoes also caused accidents on the Tozai line in 1978 and on the Nippo main line in 2006 [4]. Recent events, such as the tornadoes in Shangzhi, Heilongjiang Province on 1 June 2021, and in Qingyuan District, Baoding, Hebei Province on 21 July 2021, have also affected the normal operation of the high-speed trains. It is important to mention that tornadoes have a certain speed of movement. Thus, studies on the aerodynamic characteristics of high-speed trains under translating tornadoes have practical significance. The force and moment coefficients, in particular, serve as key indicators of the aerodynamic characteristics.

While previous studies have focused on low-rise buildings and other structures under translating tornadoes [58], there have been few studies on the impact of tornadoes on high-speed trains. Suzuki and Okura [9] conducted a pressure measurement test on a single train car model, with a shape similar to that of a high-speed train, passing through a simulated tornado. Their results showed that the time-history trends of lateral force, lift force, and yaw moment were non-stationary. The lift force reached its maximum value when the single train car reached the center of the simulated tornado. Xu et al. [10] utilized computational fluid dynamics (CFD) calculations to simulate the situation when a high-speed train encountered a tornado and focused on the aerodynamic characteristics of the high-speed train head. Their results showed that the time-history trends of the lateral force, lift force, rolling moment, and yaw moment of the high-speed train head were non-stationary. These studies offer valuable contributions, but they were based on fixed wind angles. There is only one condition for wind angle in these studies mentioned above. The vortex core is the main structure of the tornado, and its size is limited compared with the boundary layer wind. In addition, the wind angles of the high-speed train may affect the contact state between the high-speed train and the tornado vortex core, so it is necessary to consider the effect of the wind angles on the aerodynamic characteristics of the high-speed train. Therefore, the number of wind angle conditions is being investigated in further detail in this research. The aerodynamic shape of the high-speed train head is different from that of the high-speed train car. To the best of our knowledge, there is a paucity of experimental investigations on high-speed train heads. To enhance the safe operation of high-speed trains, it is imperative to investigate the aerodynamic characteristics of a high-speed train head under a translating tornado using a tornado simulator and to further compare it with a high-speed train car.

The time-varying mean, characterized by a non-stationary time history, provides insight into the evolution process of the aerodynamic characteristics of a high-speed train under a translating tornado. The short-time Fourier transform can be used to analyze the non-stationary time history of the wind pressure generated by the translating tornado [8]. This method involves using a window function to identify the time-domain information, and the choice of the window function can introduce errors in the analysis. Alternatively, the wavelet transform can be used to extract the time-varying mean from the wind pressure [6], and the accuracy of the result mainly depends on the predefined wavelet order [11, 12]. A complete ensemble empirical mode decomposition with adaptive noise algorithm (CEEMDAN) [13] comes from the empirical mode decomposition (EMD) [14] and ensemble empirical mode decomposition (EEMD) [15]. CEEMDAN is a data-driven adaptive method as there is no predefined function in CEEMDAN. EMD was used to analyze the non-stationary wind speed data of Hurricane Lili in 2002, and then the time-varying mean was obtained [16]. EEMD was used to analyze the full-scale downburst wind record and extract the time-varying mean [12]. CEEMDAN was used to extract the time-varying mean in this study, and to the best of the authors’ knowledge, CEEMDAN has not been used in tornado-related research. The evolutionary power spectral density (EPSD) [17] with time dependence is a generalization of the power spectral density. It can be used to calculate the time-varying variance.

This work aims to conduct translating tornado experiments to study the effects of wind angles on the aerodynamic characteristics of a high-speed train. The tornado simulator at Beijing Jiaotong University was used to generate the three-dimensional simulated tornado wind field. The pressure measurement results require an integral calculation to obtain the aerodynamic force and moment of the high-speed train. The accuracy of this integral calculation depends on the number of pressure measurement points and the location of the pressure measurement points on the model. A small six-dimensional force/torque sensor (NANO17) was used to directly measure the aerodynamic force and moment of the high-speed train under the complex simulated tornado wind field, and the experimental accuracy can be guaranteed. To the authors’ knowledge, there was no study conducted on the aerodynamic characteristics of high-speed trains under simulated translating tornadoes using a six-dimensional force/torque sensor. This study can contribute to a deeper understanding of the dynamic interaction between tornadoes and high-speed trains.

2 Methodology

2.1 Tornado simulator

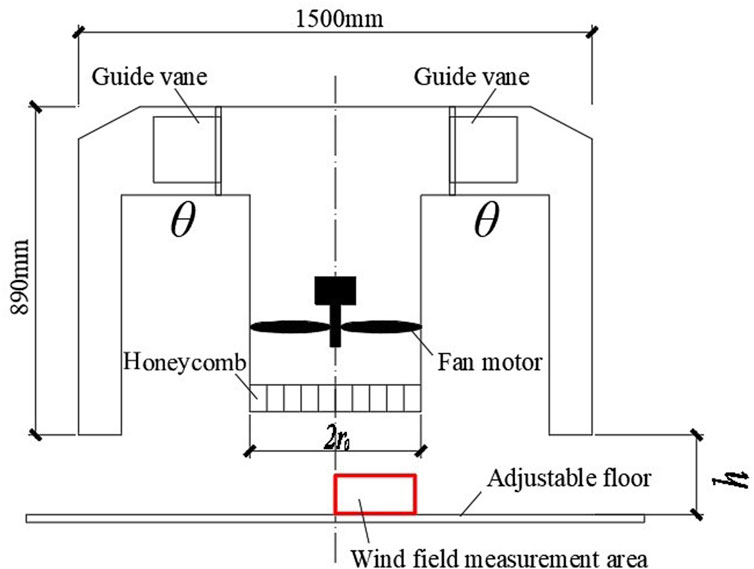
The force test was conducted using the tornado simulator at Beijing Jiaotong University, as shown in Figure 1. The mechanism of this tornado simulator is similar to that of Iowa State University [18]. In the tornado simulator, there is a uniform velocity distribution at the same radius[19]. The diameter and height of the tornado simulator in this study were 1,500 mm and 890 mm, respectively. The radius of the updraft hole (r0) is 250 mm. The guide vane was located at the top of the tornado simulator, which is different from the Ward-type tornado simulator [20]. This tornado simulator was placed on a movable overhead crane and therefore tornado simulator can translate along the ground plane. Thus, translating simulated tornado could be generated by tornado simulator.

FIGURE 1
www.frontiersin.org

FIGURE 1. A schematic diagram of the tornado simulator at Beijing Jiaotong University.

The swirl ratio (S) is a parameter that controls the simulated tornado wind field. It can be selected by adjusting the guide vane angle (θ). The variation range of θ is 0°–60°. S can be expressed as S=tanθ/2a , where a is the aspect ratio which is equal to h/r0. In this study, h and S are respectively set to 300 mm and 0.35, respectively, with a corresponding θ value of 40°.

2.2 Simulated tornado wind field

The simulated tornado wind field was measured by a TFI Cobra probe with a sampling frequency of 1,250 Hz. The measurement ranges of the tornado wind field height (z) and radial distance (r) were 10–200 mm and 0–300 mm, respectively (Figure 1). The simulated tornado wind field was three-dimensional and included tangential wind velocity, radial wind velocity, vertical wind velocity, and pressure drop. The tangential wind velocity and pressure drop were the primary components of the simulated tornado wind field.

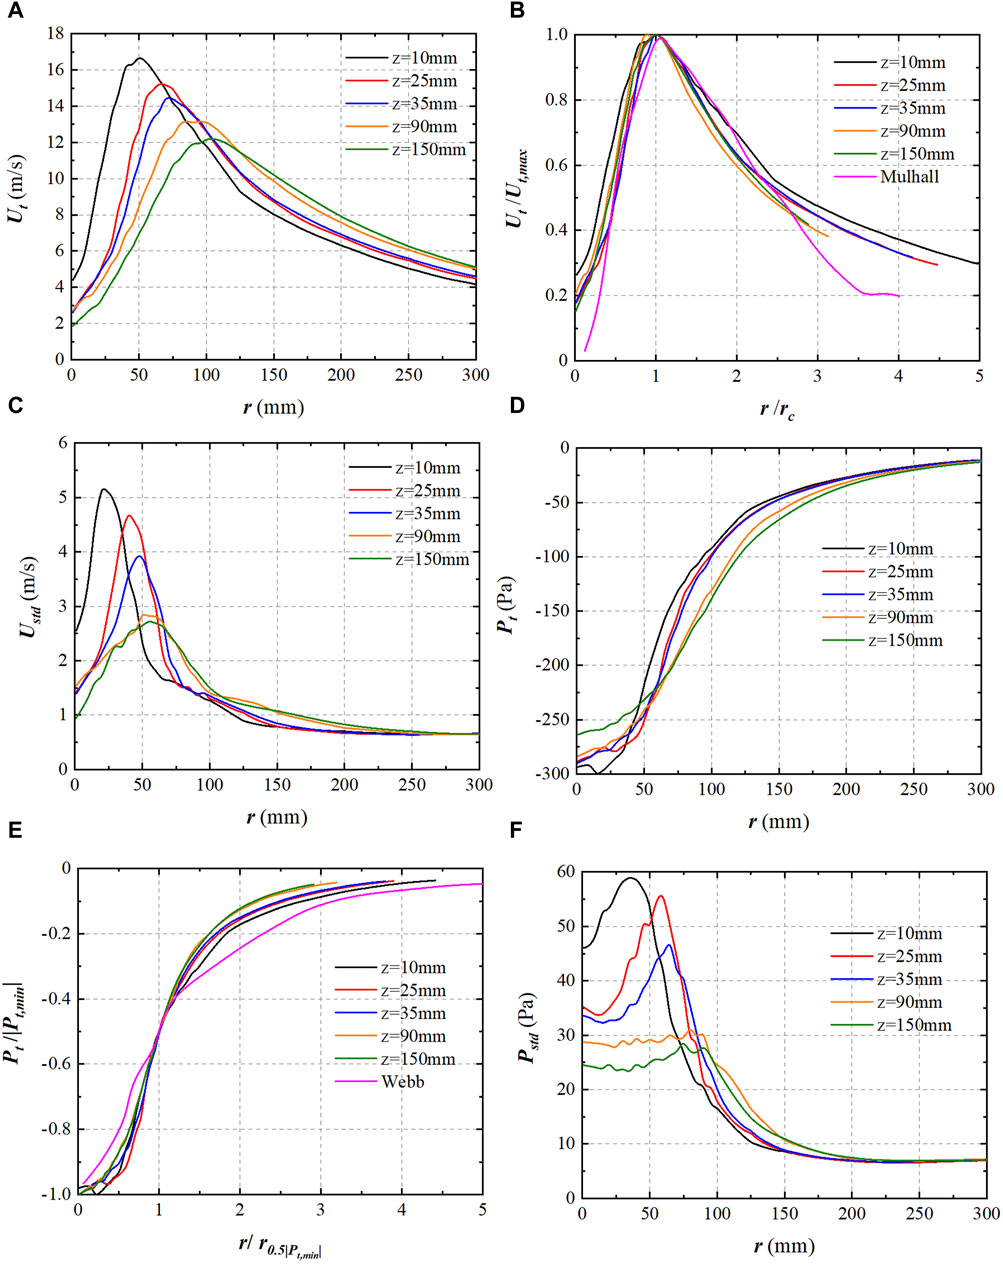
The radial distribution of the mean value of the tangential wind velocity (Ut) is shown in Figure 2A. Ut first increased to the maximum value of Ut (Ut,max) at the tornado vortex core (rc), and then decreased as r increased at each z. When z increased, Ut,max gradually decreased. Ut and r were normalized by Ut,max and rc, respectively, within the same z, as shown in Figure 2B. The normalized radial distribution of Ut of the simulated tornado was consistent with that of the field data of the Mulhall tornado [21].

FIGURE 2
www.frontiersin.org

FIGURE 2. Radial distribution of (A) Ut , (B) normalized Ut, (C) Ustd, (D) Pt, (E) normalized Pt and (F) Pstd.

The radial distribution of the standard deviation of the tangential wind velocity (Ustd) is shown in Figure 2C. The value of Ustd inside rc was greater than that outside rc. The maximum value of Ustd decreased as z increased. When r exceeded 200 mm, Ustd at different z values tended toward the same value which was smaller than 1 m/s.

The radial distribution of the mean value of the pressure drop (Pt) is shown in Figure 2D. The value of Pt increased as r approached the center of the tornado vortex, indicating maximum suction at the center of the tornado vortex itself. As r increased, Pt gradually increased and tended to 0 Pa. Pt and r were normalized by the absolute value of the minimum Pt (Pt,min) and the radial position (r0.5Pt,min) where half of Pt,min (0.5Pt,min) occurred, respectively. The normalized radial distribution of Pt of the simulated tornado was consistent with that of the Webb tornado field data [22], as shown in Figure 2E.

The radial distribution of the standard deviation of the pressure drop (Pstd) is shown in Figure 2F. Similar to Ustd, the value of Pstd inside rc was greater than that outside rc. In addition, when z increased, the maximum Pstd value decreased. When r was greater than 200 mm, Pstd at different z values tended to the same value which was smaller than 10 Pa.

2.3 High-speed train model and force test

The high-frequency force/torque sensor could directly measure the aerodynamic force and moment of the high-speed train inside the simulated tornado, making it an effective method for examining the aerodynamic characteristics of a high-speed train. The size of the simulated tornado vortex core was limited due to the limited size of the tornado simulator at Beijing Jiaotong University. To enhance the realism of the force test, the size of the high-speed train model was reduced to maintain the relative size relationship between the high-speed train model and the simulated tornado vortex core. NANO17 (SI-50-0.5), a six-dimensional high-frequency force/torque sensor manufactured by ATI, was used for this purpose. Its diameter and height were 17 mm and 14.5 mm, respectively, and its compactness allowed for seamless integration into the small force test model. The measurement ranges of the X-axis, Y-axis, and Z-axis forces of NANO17 were 0–50, 0-50, and 0–70 N, respectively. The measurement ranges of its X-axis, Y-axis, and Z-axis moments were 0–0.5 Nm. These measurement ranges prevented the sensor from being overloaded during the connection process with the force test model. The resolutions of the three-axis force and three-axis moment were 1/80 N and 1/0.016 Nm, respectively, ensuring high accuracy during force testing.

The prototype used for the high-speed train model was the CRH380A. The lengths of the high-speed train head and car of the CRH380A were 26500 mm and 25,000 mm, respectively. The maximum width and maximum height of the CRH380A were all 3750 mm. The aerodynamic shape of the high-speed train head was different from that of the high-speed train car. Therefore, the force tests of the high-speed train head and car were conducted separately. The reduced scale of the high-speed train model was 1:150. The dimensions of the pantograph, bogie, wheel, and other components of the high-speed train were too small to display relative to the overall dimensions and thus were excluded from this analysis. The force/torque sensor was located in the center of the bottom of the high-speed train model. The integration between NANO17 and the high-speed train model is shown in Figures 3A, B, where the red frames represent NANO17.
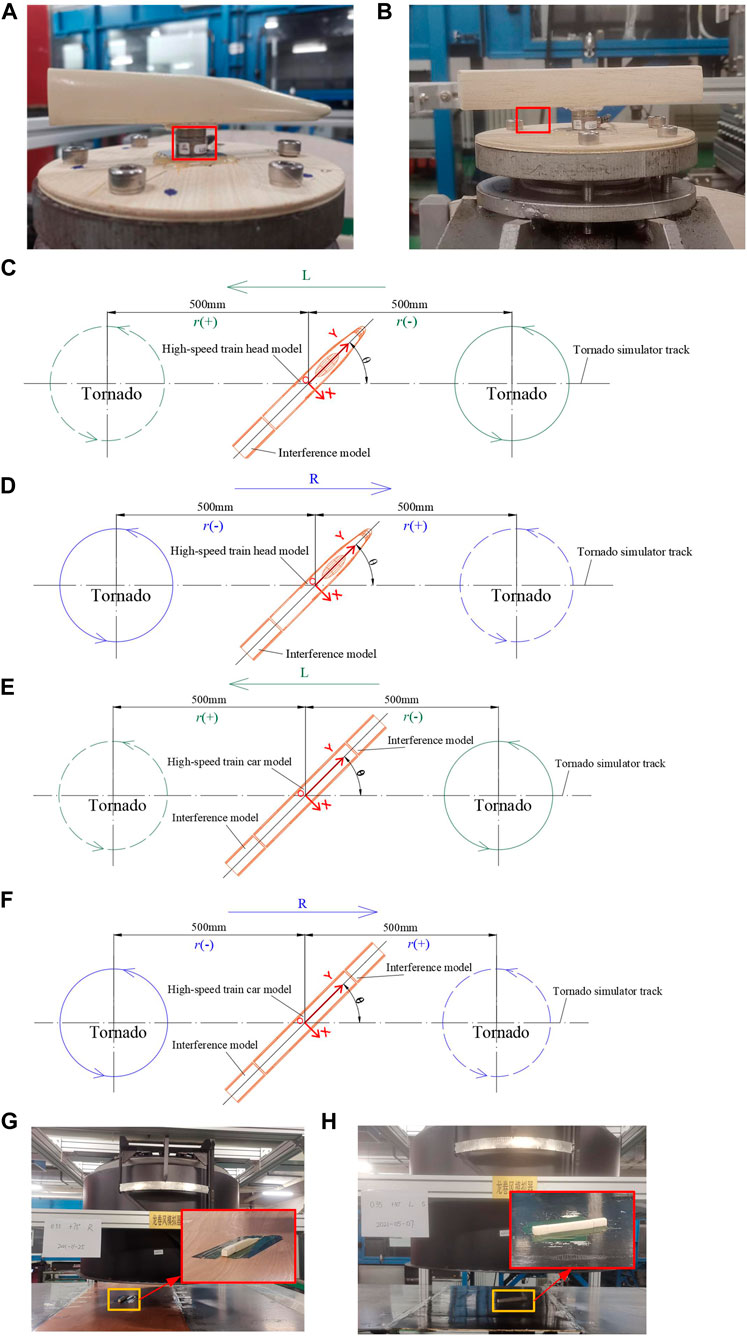
FIGURE 3
www.frontiersin.org

FIGURE 3. The integration between NANO17 and high-speed train head model (A)/car model (B); Layouts and wind angle of the high-speed train head model under the L (C) and R directions (D); Layouts and wind angle of the high-speed train car model under the L (E) and R directions (F); Force test photos of the high-speed train head model (G) and car model (H).

The high-speed train operated in marshaling mode, and the adjacent cars were considered the “interference model”. The cross-sectional shape of the interference model was similar to that of the high-speed train car model, with the length of the interference model being 50 mm. During force testing, the interference models were positioned at the non-nose end and both ends of the high-speed train head and car model, respectively. The longitudinal axis of the interference model was the same as that of the high-speed train model, as shown in Figure 3C through Figure 3F. The gap between the interference model and the high-speed train model was only 1–2 mm. The mass of the high-speed train model was kept as small as possible in order to ensure the high accuracy of the force test. The high-speed train model was made of wood with a hollow interior. The interference model was also made of wood.

The wind angle (θ) is an important factor affecting the aerodynamic characteristics of the high-speed train, as depicted in Figure 3C through Figure 3F. The high-speed train car had six θ values: 0°, 15°, 30°, 45°, 60°, and 90°. The aerodynamic shape of the high-speed train head was irregular compared to that of its car. Thus, the high-speed train head had seven θ values: 0°, 15°, 30°, 45°, 60°, 75°, and 90°.

The tornado simulator required a small distance during acceleration and deceleration. The start and end positions of the tornado simulator are 500 mm on either side of the high-speed train model, as shown in Figure 3C through Figure 3F, where the solid line indicates the tornado before movement and the dashed line indicates the tornado after the movement. The position of the high-speed train model was fixed throughout the force test. For each value of θ, there were two directions of motion of the tornado simulator, that is the L direction (Figures 3C, E) and the R direction (Figures 3D, F). The L direction represents the movement of the tornado simulator from the right end to the left end of the high-speed train model, as shown in Figures 3C, E. The R direction represents the movement of the tornado simulator from the left end to the right end of the high-speed train model, as shown in Figures 3D, F. For the L direction, the radial position (r) was negative (Figures 3C, E) when the tornado simulator was on the right side of the high-speed train model. Conversely, for the R direction, r was negative (Figures 3D, F) when the tornado simulator was on the left side of the high-speed train model. For each direction, 10-time history samples were taken, and the tornado simulator’s center track passed through O, with O in the middle of the bottom surface of the HST model. The sampling frequency of the force sensor was 312 Hz, and the tornado simulator speed (v) was 50 mm/s. Photographs of the force test are shown in Figures 3G, H. The orange frames in Figures 3G, H mark the high-speed train head model and the high-speed train car model, respectively, with enlarged views shown in red frames.

The force/torque sensor can simultaneously measure the aerodynamic force and moment (Figure 4): lateral force (Fx), drag force (Fy), lift force (Fz), pitching moment (Mx), rolling moment (My), and yaw moment (Mz). O is also the origin of the measurement reference system of HST, shown in Figure 4. The Fy value of the high-speed train car model was not included in the study because the interference model was set at both ends of the high-speed train car model. The aerodynamic force and moment coefficients can be calculated by Eqs 16:

CFx=Fx0.5ρV2LH(1)
CFy=Fy0.5ρV2WH(2)
CFz=Fz0.5ρV2LW(3)
CMx=Mx0.5ρV2L2W(4)
CMy=My0.5ρV2LH2(5)
CMz=Mz0.5ρV2L2H(6)

where CFx, CFy, CFz, CMx, CMy, and CMz are the coefficients of lateral force, drag force, lift force, pitching moment, rolling moment, and yaw moment, respectively; L is the length of the high-speed train model; W and H are the maximum width and maximum height of the cross-section of the high-speed train model, respectively; ρ is the air density; and V is the maximum tangential wind velocity at H, which is 15.2 m/s. As mentioned above, CFy was not considered in the high-speed train car model.

FIGURE 4
www.frontiersin.org

FIGURE 4. Aerodynamic force and moment on the (A) high-speed train head model and (B) high-speed train car model.

The force tests of the high-speed train head and car were then conducted. CFx,c, CFz,c, CMx,c, CMy,c, and CMz,c are the coefficients of lateral force, lift force, pitching moment, rolling moment, and yaw moment of the high-speed train car model; respectively. CFx,h, CFy,h, CFz,h, CMx,h, CMy,h, and CMz,h are the coefficients of lateral force, drag force, lift force, pitching moment, rolling moment, and yaw moment of the high-speed train head, respectively.

2.4 Data processing

CEEMDAN is a data-driven adaptive approach that can decompose the signal without a predefined base function. In this study, CEEMDAN was employed to decompose the time history of force and moment coefficients into several intrinsic mode functions (IMFs) and a residue. Each IMF and residue contain certain frequency information. It is necessary to determine the fluctuating items and the mean items.

EMD exhibited dyadic filter bank behavior [23, 24]. CEEMDAN was used to decompose the Gaussian white noise, and the number of sample points observed was 10,000. The number of zero-crossing points in each IMF and residue, as presented in Table 1, was almost doubled in comparison to the previous IMF, aligning with Flandrin’s findings [23]. Thus, CEEMDAN also has a dyadic filter bank behavior. The frequency range of each IMF was almost double that of the previous IMF.

TABLE 1
www.frontiersin.org

TABLE 1. The number of zero-crossing points of each IMF and residue.

The sampling frequency of the force/torque sensor was 312 Hz. According to the Nyquist sampling theorem, the maximum identifiable frequency (fmax) is 156 Hz. Thus, the frequency range of each IMF and residue was calculated by Eq. 7:

FreIMFi=fmax2ifmax2i1(7)

where FreIMFi represents the frequency range of the IMF and residue and i is the IMF order.

The period range (PerIMFi) of the IMF and residue was calculated by Eq. 8:

PerIMFi=2i1fmax2ifmaxs(8)

The wavelength range (WLIMFi) of the IMF and residue was obtained based on PerIMFi and v, see Eq. 9:

WLIMFi=2i1fmaxv2ifmaxvmm(9)

After determining WLIMFi, it was necessary to define the characteristic wavelength of the tornado wind field. The IMF and residue were classified based on the characteristics wavelength of the tornado wind field. Although the tornado wind field is three-dimensional, the tangential wind velocity is the main component of the tornado wind velocity. As indicated in Figure 2, when the radial position increased from 0 mm to 70 mm, Ut gradually increased until reaching a maximum value, and then decreased when the radial position was greater than 70 mm at a wind field height of 25 mm. Therefore, the characteristic wavelength of the tornado wind field was 70 mm. IMFs with wavelengths less than 70 mm can be seen as a time-varying fluctuating item, while other IMFs and residues were considered a time-varying mean item. The sum of the time-varying fluctuating items is a time-varying fluctuating component, and the sum of the time-varying mean items is a time-varying mean. The EPSD of the time-varying fluctuating component could then be obtained, and the time-varying variance was calculated by integrating EPSD over frequency.

3 Aerodynamic characteristics of the high-speed train car

A representative sample of CFx,c at a wind angle of 0° in the L direction was decomposed using CEEMDAN, as depicted in Figures 5A–M. The lower-order IMFs contain fast oscillation information, while the higher-order IMFs contain slow oscillation information. The frequency gradually decreased as the IMF order increased. Based on the method presented in Section 2.4, IMF1 to IMF8 were considered time-varying fluctuating items, and their sum was a time-varying fluctuating component, as shown in Figure 5N. IMF9 to IMF11 and the residue were considered time-varying mean items, and their sum was a time-varying mean, as shown in Figure 5O. The time-varying fluctuating component was considered stationary. The time-varying mean did not include more oscillation information, and it reflected the evolutionary process of CFx,c with the movement of the tornado simulator, as shown in Figure 5P. A total of 10 tests were conducted on the high-speed train car under each condition presented in Section 2.3. Each sample obtained a time-varying mean, and an ensemble time-varying mean was then derived. Figure 6 shows the time-varying mean and the ensemble time-varying mean of the force and moment coefficients of the 10 samples. The difference between the time-varying means of the samples was small, as shown in Figures 6A, C, E, F, I. The difference between the error lines and the ensemble time-varying mean was also small, as shown in Figures 6B, D, F, H, J. The ensemble time-varying mean effectively captured the evolutionary process of the high-speed train car.
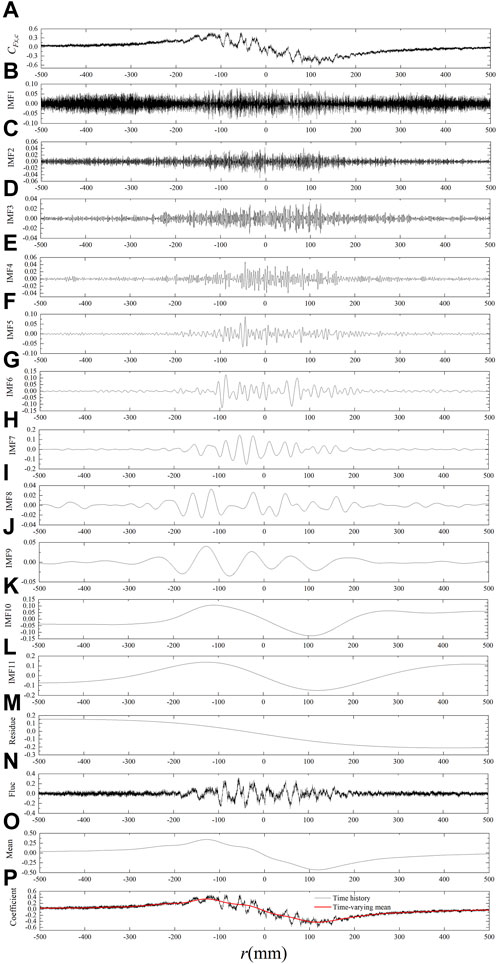
FIGURE 5
www.frontiersin.org

FIGURE 5. (A) A representative sample of CFx,c, (B–L) all the IMFs of CFx,c sample, (M) residue of CFx,c sample, (N) time-varying fluctuating component of CFX,c sample, (O) time-varying mean of CFx,c sample and (P) comparison between CFx,c sample and time-varying mean of CFx,c sample.
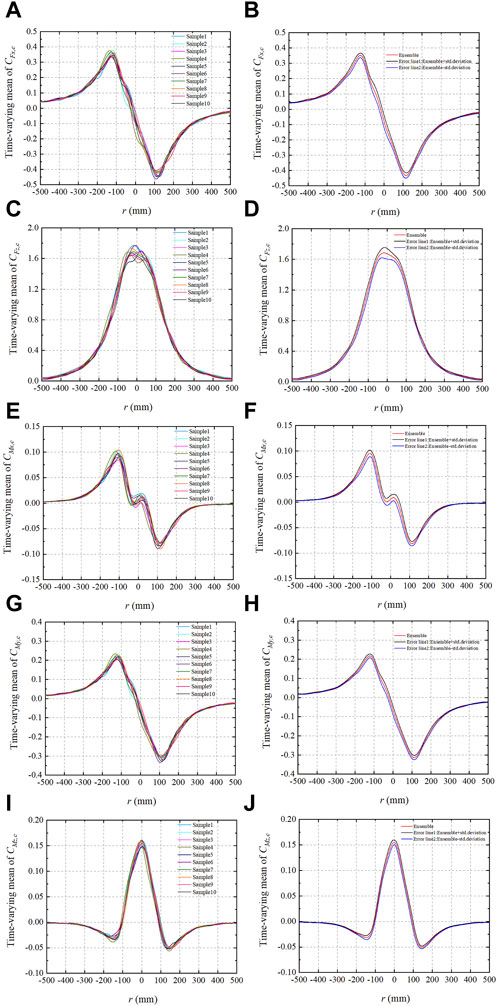
FIGURE 6
www.frontiersin.org

FIGURE 6. Sample time-varying mean of (A) CFx,c, (C) CFz,c, (E) CMx,c, (G) CMy,c, and (I) CMz,c; Ensemble time-varying mean and error line of (B) CFx,c, (D) CFz,c, (F) CMx,c, (H) CMy,c, and (J) CMz,c.

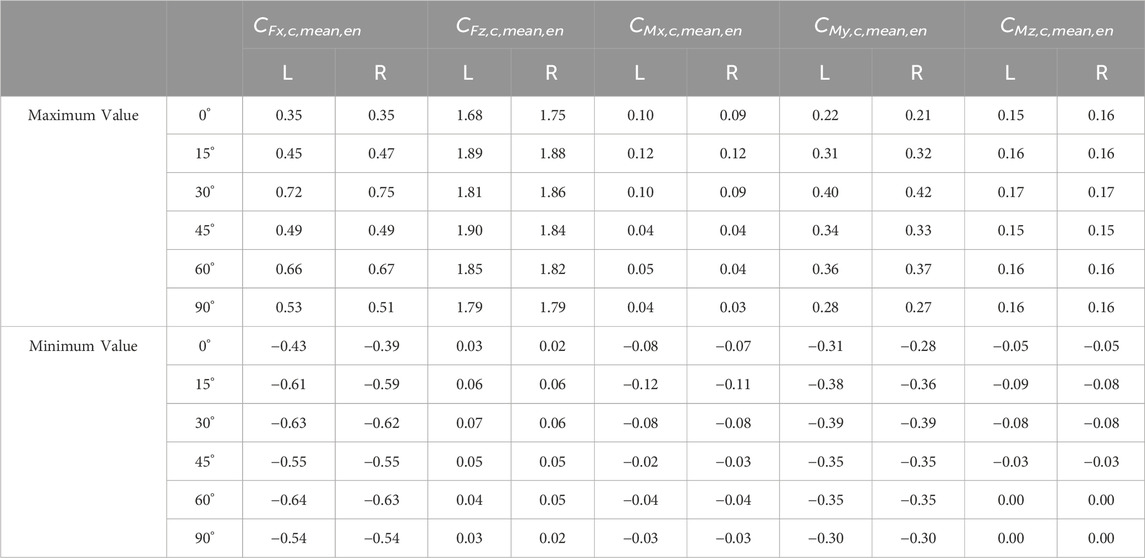
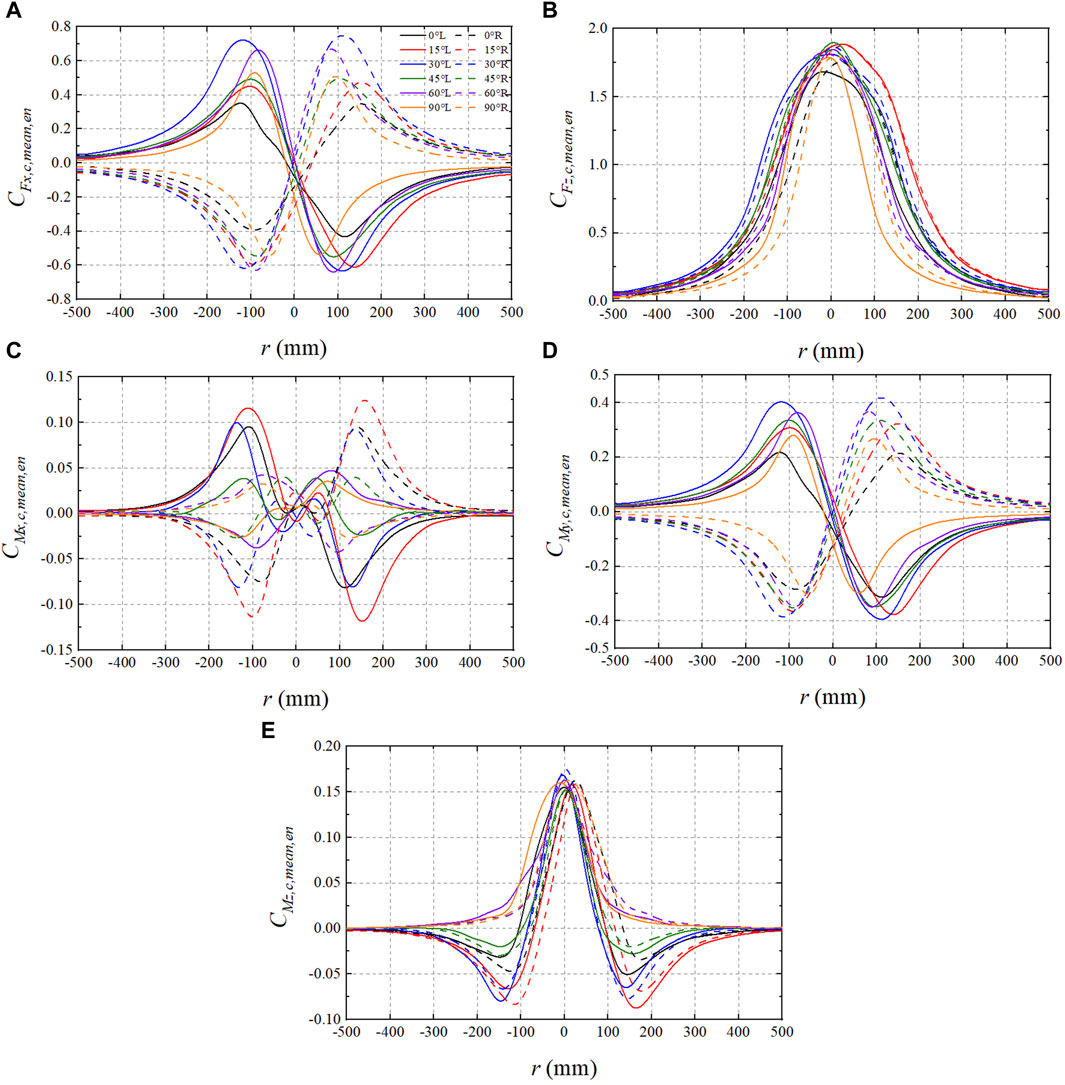
The ensemble time-varying means of the coefficients of lateral force (CFx,c,mean,en), lift force (CFz,c,mean,en), pitching moment (CMx,c,mean,en), rolling moment (CMy,c,mean,en), and yaw moment (CMz,c,mean,en) of the high-speed train car are illustrated in Figure 7. The variation trends of CFx,c,mean,en, CMx,c,mean,en, and CMy,c,mean,en under the L and R directions are opposite at the same value of θ (Figures 7A, C, D) due to the different movement directions of the tornado simulator. CFz,c,mean,en was basically consistent under the L and R directions when θ reached 15°, 30°, 45°, and 60°, and the difference between the CFz,c,mean,en values of the L and R directions was limited when θ reached 0° and 90°. This is because the lift force of the high-speed train car model was mainly caused by the pressure drop of the tornado, and was related to r. The direction of movement of the tornado simulator did not affect the lift force of the high-speed train car model. The maximum values of the force and moment coefficient ensemble time-varying mean of the high-speed train car were almost equal under the L and R directions at each wind angle. The same was true for the minimum values, as shown in Table 2. The absolute values of the minimum and maximum CFx,c,mean,en under the L and R directions were almost the same at each wind angle. Those of CMy,c,mean,en showed a similar trend, as shown in Table 2.

FIGURE 7
www.frontiersin.org

FIGURE 7. (A) CFx,c,mean,en, (B) CFz,c,mean,en, (C) CMx,c,mean,en, (D) CMy,c,mean,en, and (E) CMz,c,mean,en of the high-speed train car model.

TABLE 2
www.frontiersin.org

TABLE 2. The maximum and minimum values of the ensemble time-varying mean of the force and moment coefficients of the high-speed train car model.

When r increased, CFx,c,mean,en first increased and then decreased, as illustrated in Figure 7A. When r=0 mm, the tornado pressure drop did not affect the lateral force of the high-speed train car model. The tangential air flows acting on the two ends of the high-speed train car were opposite in the direction of the XOZ plane, and the intensities on the two ends were observed to be almost equal. The tangential air flows also had no effect on the lateral force. When r increased, the pressure drop and tangential airflow gradually affected the lateral force, and CFx,c,mean,en gradually increased. After CFx,c,mean,en reached the maximum value, it decreased with a further increase in r, which could be attributed to the limited size of the simulated tornado vortex core. When θ reached 0°, the X-axis of the high-speed train car was perpendicular to the center track of the tornado simulator. The pressure drop of the tornado had almost no effect on the lateral force along the movement of the simulator. When θ reached 0°, the absolute maximum and minimum values of CFx,c,mean,en were smaller than those of other θ values, as shown in Table 2. When r increased, CFz,c,mean,en decreased, as shown in Figure 7B, because the impact of the tornado pressure drop on the high-speed train car gradually decreased. When θ reached 90°, the longitudinal axis of the high-speed train car was perpendicular to the movement direction of the tornado simulator. At a wind angle of 90°, the high-speed train car first disengaged from the tornado vortex core, and the impact of the tornado pressure drop on the high-speed train car rapidly decreased. Therefore, CFz,c,mean,en was smaller at a wind angle of 90° than at other wind angles when r100 mm, as shown in Figure 7B. The variation in CMx,c,mean,en at wind angles of 0°, 15°, and 30° was different from that at other wind angles, as shown in Figure 7C. This indicates that the wind angle affects the pitching moment. CMy,c,mean,en displays similar variation trends to CFx,c,mean,en at the same wind angle, indicating that the rolling moment is mainly generated by lateral force. The variation trend of CMz,c,mean,en at wind angles of 60°and 90° was different from that at other wind angles, as shown in Figure 7E, indicating that the yaw moment was affected by the wind angle. The maximum value of the ensemble time-varying mean of the force and moment coefficient of the high-speed train car varied with the wind angle, and so did the minimum value, as shown in Table 2.

The ensemble time-varying variance of the coefficients of lateral force (CFx,c,var,en), lift force (CFz,c,var,en), pitching moment (CMx,c,var,en), rolling moment (CMy,c,var,en), and yaw moment (CMz,c,var,en) of the high-speed train car was then studied, as shown in Figure 8. The ensemble time-varying variance of the force and moment coefficients of the high-speed train car model in the region of r200 mm was observed to be greater than that in the region of r>200 mm, because Ustd and Pstd are greater in the radial position range of 0–200 mm. When r>200 mm, the difference between the ensemble time-varying variance of the force and moment coefficients at all the wind angles was observed to be limited.

FIGURE 8
www.frontiersin.org

FIGURE 8. (A) CFx,c,var,en, (B) CFz,c,var,en, (C) CMx,c,var,en, (D) CMy,c,var,en, and (E) CMz,c,var,en of the high-speed train car model.

4 Aerodynamic characteristics of the high-speed train head

A representative sample of CFx,h at a wind angle of 0° in the L direction was decomposed using CEEMDAN, as shown in Figures 9A–M. As the order of the IMF increased, the oscillation information it contained decreased. Based on the method presented in Section 2.4, IMF1 to IMF8 are a time-varying fluctuating items, and their sum is a time-varying fluctuating component, as shown in Figure 9N. IMF9 to IMF11 and the residue are time-varying mean items, and their sum is a time-varying mean, as shown in Figure 9O. The time-varying fluctuating component can be considered as stationary. The time-varying mean reflected the evolutionary process of CFx,h with the movement of the tornado simulator, as shown in Figure 9P. A total of 10 tests were conducted on the high-speed train head under each condition presented in Section 2.3. Each sample obtained a time-varying mean, subsequently revealing the ensemble time-varying mean. Figure 10 shows the time-varying mean and the ensemble time-varying mean of the force and moment coefficients of the 10 samples. There was only a slight difference observed between the time-varying means of the samples, as shown in Figures 10A, C, E, G, I, K, which was the same as the result for the high-speed train car. The difference between the error lines and the ensemble time-varying mean was also small, as shown in Figures 10B, D, F, H, J, L, which was also similar to the result for the high-speed train car. The ensemble time-varying mean also reflected the evolutionary process of the high-speed train head.
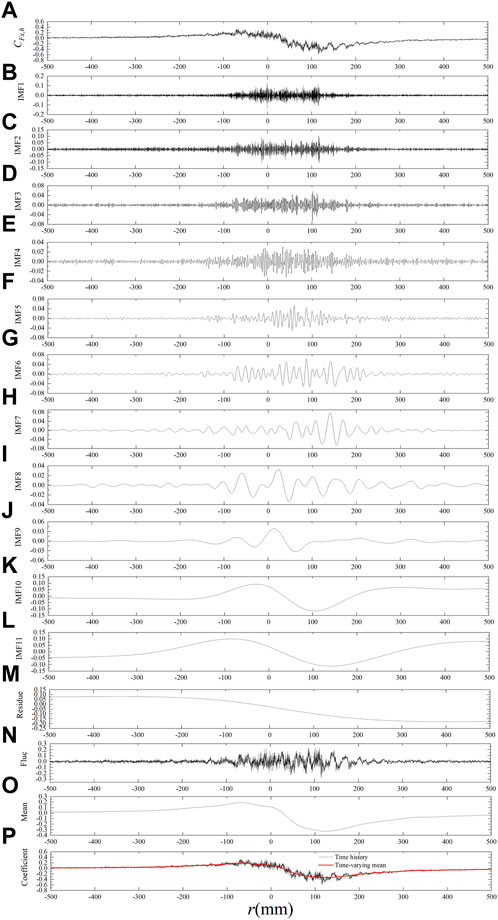
FIGURE 9
www.frontiersin.org

FIGURE 9. (A) A representative sample of CFx,h, (B–L) all the IMFs of CFx,h sample, (M) residue of CFx,h sample, (N) time-varying fluctuating component of CFx,h sample, (O) time-varying mean of CFx,h sample, and (P) comparison between CFx,h sample and time-varying mean of CFx,h sample.
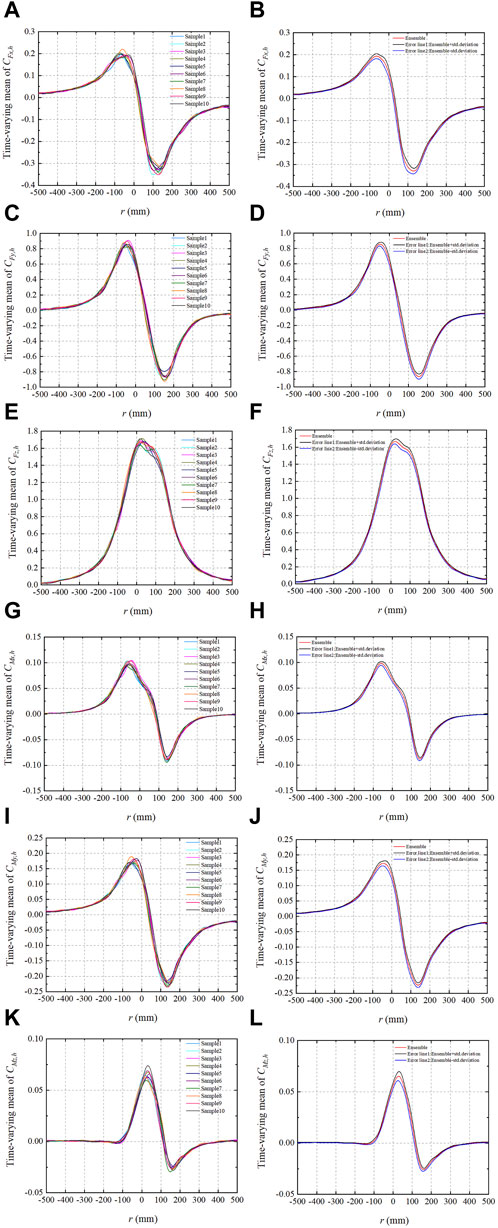
FIGURE 10
www.frontiersin.org

FIGURE 10. Sample time-varying mean of (A) CFx,h, (C) CFy,h, (E) CFz,h, (G) CMx,h, (I) CMy,h, and (K) CMz,h; Ensemble time-varying mean and error line of (B) CFx,h, (D) CFy,h, (F) CFz,h, (H) CMx,h, (J) CMy,h, and (L) CMz,h.

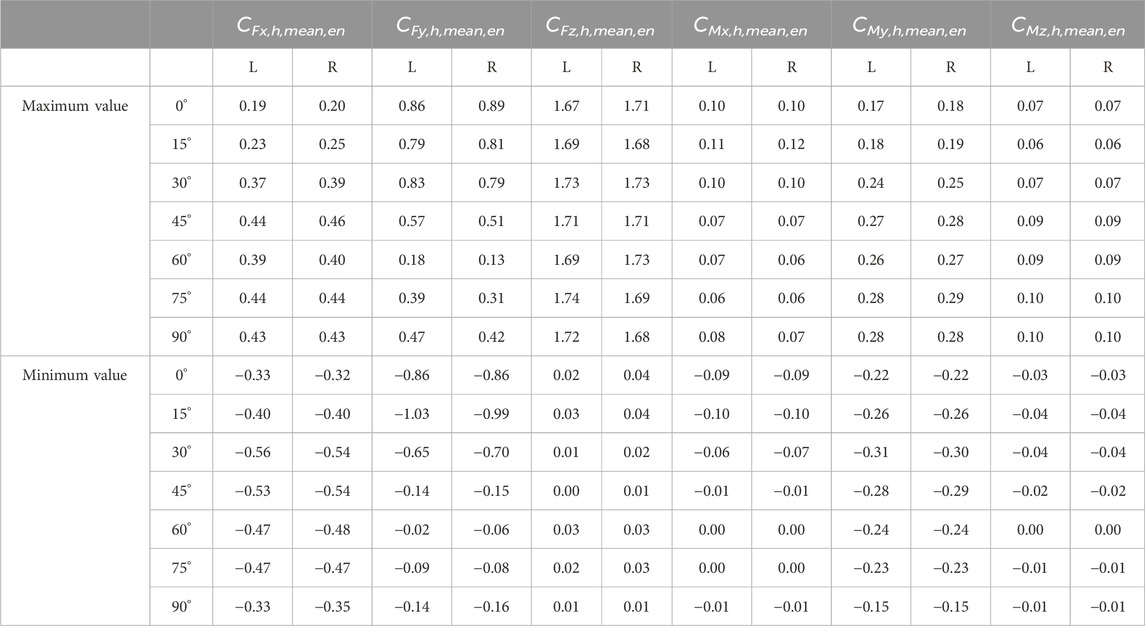
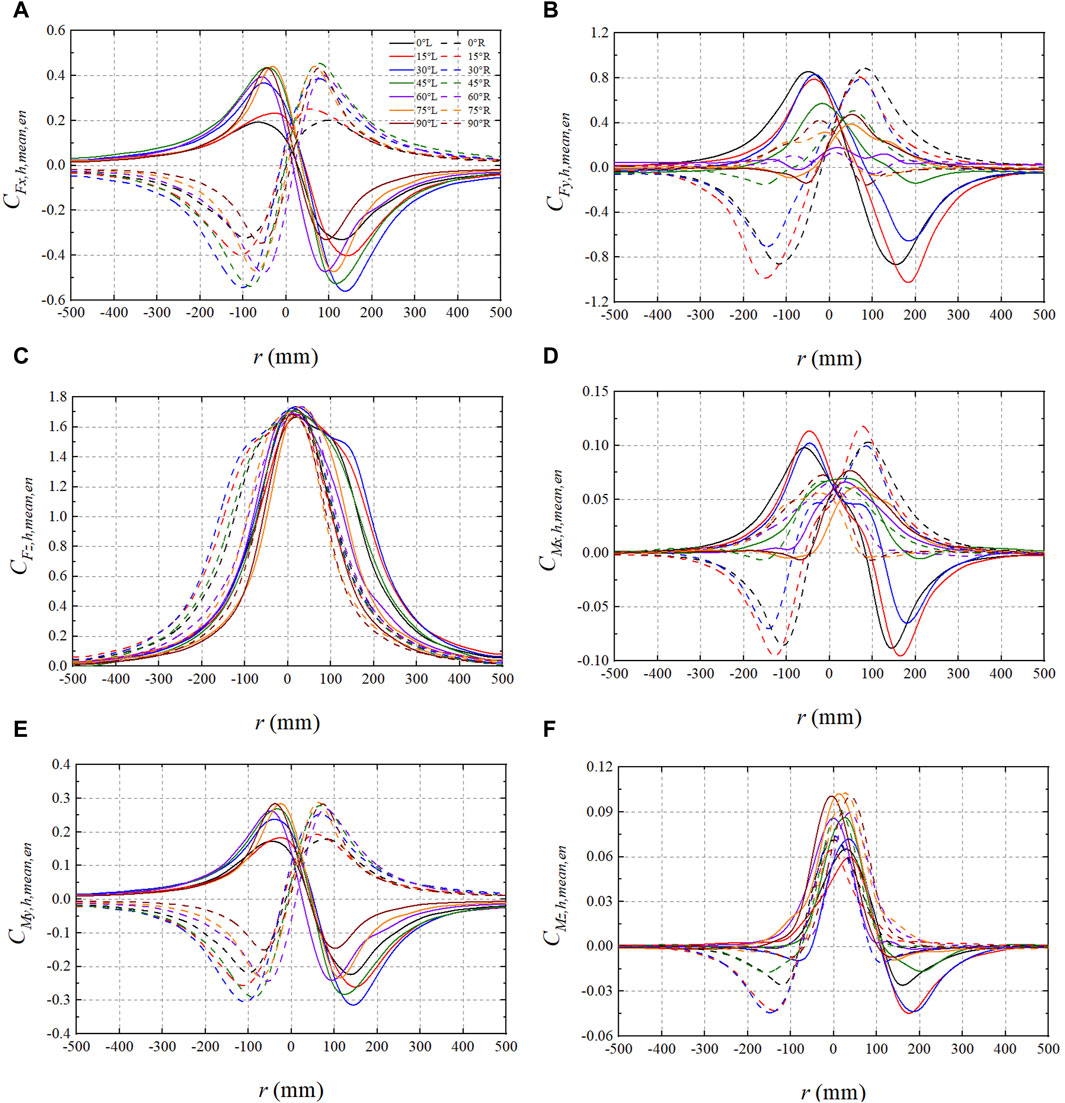
The ensemble time-varying mean of the coefficients of the lateral force (CFx,h,mean,en), drag force (CFy,h,mean,en), lift force (CFz,h,mean,en), pitching moment (CMx,h,mean,en), rolling moment (CMy,h,mean,en), and yaw moment (CMz,h,mean,en) of the high-speed train head were then studied, as shown in Figure 11. The variation trends of CFx,h,mean,en and CMy,h,mean,en under the L and R directions for the same θ value were opposite, as shown in Figures 11A, E, and CMx,h,mean,en did not have this phenomenon when θ is greater than 30°, shown in Figure 11D, which is unlike CMx,c,mean,en. The direction of movement of the tornado simulator appeared to have a greater impact on the ensemble time-varying mean of the high-speed train head compared to that of the high-speed train car. The maximum values of the force and moment coefficient ensemble time-varying mean of the high-speed train head were almost equal under the L and R directions at each wind angle, which was also the case for the minimum value, as shown in Table 3.

FIGURE 11
www.frontiersin.org

FIGURE 11. (A) CFx,h,mean,en, (B) CFy,h,mean,en, (C) CFz,h,mean,en, (D) CMx,h,mean,en, (E) CMy,h,mean,en, and (F) CMz,h,mean,en of the high-speed train head model.

TABLE 3
www.frontiersin.org

TABLE 3. The maximum and minimum values of the ensemble time-varying mean of the force and moment coefficients of the high-speed train head model.

When r increased, CFx,h,mean,en first increased and then decreased, as shown in Figure 11A, which was similar to the high-speed train car. The variation trend of CFy,h,mean,en for values of θ below 60° was different than that for θ equal to or greater than 60° (Figure 11B), and this phenomenon indicates that wind angle affected the variation in drag force of the high-speed train head. When θ was less than 60°, the descent gradients of CFz,h,mean,en at the regions of r=0150 mm and r=1500 mm were not identical. However, this was not the case for CFz,c,mean,en, as shown in Figure 11C. Therefore, CFz,h,mean,en did not display symmetry along the longitudinal axis when the wind angle was less than 60°. This indicates that the wind angle affects the lift force of the high-speed train head. The pitching moment was mainly generated by the non-uniformity of the lift force along the XOZ plane. CMx,h,mean,en deviated from 0 at r=0 mm under all the wind angles because the high-speed train head model was asymmetrical along the XOZ plane, and thereby the lift force along the XOZ plane was non-uniform. However, CMx,c,mean,en was approximately 0 at r=0 mm under all the wind angles. The variation trend of CMx,h,mean,en when θ was less than 45° was different from that for θ equal to or greater than 45°, as shown in Figure 11D. The variation trend of CMy,h,mean,en was similar to that of CFx,h,mean,en, which is consistent with that of the high-speed train car model, as shown in Figures 11A, E. This indicates that the rolling moment was caused by the lateral force. The variation trend of CMz,h,mean,en for θ greater than or equal to 60° differed from that for θ less than 60°, as shown in Figure 11F. The maximum value of the ensemble time-varying mean of the force and moment coefficient of the high-speed train head varied with the wind angle, and the same was true for the minimum value, as shown in Table 3.

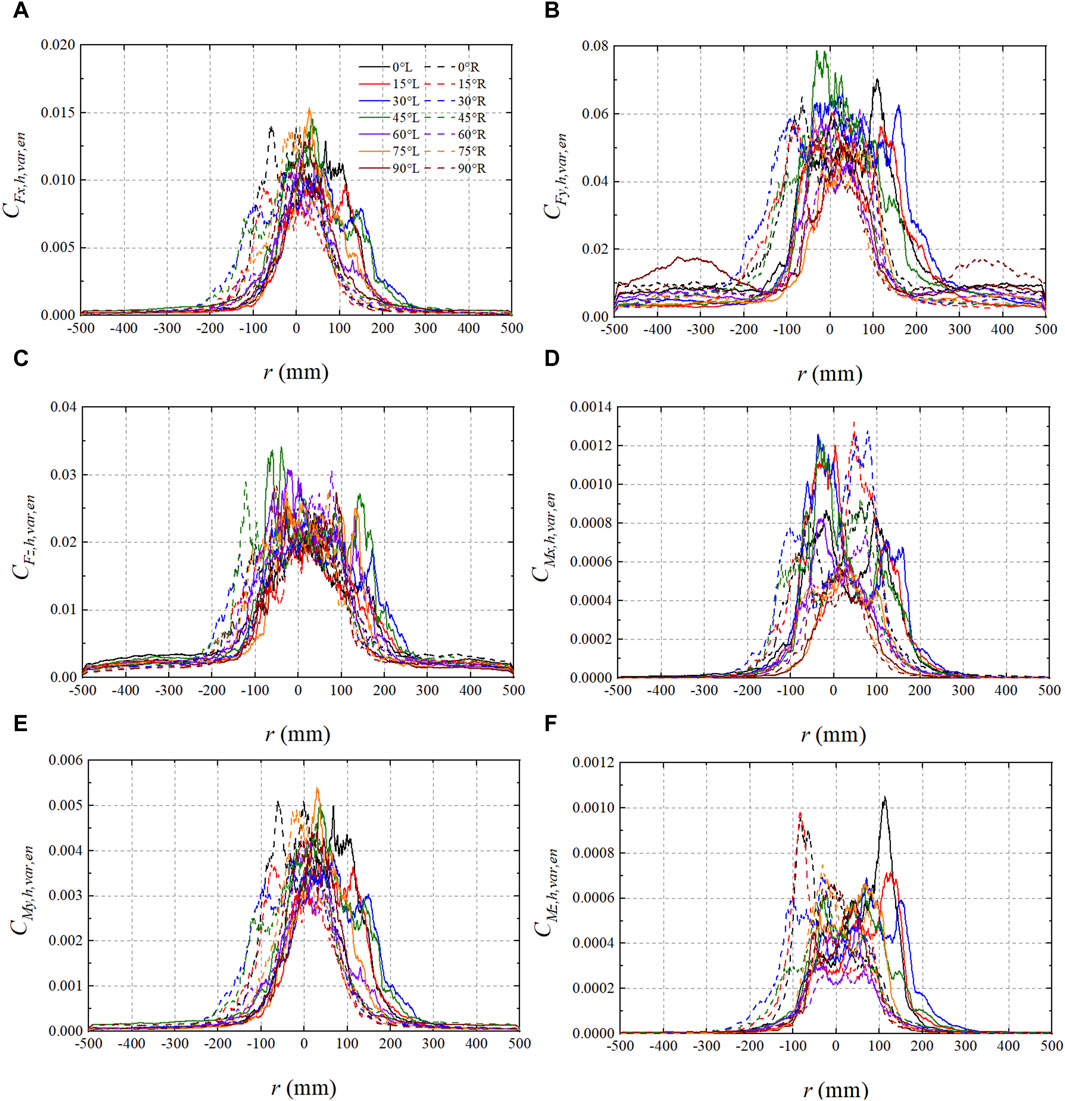
The ensemble time-varying variance of the coefficients of the lateral force (CFx,h,var,en), drag force (CFy,h,var,en), lift force (CFz,h,var,en), pitching moment (CMx,h,var,en), rolling moment (CMy,h,var,en), and yaw moment (CMz,h,var,en) of the high-speed train head was then studied, as shown in Figure 12. The ensemble time-varying variance of the force and moment coefficients of the high-speed train head model in the region of r200 mm was greater than that in the region of r>200 mm. When r>200 mm, the difference between the ensemble time-varying variance of the force and moment coefficients at all the wind angles was also limited, which was similar to the behavior observed in the high-speed train car model.

FIGURE 12
www.frontiersin.org

FIGURE 12. (A) CFx,h,var,en, (B) CFy,h,var,en, (C) CFz,h,var,en, (D) CMx,h,var,en, (E) CMy,h,var,en, and (F) CMz,h,var,en of the high-speed train head model.

5 Conclusion

In this study, a six-dimensional force/torque sensor force test was conducted to investigate the effects of wind angles on the aerodynamic characteristics of high-speed trains under translating simulated tornadoes. The tornado simulator at Beijing Jiaotong University was used for this investigation. The aerodynamic force and moment coefficient time histories of our high-speed train model exhibited non-stationary characteristics. The CEEMDAN method was used to extract the time-varying mean of the force and moment-time history of the high-speed train. The time-varying mean captured the evolutionary process of the force and moment time history with the movement of the tornado simulator. The difference between the time-varying means of the samples was small, and therefore the ensemble time-varying mean was used in the analysis. The direction of movement of the tornado simulator demonstrated a greater impact on the ensemble time-varying mean of the high-speed train head compared to that of the high-speed train car. The wind angles did not affect the variation trend of CFx,c,mean,en,CFz,c,mean,en, and CMy,c,mean,en, and they also did not affect the variation trend of CFx,h,mean,en, CFz,h,mean,en and CMy,h,mean,en. When θ was less than 60°, the descent gradients of CFz,h,mean,en at the regions of r=0150 mm and r=1500 mm were dissimilar, distinguishing them from CFz,c,mean,en. The variation trend of CMx,h,mean,en and CMx,c,mean,en when θ was less than 45° and 60° is different from that of other wind angles, respectively. The variation trend of CMz,c,mean,en , CMz,h,mean,en, and CFy,h,mean,en when θ is smaller than 60° was different from that of other wind angles. The ensemble time-varying variance of the force and moment coefficient of the high-speed train in the region of r200 mm exceeded that in the region of r>200 mm. The maximum value and minimum value of the ensemble time-varying mean of the force and moment coefficient of the high-speed train model varied with the wind angle.

Data availability statement

The raw data supporting the conclusions of this article will be made available by the authors, without undue reservation.

Author contributions

ML: Conceptualization, Funding acquisition, Methodology, Writing–original draft, Writing–review and editing. JG: Supervision, Validation, Writing–review and editing. YZ: Methodology, Software, Writing–review and editing. YW: Data curation, Supervision, Writing–review and editing. BC: Data curation, Methodology, Writing–review and editing.

Funding

The author(s) declare financial support was received for the research, authorship, and/or publication of this article. This research was funded by the National Natural Science Foundation of China (NSFC), Grant No.51720105005.

Conflict of interest

The authors declare that the research was conducted in the absence of any commercial or financial relationships that could be construed as a potential conflict of interest.

Publisher’s note

All claims expressed in this article are solely those of the authors and do not necessarily represent those of their affiliated organizations, or those of the publisher, the editors and the reviewers. Any product that may be evaluated in this article, or claim that may be made by its manufacturer, is not guaranteed or endorsed by the publisher.

References

1. Zou S, He X. Effect of tornado near-ground winds on aerodynamic characteristics of the high-speed railway viaduct. Eng Struct (2023) 275:115189. doi:10.1016/j.engstruct.2022.115189

CrossRef Full Text | Google Scholar

2. Kikitsu H, Sarkar PP. Building damage, wind speed estimation, and post disaster recovery in an Ef5 tornado. Nat Hazards Rev (2015) 16(2). doi:10.1061/(ASCE)NH.1527-6996.0000156

CrossRef Full Text | Google Scholar

3. Chmielewski T, Nowak H, Walkowiak K. Tornado in Poland of august 15, 2008: results of post-disaster investigation. J Wind Eng Ind Aerodynamics (2013) 118:54–60. doi:10.1016/j.jweia.2013.04.007

CrossRef Full Text | Google Scholar

4. Kato W, Hono Y. Research on the use of weather radar in train operation control. JR East Tech Rev (2009) 14:55–60.

Google Scholar

5. Wang J, Cao S, Pang W, Cao J, Zhao L. Wind-load characteristics of a cooling tower exposed to a translating tornado-like vortex. J Wind Eng Ind Aerodynamics (2016) 158:26–36. doi:10.1016/j.jweia.2016.09.008

CrossRef Full Text | Google Scholar

6. Feng C, Chen X. Characterization of translating tornado-induced pressures and responses of a low-rise building frame based on measurement data. Eng Struct (2018) 174:495–508. doi:10.1016/j.engstruct.2018.07.082

CrossRef Full Text | Google Scholar

7. Yuan F, Yan G, Honerkamp R, Isaac KM, Zhao M, Mao X. Numerical simulation of laboratory tornado simulator that can produce translating tornado-like wind flow. J Wind Eng Ind Aerodynamics (2019) 190:200–17. doi:10.1016/j.jweia.2019.05.001

CrossRef Full Text | Google Scholar

8. Li T, Yan G, Feng R, Mao X. Investigation of the flow structure of single- and dual-celled tornadoes and their wind effects on a dome structure. Eng Struct (2020) 209:109999. doi:10.1016/j.engstruct.2019.109999

CrossRef Full Text | Google Scholar

9. Suzuki M, Okura N. Study of aerodynamic forces acting on a train using a tornado simulator. Mech Eng Lett (2016) 2:16-00505. doi:10.1299/mel.16-00505

CrossRef Full Text | Google Scholar

10. Xu R, Wu F, Zhong M, Li X, Ding J. Numerical investigation on the aerodynamics and dynamics of a high-speed train passing through a tornado-like vortex. J Fluid Struct (2020) 96(7):103042. doi:10.1016/j.jfluidstructs.2020.103042

CrossRef Full Text | Google Scholar

11. Huang G, Su Y, Kareem A, Liao H. Time-frequency analysis of nonstationary process based on multivariate empirical mode decomposition. J Eng Mech-asce (2016) 142(1):1442. doi:10.1061/(asce)em.1943-7889.0000975

CrossRef Full Text | Google Scholar

12. Su Y, Huang G, Xu Y-l. Derivation of time-varying mean for non-stationary downburst winds. J Wind Eng Ind Aerodynamics (2015) 141:39–48. doi:10.1016/j.jweia.2015.02.008

CrossRef Full Text | Google Scholar

13. Torres ME, Colominas MA, Schlotthauer G, Flandrin P. A complete ensemble empirical mode decomposition with adaptive noise. In: IEEE International Conference on Acoustics, Speech and Signal Processing. Prague: ICASSP (2011).

CrossRef Full Text | Google Scholar

14. Huang NE, Shen Z, Long SR, Wu MC, Shih HH, Zheng Q, et al. The empirical mode decomposition and the hilbert spectrum for nonlinear and non-stationary time series analysis. Proc Math Phys Eng Sci (1998) 454:903–95. 1971. doi:10.1098/rspa.1998.0193

CrossRef Full Text | Google Scholar

15. Wu Z, Huang NE. Ensemble empirical mode decomposition: a noise-assisted data analysis method. Adv Adaptive Data Anal (2009) 1(01):1–41. doi:10.1142/s1793536909000047

CrossRef Full Text | Google Scholar

16. Wang L, Kareem A. Modeling of non-stationary winds in gust fronts. In: Proceedings of the Ninth ASCE Joint Specialty Conferenceon Probabilistic Mechanics and Structural Reliability (2004).

Google Scholar

17. Priestley MB. Evolutionary spectra and non-stationary processes. J R Stat Soc Ser B (Methodological) (1965) 27(2):204–29. doi:10.1111/j.2517-6161.1965.tb01488.x

CrossRef Full Text | Google Scholar

18. Flh , Sarkar PP, Gallus WA. Design, construction and performance of a large tornado simulator for wind engineering applications. Eng Struct (2008) 30:1146–59. doi:10.1016/j.engstruct.2007.07.010

CrossRef Full Text | Google Scholar

19. Razavi A, Zhang W, Sarkar PP. Effects of ground roughness on near-surface flow field of a tornado-like vortex. Exp Fluids (2018) 59(11):170. doi:10.1007/s00348-018-2625-x

CrossRef Full Text | Google Scholar

20. Ward NB. The exploration of certain features of tornado dynamics using a laboratory model. J Atmos Sci (1972) 29(6):1194–204. doi:10.1175/1520-0469(1972)029<1194:teocfo>2.0.co;2

CrossRef Full Text | Google Scholar

21. Lee WC, Wurman J. Diagnosed three-dimensional axisymmetric structure of the Mulhall tornado on 3 may 1999. J Atmos Sci (2005) 62(7):2373–93. doi:10.1175/jas3489.1

CrossRef Full Text | Google Scholar

22. Karstens CD, Samaras TM, Lee BD, Finley CA. Near-ground pressure and wind measurements in tornadoes. Mon Weather Rev (2010) 138:2570–88. doi:10.1175/2010mwr3201.1

CrossRef Full Text | Google Scholar

23. Flandrin P, Rilling G, Goncalves P. Empirical mode decomposition as a filter bank. IEEE Signal Proc Let (2004) 11:112–4. doi:10.1109/lsp.2003.821662

CrossRef Full Text | Google Scholar

24. Zhaohua W, Norden EH. A study of the characteristics of white noise using the empirical mode decomposition method. P ROY SOC A-MATH PHY (2004) 460(2046):1597–611. doi:10.1098/rspa.2003.1221

CrossRef Full Text | Google Scholar

Keywords: high-speed train, translating simulated tornado, non-stationary time history, force test, aerodynamic characteristics, wind angle

Citation: Li M, Gan J, Zhang Y, Wu Y and Chai B (2024) Study of the effect of wind angles on the aerodynamic characteristics of high-speed trains subjected to a translating simulated tornado. Front. Phys. 12:1320327. doi: 10.3389/fphy.2024.1320327

Received: 12 October 2023; Accepted: 13 February 2024;
Published: 06 March 2024.

Edited by:

Yanlin Guo, Colorado State University, United States

Reviewed by:

Miguel Angel Astiz, Polytechnic University of Madrid, Spain
Jie Zhang, Central South University, China

Copyright © 2024 Li, Gan, Zhang, Wu and Chai. This is an open-access article distributed under the terms of the Creative Commons Attribution License (CC BY). The use, distribution or reproduction in other forums is permitted, provided the original author(s) and the copyright owner(s) are credited and that the original publication in this journal is cited, in accordance with accepted academic practice. No use, distribution or reproduction is permitted which does not comply with these terms.

*Correspondence: Mu Li, limu26@126.com

Disclaimer: All claims expressed in this article are solely those of the authors and do not necessarily represent those of their affiliated organizations, or those of the publisher, the editors and the reviewers. Any product that may be evaluated in this article or claim that may be made by its manufacturer is not guaranteed or endorsed by the publisher.